Abstract
The paper investigates the relationship between companies and their investors in the capital market as part of relationship marketing. It focuses on investors’ preference for a certain capital budgeting policy employed by listed companies. By using statistical analysis, we study whether investors’ reactions can be linked to different patterns of capital budgeting decisions. Our database includes a high number of countries, both developed and emerging, which leads us to focus our analysis on the differences that might occur in investors’ preferences due to specific traits of these markets. Additionally, we include a comparison between investors’ preferences and the information given by the accounting-based performance recorded both in the year of the investment policy and in the next fiscal year. Thus, we observe the extent and limits of the investors’ preference for an active capital budgeting decision, as well as the investors’ rationality around financial crisis.
1. Introduction
The present paper integrates into relationship marketing using a less studied perspective, that of marketing specific to capital markets. This approach is even more important presently because of the entrance of the world economy into a crisis period generated by the COVID-19 pandemic. Previous crisis periods, marked by significant increases of the perceived risk, exhibited dramatic shifts in investors’ preferences, with obvious consequences for share prices and enterprise values.
The aim of the study is to analyze how capital budgeting strategy of the issuers influence investors’ decisions. The choice of the period used to conduct the study is not meaningless. We focused on the period right before and after the start of the last financial crisis (which started in 2008) because crisis periods are of the utmost importance in studying investors’ behavior.
The year 2020 was marked by an increase in the uncertainty perceived in the global financial system. National crises, such as the one that occurred in 2018–2019 in Venezuela, and also the recent economic crisis generated by the COVID-19 pandemic, point towards a possible beginning of a new turbulent period for international financial markets. After the last dramatic experience offered by the global financial crisis that started in 2008, professionals and practitioners in capital markets are anxious about the possible outcome of such a change in investors’ perception that can be hard to anticipate, especially in modern international economics defined by a high degree of integration of national capital markets.
We bring our contribution to disentangling the complexity of the investment decision in an unstable economic environment by making an empirical analysis of how capital budgeting decisions of the issuers influenced investors’ perceptions during the 2008 financial crisis. The paper also tackles investors’ irrationality problem that was commonly linked to the occurrence and evolution of the financial crisis that started in 2008. It is also a main attribute of investors and our conclusions can bring an important contribution to the literature dedicated to the study of investors’ behavior in their capacity of customers in the capital market.
Though the circumstances for the present crisis generated by the COVID-19 pandemics may be different, due especially to the public authorities’ strategy to tackle the financial crisis, the success of capital budgeting policy is significantly linked to the intensity of capital budgeting in the previous periods and to the market response presently. Investors are expected to consider those factors in their decisions, which makes the experience of the previous crisis periods valuable for understanding investors’ behavior.
The link between capital budgeting and stock prices is very complex, especially in unstable periods. The fundamentals behind it are related to the observation that the basis of a financial instrument valuation is the present value of future cash flows. As observed in [1], future cash flows are based on the present ability of a company to generate them using its fixed assets, but also on its capital budgeting decisions that expand the production basis and, by this means, the future results. From an empirical point of view, this conclusion is supported by [2,3,4], among others, who emphasized a positive effect of capital budgeting policy on stock prices through experiments reflecting its positive correlation with the Tobin’s Q ratio and negative effect on the cost of capital. Under particular conditions, some specific temporary influences have also been put into evidence in the literature. For instance, in a study that aimed to understand the effect of direct investment announcements of issuers on the stock prices recorded in the following couple of days, Woolridge and Snow [5] identified three possible mechanisms. The shareholder value maximization hypothesis is coherent with the fundamental principle explained above and is observable through a positive evolution in stock price. Two other mechanisms are, however, possible on a short run. The rational expectations hypothesis is the first one. According to that hypothesis, the market would have anticipated the direct investment plans and already included them in the price formation mechanism; therefore no price variation would be observable after the announcement. The second one, named the institutional investors hypothesis, starts from the premise that institutional investors are more concerned with the short-term performance of the issuers because of their short investment horizon, and therefore would penalize issuers undertaking strategic investment projects. In this last case, a decrease in the stock price may be expected subsequent to an investment announcement. Newer developments consider investment efficiency a channel to influence stock prices [6], but also managerial ability, which in particular contexts of investment inefficiency may contribute to a higher stock crash risk [7]. There is also a stream of literature concerned with possible influences of investors’ behavior on capital budgeting decisions. It has the implicit assumption of capital investment decisions being considered in the stock appraisal mechanism. According to [8], the hurdle rate of the investment projects can be altered if short-term stock price objectives are pursued in priority, which can lead to over—or underinvestment. The idea is developed in [9] and introduces a catering theory regarding the capital investment decisions and more recently in [10], which considers an indirect channel of transmission of relevant economic environment information throughout stock prices, hence motivating managerial departure from the fundamental optimal investment rate.
The main symptom of the financial crisis observable in the capital market was a sharp and generalized drop in share prices determined by the sudden mistrust of investors. Of course, it was associated with important difficulties for investors to adapt their decision to the new paradigm. Akerlof and Shiller [11] provided a good theory on the investors’ sentiment and propagation of the financial crisis, also offering a solid basis for a study of the investors’ rationality during the financial crisis. Our scope is to focus on a particular element with possible influence on investors’ decisions, namely the capital budgeting decisions of the issuers. The focus on a particular theme offers the privilege for analysts to conduct a more detailed study and to obtain more refined conclusions that can be very useful in understanding the financial crisis as a whole. In the present paper, we analyze investors’ preferences concerning companies’ capital budgeting choices in unstable periods and extract conclusions both regarding investors’ expectations and possible implications of capital budgeting decisions in terms of market return of the shares and regarding the extent and limits of investors’ rationality in turbulent periods.
To this purpose, the paper first studies investors’ preference for a certain type of capital budgeting behavior manifested by the issuer before, during, and after the start of the financial crisis in different economic contexts. Therefore, we use a method for distinguishing between companies with an aggressive investment policy and those with a prudent capital budgeting strategy in order to analyze investors’ preference for a certain type of capital budgeting policy from the issuer. The main macroeconomic features considered to probably induce differences in investors’ behavior are the type of financial system and the degree of development of the national economy. By introducing criteria related to assessing corporate performance in book terms, we were able to also extract information on investors’ rationality in the period right before and after the start of the global financial crisis. The conclusions may also be valuable for expanding the knowledge on the mechanisms behind investment decisions on the capital market in turbulent periods.
The remainder of the study includes a brief review of the relevant literature on the financial crisis and investors’ behavior, a section describing the database and methodology, the presentation of the results and their importance for understanding the evolution of the capital markets during crises, and a section that concludes the study and offers further research directions.
2. Materials and Methods
A lot of research work has been done on the changes in investors’ behavior during financial crises. Akerlof and Shiller drew attention to the manifestation of animal spirits in the pre-crisis and crisis periods [11]. They explained that animal spirits tend to enhance the trend of economic growth, determining the deviation of macroeconomic indicators from their predicted values. They reported overconfident behavior in the pre-crisis period, associated with an overvaluation of financial assets. On the contrary, for the crisis period, the authors documented a lack of trust in the financial market, corresponding to a spectacular flight-to-quality behavior. Investors seem to lose confidence and seek less risky investments. This attitude leads to an underestimation of the financial assets’ value, which, in severe cases, correlates to systemic disequilibria, leading to aggressive inflation, high unemployment rates, and drastic decreases in private expenditures.
The effect of sentiment on trading behavior was analyzed, among others, in [12]. The sentiment is considered to determine fluctuations of risk tolerance and/or too pessimistic or too optimistic cash-flow predictions. Thus, it is expected to have an impact on asset prices different from that determined by fundamental factors. The authors demonstrated that feedback trading is more important when investors are optimistic and especially in bull markets. On the contrary, an inverse reaction is more pronounced when they become pessimistic. A similar analysis was performed in [13]. The impact of investors’ sentiment on liquidity and trading behavior around the global financial crisis was studied and an asymmetric impact was found. This translates into a more pronounced decrease in liquidity during periods of crisis than the increase observed in periods of exuberance.
The same behavior was also put into evidence in [14]. The study focused on individual investors and brings arguments that during crisis risk tolerance and return expectation decrease, whereas risk perception increases. Perceptions tend to improve once the market return becomes positive. However, the study did not record a trading decrease or a preoccupation of individual investors to reduce the risk of their portfolios.
The conclusions of the previously presented literature highlight the behavioral changes that occur in capital markets during turbulent periods. These changes influence the decision-making process and, thus, are taken into consideration in our analysis of how issuers’ capital budgeting decisions are perceived by investors.
Considering the abovementioned conclusions, one could reasonably consider that risk tolerance and risk perception can be associated, among others, with a certain level of preference for an active investment policy. However, the direction of the relation can be put into question in the sense that the incapacity to make accurate cash-flow predictions would generate an increase in risk perception. In the meantime, the lack of an active investment policy can be perceived as a limitation of the issuer’s investment perspectives, leading to a negative image in the investors’ eyes (see the description of the Microsoft case in [15]). Our study integrates in this stream of reasoning by analyzing how investors responded to different capital budgeting strategies in different years characterized by various degrees of uncertainty. Ref. [16] observed a collapse in the risk appetite and in markets’ liquidity and studied their role in the transmission of the global financial crisis. These findings can be related to the literature on market efficiency. Ref. [17] studied the efficiency of the financial market during financial crises and concluded that the market is inefficient before the crisis. During the crisis the inefficiency worsens due to sentiment trading, which leads to a severe undervaluation of assets. After the crisis, important improvements in market efficiency are exhibited. The same behavior of reduced efficiency before the crisis and its improvement subsequent to the financial crisis was also reported in [18,19], respectively, with the former studying the Romanian capital market and the latter being conducted on the emergent capital markets from Central and Eastern Europe.
Ref. [16] showed that the decreased appetite for risk had a bigger impact on emerging countries than on developed ones. Moreover, within the same type of economy the impact is different, with Europe being more influenced than other developed markets. This leads us to analyze whether different investors’ reactions can be individualized in various groupings of countries.
In the corporate finance domain, the effect of sentiment on different decisions was acknowledged. We mention here [20], which concluded that the decision of new equity issuance, as well as mergers and acquisitions decisions, are influenced by sentiment more than by fundamental indicators. The authors used aggregate price/book value as an estimator of investors’ sentiment. Their results are consistent with the idea that companies make efforts to adjust their capital budgeting policy to investors’ expectations.
Ref. [21], which studied the effect of sentiment on the market price of risk, suggested that irrational optimism generates a decrease in the market price of risk, which is maintained when backed by rational optimism and favorable economic predictions. This finding might be a clue to explain the excessive acceptance of risk in the pre-crisis period and in shaping the investors’ expectations regarding the managerial investment decisions.
This attitude might be explained by psychological arguments such as those developed in [22]. This paper is dedicated to psychological factors that lead to wrong financial decisions and put forward, among others, obedience to authority; conformity bias; incrementalism; over-optimism; over-confidence; self-serving bias; the tangible, close, and nearby term; and the endowment effect. All these psychological phenomena favor investors’ misestimating and predicting difficulties on the one hand, and managerial opportunistic behavior on the other.
There is interdependence between the notions of “investors’ sentiment” and “investors’ rationality”. In the present work, we associate investors’ rationality with their ability to make accurate predictions about the future evolution of the financial asset value based on its fundamental factors of influence. Hence, the price of the financial assets would reflect exclusively the changes in the financial soundness and the perspectives of the issuer. It should not be affected by any non-financial influences. The inference of the investors’ sentiment represents in this context a violation of the investors’ rationality principle.
Sentiment’s influence in the field of corporate finance is also addressed in [23] (p. 330), which explained that “high equity prices put pressure on management to sustain growth levels and gives management more discretion to make poor acquisitions that value the illusion of growth over shareholder value.” We considered the possibility of such behavior and controlled for the accounting-based returns of companies in the year of the analysis, as well as for that observed in the next year when analyzing the level of investors’ rationality.
The study of the literature in the field helped us explain below the methodological choices in terms of variable selection and adequate measuring in accordance with the objective of understanding how issuers’ capital budgeting decisions were considered in the investors’ decision-making process.
According to [20], aggregate price/book value is a predictor of investors’ sentiment. A sharp change in this indicator from one year to another would identify the presence of important shifts in investors’ attitudes not explained by changes in the fundamental factors of influence of the financial asset value.
The price/book value indicator bears influence from a wide range of factors, some of them related to the real activity of the company, others emerging from other phenomena appearing in the process of financial asset price formation. In a simple approach, three categories of factors influencing the price/book value of an issuer can be identified: intrinsic characteristics of the companies, investors’ rationality, and characteristics of the capital markets [24].
The class of factors related to intrinsic characteristics of the issuer includes a wide range of elements, from the quality of the tangible assets to the quality of human resources and managerial team. They determine the capacity of the company to optimize its activity and to secure its perspectives in the long run. In [1] (p. 285), it was noted that “Investors buy shares based on present and future earning power. Two key features determine the profits the firm will be able to produce: first, the earnings that can be generated by the firm’s current tangible and intangible assets and second, the opportunities the firm has to invest in lucrative projects that will increase future earnings.” The investment policy is a key determinant of the price/book value because it represents the vehicle of its future growth. This is the reason for our decision to focus our work on the analysis of investors’ rationality in response to the capital budgeting choices of companies. In order to obtain sound conclusions, we also considered the effect of the accounting-based return of the issuer on the investors’ decision as part of our research design.
On the other side, the price of a financial asset depends on the quantity and quality of the information available about the issuer, on the rules governing the processes of market transactions with shares, on the liquidity of the capital market, on the investors’ degree of financial education, etc. (For a detailed discussion of these issues please refer to [25]). We included these elements in the class named “characteristics of the capital markets”. We accounted for the differences between capital markets’ characteristics by dividing our database into separate classes: developing versus developed markets, market-based financing systems versus banking systems, andOrganization for Economic Cooperation and Development (OECD) members versus non-OECD countries.
The other influences on the price/book value are linked to the incapacity of the investors to correctly predict the future cash flows generated by the financial assets. This basically represents a manifestation of the investors’ irrationality, which we considered in our study. It is important to mention that price/book value, like all other indicators of the market performance of a stock (such as price/earnings ratio, market return, etc.), offers a picture of the combined effect of the three classes of factors.
In our study, based on the previous arguments offered by the specialty literature, we analyzed the conditions in which a company obtains a better market performance compared to the market average, measured through the price/book value indicator. We paid particular attention to the type of investment policy adopted by the company and accounted for the observed accounting-based return of the company. With a simple statistical analysis, we obtained evidence about the preference for investment manifested by the investors before, during, and after the financial crisis. In the meantime, we verified whether the future economic evolution of the company confirms the predictions of the investors and extracted valuable information on the extent and the limits of the investors’ rationality.
Our database included companies from 82 countries and regions for the period 2006–2010. The data was provided by Datastream and included all the companies available on Datastream listed in the most important national equity indices. We refined our database, eliminating the observations with negative or null values for total assets, net sales, long- and short-term debt and market capitalization, and negative values for capital expenditures. In order to avoid capturing the effect of the companies in distress in our analysis in combination with that of the investment policy, we also excluded all the companies with negative common shareholder equity.
As a final filter, we kept in our sample only the companies presenting reliable financial indicators for the years 2006–2010. Being listed in the main national equity index for five years consecutively was proof of the maturity of companies in the sample. Thus, we limited possible bias introduced in our analysis by including young companies that were expected to have an active investment policy due to their phase of life cycle rather than to a strategic investment policy option. In order to ensure the relevance of the indicators computed, we kept in the analysis only those countries with more than 5 observations left in the final database. Hence, we had as a starting point a database containing 5402 companies in 74 countries with financial information recorded for each of the years from 2006 to 2010.
The following countries were considered in our final analysis: Argentina, Australia, Austria, Bahrain, Bangladesh, Belgium, Bosnia-Herzegovina, Botswana, Brazil, Bulgaria, Canada, Chile, China, Cyprus, Czech Republic, Denmark, Egypt, Estonia, Finland, France, Germany, Ghana, Greece, Hong-Kong, Hungary, India, Indonesia, Ireland, Israel, Italy, Ivory Coast, Japan, Jordan, Kazakhstan, Kenya, South Korea, Kuwait, Latvia, Lebanon, Lithuania, Macedonia Republic, Malaysia, Malta, Mauritius, Mexico, Morocco, Netherlands, New Zeeland, Norway, Oman, Pakistan, Palestinian Territory, Peru, Philippines, Poland, Portugal, Romania, Russia, Saudi Arabia, Slovakia, Slovenia, South Africa, Spain, Sri Lanka, Sweden, Switzerland, Thailand, Tunis, Turkey, Ukraine, United Arab Emirates, United Kingdom, United States of America, and Venezuela.
We computed the indicator capital expenditures (% total assets) to characterize the capital budgeting policy of the companies. Capital expenditures represent the money paid by the company to acquire non-current assets. Dividing the indicator by total assets, we controlled for the size effect and ensured the data comparability across companies.
There is a widespread opinion that price/book value (P/Bv) offers an indication about how much investors value the perspectives of a company (see, among others, ref [26]) in efficient markets. In particular, a firm with good growth opportunities should have a bigger P/Bv than its peers. Investment policy is one of the main vehicles for the performance of a company; therefore, one can expect a bigger P/Bv for the companies following an aggressive capital budgeting path, as long as the investments are economically valuable.
In order to analyze investors’ behavior relative to the investment policy adopted by a specific issuer, we divided the observations recorded each year into two classes: companies adopting an aggressive investment policy and companies with a moderate investment policy. To give adequate consideration to the assertion that the investment policy depends on the activity sector, the criterion for including the company within the appropriate class was whether its capital expenditures (as a percentage of total assets) was above or below the average rate computed for the sector each year, regardless of the capital market in which the issuer is listed. Our approach corresponds with the opinion that investment policy is determined mainly by the sector of a company and not in a great measure by its origin country. The fact that the database was designed to include only mature companies and the international openness of most of the countries in the study sustain our point of view. Moreover, to be sure that our method did not create a bias in the analysis between developed and developing countries we computed the percentage of the companies with an investment policy more aggressive than the sector average in the total number of companies in the two groups of countries and obtained similar results (as seen in Appendix A).
Regarding the investors’ expectations, the companies were also divided into two classes based on whether their P/Bv was above the average P/Bv for the national companies included in our database. In order to ensure the relevance of the average, we computed it only for the countries and sectors for which there were at least five records per year. Our option to choose as a threshold for the analysis of the investors’ behavior the average P/Bv of the national capital market was directed by the fact that our sample included developed and developing capital markets where difficulties still persist for investors to have access to the international capital market. Another advantage of using national P/Bv as criterion for dividing companies into classes according to investors’ perception was that it allowed us to separate the effect induced by the financial crisis (expected to be different from one country to another) from that induced by investors’ preferences. Hence, our conclusions should be more accurate.
We chose to conduct our analysis annually, in accordance with the methodology in [27], in order to be able to identify the effect of the financial crisis on investors’ preference for an active capital budgeting policy and ultimately on investors’ rationality. After eliminating the records for which either the information on capital expenditures or the P/Bv was missing, our final database characteristics are depicted in Table 1.

Table 1.
Descriptive statistics.
A brief analysis of the above figures relative to the conclusions presented in the literature review section leads to some interesting observations. First, the average and median values of the national P/Bv registered a sharp decline in 2009, increasing slightly in 2010. According to the hypotheses in [20], this proves the investors’ pessimism and represents a first argument challenging the investors’ rationality assumption. Correspondently, we marked a decrease in the average and median sector capital budgeting levels in 2009. The change in the behavior of companies regarding their investment policy has an intricate explanation. On the one hand, it may correspond to the preoccupation of the issuers to respond to investors’ expectations, which were presumed to be towards a more prudent investment policy, considering their decreasing risk tolerance (as predicted in [20]). On the other hand, it may reflect a shortage of valuable investment opportunities.
In order to understand how much of the investor preferences were driven by rationality, we completed the analysis by examining to what extent their decisions took into account the present accounting-based performances. To this purpose, we considered the return on equity (ROE) and the return on assets (ROA) as measures of the present performance of the company. The return on assets is computed as follows:
We divided the companies into classes according to whether their corresponding accounting-based return was higher than the annual sector average of the same rate of return. Our choice was straightforward due to the expected differences in return among activity sectors. The extent to which the companies preferred by investors accomplished the criteria regarding the type of investment policy and the profitability gives a picture of the interference of irrationality in investors’ decisions.
Based on these classifications, we chose, as a first methodological approach, to present a detailed descriptive statistical analysis of the phenomenon by taking into account different groupings of the countries included in the database. This provided a refined perspective of the results obtained by [27]. Although it is not a very complex econometrical process, it offers the possibility to observe how investors’ preferences on issuers’ capital budgeting policies reflect in the share prices. It allows us to describe the complexities of the link between share prices and capital budgeting decisions. Unlike classical regression tools, it is able to emphasize some nuances of the investors’ decision-making process in different economic and financial system contexts.
The analysis was then completed with conclusions issued by applying the quantile regression methodology to understand the general trend of investors’ preference on capital budgeting decisions for different types of issuers. To do so, a unifactorial model was constructed, where the dependent variable is the excess of the P/Bv of the issuer compared to the national average and the capital expenditures in excess compared to the sector average is the influencing factor.
The use of the quantile regression was motivated by the distribution of the P/Bv variable, given that this approach is not dependent on a normal distribution. In addition, and maybe more importantly, it is based on the practical interest of understanding how sensitive the P/Bv variable is to capital budgeting decisions, especially at its distribution tails. The analysis was conducted by taking into account 20 quantiles, which allowed us to observe the possible changes in investors’ preference even for small P/Bv variations. Given the complex relation between the two concepts and the long list of other factors that influence P/Bv, even a small variation could hide significant changes. From a scientific point of view, it fulfilled the gap in the study of the investors’ preference for capital budgeting for different types of issuers.
This second approach was initially performed for the whole database in order to observe the general trend. Then, similar to the first approach, it was applied to different groups of countries to put into evidence whether there were specific patterns in investors’ behavior in different economic contexts. Thus, the analysis was conducted separately for developed and developing countries and for market-based versus bank-based financial systems.
3. Results
In order to analyze the investors’ preference for an active capital budgeting policy we conducted a statistical analysis of the propensity of the companies for investments and correspondingly of the investors’ reaction measured by the P/Bv. The analysis was conducted for the period right before and after the emergence of the financial crisis. In order to ensure the reliability of our results, we also controlled for the accounting-based performance of the company measured by the return on equity or the return on assets. In addition, in order to consider the potential outcome generated by the investments, the performance measures were considered in the current and subsequent year. This allowed us to verify whether the performance of the company corresponded to investors’ predictions and also provided some insights into the extent of the investors’ rationality in that period. Additionally, we divided our database in two classes based on the different characteristics of the market: developing and developed markets, OECD or non-OECD countries, and market-based systems or banking systems. Thus, we could observe whether investors’ behavior was similar in different markets.
In general terms, investors seemed to have a preference for direct investments realized by the issuers. Table 2 presents the results obtained in the quantile regression analysis for the entire database. The results show that the variable referring to the investment policy of the issuer in comparison to the sector average had statistically significant positive coefficients during the entire period.
Table 2.
Capital budgeting policy impact on P/Bv—quantile regression.
The analysis of the level of the coefficients demonstrates an increase in the investors appetence for an active capital budgeting policy in 2008, probably in search of familiar signals in a capital market marked by the burst of the financial crisis, followed by more prudent behavior in 2009 as an effect of the initial shock of the crisis and a rebound in 2010.
3.1. The Market Preference for Investments
Our first objective was to study whether there were different patterns in the investors’ preference for an active investment policy undertaken by the issuer in different groups of countries. To do so, following the methodology from [27], the database was separated first between developed and developing countries, then according to the countries’ inclusion in OECD, and finally according to the type of national financing system. For each class mentioned, the companies included in the database were divided into two classes—companies with an aggressive capital budgeting policy and with a moderate one. After that, each class was divided according to the price/book value being below or above the average, resulting in four subclasses: A—companies investing actively and with a price/book value above the average, B—companies investing actively but with low price/book value, C—companies with a moderate investment policy and high price/book value, and D—companies with a moderate investment policy and low price/book value. We also compared the levels of the indicators with the median level instead of the average in order to verify the stability of our results, and the stability of our conclusions was confirmed.
The first grouping we considered was developed versus developing countries, according to the World Bank classification [28]. We took this grouping into consideration because the level of economic development might have influenced the market preference for high or low investments. In countries where the investment opportunities are more varied (such as in developing countries), the market might prefer companies that take advantage of those possibilities, thus obtaining higher levels of average capital budgeting. In addition, it might be possible that in developed countries, companies have a longer experience with the capital budgeting process. For that reason, the market might prefer higher capital budgeting as the companies prove their ability in managing them. The results we obtained are presented in Table 3. We reported only the percentage from the comparison with the average levels because the ones from the comparison with the median are similar.
Table 3.
Comparison of the investors’ preference for a certain investment policy of the issuer in developed versus developing countries.
We observed that the differences between the two classes of countries for category A were relatively small and that their evolution was similar to the one determined for the global market put in evidence in [27], thus providing the same conclusion: The markets were signaling a preference for higher levels of investment. This suggests that the country level of economic development did not have a major influence on the results of our analysis. Additionally, we observed that before 2008, the preference for companies with an active investment policy (companies in category A) was higher in developed countries than in developing ones. However, the situation changed in the years 2008 and 2010. The results also show that the emerging economies penalized more companies that were not involved in active capital budgeting in 2006–2007, but exhibited a little more prudence in 2008. The trend continued in 2010, when the developing countries seemed to have more indulgent behavior towards companies that invested less.
In a quantile regression analysis (see Table 4), the P/Bv continued to be positively linked to the active capital budgeting policy of the issuers during the entire period.
Table 4.
Capital budgeting policy impact on P/Bv—quantile regression (developed countries).
Besides the general trend, some observations imposed. In 2007, the investors’ preference for capital budgeting manifested mainly for the companies with lower P/B value, but the factor became unsignificant statistically for companies with high P/Bv. This situation may be explained by the fact that the economy was in a phase of a long risk accumulation period and speculative trading became more important, especially in the range of high P/Bv.
In addition, the results of the symmetry test (see Appendix B, Table A3) showed no statistically significant difference in the coefficients for the years 2006, 2007, and 2010, when the investors’ expectations regarding the capital budgeting behavior of the issuers can be considered uniform. In 2008 and 2009 the difference between the coefficients for companies with low P/Bv and high P/Bv was statistically significant. This means that investors valued more an active capital budgeting policy for issuers with high P/Bv than in the case of companies with low P/Bv. This attitude may be a sign of investors’ overconfidence in an active capital budgeting policy of the issuer, with possible procyclical effects.
In the case of emerging countries, the quantile regression analysis (Table 5) showed the same general positive influence of the capital budgeting of the issuers on the P/Bv. Basically, investors valued more companies that invested more actively based on their future perspectives.
Table 5.
Capital budgeting policy impact on P/Bv—quantile regression (emerging countries).
However, in their case, the symmetry test (see Appendix B, Table A4) did not support any statistically significant difference of the parameters, showing uniform preferences for the capital budgeting policy for high and low P/Bv issuers. This may be a clue to explain why the intensity of the financial crisis was perceived as higher in developed countries than in emerging ones.
The second grouping we took into consideration was OECD countries versus non-OECD countries. This analysis was based on the fact the OECD countries have similar regulations of capital markets and we wanted to see whether the differences between regulations led to any changes in our findings. The results we obtained are presented in Table 6 which is based on the comparison with the average level. As the countries from the OECD are typically developed countries (with the exception of Mexico and Turkey), the results were similar to the ones from the previous grouping. This similarity suggests that the regulatory system has little role to play in explaining the investors’ preference for an aggressive capital budgeting policy.
Table 6.
Comparison of the investors’ preference for a certain investment policy of the issuer in OECD versus non-OECD countries.
The third grouping consisted of the comparison between countries with a well-developed capital market and the ones where the capital market is less developed. We made this distinction based on the market capitalization as percentage in GDP, provided by the World Bank [28]. If the countries had an indicator level higher than the average of the year, we included it in the category with countries with well-developed capital markets. We considered this grouping to be important because it allowed us to see whether the main financing source used by the companies from a certain country influenced the market perception and preference for investment. It is possible that, in countries with less-developed capital markets, companies are more concerned with informing and convincing the banks to give them loans while ignoring their relationship with investors. If that was the case, the capital market might have had a preference for lower investments. The results we obtained are presented in Table 7.
Table 7.
Comparison of investors’ preference for a certain investment policy of the issuer in countries with developed markets versus countries with less-developed capital markets.
The levels for category A are similar to the ones for the global market [27], indicating a signal for similar preferences. However, there was a difference in the evolution of these levels. The global market registered a rising trend in this period, with the exception of 2009 when there was a major decrease. When analyzing the two categories we observed a more volatile evolution in the first three years of the analysis. Whereas the countries with a developed capital market signaled the highest preference for large investments in 2008, the second category of countries showed an increased level of caution from 2007. A possible explanation in this case could be that banks, through their monitoring activity on debtors, can influence investors’ decisions and decrease investors’ sentiment intensity, hence shaping the results. This can be seen more easily in Figure 1.
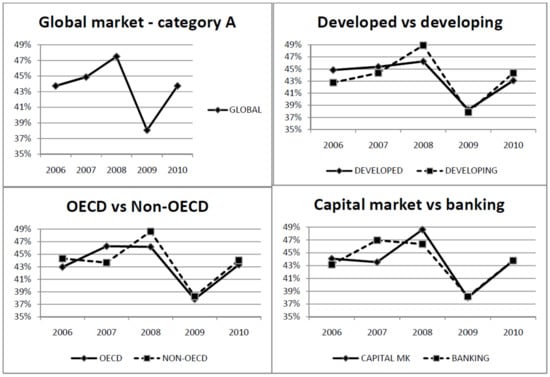
Figure 1.
Evolution of the market preference for high investments.
The analysis was completed with the results of the quantile regression in Table 8 (for countries with capital market-based financial systems) and Table 9 (for countries with bank-based financial systems).
Table 8.
Capital budgeting policy impact on P/Bv—quantile regression (developed capital markets).
Table 9.
Investment policy impact on P/Bv—quantile regression (developed banking systems).
The analysis revealed an interesting pattern in the countries with financial systems based on capital markets. Though the general positive and uniform influence of capital budgeting on the share price was noticed in 2006 and 2010, for the period 2007–2009 we identified, in most cases, an insignificant influence of the capital budgeting policy on the P/Bv of the shares. The exception were most companies with P/Bv above the median in 2008, where a positive influence was generally observed. Additionally, the companies with very high P/Bv from the same year showed a negative influence. The results suggest a troubled investment environment, with investors unable to follow a stable position regarding their preference for the issuers’ investments and a high role of speculative trading during this period.
In bank-based financial systems (Table 9), the investors’ propensity for capital budgeting was maintained during the entire period, mostly with uniform behavior in the entire range of the P/Bv distribution. Exceptions were seen in the first and last 5% of the distribution for the years 2006, 2008, and 2009, where a higher propensity for capital budgeting was suggested for very high values of P/Bv (also supported by the symmetry test results, as seen in Appendix B, Table A6). This behavior may be explained by the monitoring role of the banks in the economy, which in the pre-crisis and crisis periods contributed to increasing trust among investors.
3.2. Investors’ Preference for Active Capital Budgeting Policies and the Rates of Return of the Issuers
Furthermore, we investigated whether investors’ preference for a certain issuer was based on fundamental reasoning. We analyzed the companies’ returns obtained in the year when the investment was made and in the following year, when the impact of the investment might have registered. We compared these levels with the average obtained in their industry sector for that year. If the current return was higher than the average, the management proved that it was capable of handling the company and its assets in a productive way. Thus, it showed a capacity to make new investments that should also be successful. For this reason, the market would be inclined to reward companies with returns higher than the average obtained on the sector and penalize the others. At the same time, the market should take into consideration the new investments’ profitability. If the market’s predictions show that the investment project would be fruitful, the company would become more attractive to investors, thus obtaining a higher P/Bv. If that is not the case, the company would be penalized, leading to a lower P/Bv. In order to consider this phenomenon, we analyzed the return of the company one year after the investment was made. The choice of a one-year lag takes into consideration a reasonable horizon considered by the investors in their decisions, especially in turbulent periods, but also the fact that most investment projects undertaken by private companies tend to produce results in this timeframe. Of course, there are particular projects that may need a longer implementation period, and this may be a limitation of the study, but, as there is no scientifically based average period for the implementation of corporate investment projects, we chose the one-year period in our analysis.
Based on these considerations, we divided the companies from each category (A, B, C, and D) into four groups based on their returns: companies with an above-average level for the current return and for the return obtained in the following year (“Above-Above”), companies with an above-average level for the current return, but the return obtained in the following year was below average (“Above-Below”), companies with a below-average level for the current return and an above-average return obtained in the following year (“Below-Above”), and companies with a below-average level of the current return and for the return obtained in the following year (“Below-Below”). Ref. [27] performed this analysis by splitting the categories into two subgroups: “Above” consisted of companies with an above-average return in both years, whereas the rest were included in “Below.” However, we considered that the situation of the companies from the second groups was not necessarily similar, so we decided to split the sample into four groups.
We determined the percentage of each group from the total number of each category (A, B, C, or D), taking into consideration, consecutively, two indicators as rates of return: return on equity (ROE) and return on invested capital (ROA). The results we obtained are presented in Table 10 for ROE and Table 11 for ROA.
Table 10.
Percentage of companies in each class based on ROE—above and below the sector average.
Table 11.
Percentage of companies in each class based on ROA—above and below the sector average.
We observed that in category A (companies with an aggressive investment policy and a high P/Bv) more than half of the companies had rates of return in both years that were higher than the sector average. The result was similar for all the analyzed years. Thus, for these companies, the market reacted rationally by rewarding companies that proved to manage their assets successfully.
Additionally, some companies with an aggressive investment policy were rewarded with high P/Bv even though they had low returns either in the year of the investment or in the following year. This situation might be explicable in certain cases. For example, investors interested in a company for a limited period of time (less than one year) would choose firms with high returns in the current year and not be interested in the returns from the following year. Similarly, a long-term interest in a company could make an investor less concerned with a low return in the current year if that company had good perspectives, as is the case of firms with active investment policies and future high returns.
However, the percentage of companies from category A that registered returns below the average in both years was relatively high, which created doubt concerning the investors’ ability to predict the evolution of the companies on a short run. Of course, a small part of these companies may have developed complex investment projects with a long implementation period. In addition, the decision could be explainable in 2008 and the subsequent year if it refers to a very long-term perspective and one also considers an important level of risk involved in this investment decision.
Category B consisted of companies with high investments that were penalized by the market. In most cases, the reaction of the market seemed to be accurate because the companies registered both returns below the average. However, this percentage saw a sharp decline in the analyzed period, whereas the percentage of firms that were penalized while having both levels of return above the average increased. This could be a signal that the accuracy of investors’ predictions or their rationality in interpreting them decreased. On the other side, it may be linked to a decrease in the investors’ preference for investments that were considered too risky in the future.
Companies from category C were the ones with a prudent investment policy that were rewarded by the market. Most of them showed that investors should not have become more interested in them, as they registered levels of returns below the average. Moreover, the percentage increased, signaling a possible decrease in investors’ rationality. The result on the other side may be linked to a propensity of investors towards companies with prudent capital budgeting, but the idea should be regarded with prudence, considering the low levels of current returns. A possible explanation, not verified in this paper, is that some investors have a flight-to-quality strategy.
The last category consisted of firms with low investments and a low price/book value. Most of these proved that the investors’ reaction was rational by registering below-average levels of returns in both years. The cases of companies with low returns in either the current or next year that were penalized by the market for having low investments might also be explicable in certain situations. For example, companies with low returns in the current year might have registered low P/Bv if investors were interested only in short-term investments and not in the companies’ future performance. Similarly, investors interested in long-term investments could penalize companies with poor perspectives, even though they had high current returns. However, the percentage of the ones that had high levels of returns in both years but were still penalized by the market increased, signaling an increase in irrationality or an increased preference for aggressive investments manifested in the market.
The results in Table 11 are similar to the ones in Table 10, proving that whichever return we considered, the results we obtained were mainly the same. In other words, regardless of whether the investors took into account the return they would obtain for the capital they invested in the company (ROE) or the return the company obtained from its investments (ROA), the conclusions were similar.
We performed the same analysis on the different groupings of countries. Table 12 and Table 13 present our results for developed and emerging countries, taking into account ROE as rate of return of the company. The results we obtained using ROA were similar and are included in Appendix C, Table A7 and Table A8.
Table 12.
Percentage of companies in each class based on ROE—developed countries.
Table 13.
Percentage of companies in each class based on ROE—emerging countries.
Our results were similar to the ones obtained at a global level. However, the evolution of the results for the two categories of countries presented some particularities. Figure 2 presents the compared evolution of the cases that suggested a correct valuation in the market.
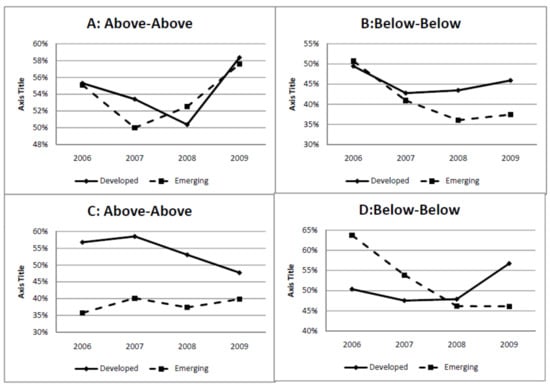
Figure 2.
Developed versus emerging countries.
Although the percentages obtained for both types of countries were similar for most categories, their evolution in the analyzed period seemed different. For example, the percentage of companies with high returns in both years and an active investment policy that had high P/Bv (category A: Above-Above) registered a sharper decline in emerging markets that in developed ones in 2007. However, the decline continued for the latter in 2008, whereas the situation in emerging countries began to improve.
Additionally, the percentage of companies with low investments that were penalized by the market even though they had high returns in both years (category C: Above-Above) was substantially lower in emerging markets than in developed ones in 2006. However, the difference decreased towards the end of the analysis period.
A decrease in the investors’ appetite for an aggressive investment policy or their increasing concern for the ability of the issuer to generate high returns could also be observed in the increase of the “B Above-Above” percentage in time, in developed and in emerging countries as well, with a more significant increase in the first case.
Table 14 and Table 15 present our results for developed capital markets and less-developed capital markets, respectively, by taking into account ROE as rate of return of the company. The results we obtained using ROA were similar and are included in Appendix D, Table A9 and Table A10.
Table 14.
Percentage of companies in each class based on ROE—developed capital market.
Table 15.
Percentage of companies in each class based on ROE—Less-developed capital market.
Figure 3 presents the compared evolution of the cases that suggested a correct valuation on the market, differentiating between developed capital markets and less-developed capital markets.
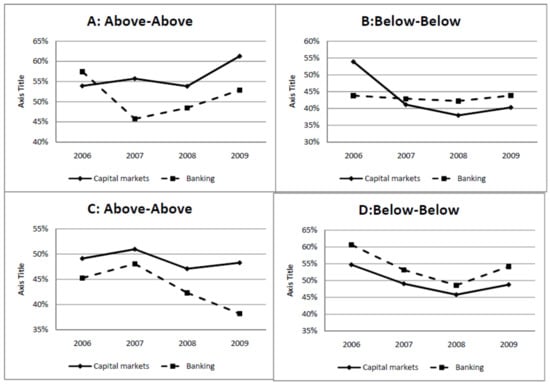
Figure 3.
Developed capital markets versus less-developed capital markets.
As the figure shows, the countries with predominant banking systems displayed more prudent behavior by the average investors regarding the aggressive capital budgeting policies undertaken by the issuers. The percentage of the “A Above-Above” class was significantly lower starting 2007. However, these national capital markets exhibited a higher overall prudence and resilient behavior because the percentage of “C Above-Above” remained lower, a signal that capital budgeting policy is important when analyzing a company. In addition, the percentage of “B Below-Below” and “D Below-Below” remained higher in 2007 and the subsequent years than in market-based financial systems. As mentioned before, this may be an effect of the signaling role of the bank monitoring activity that reduced the volatility of investors’ decisions on stock exchanges.
The “B Above-Above” percentage increased in the developed capital market over time, signifying a lower appetence for aggressive capital budgeting in those national stock exchanges, whereas the same percentage was higher in 2006, decreased in 2007, and increased after that in bank-based financial systems. This may be the influence that the bank systems manifest on investors’ decisions, with more prudence in the beginning of the risk-accumulation period.
4. Discussion
The analysis above allowed us to make some general conclusions on the concordance of investors’ behavior with the fundamentals of financial analysis. One can see that in emerging countries, the percentage of “C Below-Below” remained significantly higher than for developed countries, meaning that the investors in the first category displayed less fundamentally based decisions in their investment choices. The same idea is sustained by the higher “B Above-Above” overall percentages. An overall assessment cannot oversee that in the entire sample the “C Below-Below” percentage remained above 30% for the entire period and the “B Above-Above” was around 25%, meaning that in a significant number of cases, the investors made decisions that contradicted economic fundamentals, preferring companies with lower returns and prudent investment policies and avoiding companies with high investments and high returns. This may be the result of a risk-adverse overreaction manifested by some investors, hence in line with the idea of an increase in sentiment-based investment decisions in unstable economic environment.
Of course, the market did not become fully irrational. We observed that when analyzing companies with aggressive investment policies (categories A and B), investors were not easily fooled. In more than 60% of cases, they made the distinction between companies that were able to successfully manage such investments and the ones that were just trying to signal a stable financial situation through these policies. However, the percentage decreased over time, which signaled a reduction in the accuracy of investors’ predictions. The exception was 2009, when the preference of the market for high investments had a major decrease. For this reason, the market became more prudent with the impact of investments. In the case of companies with a prudent investment policy, the investors also assessed the impact of investment correctly for more than 60%. This means that usually the level of the investment was not enough to make investors more or less interested in certain companies. They also took into consideration the conditions provided by the company and the predicted evolution of the investment, which in most cases they forecasted correctly.
5. Conclusions
This paper integrates into relationship marketing literature, studying how strategic capital budgeting choices by companies affect investors’ decisions about the capital market regarding the shares of the respective companies. Our aim was to provide an ex-post analysis of the investment decisions in relation to the capital budgeting policy of the issuers as a base for a better understanding of investment decisions in turbulent periods. As regression analysis is not able to capture the complexity of the investment decision process, and in some cases is also limited by the nature of the data, the analysis includes a statistical description that may help academics and practitioners understand some insights into investment decisions in capital markets in turbulent times. The topic is less studied in the literature and therefore the conclusions of the study may be important for decision-makers who are entitled to make strategic choices in listed companies, especially in unstable economic periods such as the present one. This paper also brings forward some insights into the degree of investors’ rationality in the capital market. Using a large database, including companies in more than 60 countries and a simple statistical analysis, we put into evidence the relation between investment decisions and capital budgeting and returns generated by issuers in unstable economic periods. In order to obtain robust conclusions, we first put into evidence investors’ preferences for different patterns of investment policy adopted by the issuers. The evolution of investors’ preferences toward a more active company investment policy was also analyzed in correlation with the effects of the financial crisis. We confirmed the hypothesis of their significant generalized pessimism in 2009, which coincided with the financial crisis, and the prudent behavior of the capital markets seemed to be maintained in 2010. As for the preference for an active investment policy, it rapidly regained its shape from before the financial crisis.
Our results show that the investors’ preference for an active capital budgeting policy is not typically influenced by the particular characteristics of certain groups of countries. We observed that regardless of whether the market was in a developed or developing country or whether it was part of the OECD, the percentage of cases where the investors preferred companies with a high level of investments was relatively similar. The primary method used for financing companies also did not lead to a significant difference in the preference of investors for high investments. However, our analysis led us to believe that it was influenced by the investors’ sentiment. We also found some evidence that the bank monitoring role was considered by stock exchange investors in bank-based financial systems.
Further, we presented a statistical analysis of how the investors used certain fundamental reasoning in their investment decisions. Thus, we observed whether their preference could be explained by taking into consideration the return of the company from the year when the investment took place and the one after that and the capital budgeting policy of the issuer. The results show that most cases could be explained in this way, which was a signal of the rational behavior of investors. However, there were numerous cases where the general opinion was counterintuitive, showing a risk-adverse overreaction manifested by investors, especially after the burst of the financial crisis.
Based on our results, we cannot deny that some investors appeared to have reasoning based on rational criteria. However, there were some signals in the market that showed some limits of rational behavior on the global market.
Author Contributions
All authors were involved in the conception and writing of all parts of the present article. Conceptualization, A.C.-S., E.V.Ţ., and C.V.C.; methodology, A.C.-S., E.V.Ţ., and C.V.C.; software, E.V.Ţ.; validation, A.C.-S., E.V.Ţ., and C.V.C.; formal analysis, A.C.-S., E.V.Ţ., and C.V.C.; resources, A.C.-S., E.V.Ţ., and C.V.C.; database preparation, A.C.-S., E.V.Ţ., and C.V.C.; writing—original draft preparation, A.C.-S., E.V.Ţ., C.V.C.; writing—review and editing, A.C.-S., E.V.Ţ., and C.V.C.; supervision, A.C.-S.; project administration, E.V.Ţ. All authors have read and agreed to the published version of the manuscript.
Funding
This research received no external funding. In preparing the article, the authors benefited from Bucharest University of Economic Studies’ material resources.
Institutional Review Board Statement
Not applicable.
Informed Consent Statement
Not applicable.
Data Availability Statement
We are grateful to the LAREFI laboratory of the University Montesquieu Bordeaux 4 for allowing us to obtain the data.
Acknowledgments
We also thank Victor Dragotă and Elena Dumitrescu for very helpful comments.
Conflicts of Interest
The authors declare no conflict of interest.
Appendix A
Table A1.
The percentage of companies with a capital budgeting policy more active than the sector.
Table A1.
The percentage of companies with a capital budgeting policy more active than the sector.
| Year | Developed Countries | Developing Countries |
|---|---|---|
| 2006 | 33.58% | 40.42% |
| 2007 | 36.18% | 36.34% |
| 2008 | 38.02% | 38.37% |
| 2009 | 38.17% | 39.55% |
| 2010 | 35.42% | 39.06% |
Source: Authors’ own calculation.
Appendix B. Symmetry Tests for Quantile Regressions
Table A2.
Symmetry test results for the whole database.
Table A2.
Symmetry test results for the whole database.
| Quantiles | Variable | 2006 | Prob. | 2007 | Prob. | 2008 | Prob. | 2009 | Prob. | 2010 | Prob. |
|---|---|---|---|---|---|---|---|---|---|---|---|
| 0.05, 0.95 | C | 1.0516 | 0.00% | 1.1110 | 0.00% | 1.2543 | 0.00% | 1.2685 | 0.00% | 1.2825 | 0.00% |
| CAPEX | 0.0538 | 53.47% | 0.0140 | 77.17% | 0.0292 | 31.91% | 0.1049 | 13.96% | 0.1045 | 16.73% | |
| 0.1, 0.9 | C | 0.5430 | 0.00% | 0.6491 | 0.00% | 0.6517 | 0.00% | 0.7162 | 0.00% | 0.6873 | 0.00% |
| CAPEX | 0.0524 | 1.54% | 0.0049 | 95.09% | 0.0018 | 97.28% | 0.0733 | 11.84% | 0.0878 | 1.38% | |
| 0.15, 0.85 | C | 0.3505 | 0.00% | 0.4023 | 0.00% | 0.3940 | 0.00% | 0.4289 | 0.00% | 0.3979 | 0.00% |
| CAPEX | 0.0181 | 64.60% | 0.0129 | 72.99% | −0.0154 | 51.52% | 0.0373 | 27.64% | 0.0446 | 27.29% | |
| 0.2, 0.8 | C | 0.2156 | 0.00% | 0.2683 | 0.00% | 0.2587 | 0.00% | 0.2789 | 0.00% | 0.2561 | 0.00% |
| CAPEX | 0.0083 | 74.46% | −0.0139 | 57.84% | 0.0050 | 81.39% | 0.0076 | 72.52% | −0.0067 | 83.81% | |
| 0.25, 0.75 | C | 0.1361 | 0.00% | 0.1717 | 0.00% | 0.1772 | 0.00% | 0.1818 | 0.00% | 0.1433 | 0.00% |
| CAPEX | −0.0030 | 84.71% | −0.0002 | 99.15% | −0.0007 | 97.45% | 0.0149 | 41.61% | −0.0139 | 47.70% | |
| 0.3, 0.7 | C | 0.0731 | 0.00% | 0.0940 | 0.00% | 0.1158 | 0.00% | 0.1110 | 0.00% | 0.0894 | 0.00% |
| CAPEX | 0.0087 | 53.09% | −0.0027 | 88.57% | −0.0161 | 37.29% | 0.0072 | 66.67% | −0.0082 | 62.74% | |
| 0.35, 0.65 | C | 0.0329 | 0.23% | 0.0575 | 0.00% | 0.0505 | 0.00% | 0.0622 | 0.00% | 0.0502 | 0.00% |
| CAPEX | 0.0006 | 95.37% | −0.0081 | 61.72% | −0.0135 | 35.95% | 0.0021 | 87.17% | −0.0113 | 47.03% | |
| 0.4, 0.6 | C | 0.0218 | 1.07% | 0.0255 | 0.40% | 0.0161 | 7.85% | 0.0312 | 0.01% | 0.0325 | 0.01% |
| CAPEX | 0.0011 | 89.93% | 0.0029 | 82.19% | −0.0084 | 50.09% | 0.0004 | 96.96% | −0.0228 | 5.70% | |
| 0.45, 0.55 | C | 0.0079 | 18.89% | 0.0016 | 79.63% | −0.0009 | 89.12% | 0.0206 | 0.03% | 0.0081 | 16.94% |
| CAPEX | 0.0015 | 81.65% | −0.0035 | 68.56% | −0.0058 | 48.23% | −0.0012 | 88.26% | −0.0196 | 2.00% |
Source: Authors’ own calculation. CAPEX refers to capital expenditures as percentage of total assets.
Table A3.
Symmetry test results for developed countries.
Table A3.
Symmetry test results for developed countries.
| Quantiles | Variable | 2006 | Prob. | 2007 | Prob. | 2008 | Prob. | 2009 | Prob. | 2010 | Prob. |
|---|---|---|---|---|---|---|---|---|---|---|---|
| 0.05, 0.95 | C | 0.9104 | 0.00% | 1.0037 | 0.00% | 1.1306 | 0.00% | 1.1617 | 0.00% | 1.1514 | 0.00% |
| CAPEX | 0.0130 | 75.50% | −0.0213 | 63.78% | 0.0316 | 85.44% | 0.2117 | 0.00% | 0.1264 | 14.47% | |
| 0.1, 0.9 | C | 0.5161 | 0.00% | 0.6001 | 0.00% | 0.6161 | 0.00% | 0.7224 | 0.00% | 0.6274 | 0.00% |
| CAPEX | 0.0350 | 33.77% | −0.0184 | 78.78% | 0.0161 | 76.88% | 0.1619 | 0.07% | 0.0677 | 12.95% | |
| 0.15, 0.85 | C | 0.3117 | 0.00% | 0.3404 | 0.00% | 0.3877 | 0.00% | 0.4713 | 0.00% | 0.3832 | 0.00% |
| CAPEX | −0.0124 | 77.57% | −0.0133 | 77.45% | −0.0019 | 97.29% | 0.1535 | 4.75% | 0.0305 | 53.00% | |
| 0.2, 0.8 | C | 0.2260 | 0.00% | 0.2332 | 0.00% | 0.2574 | 0.00% | 0.3324 | 0.00% | 0.2454 | 0.00% |
| CAPEX | −0.0291 | 23.61% | −0.0227 | 51.18% | −0.0026 | 93.03% | 0.1005 | 5.65% | 0.0466 | 43.18% | |
| 0.25, 0.75 | C | 0.1527 | 0.00% | 0.1552 | 0.00% | 0.1859 | 0.00% | 0.2140 | 0.00% | 0.1467 | 0.00% |
| CAPEX | −0.0197 | 38.02% | −0.0223 | 48.04% | −0.0100 | 72.46% | 0.0629 | 11.83% | −0.0135 | 69.36% | |
| 0.3, 0.7 | C | 0.0920 | 0.00% | 0.0910 | 0.00% | 0.1187 | 0.00% | 0.1406 | 0.00% | 0.0867 | 0.00% |
| CAPEX | −0.0205 | 28.07% | 0.0001 | 99.61% | −0.0110 | 63.10% | 0.0223 | 59.23% | −0.0336 | 22.06% | |
| 0.35, 0.65 | C | 0.0418 | 0.75% | 0.0615 | 0.01% | 0.0421 | 0.68% | 0.0756 | 0.00% | 0.0475 | 0.07% |
| CAPEX | −0.0100 | 53.08% | −0.0064 | 81.21% | 0.0016 | 93.76% | 0.0135 | 58.32% | −0.0246 | 29.56% | |
| 0.4, 0.6 | C | 0.0306 | 1.38% | 0.0312 | 1.11% | 0.0173 | 15.72% | 0.0425 | 0.03% | 0.0247 | 2.85% |
| CAPEX | −0.0114 | 38.15% | 0.0069 | 77.07% | −0.0181 | 38.29% | 0.0088 | 61.94% | −0.0278 | 17.61% | |
| 0.45, 0.55 | C | 0.0195 | 2.38% | 0.0156 | 6.73% | −0.0069 | 41.54% | 0.0225 | 0.63% | 0.0118 | 12.96% |
| CAPEX | −0.0038 | 68.34% | −0.0011 | 93.98% | −0.0229 | 4.43% | −0.0012 | 92.65% | −0.0106 | 42.04% |
Source: Authors’ own calculation. CAPEX refers to capital expenditures as percentage of total assets.
Table A4.
Symmetry test results for emerging countries.
Table A4.
Symmetry test results for emerging countries.
| Quantiles | Variable | 2006 | Prob. | 2007 | Prob. | 2008 | Prob. | 2009 | Prob. | 2010 | Prob. |
|---|---|---|---|---|---|---|---|---|---|---|---|
| 0.05, 0.95 | C | 1.2364 | 0.00% | 1.3961 | 0.00% | 1.4946 | 0.00% | 1.3877 | 0.00% | 1.3829 | 0.00% |
| CAPEX | 0.1203 | 81.23% | 0.0794 | 50.59% | 0.0078 | 86.03% | 0.0623 | 20.51% | 0.1112 | 57.02% | |
| 0.1, 0.9 | C | 0.5749 | 0.00% | 0.7344 | 0.00% | 0.6583 | 0.00% | 0.6639 | 0.00% | 0.7265 | 0.00% |
| CAPEX | 0.0593 | 7.90% | 0.0607 | 47.34% | −0.0032 | 97.66% | −0.0182 | 65.46% | 0.0874 | 23.24% | |
| 0.15, 0.85 | C | 0.3812 | 0.00% | 0.4710 | 0.00% | 0.3925 | 0.00% | 0.3978 | 0.00% | 0.4158 | 0.00% |
| CAPEX | 0.0541 | 46.02% | 0.0525 | 42.83% | 0.0015 | 96.28% | −0.0079 | 80.13% | 0.0467 | 59.51% | |
| 0.2, 0.8 | C | 0.2081 | 0.00% | 0.3226 | 0.00% | 0.2522 | 0.00% | 0.2481 | 0.00% | 0.2594 | 0.00% |
| CAPEX | 0.0385 | 39.87% | 0.0111 | 69.58% | −0.0014 | 96.76% | −0.0058 | 79.70% | −0.0080 | 80.07% | |
| 0.25, 0.75 | C | 0.1172 | 0.00% | 0.1987 | 0.00% | 0.1487 | 0.00% | 0.1450 | 0.00% | 0.1534 | 0.00% |
| CAPEX | 0.0270 | 28.74% | 0.0268 | 36.60% | −0.0011 | 97.38% | 0.0135 | 50.11% | −0.0022 | 91.83% | |
| 0.3, 0.7 | C | 0.0662 | 0.03% | 0.1129 | 0.00% | 0.1058 | 0.00% | 0.0797 | 0.00% | 0.0858 | 0.00% |
| CAPEX | 0.0126 | 53.55% | 0.0174 | 50.63% | −0.0186 | 41.85% | 0.0078 | 67.40% | 0.0145 | 44.08% | |
| 0.35, 0.65 | C | 0.0278 | 6.95% | 0.0611 | 0.02% | 0.0590 | 0.09% | 0.0502 | 0.03% | 0.0566 | 0.05% |
| CAPEX | 0.0048 | 77.28% | 0.0086 | 63.68% | −0.0136 | 49.04% | 0.0005 | 97.37% | 0.0047 | 81.91% | |
| 0.4, 0.6 | C | 0.0084 | 49.18% | 0.0279 | 2.75% | 0.0141 | 31.18% | 0.0286 | 1.08% | 0.0328 | 1.25% |
| CAPEX | −0.0085 | 51.26% | 0.0055 | 69.63% | 0.0140 | 37.89% | 0.0057 | 63.12% | −0.0062 | 63.23% | |
| 0.45, 0.55 | C | −0.0003 | 96.92% | 0.0062 | 47.97% | −0.0034 | 72.40% | 0.0203 | 0.98% | 0.0108 | 24.03% |
| CAPEX | −0.0087 | 33.80% | −0.0055 | 57.92% | 0.0087 | 44.56% | 0.0020 | 81.39% | −0.0066 | 44.09% |
Source: Authors’ own calculation. CAPEX refers to capital expenditures as percentage of total assets.
Table A5.
Symmetry test results for developed capital markets.
Table A5.
Symmetry test results for developed capital markets.
| Quantiles | Variable | 2006 | Prob. | 2007 | Prob. | 2008 | Prob. | 2009 | Prob. | 2010 | Prob. |
|---|---|---|---|---|---|---|---|---|---|---|---|
| 0.05, 0.95 | C | 0.9099 | 0.00% | 1.1445 | 0.00% | 1.3412 | 0.00% | 1.2198 | 0.00% | 1.2050 | 0.00% |
| CAPEX | 0.0266 | 32.25% | −0.0266 | 71.90% | −0.1375 | 0.04% | 0.1174 | 0.24% | 0.1837 | 3.74% | |
| 0.1, 0.9 | C | 0.5225 | 0.00% | 0.6411 | 0.00% | 0.6729 | 0.00% | 0.6428 | 0.00% | 0.6655 | 0.00% |
| CAPEX | 0.0718 | 0.37% | −0.0486 | 18.04% | −0.0214 | 58.81% | 0.0969 | 1.49% | 0.1358 | 1.64% | |
| 0.15, 0.85 | C | 0.3204 | 0.00% | 0.3664 | 0.00% | 0.4097 | 0.00% | 0.3796 | 0.00% | 0.3510 | 0.00% |
| CAPEX | 0.0026 | 94.67% | 0.0044 | 89.78% | 0.0116 | 76.41% | 0.0515 | 28.01% | 0.0369 | 52.15% | |
| 0.2, 0.8 | C | 0.2200 | 0.00% | 0.2553 | 0.00% | 0.2623 | 0.00% | 0.2679 | 0.00% | 0.2114 | 0.00% |
| CAPEX | −0.0042 | 86.55% | −0.0125 | 49.94% | 0.0168 | 60.40% | 0.0264 | 30.60% | 0.0092 | 72.63% | |
| 0.25, 0.75 | C | 0.1320 | 0.00% | 0.1656 | 0.00% | 0.1761 | 0.00% | 0.1538 | 0.00% | 0.1000 | 0.00% |
| CAPEX | −0.0025 | 90.25% | −0.0047 | 77.33% | 0.0182 | 51.85% | 0.0294 | 39.86% | 0.0056 | 80.84% | |
| 0.3, 0.7 | C | 0.0768 | 0.00% | 0.0965 | 0.00% | 0.1152 | 0.00% | 0.0865 | 0.00% | 0.0557 | 0.02% |
| CAPEX | 0.0064 | 73.24% | 0.0004 | 97.65% | −0.0053 | 83.13% | 0.0076 | 74.35% | 0.0123 | 54.16% | |
| 0.35, 0.65 | C | 0.0359 | 0.56% | 0.0525 | 0.01% | 0.0680 | 0.00% | 0.0346 | 1.10% | 0.0305 | 1.70% |
| CAPEX | −0.0021 | 88.92% | −0.0057 | 69.00% | −0.0089 | 68.63% | −0.0060 | 60.83% | 0.0062 | 72.21% | |
| 0.4, 0.6 | C | 0.0228 | 2.72% | 0.0234 | 2.74% | 0.0367 | 0.32% | 0.0137 | 20.71% | 0.0141 | 17.32% |
| CAPEX | 0.0061 | 60.94% | 0.0014 | 91.99% | 0.0027 | 88.18% | −0.0024 | 75.66% | −0.0073 | 60.35% | |
| 0.45, 0.55 | C | 0.0116 | 10.86% | 0.0067 | 35.86% | 0.0185 | 3.15% | −0.0068 | 36.62% | 0.0001 | 98.95% |
| CAPEX | 0.0019 | 82.22% | 0.0023 | 70.04% | 0.0048 | 68.70% | 0.0014 | 79.69% | 0.0007 | 94.07% |
Source: Authors’ own calculation. CAPEX refers to capital expenditures as percentage of total assets.
Table A6.
Symmetry test results for developed banking systems.
Table A6.
Symmetry test results for developed banking systems.
| Quantiles | Variable | 2006 | Prob. | 2007 | Prob. | 2008 | Prob. | 2009 | Prob. | 2010 | Prob. |
|---|---|---|---|---|---|---|---|---|---|---|---|
| 0.05, 0.95 | C | 1.3744 | 0.00% | 1.1881 | 0.00% | 1.2586 | 0.00% | 1.3373 | 0.00% | 1.3875 | 0.00% |
| CAPEX | 0.2634 | 4.29% | 0.1172 | 34.67% | 0.1177 | 5.11% | 0.1639 | 0.00% | 0.0070 | 98.09% | |
| 0.1, 0.9 | C | 0.6402 | 0.00% | 0.7170 | 0.00% | 0.6577 | 0.00% | 0.8241 | 0.00% | 0.7551 | 0.00% |
| CAPEX | 0.1725 | 27.97% | −0.0156 | 83.32% | 0.0206 | 56.68% | 0.1035 | 19.08% | 0.0767 | 11.19% | |
| 0.15, 0.85 | C | 0.4293 | 0.00% | 0.4508 | 0.00% | 0.4289 | 0.00% | 0.5029 | 0.00% | 0.4635 | 0.00% |
| CAPEX | 0.0613 | 44.96% | −0.0010 | 98.15% | 0.0120 | 87.74% | 0.0403 | 73.85% | 0.0934 | 21.50% | |
| 0.2, 0.8 | C | 0.2557 | 0.00% | 0.2906 | 0.00% | 0.2965 | 0.00% | 0.2695 | 0.00% | 0.3442 | 0.00% |
| CAPEX | 0.0428 | 61.13% | −0.0085 | 86.36% | −0.0212 | 64.97% | −0.0003 | 99.40% | 0.0201 | 82.97% | |
| 0.25, 0.75 | C | 0.1395 | 0.00% | 0.1729 | 0.00% | 0.1976 | 0.00% | 0.1605 | 0.00% | 0.2120 | 0.00% |
| CAPEX | 0.0038 | 92.69% | 0.0028 | 93.62% | −0.0222 | 42.16% | −0.0003 | 99.09% | −0.0199 | 62.42% | |
| 0.3, 0.7 | C | 0.0680 | 0.52% | 0.1052 | 0.00% | 0.0925 | 0.00% | 0.0945 | 0.00% | 0.1288 | 0.00% |
| CAPEX | 0.0077 | 72.17% | 0.0065 | 80.59% | −0.0004 | 98.55% | 0.0038 | 83.48% | −0.0033 | 92.70% | |
| 0.35, 0.65 | C | 0.0308 | 12.28% | 0.0447 | 1.59% | 0.0565 | 0.06% | 0.0545 | 0.03% | 0.0681 | 0.05% |
| CAPEX | −0.0152 | 29.19% | −0.0007 | 97.43% | −0.0050 | 83.67% | 0.0126 | 44.27% | −0.0133 | 66.36% | |
| 0.4, 0.6 | C | 0.0008 | 95.91% | 0.0173 | 24.09% | 0.0211 | 10.07% | 0.0267 | 3.04% | 0.0213 | 14.88% |
| CAPEX | −0.0036 | 75.66% | 0.0182 | 43.32% | −0.0013 | 93.79% | 0.0128 | 49.87% | −0.0101 | 54.18% | |
| 0.45, 0.55 | C | 0.0032 | 77.31% | 0.0126 | 23.44% | 0.0016 | 85.68% | 0.0042 | 61.09% | 0.0006 | 95.08% |
| CAPEX | 0.0035 | 66.50% | 0.0295 | 11.76% | 0.0000 | 99.98% | 0.0044 | 53.99% | 0.0025 | 84.31% |
Source: Authors’ own calculation. CAPEX refers to capital expenditures as percentage of total assets.
Appendix C
Table A7.
Return on Assets Above and Below the Sector Average—Developed Countries.
Table A7.
Return on Assets Above and Below the Sector Average—Developed Countries.
| Year | A | |||
| Above-Above | Above-Below | Below-Above | Below-Below | |
| 2006 | 48.82% | 16.16% | 8.42% | 26.60% |
| 2007 | 49.71% | 11.56% | 9.54% | 29.19% |
| 2008 | 46.65% | 13.90% | 8.44% | 31.02% |
| 2009 | 53.39% | 10.03% | 7.37% | 29.20% |
| Year | B | |||
| Above-Above | Above-Below | Below-Above | Below-Below | |
| 2006 | 22.01% | 10.33% | 13.86% | 53.80% |
| 2007 | 20.75% | 16.27% | 15.57% | 47.41% |
| 2008 | 23.31% | 16.53% | 13.77% | 46.40% |
| 2009 | 25.78% | 16.64% | 9.14% | 48.45% |
| Year | C | |||
| Above-Above | Above-Below | Below-Above | Below-Below | |
| 2006 | 47.69% | 10.87% | 12.27% | 29.18% |
| 2007 | 50.79% | 5.91% | 14.76% | 28.54% |
| 2008 | 48.69% | 13.74% | 9.09% | 28.48% |
| 2009 | 44.13% | 10.22% | 9.13% | 36.52% |
| Year | D | |||
| Above-Above | Above-Below | Below-Above | Below-Below | |
| 2006 | 21.53% | 11.88% | 12.62% | 53.96% |
| 2007 | 21.47% | 10.27% | 15.87% | 52.39% |
| 2008 | 19.74% | 15.70% | 11.34% | 53.22% |
| 2009 | 16.94% | 12.20% | 11.90% | 58.97% |
Source: Authors’ own calculation.
Table A8.
Return on Assets Above and Below the Sector Average—Emerging Countries.
Table A8.
Return on Assets Above and Below the Sector Average—Emerging Countries.
| Year | A | |||
| Above-Above | Above-Below | Below-Above | Below-Below | |
| 2006 | 55.31% | 8.44% | 7.19% | 29.06% |
| 2007 | 48.13% | 14.69% | 11.56% | 25.63% |
| 2008 | 50.67% | 11.20% | 8.80% | 29.33% |
| 2009 | 55.96% | 11.93% | 7.03% | 25.08% |
| Year | B | |||
| Above-Above | Above-Below | Below-Above | Below-Below | |
| 2006 | 28.40% | 10.80% | 8.45% | 52.35% |
| 2007 | 27.39% | 11.81% | 14.07% | 46.73% |
| 2008 | 35.37% | 13.49% | 12.98% | 38.17% |
| 2009 | 38.21% | 13.89% | 8.23% | 39.67% |
| Year | C | |||
| Above-Above | Above-Below | Below-Above | Below-Below | |
| 2006 | 35.20% | 6.98% | 10.89% | 46.93% |
| 2007 | 40.56% | 6.53% | 15.62% | 37.30% |
| 2008 | 35.00% | 8.48% | 15.87% | 40.65% |
| 2009 | 39.52% | 11.29% | 11.02% | 38.17% |
| Year | D | |||
| Above-Above | Above-Below | Below-Above | Below-Below | |
| 2006 | 19.26% | 10.49% | 8.76% | 61.49% |
| 2007 | 21.28% | 7.37% | 15.81% | 55.53% |
| 2008 | 27.17% | 9.83% | 16.43% | 46.57% |
| 2009 | 29.92% | 14.44% | 9.73% | 45.92% |
Source: Authors’ own calculation.
Appendix D
Table A9.
Return on Assets Above and Below the Sector Average—Developed Capital Market.
Table A9.
Return on Assets Above and Below the Sector Average—Developed Capital Market.
| Year | A | |||
| Above-Above | Above-Below | Below-Above | Below-Below | |
| 2006 | 50.00% | 9.69% | 7.91% | 32.40% |
| 2007 | 50.25% | 12.75% | 10.25% | 26.75% |
| 2008 | 49.28% | 12.50% | 5.77% | 32.45% |
| 2009 | 56.16% | 11.82% | 5.17% | 26.85% |
| Year | B | |||
| Above-Above | Above-Below | Below-Above | Below-Below | |
| 2006 | 20.48% | 9.24% | 10.24% | 60.04% |
| 2007 | 21.66% | 14.51% | 15.67% | 48.16% |
| 2008 | 28.18% | 13.41% | 14.09% | 44.32% |
| 2009 | 30.62% | 16.59% | 7.54% | 45.25% |
| Year | C | |||
| Above-Above | Above-Below | Below-Above | Below-Below | |
| 2006 | 43.09% | 8.78% | 12.36% | 35.77% |
| 2007 | 45.18% | 5.85% | 16.59% | 32.39% |
| 2008 | 42.44% | 11.54% | 12.03% | 33.98% |
| 2009 | 44.42% | 10.34% | 9.94% | 35.29% |
| Year | D | |||
| Above-Above | Above-Below | Below-Above | Below-Below | |
| 2006 | 19.98% | 10.48% | 11.57% | 57.96% |
| 2007 | 21.41% | 8.17% | 15.54% | 54.88% |
| 2008 | 20.90% | 14.17% | 12.51% | 52.42% |
| 2009 | 22.41% | 12.79% | 11.31% | 53.49% |
Source: Authors’ own calculation.
Table A10.
Return on Assets Above and Below the Sector Average—Less-Developed Capital Market.
Table A10.
Return on Assets Above and Below the Sector Average—Less-Developed Capital Market.
| Year | A | |||
| Above-Above | Above-Below | Below-Above | Below-Below | |
| 2006 | 56.00% | 16.44% | 7.56% | 20.00% |
| 2007 | 46.79% | 13.58% | 10.94% | 28.68% |
| 2008 | 47.65% | 12.74% | 11.91% | 27.70% |
| 2009 | 52.31% | 9.62% | 10.38% | 27.69% |
| Year | B | |||
| Above-Above | Above-Below | Below-Above | Below-Below | |
| 2006 | 33.78% | 12.84% | 12.16% | 41.22% |
| 2007 | 27.63% | 13.49% | 13.49% | 45.39% |
| 2008 | 29.31% | 16.78% | 12.77% | 41.13% |
| 2009 | 34.11% | 13.23% | 10.44% | 42.23% |
| Year | C | |||
| Above-Above | Above-Below | Below-Above | Below-Below | |
| 2006 | 40.83% | 10.42% | 10.00% | 38.75% |
| 2007 | 47.68% | 6.95% | 12.25% | 33.11% |
| 2008 | 41.12% | 10.65% | 13.02% | 35.21% |
| 2009 | 38.64% | 11.21% | 10.03% | 40.12% |
| Year | D | |||
| Above-Above | Above-Below | Below-Above | Below-Below | |
| 2006 | 21.27% | 12.55% | 9.27% | 56.91% |
| 2007 | 21.27% | 9.84% | 16.06% | 52.82% |
| 2008 | 25.21% | 11.89% | 14.86% | 48.04% |
| 2009 | 24.15% | 13.77% | 10.38% | 51.70% |
Source: Authors’ own calculation.
References
- Brealey, R.A.; Myers, S.C.; Marcus, A.J. Fundamentals of Corporate Finance, 3rd ed.; McGraw-Hill Primis Custom Publishing: New York, NY, USA, 2001. [Google Scholar]
- Isakov, D.; Weisskopf, J.P. Are founding families special blockholders? An investigation of controlling shareholder influence on firm performance. J. Bank Financ. 2014, 41, 1–16. [Google Scholar] [CrossRef]
- Francis, J.; LaFond, R.; Olsson, P.M.; Schipper, K. Cost of equity and earnings attributes. Account. Rev. 2004, 40, 82–114. [Google Scholar] [CrossRef]
- Francis, J.; LaFond, R.; Olsson, P.M.; Schipper, K. The market pricing of accruals quality. J. Account. Econ. 2005, 39, 295–327. [Google Scholar] [CrossRef]
- Woolridge, R.; Snow, C. Stock market reaction to strategic investment decisions. Strateg. Manag. J. 1990, 11, 353–363. [Google Scholar] [CrossRef]
- Durnev, A.; Morck, R.; Yeung, B. Value-Enhancing Capital Budgeting and Firm-specific Stock Return Variation. J. Financ. 2004, LIX, 65–105. [Google Scholar] [CrossRef]
- Habib, A.; Hasan, M.M. Managerial ability, investment efficiency and stock price crash risk. Res. Int. Bus. Financ. 2017, 42, 262–274. [Google Scholar] [CrossRef]
- Stein, J. Rational Capital Budgeting in an Irrational World. J. Bus. 1996, 69, 429–455. [Google Scholar] [CrossRef]
- Polk, C.; Sapienza, P. The Stock market and Corporate Investment: A Test of Catering Theory. Rev. Fin. Stud. 2008, 22, 187–217. [Google Scholar] [CrossRef]
- Pereira da Silva, P. Do managers pay attention to the market? A review of the relationship between stock price informativeness and investment. J. Multi. Fin. Manag. 2021, 59, 100675. [Google Scholar]
- Akerlof, G.A.; Shiller, R.J. Animal Spirits: How Human Psychology Drives the Economy, and Why It Matters for Global Capitalism; Princeton University Press: Princeton, NJ, USA, 2009. [Google Scholar]
- Chau, F.; Deesomsak, R.; Lau, M.C.K. Investor sentiment and feedback trading: Evidence from the exchange-tradedfundmarkets. Int. Rev. Financ. Anal. 2011, 20, 292–305. [Google Scholar] [CrossRef]
- Chiu, J.; Chung, H.; Ho, K.Y.; Wu, C.C. Investor sentiment and evaporating liquidity during financial crisis. Int. Rev. Econ. Fin. 2018, 55, 21–36. [Google Scholar] [CrossRef]
- Hoffmann, A.O.I.; Post, T.; Pennings, J.M.E. Individual investor perceptions and behavior during the financial crisis. J. Bank Financ. 2013, 37, 60–74. [Google Scholar] [CrossRef]
- Berk, J.; DeMarzo, P. Finance d’Entreprise; Pearson Publishing House: Paris, France, 2011. [Google Scholar]
- Chudik, A.; Fratzscher, M. Identifying the global transmission of the 2007–2009 financial crisis in a GVAR model. Eur. Econ. Rev. 2011, 55, 325–339. [Google Scholar] [CrossRef]
- Lim, K.P.; Brooks, R.D.; Kim, J.H. Financial crisis and stock market efficiency: Empirical evidence from Asian countries. Int. Rev. Financ. Anal. 2008, 17, 571–591. [Google Scholar] [CrossRef]
- Dragotă, V.; Stoian, A.; Pele, D.T.; Mitrică, E.; Bensafta, M. The Development of the Romanian Capital Market: Evidences on Information Efficiency. Rom. J. Econ. Forecast 2009, 10, 147–160. [Google Scholar]
- Dragotă, V.; Ţilică, E.V. Market efficiency of the Post-Communist East European stock markets. Cent. Eur. J. Oper. Res. 2014, 22, 307–337. [Google Scholar] [CrossRef]
- Lamont, O.A.; Stein, J.C. Investor sentiment and corporate finance: Micro and macro. Am. Econ. Rev. 2006, 95, 147–151. [Google Scholar] [CrossRef]
- Verma, R.; Soydemir, G. The impact of individual and institutional investor sentiment on the market price of risk. Q. Rev. Econ. Financ. 2009, 49, 1129–1145. [Google Scholar] [CrossRef]
- Prentice, R.A. Ethical Decision Making: More Need than Good Intentions. Financ. Anal. J. 2007, 63, 17–30. [Google Scholar] [CrossRef]
- De Jong, A.; DeJong, D.V.; Mertens, G.; Roosenboom, P. Investor relations, reputational bonding, and corporate governance: The case of Royal Ahold. J. Account. Public Policy 2007, 26, 328–375. [Google Scholar] [CrossRef]
- Dragotă, V.; Obreja Braşoveanu, L.; Dragotă, I.M. Management Financiar. Diagnosticul Financiar al Companiei, 2nd ed.; Economic Printing House: Bucharest, Romania, 2012; pp. 245–254. [Google Scholar]
- Dragotă, V.; Ţilică, E.V. The Determinants of the Level of Market Efficiency in the Post Communist East European Countries: Frictions. Unpublished; manuscript in preparation. Presented at EWGCFM - EURO Working Group for Commodities and Financial Modelling, Wien, Austria, 11–13 December 2013. [Google Scholar]
- Fama, E.F.; French, K.R. The Anatomy of Value and Growth Stock Returns. Financ. Anal. J. 2007, 63, 44–56. [Google Scholar] [CrossRef]
- Curmei-Semenescu, A.; Țilică, E.V.; Curmei, C.V. Investors’ rationality. An analysis of the investment policy implications on shares valuation. In Proceedings of the 13th International Conference on Business Excellence, 2019, Bucharest, Romania, 21–23 March 2019; Volume 1, pp. 578–588. [Google Scholar]
- Available online: www.worldbank.org (accessed on 5 February 2014).


Publisher’s Note: MDPI stays neutral with regard to jurisdictional claims in published maps and institutional affiliations. |
© 2021 by the authors. Licensee MDPI, Basel, Switzerland. This article is an open access article distributed under the terms and conditions of the Creative Commons Attribution (CC BY) license (https://creativecommons.org/licenses/by/4.0/).