1. Introduction
At the end of the 20th century in most of the developed countries in Europe and in the USA, about 50% of the total production of energy was used in buildings, 25% in traffic, and the remaining 25% in industry. Accepting the fact that fossil fuel stock is limited and that greenhouse gas (GHG) emissions are causing climate changes, developed countries have set up goals for upgrading the energy efficiency of buildings and introduction of energy from renewable sources in use in the building sector. Therefore, a reduction in energy consumption as well as the substitution of fossil fuels with renewables are defined as goals in several European Directives [
1,
2,
3,
4] and in the national regulations of member countries.
Due to the extensive effort in the retrofitting and rehabilitation of existing building stock and a set of stringent regulations for new buildings, there has been a significant reduction in both energy consumption and greenhouse gas emissions during previous decades. As a result of these efforts, at the moment, buildings account for 40% of the total energy consumption, and about 36% of GHG emissions [
4].
However, even besides tightening regulations on the energy performance of buildings, energy efficiency is increasing at a pace of merely 1.4% per year as a result of the low refurbishment rates of existing buildings [
5]. Current annual renovation rates hardly reach one percent. Without additional effort, an energy upgrade of all existing buildings will take more than 100 years to complete. From today’s point of view, this is far too long to deal with finite resources or to turn around climate change. Ambitious goals in energy savings, CO
2 emissions reduction, and the enlargement of the share of renewables in use [
3] are not possible to achieve without significant incentives in retrofitting the existing building stock and further development of standards for new buildings.
Although Serbia has followed the first steps in the regulatory field of energy efficiency by introducing appropriate legislation starting in 1967, with the most significant set of regulations dating from 1980, due to the economic and political situation in the following decades, significant refurbishment actions and strategic planning in this field that was undergone in other European countries has been omitted. Along with low rates of new construction, this situation defines the state of the Serbian building stock. In recent years, Serbia, as an EU candidate country, has started the process of harmonization with EU regulations in the field of energy efficiency by introducing several laws and ordinances [
6,
7,
8,
9,
10,
11,
12].
Energy consumption in Serbia is characterized by the dominant share of household energy consumption (34%), followed by the industry sector (28%), and transport (24%), but with a noticed trend of steady increase in consumption in the household sector and a decrease in the sectors of industry and transport [
10]. Additionally, a large share of the use of electric energy for space heating in households, almost double in comparison to neighboring countries, is highlighted [
8]. The Second Energy Efficiency Action Plan (SEAP II) of the Republic of Serbia for the period 2013–2015 [
10] defined measures for the fulfilment of projected savings of 9% of the average final energy consumption until 2018 compared to the level of consumption for the period 2001 to 2005. Share of the savings that needed to be achieved in the household sector was dominant at 36.5%. The proposed measures for implementation related to the building stock sector include refurbishment of the thermal envelope of buildings, lowering the share of electrical energy used for space heating, and the development of financing models for increasing energy efficiency in households. Other strategic documents also highlight the importance of the refurbishment of buildings and improving their energy efficiency, with the aim of minimizing the import of energy, which currently stands at 30% of total needs [
9]. SEAP II also recognizes steps that have been made toward the structuring and monitoring of the building stock in order to track its transformation by the implementation of proposed measures through the acknowledgement of the developed national typology of residential buildings [
13], according to “TABULA” project principles [
14], as the official typology for structuring building stock. This methodology has also been appointed as one of two official European methodologies for building stock energy performance assessment, but the only one that contains all the data needed for the energy performance calculation [
15]. Besides setting the methodology for deriving appropriate building typology, TABULA also defines refurbishment strategies through a two stage retrofit scenario by applying standard and ambitious refurbishment measures.
At the same time, by adopting laws on the efficient use of energy [
6], a comprehensive policy for efficient use of energy has been introduced. The law defines the legal framework for the level of the Republic of Serbia, but also at the level of smaller spatial entities—local governments—ordering the formulation of local energy efficiency plans (LEAPs). More specifically, Article 10 defines that each local government, as the organizer of local energy management, is required to bring their own energy efficiency in line with the Strategy and Action Plan adopted at the Serbian level. The content of the program includes a number of different activities: more specifically, paragraph 2 defines the need for a review and assessment of the annual energy needs of local government as a whole including the assessment of the energy performance of buildings, while paragraph 3 introduces the need to propose measures and activities that will ensure the efficient use of energy in the overall energy sector.
It is clear that no energy planning under described circumstances can be achieved without adequate treatment of the building stock. The described conditions have created a need for adequate local building stock typologies, as a first step in planning activities related to its refurbishment and in setting the platform for tracking its energy consumption in the future.
1.1. Building Typologies as a Tool for Building Stock Energy Assessment
Energy planning issues have been the focus of different fields of research in previous decades, stimulated by EU legislation and target definition in terms of energy saving. Reviews of the literature data on building stock models for energy planning [
16,
17,
18,
19,
20,
21,
22] gives an insight into a wider image of the energy planning field and its characteristics and correlations. Narrowing of the issue of energy planning from energy-economic systems-wide models to housing stock models [
18] indicates the shortcomings of these models, specific to the residential sector such as ensuring detailed analysis of the housing stock, but with little or no interaction with the rest of the energy system. Although research has stated that a reduction in CO
2 emissions is primarily driven by the interaction of energy systems, notably decarbonization of the power sector (fuel switching) combined with increased appliance efficiency, especially in the near-term reductions, we argue that there is no sustainable way of improving the energy efficiency of residential building stock without an increase in the refurbishment rates of buildings. This is in accordance with the well-known Trias Energetica concept, which represents an academically acknowledged three-step priority strategy used in many diverse fields of research [
21], setting priorities in the following manner: (1) reduce the demand, (2) use renewable energy sources, and (3) solve the residual demand efficiently and cleanly. Moreover, in a study that investigated the influence of tightening energy performance regulations on real energy consumption, it was found that thermal quality seems to be more effective in lowering the actual energy consumption for heating than heating system efficiency [
22]. It was also concluded that in order to achieve further energy reductions, the current target of policies is not sufficient, and that it has to include the control of construction quality and take into account the significant influence of occupant behavior.
An overview of several building stock models and their classification and characterization can be found in the literature [
19] as well as new model proposals [
20]. The authors defined top-down and bottom-up modeling approaches, where the top-down model is defined as econometric, primarily based on energy use in relation to various economic parameters (fuel price, income, GDP), while bottom-up models are built up from data on a hierarchy of disaggregated components, which are then combined according to some estimate for their individual impact on energy usage. A further definition of bottom-up models recognizes two main approaches: one based on building physics performance modeling techniques and the other based on statistical techniques formulated usually with regression techniques. According to this definition, the typology-based building stock models that we are dealing with represent a bottom-up building physics model. The authors state that in Europe, bottom-up building physics stock models are seen as useful tools to provide policy-makers with estimates of the effectiveness of policies and can help to identify technological measures that end-use efficiencies. [
19] In Serbia, however, there are no strategic planning activities or data that could support them such as projections on building stock development trends nor at the national or local level. As even the collection of basic data needed to perform the energy performance calculations of building stock cannot be found in national statistics as some authors suggest [
20], other methods have to be developed.
The structuring of the entire building stock is a complex task that involves two dominant, but also very distinct segments: public and residential. The monitoring and performance of the public sector is partly legally regulated by the introduction of energy management services and the corresponding obligation of reporting, while the residential sector remains fairly disorganized in structural and in managerial terms, without proper guidelines for action. The need for the analysis and classification of types of residential buildings and a definition of their energy performance as a basis for the adoption of adequate policies for energy efficiency improvement is expressed in the Second Action Plan [
10], as previously mentioned. For the first time in the national strategic documents, the importance of methodological approach to define the typology of residential buildings is highlighted, based on the methodology initially developed within the European “TABULA” project [
14]. As an associated member of this project, a work group from the Faculty of Architecture and with the support of GIZ has developed a national typology of residential buildings for Serbia [
13]. The typology results in the matrix of typical residential buildings (real buildings as representative of model buildings) derived according to characteristics influencing their energy performance: age, urban layout, architectural features, applied materials, etc. The “TABULA” project principles are explained in detail on the project website [
14] as well as in published studies [
23,
24]. These studies confirm that building typologies can be a useful instrument to facilitate the energy performance assessment of the existing building stock as well as influence various energy efficiency improvement measures, providing a tool for estimating the impact of different retrofit scenarios. Another important aspect of the typological approach is its twofold communication potential: on the level of the individual building (type) presenting the potential for improvement and savings to owners and other interested parties, and on the national level, enabling a summary of all the performance characteristics and retrofit potential for strategic decision making.
National Typology of Residential Buildings—Characteristics and Limitations
The mentioned problem of data acquisition for the purpose of defining the national typology was overcome by organizing an independent survey of buildings, according to methodology and questionnaires prepared for that purpose. With funding support provided by GIZ, and a methodological framework according to “TABULA” project principles, an expert statistical office was hired and a survey was designed with the sample and survey methodology that could give appropriate data to form the building matrix. Survey characteristics and principles, questionnaire, and analysis methods have been described in detail in published material [
13,
25,
26,
27,
28,
29]. The issue of the representativeness of selected types in the matrix is in direct relation to the size of the sample to be analyzed when conducting a census, which in the formation of a national typology was around 23,000 buildings. The selected buildings in the matrix are model buildings, visually represented by real ones that are closest to the model characteristics. Model buildings are, in this approach, formulated by a principle that defines their characteristics as the closest to the average values of statistically generated ones. The method of clustering, using the k-means algorithm in cluster analysis, has been adopted as the main principle for distinguishing defining characteristics. Clustering methods group a set of objects into clusters so that objects in the same cluster are more similar to each other than objects in different clusters according to some defined criteria [
30], or in other words, clustering aims to find smaller, more homogeneous groups from a large heterogeneous collection of items [
31]. These similarities, in the case of building stock assessment, are represented by characteristics that influence building energy performance, defining the groups of buildings by their similar characteristics. Through the choice of included criteria, analysis can be designed in order to obtain more precise model buildings. After the definition of model buildings, real representatives with matching, or the most similar characteristics are selected for each type, making them the type representatives. Further calculations and projections are done upon these buildings. This method requires detailed data of the chosen buildings. Calculations of energy performance are done by using real physical characteristics taken from the building construction documentation and according to national procedures defined in relevant regulations [
11,
12] and described in published studies [
32]. Values of energy needed for heating, final energy, primary energy, and CO
2 emissions for each type are generated and summarized at the national level. The calculation procedure also included two levels of improvement, standard and enhanced, based on the “TABULA” project principles.
Regarding the main construction systems and thermal envelope components of buildings in Serbia, the national typology gives a complete set of data for each building type, for the present state and two levels of improvements [
13]. We can summarize that we are mainly dealing with buildings built in massive construction systems, largely as a combination of masonry and reinforced concrete constructions, with massive floor and roof slabs, or with wooden construction of top ceilings and pitched roofs. Insulation layers appear according to legislation requirements, mainly in the buildings constructed after the 1970s, but insufficiently regarding contemporary legislation. Window components are mostly wooden, but are also largely affected by sporadic refurbishment actions. Detailed data about the material characteristics of each building type are available online in referenced books and publications [
13,
25,
26,
27,
28,
29], but also as part of the web tool developed for further use of both national and local typologies in Serbia, also available to the broader public online [
33]. In addition, these data exist in the TABULA WebTool, available online [
34].
The starting point of the application of the national typology is based on the universality of defined types and their representativeness at the Serbian level. Further implementation of the methodology, primarily at the local level, is possible, with the necessity of understanding the existence of restrictions on the direct application of the national matrix. Local specificities must be analyzed and included in the matrix, resulting in the development of specific local typologies. The problem of adequacy of one building stock model for different scales of application has been detected in previous research [
19].
In other words, by direct observation of the matrix, it can be concluded whether a certain model house has limited applicability in local conditions. During the formulation of a national typology, such typical local characteristics were observed, but mostly in the family housing sector due to the important influence of local building techniques and materials applied in the process of their creation [
26]. Thus, for example, building representing type A1 does not have to be dominant at some lower spatial level (region, municipality...), while it is dominant at the level of Serbia (
Figure 1).
Noted discrepancy describes the problem of an appropriate disaggregation level of a building stock model and it has also been detected in studies presented in the literature [
19]. Models with high stock disaggregation such as the one formed by the national typology have a risk of not having sufficient supporting data for each category, for example, applied heating systems and fuels, which can have a huge influence on primary energy demand and CO
2 emissions assessment. This issue will be addressed in the analysis of the pilot project results in
Section 3.3.
1.2. Energy Management at the Local Level
Although the laws on the efficient use of energy primarily apply to public buildings used by the local government authorities, the need to assess the total energy needs of the local community should be based on realistic grounds, and address the performance of all buildings in the territory of self-government, therefore including the residential building stock. The law also defines the introduction of energy management services (Article 19) as obligatory for all municipalities with more than 20,000 inhabitants. The energy manager, among others, has an obligation to collect and analyze data on energy use, prepare appropriate programs and plans, propose measures that contribute to efficient use of energy as well as control their implementation. Construction of the energy manager’s service, understood in this way, strongly depends on the possession of information on the structure of energy consumption in local government, its carriers and characteristics as well as the principles and modalities of achieving a higher degree of efficiency. This requires strengthening support systems for such a service.
A number of authors have dealt with the design of appropriate decision support systems for regional energy management systems planning [
16,
17]. The complexities of decision making in energy management have been described, focused on issues of a dynamic energy market (frequent intervention of government through energy and environmental policies) and all uncertainties connected to it. Although dealing with large scale energy modeling issues, the authors stress the importance of informed decision makers at the local level through adequate support from the studies as well as user-friendly technologies and software solutions.
Therefore, based on all of the above, the main objectives of this paper can be summarized as follows: to provide policy-makers on local levels with an overview of the available methodologies for structuring and analyzing local residential building stock for the purpose of its future energy refurbishment; investigate the limitations of the application of previously developed national typology of residential buildings of Serbia on a local level; present two different methods for local typology definition; and to compare the results of their application in terms of the assessment of energy needed for heating, primary energy, and CO2 emissions of the entire local residential building stock.
2. Methodology
When analyzing the diversity of the structure of settlements in Serbia, their size, the spatial distribution of the building stock, and forms of building, it is obvious that it is necessary to develop a new, more suited methodological approach for the local application of building typologies.
Any methodology designed to be implemented at the local level must primarily take into account the existence of specific characteristics that will influence and, in a way, determine, the manner of their observation, identification, and quantification (forms, types of structures, types of equipment) in order to be later processed and included in the matrix. In this process, the most important is the statistical evaluation in order to achieve appropriate accuracy of the results. Standard research methods, which include the formation of the sample by the principles of representativeness (usually applied for larger scale surveys or public opinion investigation), cannot be applied primarily due to the specific subject of analysis, in this case building stock, which is characterized by uneven development, different densities within a very small space frame, and typological diversity.
Historically, the development of cities in Serbia has been characterized by different trends that have resulted in the varied scope, type, and spatial distribution of buildings. Town planning is mainly carried out by the so-called zonal model, where urban plans define specific zone functions and parameters determining physical structure development. The boundaries of these zones are often extremely deterministic without “soft” connections with the environment, often resulting in stark contrast. The result of these activities is the phenomena of large-scale multi-family building blocks situated at the ends of the urban fabric, at first toward empty, usually agricultural land, and later surrounded by individual housing. In addition, the majority of cities are characterized by the existence of a significant volume of illegal settlements [
35], which makes further analysis even more complex, primarily due to the lack of clear principles of urban development. The physical structure is often and significantly modified over time (upgrades, extensions, or other modifications), thus changing not only the parameters of the urban areas, but also their appearance and material characteristics.
Bearing this in mind, the logical questions of how to analyze and structure such diverse entities, or how to develop a building matrix applicable at the local level that can serve as the planning tool have been raised. While working on the further implementation of the methodology used to develop the national typology, observed characteristics led to the development of two potentially applicable approaches for the development of the matrix of local residential buildings. Distinguished mainly by the way the data needed for the formulation of the typology are gathered and processed, they can be characterized as the TOP-DOWN (top to bottom) and BOTTOM-UP (bottom to top) methods, each with its own peculiarities, certain advantages, and, of course, limitations, which will be further analyzed and presented.
2.1. Top-Down Method
The top-down approach is based on data from a broader spatial framework (e.g., national typology) as well as other data that are available for the analysis at the local level:
Census of population and housing, data on the number of dwellings by municipalities, time periods, and the size of dwellings [
36,
37];
Statistics on buildings constructed by municipalities (statistical yearbooks);
Statistics on housing built from 1994 to 2008 (statistical yearbooks);
Data from the cadaster;
Data from public companies for heat supply;
Data from public companies for gas supply; and
Information from public companies for the maintenance of residential buildings.
It is obvious that these vast data cannot be assessed by a single person nor only external experts. In fact, the development of methodology requires teamwork, led by the manager of the overall survey (for example, the local energy manager) and a whole range of professionals: statistical expert, experts on building typologies, local consultants with expertise in the field of construction and energy efficiency, and researchers in the field (optional, but highly desirable).
The starting point of the process of formulating a local typology is the statistical method of cluster analysis based on the use of local characteristics as the generative elements. By imposing variables other than those defined in the national typology, it is possible that the local matrix will differ both in the size and appearance of the model buildings. Therefore, additional work is required for their definition and for further calculations. In the process, it is very important to define an appropriate degree of relevance (benchmark) because experience has shown that adjusting the national matrix usually involves a reduction (in some cases, drastically) in the number of types, thus determination of threshold (statistical representation of the type) is one of the basic generating parameters. To create a new matrix, it is necessary to identify the relevant material characteristics of buildings in order to formulate a locally recognizable model building and in the next step, the real building as its representative. These representatives can be extracted from the available data or identified in the field.
After formulating a local building typology, the energy performance characteristics of new types are calculated according to national regulations, and building stock energy characteristics on the municipal level are summarized.
2.2. Bottom-Up Method
The bottom-up method can be characterized as the application of the main principles developed for the purpose of the TABULA project, but on a smaller spatial level and with certain necessary modifications. The method is based on the data collected locally in accordance with predefined statistical principles. The definition of the sample that is to be surveyed is the key point of the method because the quality of the results is directly dependent on the concept, size, and quality of the data collected. In order to acquire relevant data, special attention has to be paid to several key issues.
2.2.1. Type and Size of the Survey
Type of the designed survey is proportional to the size and complexity of the analyzed spatial level (municipality) and it can be defined as a one- or two-stage process. One of the main driving parameters for choosing the type of survey is of course the financial aspect of the process, which usually falls on the burden of the local municipality.
The introduction of a multi-level survey has been developed as the compromise between a statistically required size of the sample and precision of the gathered data. Multi-level modeling is sometimes used for data from complex surveys involving multistage sampling, unequal sampling probabilities, and stratification [
38]. It enables covering a larger sample with lesser degree of precision, but without compromising the identification of characteristics relevant for the definition of the typology. This means that the goal of the first stage is to gather the basic information needed, while the precise, material, technical, or other characteristics are collected in the second round on a narrower sample.
When determining the size of the sample, the fundamental premise is based on expert assessment of the number of expected building types, without significantly changing the basic principles of classification. It is necessary to achieve statistical relevance of each identified type in the matrix (i.e., to have a minimum sample of at least 30 units in order to successfully determine average characteristics). This brings into correlation the anticipated number of buildings and sample size setting the minimal survey size. In the sector of individual family houses, different ways of sampling can be applied, while special attention should be paid to the multi-family sector, and often (for all cities with fewer than 30,000 buildings) an inventory of all such building types is necessary.
Based on the experiences from collaboration with experts in statistics, and bearing in mind the specifics in the field of building stock, the recognized recommendations for the number of surveyed buildings, depending on the total number of buildings in a local government, is given in
Table 1.
2.2.2. Sample Design
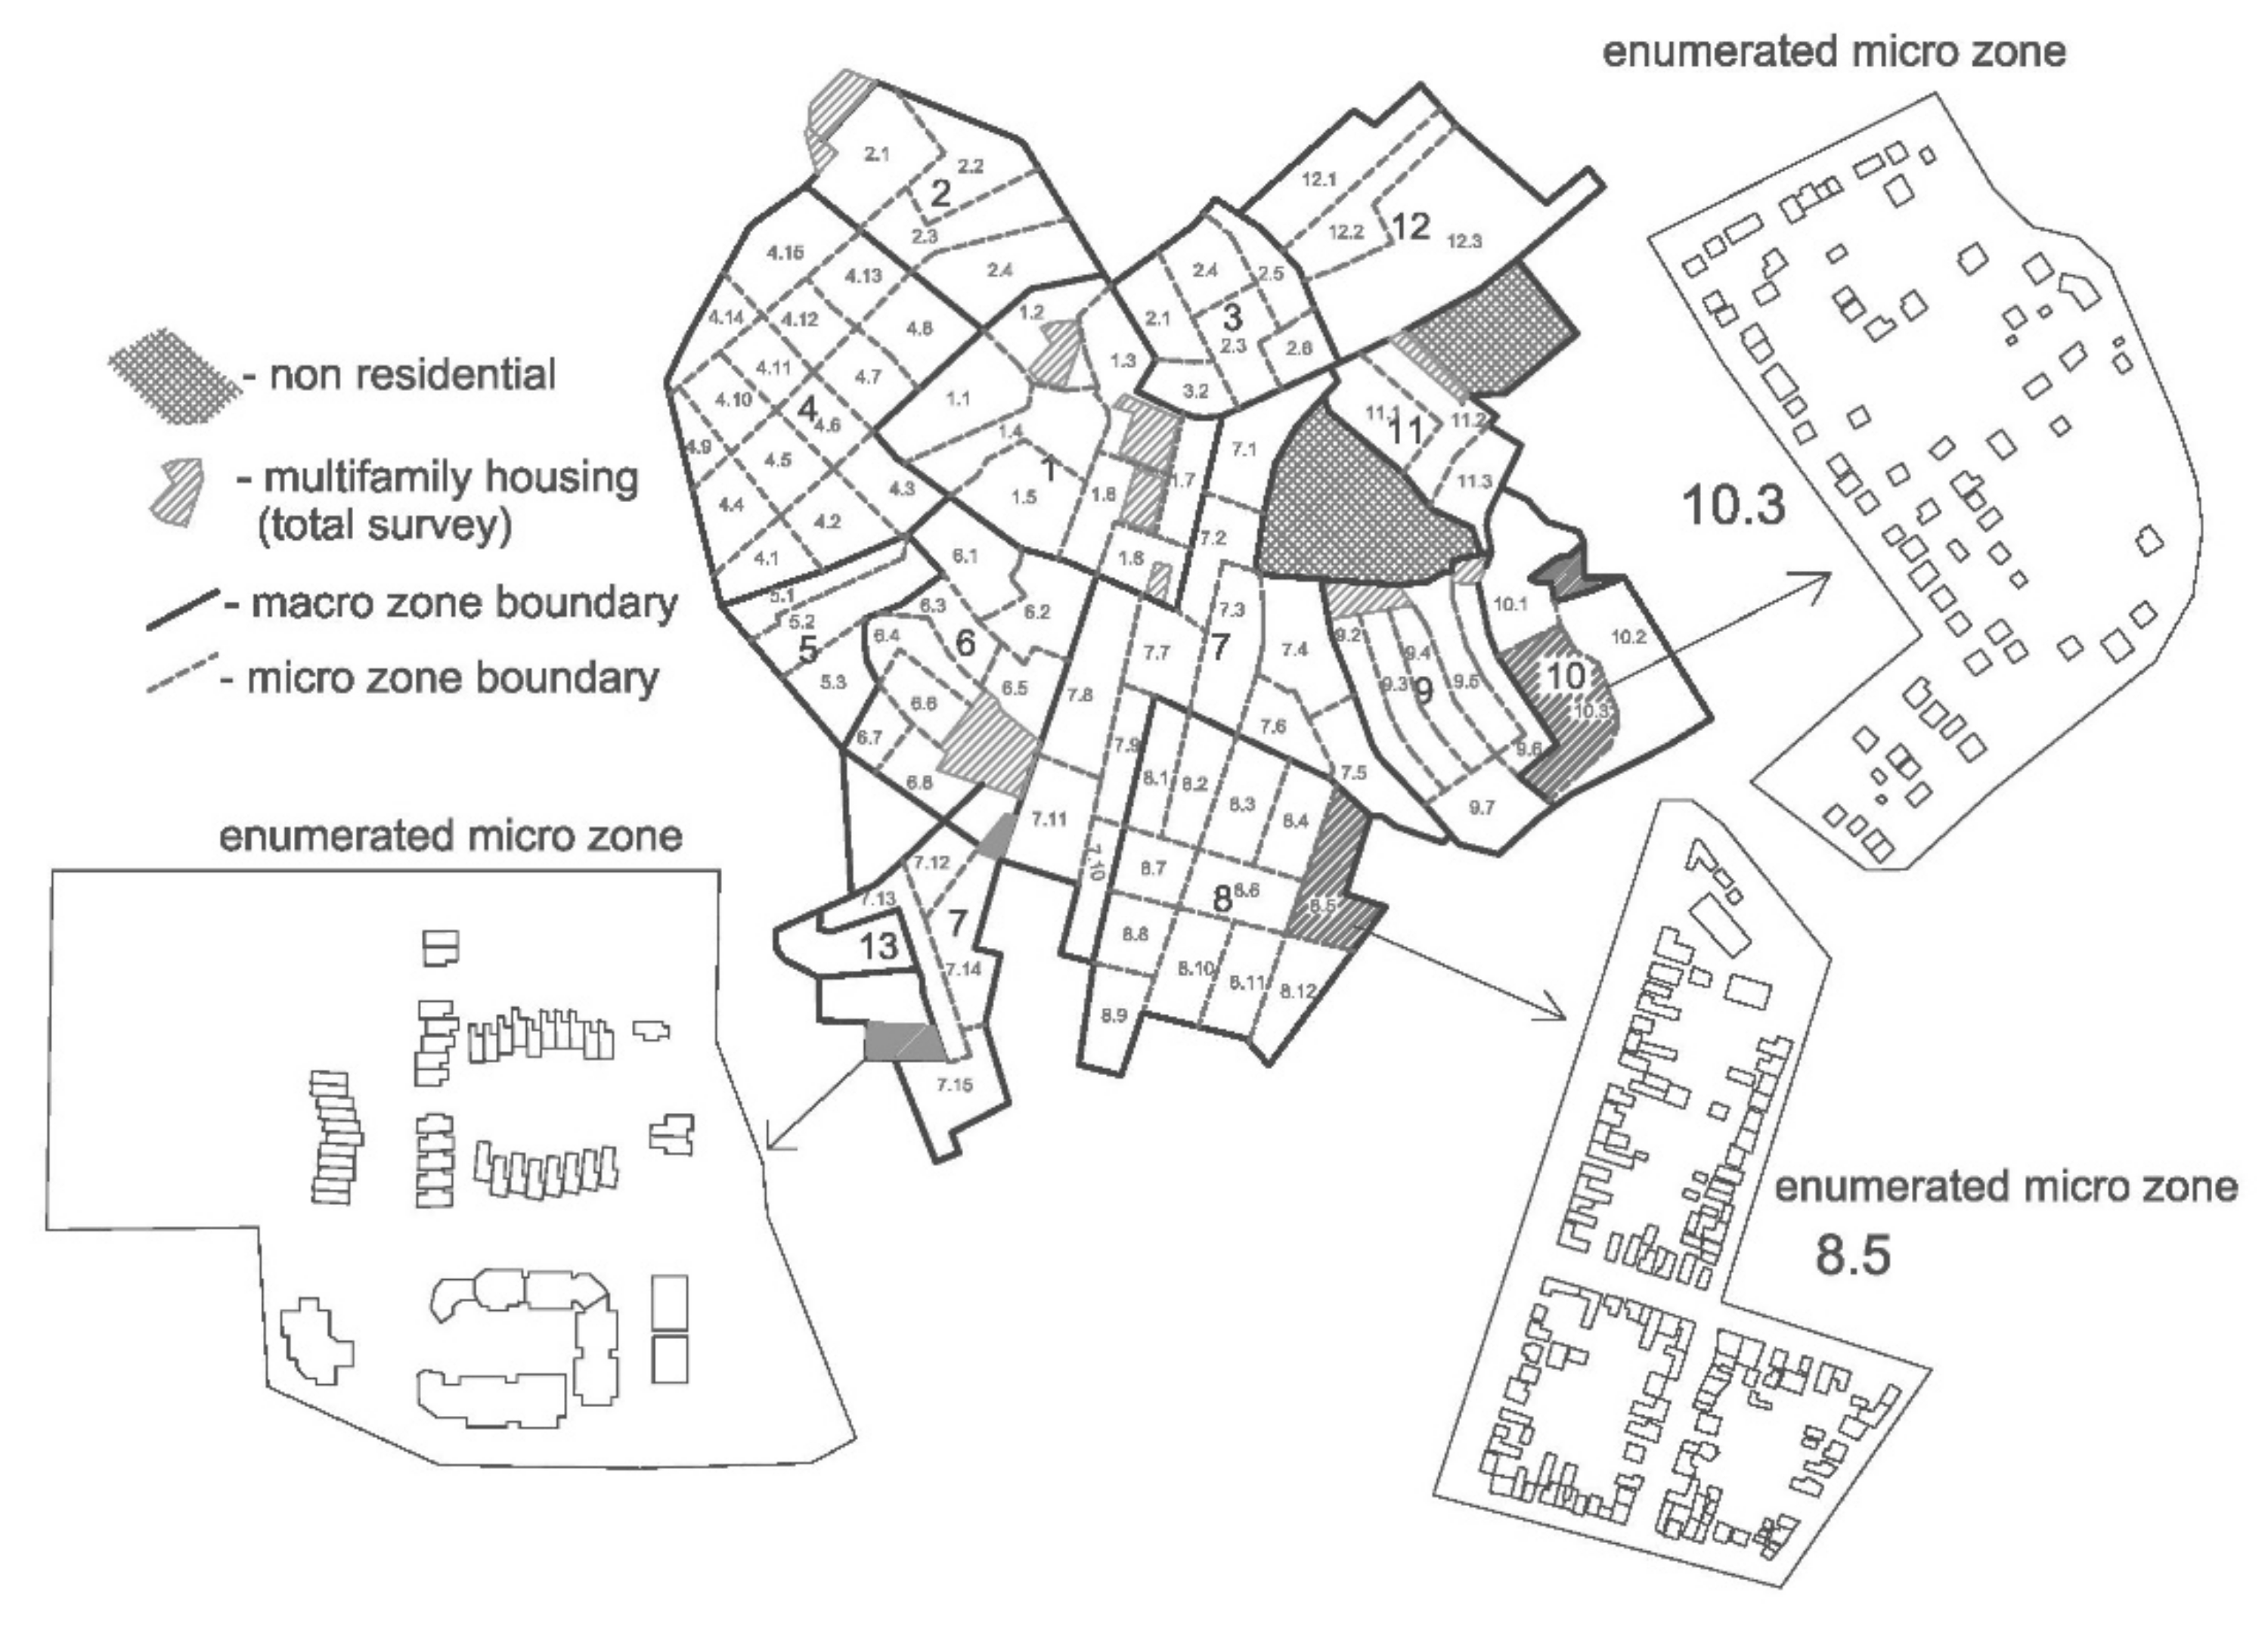
The creation of the sample is one of the most important steps in the implementation of a locally applicable typology method. Namely, in the relatively limited scope of research, it is necessary to achieve optimum results. To achieve this goal, a methodology of sample design was developed that connects the statistical principles of numerical relevance with urban and architectural characteristics of the buildings affecting their energy performance. The main question that always arises is how to select the sample that contains the necessary number of types, and enables their adequate representation and distribution? The developed method was based on the principle of two-step zoning of the research area. This procedure was based on information available from appropriate maps, planning documents, zoning used for the national census, and extensive knowledge of the examined area (importance of local expert in the team). The basic division was made on the macro and micro zones, as illustrated in
Figure 2.
Macro zones are defined as the parts of the territory (urban structure) with relatively homogenous characteristics, according to the basic generative parameters (age, type of construction), while the micro-zones form their substructure. The sizes of these zones may be different, but it is optimal to have from 1000 to 2000 buildings in one zone, ideally about 1200. The number of this macro zone can vary depending on the complexity of the physical structure of a specific urban territory. The basic recommended ratio between the number of zones and the size of the building stock is given in
Table 2.
Zones must be spatially and visually recognizable and adequately graphically marked in the appropriate map. Drawing scale of the map should be adjusted to the level in which all forms of physical structure (buildings) are identifiable, together with their urban lots. The process of zoning is primarily derived by building type, but different zones can contain similar building types and differ by other parameters: age, size, type of construction. In other words, although, for example, in some areas, individual family housing is the prevailing building type, age or other typological features (e.g., number of floors, materials, type of the construction, etc.) may be totally different and it is necessary that these features are taken into account properly when determining micro zone divisions.
In the next step, after defining the macro zones, is their segmentation and the definition of micro zones that can later immediately be inventoried. The main criterion for the formulation of micro zones is their internal uniformity in terms of size, followed by the spatially recognizable area. The size of the micro zone is determined by the number of buildings that need to be enumerated in standard time for this type of work during the census, which is in practice usually a period of two days. Expressed by the number of buildings, each micro zone should have 70–100 buildings, which corresponds to the basic criterion adopted in defining census zones in the national census.
A further work procedure involves the entire enumeration of a certain number of micro zones within one macro zone. All the buildings in the chosen micro zone are enumerated regardless of the fact that some of them do not belong to the basic, dominant type. The number of zones that are completely enumerated depends on the size of the macro zone and is related to the number of micro zones within one macro zone. The necessary number of enumerated micro zones is given in
Table 3.
2.2.3. Data Collection Method
Data collection method and the method of enforcing survey are very important for further data processing. As previously stated, two-stage methodology of data acquisition has been applied. In practice, it means that in the first round, all buildings in the chosen micro zone are surveyed, while in the second round, based on the randomly defined starting point, a smaller predefined number of buildings is surveyed in more detail. For both levels, it is necessary to prepare adequate questionnaires and to perform training of the enumerators. Data collection in the first level is done by visual observation, while in the second round through interviews with building owners or representatives of the house committee (in case of multi-family buildings). Type of collected data should cover all the important issues for assessing the present energy performance of the building, installed technical systems, and refurbishment activities. The main generative parameters that are identified are explicating: age, building type, building layout (compactness), size and number of floors, type of the roof construction and its usage, types of windows and doors (material, glazing), type of the façade (by material), and conducted refurbishment activities.
The results collected for selected micro zones are multiplied by the number of micro zones within one macro zone. In this way, weighting (scaling) of the results is done and their “blow up” to a larger frame (macro zone) is conducted, thus allowing statistical “transition” from a smaller to bigger spatial level.
Statistical evaluation of the collected data is the basis for determining the characteristics of future generating features of model buildings. The model buildings, as has previously been described, are formulated by the implementation of cluster analysis, which uses the listed parameters as generative factors. In order to make the procedure easier for implementation, the main classification was formed according to the age and building type (principle adopted from TABULA), while further segmentation was the result of the clustering process. Cluster groups have been limited to five in order to make the process faster and easier for implementation.
This practically means that within a specified construction period and one urban type of building, maximum five groups of buildings are defined that should be typical, according to defined generating parameters. In this methodology, special caution is needed when two clusters (set of buildings) are of equal size, where it is then necessary to take into account other building sets obtained for the period. Other building type characteristics should be further checked through cluster analysis, and if any significant deviation from the types from the national typology is ascertained, local representatives should be determined.
A summary of the energy characteristics of the local building stock, according to the bottom-up methodology, involves calculating all the possible new representative buildings according to current legislation and combining their energy parameters with buildings from the national typologies that have the same characteristics as local representatives.
3. Results
Both methods described in the previous section have been tested as a case-study pilot project in the town of Vršac. The municipality of Vršac is a typical representative of a “middle size” city in Serbia with a population between 40–60,000 inhabitants (12% of the total number of municipalities), having at the same time distinct urban and rural areas with locally characteristic building types. Like other similar size municipalities, Vršac has an unequal distribution of population with 36,040 inhabitants in urban and 15,986 inhabitants in rural settlements. Other relevant data are presented in
Table 4.
3.1. Application of Top-Down Method
Matrix formulation based on a top-down method is largely based on the expert evaluation of existing data. In the case of the municipality of Vršac, there was an insufficient number of analyzed buildings in the database used in the process of defining the national typology, which are, at the same time, characterized by uneven distribution of the sample. This number of listed buildings (220) does not represent a valid statistical sample for municipality of Vršac. The diversity of the expected data was also highlighted in the national survey where the results were split for rural and urban parts of the municipalities and the process of data collecting was adjusted accordingly. When the results of the national survey conducted for the TABULA project are taken into account, it can be concluded that individual residential buildings represent the biggest part of the building stock in total, and in rural areas, they represent almost 100%. Thus, in the rural sector, the results from the national typology can be considered as valid and accurate, while in multi-family housing, it is necessary to perform additional analysis.
By applying the top-down methodology including all the data from available sources that could be gathered for the Vršac residential building stock, a typological matrix can be formulated (shown in
Figure 3, conjoined with the bottom-up method derived matrix). The chosen buildings, which were considered and later analyzed in terms of energy performance, were selected based on two different criteria. Due to the extremely large share of individual housing in the overall structure of the building stock, representative threshold was determined by the distribution in the number of units, while for multi-family buildings, the representative threshold was determined by the distribution in area. In this way, a diversity of types is achieved and disproportion between the number of buildings from typological forms in rural and urban areas harmonized.
It can also be concluded that the matrix was still very complex, and that in relation to the national, differed only in two fields, while the category of high-rise buildings was eliminated completely and merged with the multi-family sector. For few buildings in the matrix that are considered to be locally relevant, new performance and improvement calculations were performed while all other buildings were taken over from the national typology. The definition of improvement levels that were used in the analysis of potential savings and CO2 emissions reduction at the municipal level are methodologically defined within the TABULA project.
3.2. Application of Bottom-Up Method
For the town of Vršac, the sample size was defined with 1300 buildings plus 144 stratums (total fund) of multi-family buildings for a total of 1444 buildings in the sample. The territory was divided in 18 macro zones, further segregated into 118 micro zones (6.6 per macro zone on average). This means that 18 randomly selected micro zones were directly surveyed, plus the entire stratum of multi-family housing. All selected micro zones were surveyed in the first round, while a detailed inventory that comprised every fifth building was conducted in the second phase.
Matrix definition is based directly on the correlation of the sample size and cluster analysis applied to certain parameters. If the number of 1300 surveyed buildings in Vršac is projected onto the total estimated number of buildings of 10,199 by cluster analysis for the construction period, the distribution presented in
Table 5 can be derived.
According to the years of construction, it can be concluded that the distribution is uniform. This means that the survey uniformly covered all periods with appropriate statistical relevance. On the other hand, when the type of construction and number of buildings are analyzed (
Table 6), we see a completely different result. The sample, as expected, gives an excellent representation for individual buildings and is relatively small for multi-family buildings.
As for the top-down method, it is necessary to define generative thresholds of validity in total distribution, in order to reduce the matrix to a reasonable, locally relevant level. This means, in practice, that it is necessary to eliminate types with very small representation. The elimination of types that have very little relevance is an expert assessment based on the analysis of distribution data, whether by number of buildings or by building area. It was concluded that for Vršac, this threshold should not exceed 1.5%. In this way, the typology is reduced to a smaller, locally relevant number of types that are easily managed in detail in further analysis, with no loss of representativeness in the final results. By applying the above principles, the matrix is reduced to 15 types, as shown in
Figure 3 (building types presented in intense color). A similar approach for locally relevant buildings was applied as in the top-down method.
3.3. Comparison of the Results of Two Applied Methods
Finalization of the building type matrix is performed by overlapping the national and Vršac matrix. Energy performance characteristics of locally relevant buildings (above the set threshold) were taken from the data obtained in the local survey while others originated directly from the national typology. The operation was carried out in order to obtain a more precise summary data at the municipal level in order not to bring into question the relevance of the chosen statistical threshold. By observing the final matrix (
Figure 3), we can see that all building types exist, which might not be the case in other municipalities. If that is the case, the same fields can be empty and filled neither with local representatives nor types from the national typology.
In the final matrix, locally and statistically relevant reference types, defined through bottom-up methodology, are presented in intense color while those that would be considered as statistically non-relevant are in gray scale (
Figure 3). The lower pair of numbers (grey cells) represent distribution resulting from assessment by the bottom-up method, while the upper pair of numbers represent distribution resulting from the top-down method.
This final matrix somewhat contradicts the bottom-up methodology and its logic of reducing the number of building types to a smaller number, but can be considered as more accurate in the context of energy performance assessment of local government.
The difference between the two approaches, top-down and bottom-up, can be presented by direct comparison of the results of the methodological approaches and developed matrixes, through the comparison of obtained results, shown through distribution data for every building type in
Figure 3. At first glance, the imprecision of top-down methods can be seen, and its dependence on the available data does not always provide a realistic picture of the situation on the ground. Some types that exist in the matrix, in this methodology, do not at all appear as relevant in the bottom-up approach (C4, D4, E4, F4, A3, B3). For those types, where a large sample is available, all the data are almost identical, which only confirms the methodological characteristics and accuracy of both approaches. On the other hand, some types are represented in a similar manner in both methodologies (C1, D1, E1). For these types, which both have great local and national representativeness, some more complex improvement scenarios should also be investigated, taking into account their more detailed characteristics [
39,
40].
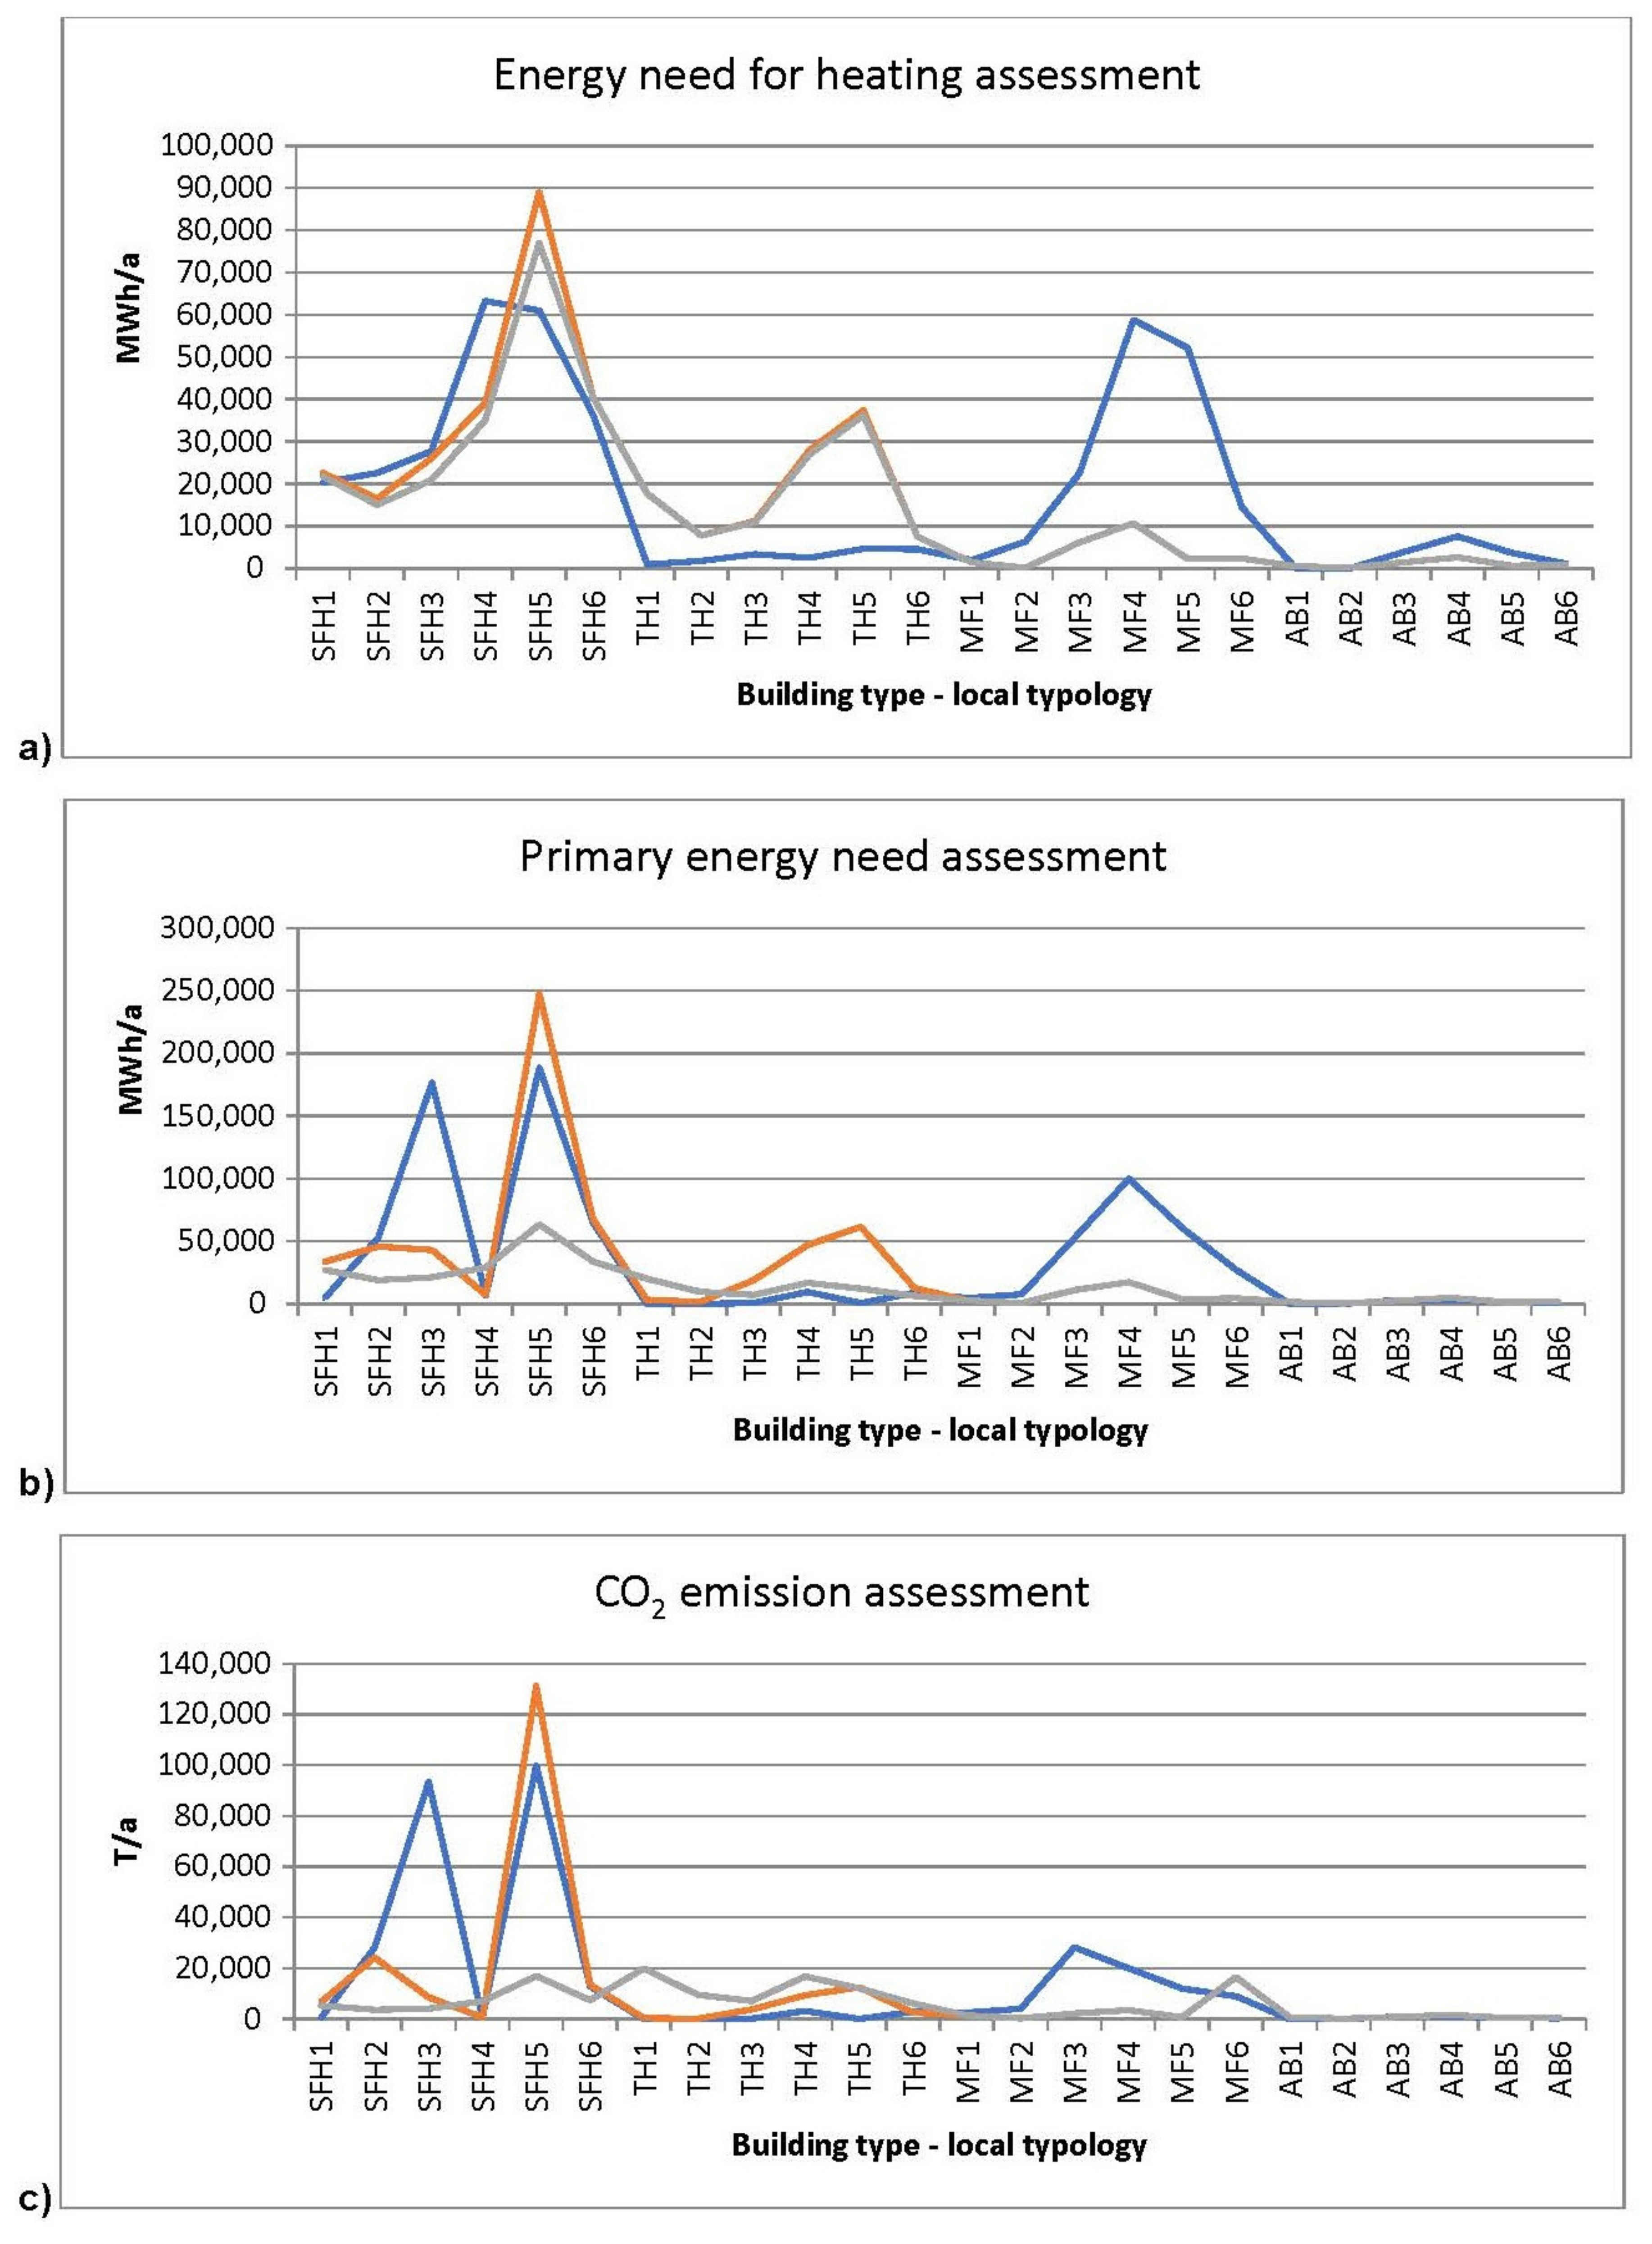
As illustrated in
Figure 4, different results of energy assessment at the municipal building stock level can be obtained by different methods. Three different assessment methods were investigated:
It can be seen that for the assessment of energy need for heating (
Figure 4a), which depends solemnly on the characteristics of buildings, both the top-down and bottom-up methods gave similar overall results. Significant differences appeared with building types whose distribution was over/under assessed in some of the methods. This was the case with terraced houses, as a locally relevant type, whose distribution was underassessed by the top-down method, and with multi-family housing types, whose distribution was over assessed by the top-down method. Building types with major (SFH) and minor (AB) representation showed similar results in all three models. It can be seen that two different bottom-up models gave similar trendlines due to low overall refurbishment rates, especially in multi-family housing stock.
Assessment of primary energy and CO
2 emissions at municipal level (
Figure 4b,c) greatly depends on the structure of energy carriers and assessment of heating systems in use. Great discrepancies can be noticed between the bottom-up model which includes data on refurbishment rates and breakdown of energy carriers for each building type, and two models which do not include these data. These discrepancies are greatest within single family housing types, because of the large diversity in the structure of heating systems and of energy carriers in use.
These theoretical values can also be adjusted by information that can be gathered during the bottom-up method of typology development through questionnaire design. As refurbishment rates do not exist in available statistical data and cannot be easily determined and can significantly influence the calculations and projections, for the purpose of the pilot project in municipality of Vršac, they were derived through inquiry in the bottom-up methodology. The refurbishment rate for each building type was determined as a combination of identified refurbishment actions (window replacement, facade insulation, attic slab insulation, etc.) influencing the initial projections of the energy performance for the entire stock by inducing 10% of savings.
In addition, detailed information on the structure of energy carriers and heating systems in use per each building type were not available in the national typology, but were obtained through questionnaires designed in the bottom-up method. This enabled more realistic projections of trends in the substitution of energy carriers per each building type through the definition of improvement scenarios, as previously published studies [
41] have shown that it is impossible to target significant savings, especially in CO
2 emissions, without properly addressing this issue.
These gathered data enabled the definition of some basic building stock modeling projections, taking into account all relevant building stock segments (new construction, demolition, refurbishment, remaining part) and improvement scenarios, for the purpose of defining possible levels of savings up to 2030 and 2050. These projections are published as the results of local pilot actions in eight European countries [
42].
4. Discussion
In summary, it can be said that in order to obtain more accurate results, which can be considered as a basis for strategic decision-making for the local municipalities, the bottom-up methodology is more applicable, while the top-down method can be used when it is needed to perceive the basic status of the building stock in a local government.
Based on all of the above-mentioned, a fundamental question about the benefits and limitations of the presented methodological approaches to the formation of local typologies has arisen. It can be concluded that the characteristics of both modes and methods are relatively similar, with certain specifics.
The basic features of a top-down approach are:
Methodologically simple, same approach regardless of size and complexity;
Depending on the level of data availability, and their precision;
Dependent on the technical expertise and experience of the research team conducting the preparation of typology;
Less involvement of local experts;
Lower costs and shorter development period, and
Less accurate final results.
The basic characteristics of a bottom-up approach are:
It is necessary to define the individual methodological approaches depending on the size and complexity of the municipality;
Less dependent on the degree of data availability;
Research team in the field is necessary in order to collect data;
Dependent on the engagement and training of local researchers;
Dependent on the size and type of the sample,
Higher costs and a longer period of production, and
More accurate and better results.
5. Conclusions
This paper presents a methodology for the development of local building typologies for the purpose of the energy performance evaluation and refurbishment action planning of building stock as part of the formulation of local action plans. For this purpose, two methods were developed and tested: a top-down approach, and a bottom-up method. Both methods were tested on the municipality of Vršac as part of the pilot project for the EPISCOPE project.
Results of the analyses showed that the top-down approach was methodologically simpler, and did not differ based on the complexity and size of the local building stock. On the other hand, as it relies on available resources in terms of statistical data on building stock, it strongly depends on their availability and precision and usually provides less accurate final results, but with lower costs and in shorter development period.
The bottom-up approach has to be formulated individually for each municipality based on defined rules in census design (census type, sample size), as the basis for this approach is a local survey. Thus, it is strongly dependent on the engagement of local experts, and requires a longer development period and more resources. However, not only does it provides more accurate and better results, but it can also provide data that cannot be gathered by other methods such as information on refurbishment rates and the structure of energy carriers and heating systems per defined building type, which significantly influence calculations of the current energy performance of the building stock. Additionally, it influences the definition of measures for their improvement, and projections of building stock energy performance after their application. Upon its definition and testing in Vršac, this method has been applied in the creation of the typology of residential buildings in Bosnia and Hercegovina [
43], which only confirms its universal applicability.
The developed methodology is suitable for application on a local level for small or mid-size municipalities, which often have a diverse and uneven distribution of building stock and can be applied internationally for the purposes of the estimation of building stock energy performance and strategic planning.


 ,
, 


