Article

Can Market Reforms Curb the Expansion of Industrial Land?—Based on the Panel Data Analysis of Five National-Level Urban Agglomerations

College of Land Management, Huazhong Agricultural University, No. 1 Shizishan St., Hongshan District, Wuhan 430070, China
*
Author to whom correspondence should be addressed.
Sustainability 2021, 13(8), 4472; https://doi.org/10.3390/su13084472
Submission received: 12 March 2021 / Revised: 5 April 2021 / Accepted: 6 April 2021 / Published: 16 April 2021
(This article belongs to the Section Resources and Sustainable Utilization)

Abstract

:
As China entered marketization in the late 1980s, it soon established a market economy system and implemented tax-sharing reforms. Driven by the marketization, local governments have rapidly developed the economy under the pressure of fiscal competition caused by the reform of the tax-sharing system. Industrial land is an important factor of local economic development, and it enables local governments to invest heavily in the industrial sector to promote economic development, leading to urban expansion. In order to shed light on the relationship between the market reforms implemented by the Chinese government and the expansion of urban industrial land, this paper used the data of 77 prefecture-level cities in China’s five national-level urban agglomerations as research samples from 2007 to 2018. We first constructed the marketization rate of industrial land (MIL) and used the panel data model to examine whether China′s market reform will curb the expansion of industrial land. The results showed that: (1) land market reform can restrain the scale of industrial land expansion, and the impact is different in different urban agglomerations; (2) under the effect of marketization, foreign direct investment (FDI) has restrained the expansion of industrial land to a certain extent. The amount of industrial investment (AII), the ratio of secondary industry to GDP structure (RSG), and the number of industrial enterprises (NIE) will aggravate the expansion of industrial land. We suggest that the Chinese government should deepen the reform of land marketization and develop a differentiated land market mechanism. It is also necessary for local governments to develop stock land, improve the efficiency of industrial land use, increase the investment in advanced technology, and improve the intensive utilization of industrial land. The research provides a reference for other countries in the world that are developing in a transitional period to restrain unlimited land expansion and save land resources in the process of economic development.

1. Introduction

Since the establishment of a market economy in the late 1980s, China has entered the era of high-speed industrialization, and industrial development has entered the middle and late stages of industrialization [1,2]. China’s total industrial output value has increased by more than 250% from the end of the 1990s to 2013 [1,2]. The rapidly developing industrial economy has promoted the rapid expansion of the spatial scale of urban industrial land, urban industrial parks are blooming everywhere, and the area of urban industrial land has expanded rapidly [2]. In 2016, the total area of urban industrial land in China reached 10,250.60 square kilometers [2], an increase of 5409.06 square kilometers over the area in 2000 [3]. The rapid expansion of urban industrial land has produced a series of negative externalities while meeting the needs of urban economic development [4,5,6,7,8]. A large number of the industrial land developed has led to the conversion of the cultivated land, which is accompanied by some serious negative social and ecological impacts, such as the loss of farmland, decline of rural areas, reduction of biodiversity, and emergence of ecological degradation. A large amount of industrial land expansion may also cause problems such as disordered land use, idle land, and a low plot ratio of land use, leading to increasingly prominent human–land conflicts. As early as 1962, American economist Kenneth Boulding proposed that only by rationally developing and efficiently using resources and protecting the environment can mankind develop the ability to coordinate economic, social, and resource-environmental development [9,10,11,12,13].
At present, China′s industrial development has always been in an extensive model with more land input and less output, but there is still a gap between China′s overall industrial output value and those of developed countries. The large amount of developed industrial land has led to an imbalance in the ratio of land use structure. According to available research data, the proportion of industrial land in central areas of foreign cities generally does not exceed 10% of the urban area, while the proportion in China is 21.79% [14,15], far exceeding the international average.
Industry is the backbone of China’s national economic development. China is currently in a period of economic transformation; with the advancement of the market economy, China′s industrialization has achieved considerable industrialization achievements, which has greatly promoted China′s industrialization process. Due to the advantages of some traditional factors, such as low labor, land, resource, and environmental costs, China has begun to give priority to the development of labor-intensive industries, establish industrial parks, attract foreign investment, and continuously carry out capital accumulation and industrial upgrading. The development of China′s industrialization has transformed it to a market-oriented Lewis model, allowing it to enter a stage of comprehensive acceleration. In the process of marketization, China has successfully used its advantages of sufficient labor at low prices to make up for its inherent capital shortage and technical supply constraints. It implemented an industrialization model based on low wages and land input as the core. China is accelerating the implementation of its industrialization development strategy. As China′s secondary industry, the importance of industry to economic development is self-evident. As one of the important elements of industrial development, industrial land is the basic condition for industrial development. In the current situation where urban industrial land is becoming increasingly tense, industrial land use is extensive, the investment intensity is low, the unit output value is not high, some industrial land has been idle for a long time, and there is a prominent imbalance in industrial land supply and demand. The following have become urgent problems in the process of China′s economic development: the way in which to revitalize the urban industrial land stock and reduce new increasing industrial land expansion; transforming industrial land from extensive expansion to intensive development; gradually improving the efficiency of industrial land utilization; realizing the economical and intensive utilization of industrial land [2,3,14,15,16]. In order to solve this problem, the Chinese government has formulated a series of land policies [17], including land market reforms.
China′s land market is divided into primary and secondary land markets. The former refers to the government as the land owner, and the government transfers the land use rights to land users through allocation, agreement, lease, bidding, auction, listing, or other transfer methods. It is the first allocation of urban land in China. The latter refers to a series of transaction activities between land users after land users obtain the land use rights, and it is the re-allocation of land use rights in the primary land market. The biggest difference in China is that the former is controlled by local governments, while the latter is a transaction between land users in a fully competitive market economy. The industrial land market involved in this paper was limited to the above-mentioned primary land market. This study defined the payment reform of industrial land marketization as the optimization of the transfer method of industrial land in the primary land market, that is, the increase in the proportion of the transfer method of “bidding, auction, and listing” [2,3,14,15,16].
The marketization of industrial land in China has been slow. Before 2004, industrial land in China was basically supplied through allocation or agreement transfer. On 23 December 2006, the Chinese government issued the “National Minimum Price Standard for the Sale of Industrial Land,” which determined the minimum control standard for the transfer price of industrial land use rights in cities and counties. From 2007, China has implemented the policy of “bidding, auction, and listing” for industrial land transfers across the country, and the market-oriented reform of industrial land had officially begun [2,3,14,15,16,17]. The original intention of the land market reform was to optimize the allocation of land resources by introducing market mechanisms to achieve the sustainable use of land resources. Strengthening the construction of the land market and improving the role of the market mechanism in the allocation of land resources are important measures to promote the intensive use of land in China and reduce the unlimited extension of land. Can the land market reform policy formulated by the Chinese government effectively save and intensively use industrial land, curb the expansion of industrial land, and realize the sustainable use of land resources?
China’s marketization is a system reform from a planned economy to a market one. It is a series of system changes concerning the economy and society. In this process, China has successfully transformed from a backward agricultural country to an industrial country. Industrial production has shifted from relying on low-cost industrial land inputs to the introduction of foreign capital investment, from factor-driven and investment-driven to service industry development and innovation-driven [18]. The increasingly serious problems of resources, the environment, and social security have turned into a path of sustainable development. In the 1970s and 1980s, not only China but also East Asian countries such as Malaysia, Thailand, Indonesia, and the Philippines almost invariably carried out similar institutional reforms [19,20]. The governments of these countries have successively carried out market-oriented reforms, realizing the transition from a controlled economy to a market system. Therefore, studying the impact of China′s marketization process on the expansion of industrial land can provide a reference for these developing countries.
In order to answer the above questions, this paper selected the 2007–2018 data of 77 prefecture-level cities in the five national-level urban agglomerations in China as the research areas. Based on the analysis of the impact mechanism of the land market reform on the expansion of industrial land, we calculated the marketization rate of industrial land (MIL) in each prefecture-level city through the “bidding, auction, and listing” policy of land transfer through market reform. Then, we determined the statistics on the scale of industrial land expansion in each prefecture-level city, Finally, the panel data model was used to verify whether the land market reform will inhibit the expansion of industrial land. The research results of this paper are expected to provide a certain theoretical basis and practical reference for the land market reform in other regions of China. It can also provide a reference for other countries in the world that are developing in a transitional period to restrain unlimited land expansion and save land resources in the process of economic development, and achieve sustainable development.

2. Theoretical Framework and Hypothesis

2.1. Theoretical Analysis

The way in which to give full play to the maximum value of resources and meet the greatest needs of mankind with limited resources is to focus research on resource allocation. Neoclassical economics believes that the market mechanism plays a leading role in the allocation of resources, and the optimal allocation of resources is realized through the market [21,22,23]. The market is an effective way and an important means of resource allocation [24]. In the operation of a market economy, the allocation of resources is accomplished through changes in price signals. Market prices can reflect the relationship between supply and demand. Under competitive conditions, prices can guide resources to flow to those with higher evaluations, thereby realizing the improvement of allocation efficiency. The “Pareto Optimality” of the market itself that can be achieved by different degrees of marketization is different, and the corresponding market resource allocation efficiency is different [25,26,27]. Under perfect market conditions, the market has the characteristics of symmetry information. Compared with the planned allocation of resources, the full role of the market mechanism can effectively reduce transaction costs. The effective operation of the market mechanism can achieve the Pareto optimum of resource allocation. That is, resources are efficiently allocated. The efficient allocation of resources means that in the economic operation, the marginal input–output rate of production factors is highest. In the production process, more output can be obtained with less input, and resource consumption can be reduced, that is, reduce the input of industrial land in production and restrain the expansion of industrial land [25,26,27].
The famous economist Robert Solow (1924) proposed a neoclassical growth model, which holds that a labor surplus will attract capital to combine with it to create economic growth in an open market economy. This model does not take land into consideration as an important factor of production, which reflects the decline in land factor input in the market-oriented post-industrial era [22].
The most direct impact of China’s market reform is the price change of industrial land. According to the theory of price-induced technological progress, the change in factor price as an inducing factor explains how the change in factor price affects the factor input and technological progress in the economic production system. The price changes of production factors make enterprises carry out factor substitution and increase the input of innovative resources, leading to factor input changes and production process innovation or technological progress [27,28,29,30,31,32]. Market-oriented reforms have caused changes in the prices of industrial land. The price changes of industrial production factors have caused enterprises to substitute factors and increase the input of innovative resources during production, thereby gradually reducing the input of industrial land and restraining the expansion of industrial land [27,28,29,30,31,32].

2.2. Conceptual Framework and Research Hypotheses

In China, the status of land use is mainly affected by the local government and the land user. Combining the above analysis, this paper explains how the land market reform affects the expansion of industrial land from the local government and land user [24,25,26,27,28,29,30,31,32,33].
The subject of resource allocation is related to the efficiency and fairness of resource allocation. The local government′s behavior, the supplier of industrial land, will affect the status of land transfer and resource allocation. In 1994, China implemented a tax-sharing system reform, redefining the distribution of financial resources between the central and local governments, and the domestic product value (GDP) growth became the main basis for the performance evaluation of local governments, which led to intensified competition among local governments. In fact, China′s regional economic growth is mainly driven by investment from local governments and investment promotion. Under tremendous financial pressure, local governments have adopted various ways to attract foreign direct investment (FDI) and expand public expenditures to promote economic growth. The most direct way is to provide cheap land, labor, and various preferential policies to reduce the prices of production factors, attracting enterprises to enter and helping the capital inflow. The land transfer system before the land market reform provided tools and conditions for this purpose [27,28,29,30,31,32,33,34,35,36,37].
According to China′s current legal system, the local government is the only supplier in the land transfer process. In order to attract investment and promote the economic development of the region, the local government uses the low-cost or even free transfer of industrial land to attract investment, set-up industrial parks or development zones in remote areas of the city, and use the cheap or even free transfer of industrial land and other preferential policies. During this period, local governments pursued GDP growth and reduced transaction costs, cheap land became the main production input factor in economic development, a large number of new industrial land has been developed in the suburbs of cities, and the total industrial land has expanded rapidly (Figure 1).
Until the introduction of the price mechanism in the land market reform, the minimum control standard for the transfer price of industrial land use rights was clarified. This measure increased the transparency of government land transfers and reduced low-price land transfer methods such as auctions. Local governments used to rely heavily on the behavior of selling land at low prices to attract FDI, and this behavior has been restricted and the phenomenon of land finance has decreased. In the process of marketization, the advanced production technology caused by foreign investment has gradually replaced the production model that invested a large amount of cheap land elements. Local governments began to use advanced technology and capital investment to replace the previous production model that relied on a large amount of low-cost land input. The land market reform has changed the local government′s past development model of “using land for development” that relied on land finance to drive the economy, and the spread of industrial land has been improved. At the same time, market-oriented reforms have promoted the development of the local economy. With the development of the economy, advanced production technologies have led to the free flow of production factors, the restructuring and transfer of industrial structures, and the gradual decline in the proportion of the secondary industry and the steady rise in the tertiary industry. As the external benefits of learning, sharing, and matching caused by the development of the tertiary industry are becoming increasingly obvious, this will cause a large inflow of resources such as population and labor. The increase and agglomeration of the urban population has promoted the demand for commerce and housing, and the corresponding industrial land (residential land and commercial land) demand has further increased, which has led to a relative decrease in the supply and demand of urban industrial land. This will also inhibit the expansion of industrial land (Figure 2).
The driving force for the allocation of market resources comes from the self-interested behavior of the enterprise to pursue the maximum profit. From the perspective of the demand side of industrial land, it comes from the land user. The price of industrial land transfer was low before the land market reform, in order to reduce production costs, and industrial land users uses large amounts of cheap industrial land to replace other advanced production factors, such as capital and technology. Cheap acquisition costs have led to the extensive use of industrial land. In addition, a large amount of industrial land is inefficiently used and industrial land is expanding in a disorderly fashion (Figure 1).
The “bid, auction, and listing” supply method after the land market reform has gradually revealed the price mechanism in the process of land transfer [28]. The most direct impact of the market-oriented allocation of industrial land is the increase in its price. This will lead to a substantial increase in the cost of industrial land users acquiring it.
With the continuous improvement of the degree of land marketization, the market value of land has become increasingly obvious. At this time, the increase in land prices will drive land users to use other relatively cheap production factors to replace land, thereby generating a substitution effect, promoting the intensive use of land, and reducing land expansion. In the market economy, the essence of land users engaged in economic production is to maximize profits [22,23,24,25,26,27]. In order to obtain higher land use benefits, industrial land users tend to carry out a series of reforms to reduce land production costs when land prices rise and production costs increase, including optimizing the land use structure, increasing the concentration of labor capital, increasing production technology innovation, and increasing infrastructure investment to promote industrial-scale upgrading and structural transformation [27,28,29,30,31,32,33,34,35,36,37,38]. These measures economize on the use of industrial land, optimize the efficiency of industrial land resource allocation, and improve the efficiency of industrial land use, thereby reducing the investment demand for new industrial land and reducing the scale of industrial land expansion. In the process of marketization, foreign investment has fostered advanced technology, and land users have optimized resource allocation by increasing advanced foreign capital investment. By substituting the capital input for land input, advanced capital is input to replace a large area of land input for the extensive production mode, and the land use mode transforms to an intensive type of low input and multiple output. In the process of industrial production, land users have reduced their demand for industrial land, thereby reducing the scale of new industrial land and restraining the expansion of industrial land (Figure 2). Based on the above analysis, this paper proposes Hypothesis 1:
Hypothesis 1.
Payment land transfer instead of free allocation in China’s land market reform drives up urban land prices and forces land demanders—local governments and urban developers—to take the land expenditure into account in production decision making. Thus, the market reform in China can reduce the demand and curb the expansion of industrial land.
China has a vast land area with significant heterogeneity in different regions. Under the combined effect of natural conditions and national regional economic development strategies, China′s economic development is showing regional imbalances. The economic development level of the eastern urban agglomeration on the east coast is much higher than that of the central inland urban agglomeration. The difference in economic development led to significant differences in the regional GDP, total import and export volume of foreign-invested enterprises, and local fiscal tax revenue. For example, the investment direction has a great tendency, and enterprises are more inclined to invest capital and technology in urban areas with a greater development potential and faster investment results. These differences will further cause the adjustment of the industrial structure and affect the demand for new industrial land area [37].
At the same time, these differences in the level of economic development directly affect the effectiveness of the land market reform. The difference in the level of economic development leads to different degrees of impact of the land market reform on the input–output of industrial land, and the demand for new industrial land in the production process is different.
Marketization has led to the cross-regional flow of factors such as labor and capital. The difference in the process of marketization will produce the “Matthew effect,” in which the strong are stronger and the weak are weaker.
On the other hand, different regions have different demands for reform, where regional heterogeneity leads to differences in the execution power of different local governments to promote land market reform policies, and the supporting measures for policy implementation are also different. Since the reform and opening up, China′s various policies have basically adopted a development method that gradually expands from the coast to the inland, and the promotion of land market reform is also the same. The economically developed eastern coastal areas took the lead in implementing the opening-up policy and the market economy system to attract a large amount of foreign investment and inject fresh vitality into the formation of industries and the upgrading of their industrial structure. The region is heavily influenced by market-oriented reforms, and it has implemented an economic development mode that relies on FDI and foreign trade. Economic development requires more resources, and industrial land is expanding rapidly.
Most of the enterprises in the eastern coastal city cluster are capital-intensive industries and machinery manufacturing industries with high added values, and they have a large demand for industrial land. With the advancement of market reforms, the industrial structure has been greatly optimized, and the demand for industrial land has increased accordingly. On the contrary, enterprises in underdeveloped areas are mostly labor-intensive enterprises, due to the small scale of the market, the low intensity of land market reforms, rising labor costs, the geographical inconvenience in the development areas that started late in development, that the economic benefits of industrial parks are not high, and that the scale of industrial land expansion is smaller than those in developed areas.
In the 1980s, the urban agglomeration of the Pearl River Delta used the preferential policies granted by the Chinese government in the process of market economy, combined with its unique geographical location, land and labor advantages, and external resources. An export-oriented rapid industrialization economic development model led by the local government was created, and an export-oriented economy “Pearl River Model” was formed. The impact of land market reforms on the expansion of industrial land in urban agglomerations will be greater than that of inland urban agglomerations (Figure 3).
Based on the above analysis, this paper puts forward Hypothesis 2:
Hypothesis 2.
Land market reforms in different regions have different effects on the expansion of industrial land.

3. Data and Methods

3.1. Research Area and Data

3.1.1. Research Area

This paper selected the five national-level urban agglomerations identified as particularly important national city agglomerations led by the National Development and Reform Commission of China, including the Yangtze River Delta urban agglomeration, the Pearl River Delta urban agglomeration, the Beijing-Tianjin-Hebei urban agglomeration, the Middle Reaches of the Yangtze River urban agglomeration, and the Cheng-Yu urban agglomeration. The figure of the study area was shown in Figure 4.
The research area covered 77 large, medium, and small cities along the coast and inland in eastern, central, and western China (due to missing data, five cities including Jiangmen, Xiantao, Tianmen, Qianjiang, and Yichang were not included in the research scope). (Figure 4).

3.1.2. Data Sources

The Ministry of Land and Resources of China stipulated that from 1 August 2006, China’s municipal and county-level government land authorities must announce in advance the transfer plan of each state-owned land use right on the China Land Market website (http://www.landChina.com, accessed on 7 July 2020). At the same time, it is necessary to announce the results of each land transfer later [39]. The data on the MIL and the data on the expansion of new industrial land studied in this paper are derived from the industrial land transaction data of each city in the “result announcement” column of the China Land Market website. The research obtained the results of 77 prefecture-level cities′ industrial land transfer transactions from 1 January 2007 to 31 December 2018, including the supply method of each industrial land, the local government, the specific location, and the corresponding new increase in industrial land supply area, transfer time, and other information. The remaining control variables in the study were from the “China City Statistical Yearbook” (2008–2019), the amount of industrial investment came from the wind database, and the total industrial output value for 2017–2018 was from the “Statistical Bulletin of National Economic and Social Development” of each city.

3.2. Research Method

3.2.1. Measurement of Marketization Degree

According to previous research [35,39], this paper uses the MIL to quantify the degree of marketization of industrial land. Based on the analysis of China′s land market structure, when calculating the degree of land marketization, it is recognized by many scholars that the area of land transferred by bidding, auction, and listing in the primary land market (number of cases) accounts for the total area of land supply (number of cases). This includes determining the level of urban land marketization through a static transaction structure, adopting the area proportion measurement method, and using “bid, auction, and listing area divided by total area for sales” as the measurement standard for the degree of industrial land marketization. This paper refers to Qian’s calculation formula [38]:
M I Q = BT a + AT a + LT a AL a + AT a + BT a + AT a + LT a + LE a + OLSW a
where M I Q is the marketization rate of industrial land calculated by quantity, a is the area, BT a is the bidding transfer of the area, AT a is the auction transfer of the area, LT a is the listing transfer of the area, AL a is the allocation of the area, LT a is the agreement transfer of the area, LE a is the lease of the area, and OLSW a are the other land supply methods of the area. Thus, the numerator is the sum of the area of industrial land for “bid, auction, and listing”, and the denominator is the total area of industrial land.
Existing research mostly uses the above specific marketization rate method, that is, the land area for bidding, auction, and listing divided by the total land transfer area to quantify the degree of land marketization reform. Based on the existing research, this paper also adopts the marketization rate of industrial land calculated by price, that is, the land price for bidding, auction, and listing divided by the total land transfer price to quantify the degree of land marketization reform, making the quantification of the marketization rate more scientific and more reliable.
M I P = BT p + AT p + LT p AL p + AT p + BT p + AT p + LT p + LE p + OLSW p
where M I P is the marketization rate of industrial land calculated by price, p is the price, BT p is the bidding transfer of the price, AT p is the auction transfer of the price, LT p is the listing transfer of the price, AL p is the allocation of the price, LT p is the agreement transfer of the price,   LE p is the lease of the price, and OLSW p are the other land supply methods of the price. Thus, the numerator is the sum of the price of industrial land for “bid, auction, and listing”, and the denominator is the total price of industrial land.

3.2.2. Industrial Land Input Coefficient: Total Price of Industrial Land Transfer/Domestic Product Value (GDP)

In order to explore whether the economic development model of the study area is a “land for development” model that relies on industrial land input to drive economic development, in this paper, we constructed an industrial land input coefficient, which calculated the ratio of the industrial land transfer price to GDP in the research area each year. If the ratio is larger, the economic development of the research area depends more on the land input, and vice versa.
I L E = AL p + AT p + BT p + AT p + LT p + LE p + OLSW p GDP
where I L E is the industrial land input coefficient, p is the price, BT is the bidding transfer, AT is the auction transfer, LT is the listing transfer, AL is the allocation, AT is the agreement transfer, LE is the lease, and OLSW   are the other land supply methods. That is, the numerator is the total price of industrial land, and the denominator is the total price of the domestic product value.

3.2.3. Test of the Mechanism of the Influence of Industrial Land Marketization on the Scale of Industrial Land Expansion

I L A s t = α 0 + α 1 M I L s t + β C s t + μ s t
where I L A s t represents the expansion area of industrial land in S area during   t period, and M I L s t is the MIL in S area during t period. In addition, this paper draws on the Cobb–Dauglas production function, introducing industrial labor input, capital stock, desirable/undesirable output, economic development level indicators, and other control variables   C s t   that affect the expansion of industrial land area. μ s t   represents the random error term.   α and β are the parameters to be estimated.

3.3. Variable Selection

3.3.1. Explained Variable: Scale of Industrial Land Expansion

This paper selects the newly added industrial land area of each prefecture-level city in the study area as an indicator of the scale of industrial land expansion.

3.3.2. Explanatory Variable: MIL

According to the previous research [38,39], the marketization level of industrial land in this paper is the data of each industrial land transfer in the city, including each industrial land bidding, auction, listing, agreement, and other transfer methods.

3.3.3. Control Variable

From the above theoretical analysis, we have selected the following eight variables that will affect the expansion of industrial land as control variables [39,40,41,42,43,44,45,46,47,48,49,50,51,52,53,54,55,56,57,58,59,60,61,62,63,64,65,66,67,68]:
We use the amount of industrial investment (AII) to represent the role of local governments in the expansion of industrial land, and the number of industrial enterprises (NIE) represents the behavior of land users. The output value of industry is divided into desirable output and undesirable output. The output of both will affect the scale utilization of industrial land. At the same time, the economic development level will affect the scale of industrial land investment under the effect of marketization.
On the basis of the input–output in the Cobb–Douglas production function and related scholars’ research on land expansion factors, this paper selects the per capita GDP (PCG) and the ratio of secondary industry to GDP structure (RSG) as indicators of the economic development level. FDI, the number of employees in the secondary industry (NES), IFA, and the NIE are capital investment indicators; the total industrial output value (IOV) is the desirable output indicator of industrial production; the industrial waste discharge (IWD) (industrial wastewater, industrial sulfur dioxide, and industrial smoke and dust) is the undesirable output indicator of industrial production (UOI). The description of variables used in the paper are shown in Table 1.

4. Research Results

4.1. Measurement of the MIL

4.1.1. The Marketization Rate of Industrial Land Marketization by Quantity (MIQ)

Through calculations, as shown in Table 2, from the implementation of the industrial land marketization reform from 2007 to 2018, the overall MIQ of the five major national urban agglomerations showed an overall upward trend, from 0.381 in 2007 to 0.975 in 2018. The increase was relatively large, and the overall MIQ of the five national urban agglomerations was already high. (Table 2).
From a regional perspective, the situation of each urban agglomeration is basically the same as the overall situation of the five national urban agglomerations. The industrial land marketization rate by quantity also increases with the year. In 2007, the maximum value of the MIQ was 0.500 of that of the Cheng-Yu urban agglomeration, and the minimum value was 0.150 for the Pearl River Delta urban agglomeration. In addition, for the current research period, the maximum value for the Pearl River Delta urban agglomeration′s MIQ was 0.998 in 2018. It can be seen from the result that during the study period, the MIQ of the Pearl River Delta urban agglomeration increased most, while the MIQ in other urban agglomeration also increased to a higher level.
The study found that, regardless of the overall level of the five national urban agglomerations or the regional level, the year in which the MIQ increased most during the study period was 2008, which was the first year after the implementation of the industrial land marketization reform policy, where local governments were more enthusiastic about reforms and made greater efforts to implement central government policies.

4.1.2. The Marketization Rate of Industrial Land Marketization by Price (MIP)

Through calculations, Table 3 shows that from the implementation of the industrial land market reform from 2007 to 2018, the overall MIP of the study area has also shown an upward trend, from 0.416 in 2007 to 0.895 in 2018. The overall degree of marketization has been very high. From a regional perspective, the situation of each urban agglomeration is also basically the same as the overall situation of the five national urban agglomerations. The MIP also increases with the year. In 2007, the maximum value of the MIP was 0.572 for the Cheng-Yu urban agglomeration, and the lowest value was 0.180 for Pearl River Delta urban agglomeration. It is not difficult to find that the results of the two calculations of the MIQ and MIP tend to be consistent. (Table 3).

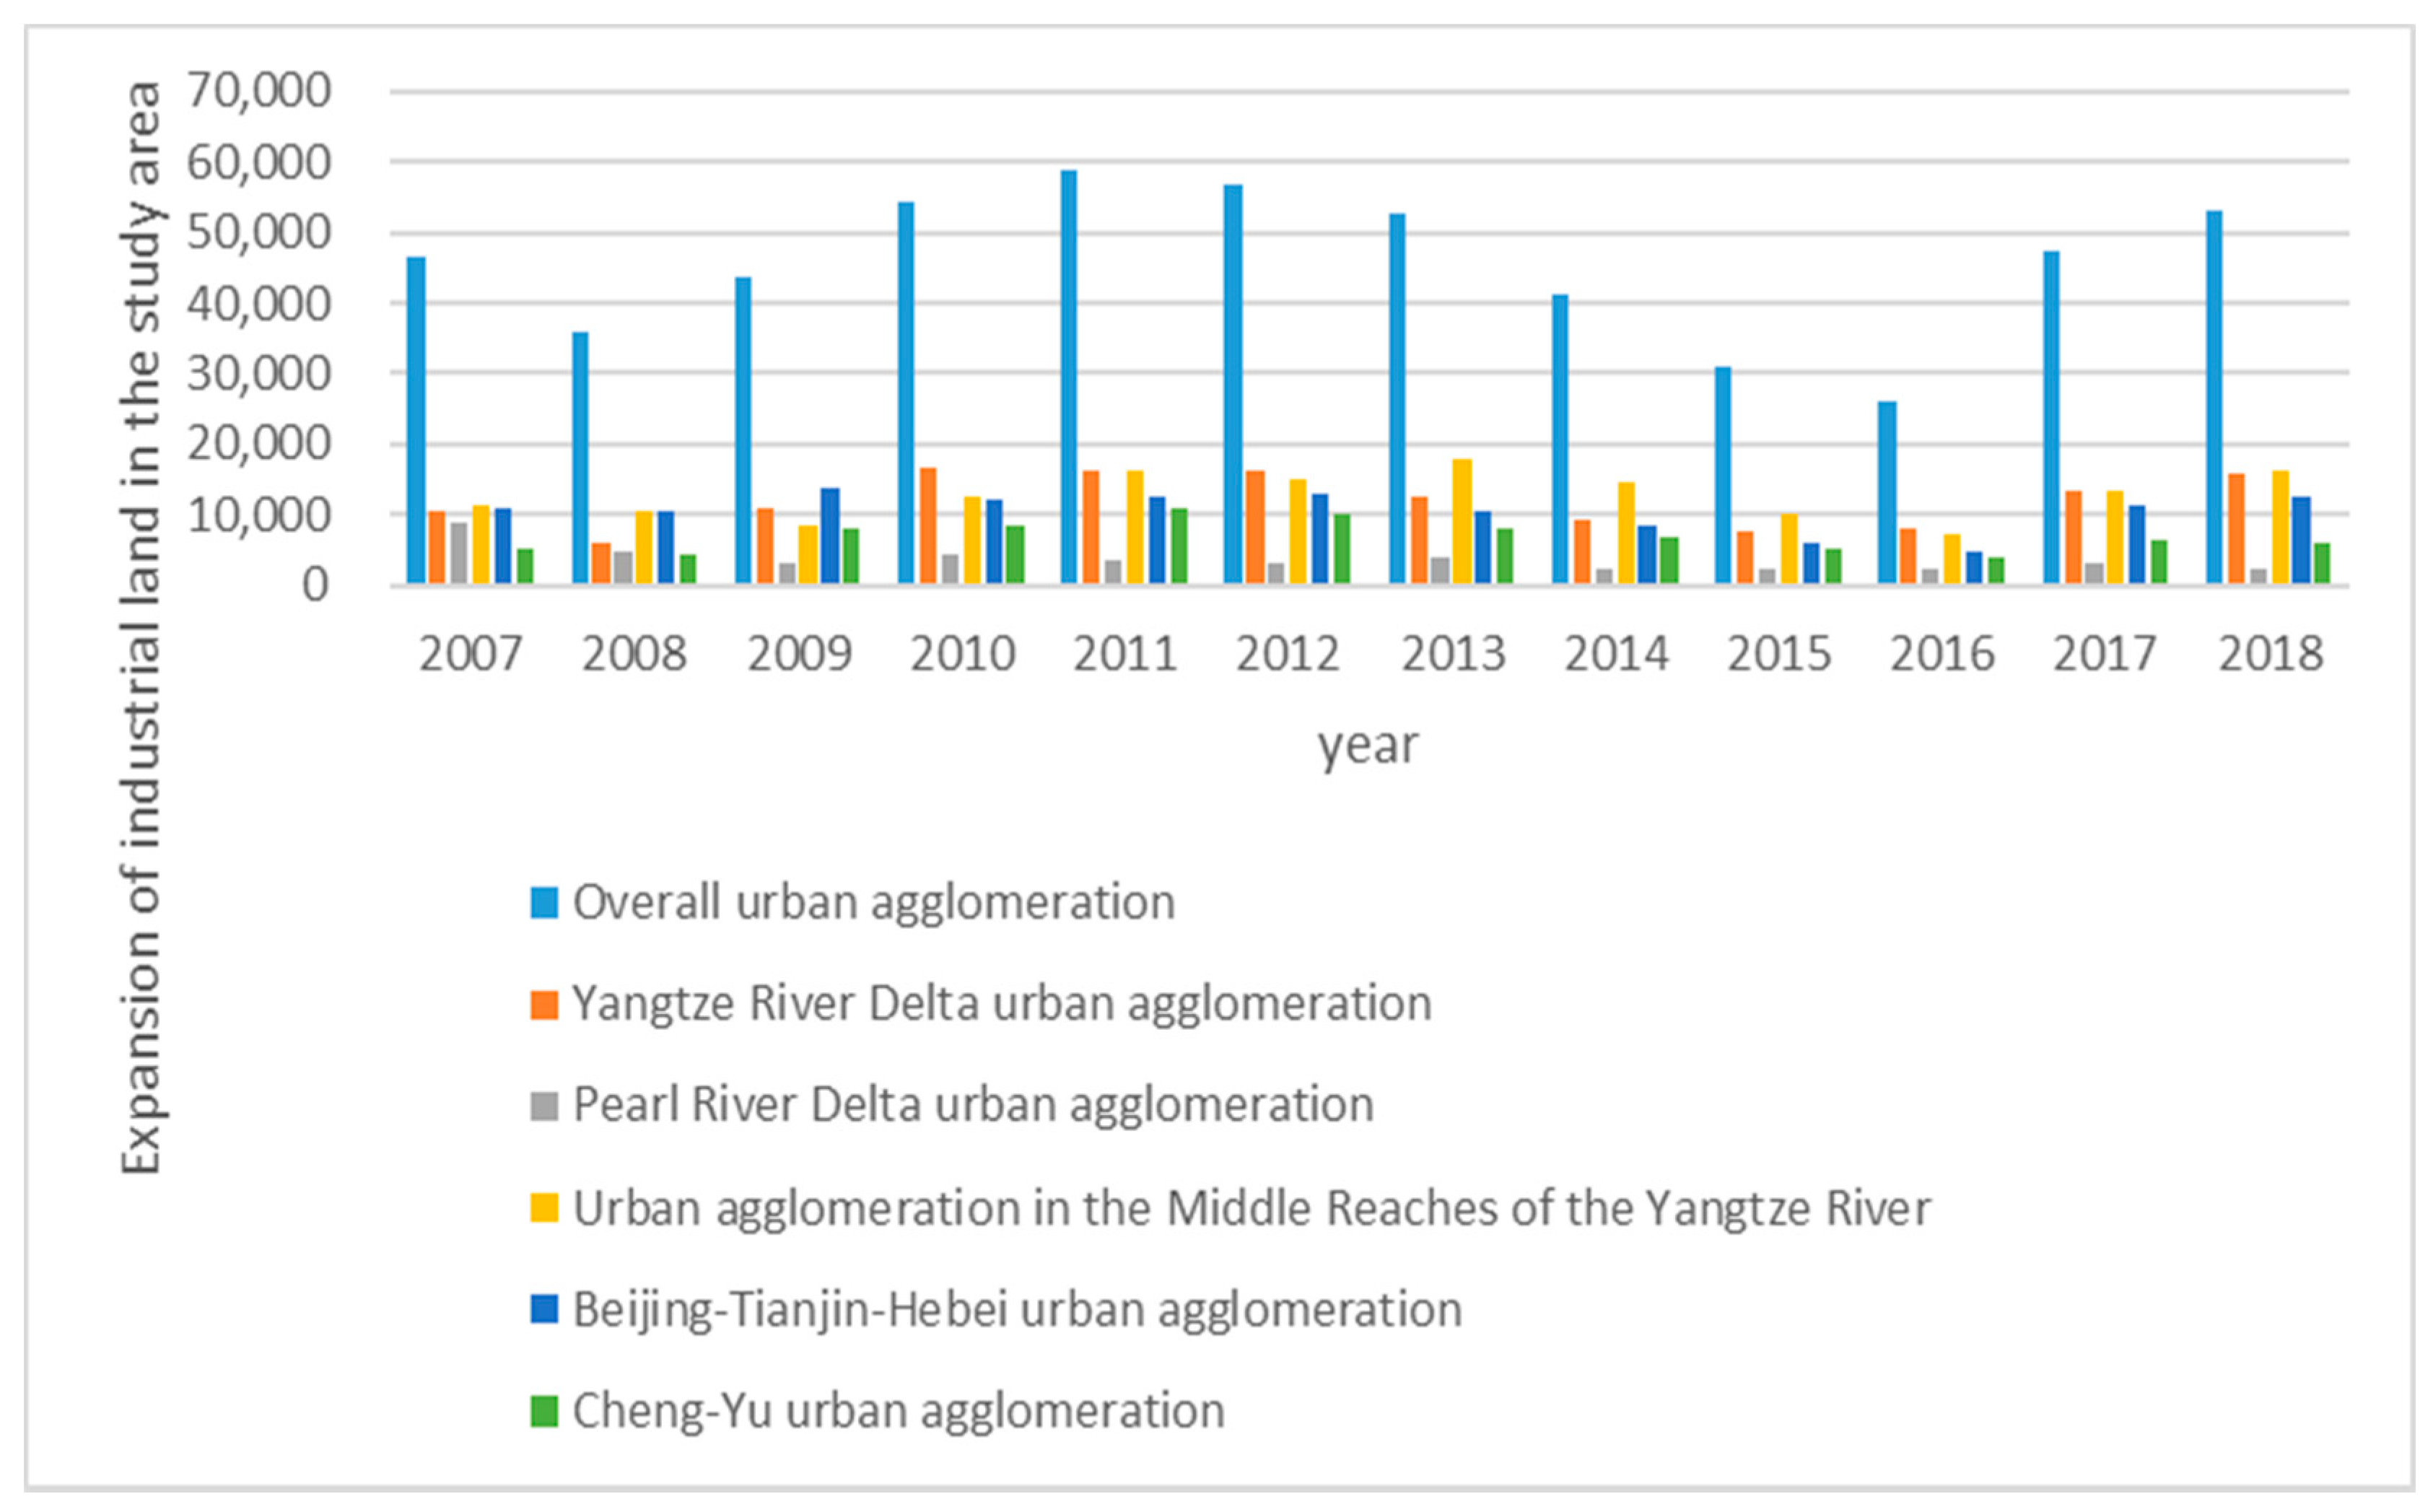
4.2. Newly Added Industrial Land Area (Expansion Scale of Industrial Land) in the Study Area

According to statistics, as shown in Figure 5, with the total of the five national urban agglomerations, the area of the newly added industrial land in urban agglomerations in the five major countries increased and decreased with the year from 2007 to 2018, expanding from 46,498.20134 hectares in 2007 to 53,257.99354 hectares in 2018, showing “N “type.
Among them, the year with the largest newly added industrial land area appeared to be 2011, with an area of 59,010.08236 hectares, whilst the year with the smallest newly added industrial land area appeared to be 2016 with 25,872.38404 hectares. In terms of regions, the expansion of industrial land in each urban agglomeration is basically similar to the overall situation of the five national urban agglomerations, which also changes with the year. The largest change in the area of industrial land was in the Pearl River Delta urban agglomeration, which dropped from 8880.188531 hectares in 2007 to 2453.931652 hectares in 2018. The Cheng-Yu urban agglomeration expanded from 5170.293459 hectares in 2007 to 6157.6787557 hectares in 2018, with the smallest change.

4.3. Result of Land Input Coefficient

We found that the overall industrial land input coefficient of the five national urban agglomerations of the study area increased from 0.052 in 2007 to 0.216 in 2018, increasing with the year, indicating that the economic development level of the study area depends to a certain extent on land investment. From a regional perspective, the situation of the five major urban agglomerations is consistent with that of the total of the five national urban agglomerations. The coefficient of industrial land input has risen year by year, and the region also relies on land investment to drive economic development to a certain extent. However, regardless of whether it is the total of the five national urban agglomerations region or the single agglomeration, the industrial land input coefficient is relatively small, indicating that China′s economic development does not rely to a large extent on the input factor of industrial land. These results are shown in Table 4.

4.4. Validation Results of the Impact of MIL on the Scale of Industrial Land Expansion

According to the results of panel data model testing, there is no multicollinearity between the respective variables. The Hausman test result rejects the random effects model, so this paper chooses the result of the fixed effects model as the model estimation result. The MIQ and MIP land have the same effect on the expansion of industrial land.
At the overall level of the five national urban agglomerations, both the industrial land marketization rate by quantity and industrial land marketization rate by price have significant effects on the scale of industrial land expansion, and the regression coefficient is negative, indicating that the industrial land marketization reform can restrain the scale of industrial land expansion. The land market reform implemented by the Chinese government can restrain the expansion of industrial land and improve the utilization efficiency of industrial land, which is consistent with hypothesis 1 of this paper. Among the eight control variables, the industrial land marketization rate by quantity and industrial land marketization rate by price have slightly different results on the scale of industrial land expansion. Looking at the results of industrial land marketization rate by price, the regression results of the four control variables of the RSG, FDI, AII, and the NIE on the scale of industrial land expansion are significant. Among them, the regression coefficients of the three control variables of the RSG, AII, and NIE are positive, indicating that these three variables will aggravate the scale of industrial land expansion. The increases in RSG, NIE, and AII have increased the demand for new industrial land, which in turn, have led to the expansion of industrial land. These are in line with China’s current development level and further prove the reliability of this paper. The regression coefficient of the FDI is negative. We analyzed this because the efficient business management method and advanced technologies of foreign companies have promoted the transformation of the industrial development mode, have changed the extensive land use model, and have established the method of saving and intensive land use, thereby reducing the demand for new industrial land and restraining the expansion of industrial land. From the results of the industrial land marketization rate by quantity, the control variable of AII did not pass the significance test, and the results of other control variables are consistent with the effect of the industrial land marketization rate by price.
At the level of individual urban agglomerations, there is also a slight difference between the industrial land marketization rate by quantity and the industrial land marketization rate by price on the scale of industrial land expansion. Looking at the result of the industrial land marketization rate by price, the results of the Pearl River Delta urban agglomeration and the Yangtze River midstream urban agglomeration are consistent with the results of the total of the five national urban agglomerations, and the marketization reform of industrial land can restrain the expansion of industrial land. In addition, the regression coefficient of the urban agglomerations in the coastal developed Pearl River Delta is greater than that of the land urban agglomerations in the middle reaches of the Yangtze River, indicating that the marketization rate of industrial land in the coastal Pearl River Delta urban agglomeration inhibits the expansion of industrial land to a greater extent than the inland urban agglomeration in the middle reaches of the Yangtze River, which is consistent with research hypothesis 2 proposed in this paper. The regression results of the Yangtze River Delta urban agglomeration, the Beijing-Tianjin-Hebei urban agglomeration, and the Yangtze River middle-reach urban agglomeration did not pass the significance test and were not statistically significant. Among the control variables, the five controls of the RSG, FDI, NIE, IOV, and UOI all play a certain role in the expansion of industrial land, but the impact of each urban agglomeration is different. From the results of industrial land marketization rate by quantity, the results of the Pearl River Delta urban agglomeration and the Chengdu-Chongqing urban agglomeration are consistent with the results of the total of the five national urban agglomerations, and the reform of industrial land marketization can inhibit the expansion of industrial land. The regression results of the Yangtze River Delta urban agglomeration, the Yangtze River midstream urban agglomeration, and the Beijing-Tianjin Hebei urban agglomeration did not pass the significance test and were not statistically significant. These results are shown in Table 5 and Table 6.

5. Conclusions and Policy Implication

5.1. Conclusions

This paper selected 2007–2018 data from 77 prefecture-level cities in five national-level urban agglomerations in China as the research sample. During the analysis of the impact mechanism of the land market reform on the expansion of industrial land, through the market-oriented reform of the land transfer “bidding, auction, and listing” policy, the MIQ and MIP in each prefecture-level city were calculated, and the scale of industrial land expansion in each prefecture-level city was measured. Then, the panel data model was used to verify whether the land marketization reform would curb the expansion of industrial land. The research results show that the marketization of industrial land can curb the expansion of industrial land, and the land market reform implemented by the Chinese government can curb the expansion of industrial land and improve the utilization efficiency of industrial land. Under the effect of marketization, the efficient enterprise management method and advanced technology of foreign enterprises can promote the industrial industry to change the development model, change the extensive land use mode, and establish the method of economical and intensive land use; thus, the FDI can reduce the demand for new industrial land and restrain the expansion scale of industrial land to a certain extent. On the contrary, the increase in the RSG, AII, and NIE can increase the demand of new industrial land, leading to the expansion of industrial land. At the same time, land market reforms in different urban agglomerations can have different degrees of impact on restraining the expansion of industrial land. During the study period, the MIQ of the Pearl River Delta urban agglomeration increased most, from 0.150 in 2007 to 0.998 in 2018. The area of industrial land also changed most, from 8880.188531 hectares in 2007 to 2453.931652 hectares in 2018. It further illustrates that the increase in the rate of MIL can curb the expansion of industrial land area, and it proves the research hypothesis of this paper that land marketization reform can restrain the scale of industrial land expansion.

5.2. Policy Implication

Industrial land is an important production resource for China′s economic development, an important driving force in the development of urbanization and industrialization, and it has an important impact on China′s sustainable development. The way in which to use land resources rationally and achieve a sustainable development model is one of the problems that developing countries in transition need to face together. Based on the analysis and conclusions of the research, this paper proposed the following measures to promote China′s land market reform, achieve the economical and intensive use of industrial land, restrain the expansion of industrial land, and realize the sustainable use of land resources.
First, the local government should deepen the reform of land marketization. China′s land market appeared relatively late, and the time for land market reform was relatively short; thus, the land market reform still needs further improvement [42]. Local governments must change the function of land as a growth engine, change the “land for development” model [33], continue to strictly implement the “bidding, auction, and listing” system, and reduce the proportion of allocations and negotiated transfers. The industrial land resources should also be optimally allocated in a fully competitive market environment. In addition, the idleness and waste of industrial land resources should be reduced, the market-oriented operation of industrial land and the efficient use of industrial land should be promoted, and the expansion of new industrial land should be reduced.
Second, it is necessary to set-up a differentiated land market development mechanism. As the government continues to deepen the reform of land marketization, it should formulate differentiated industrial land market development mechanisms based on local conditions, allocate industrial land indicators rationally, promote industrial land concentrations, form industrial clusters, and optimize industrial structure upgrades. At the same time, it should also take into account the actual conditions of different regions in the development stage, formulate and implement relevant supporting measures for market reforms, and improve the market mechanism′s ability to allocate land resources. Local governments should strive to change the excessive dependence on industrial industry and land finance in the process of economic development, completely change the past phenomenon that local governments arbitrarily increase the scale of industrial land investment in order to expand fiscal revenue, and promote the transformation of the economic development mode.
Third, local governments should pay more attention to tapping the potential of urban stock land, and they should support the development of the local economy by improving the allocation and utilization efficiency of stock industrial land, change the situation of idle land and the extensive use of land in the past, reduce the area of new industrial land, and curb unlimited urban sprawl.
Last but not least, in the process of using industrial land, it is necessary to increase investment in advanced technology and improve the intensive utilization of industrial land [69]. In the economic development of a developing country like China, it is necessary to completely change the extensive production model that relies on a large amount of industrial land to increase industrial economic development. By increasing technological input, you increase the output per unit area of industrial land and increase the industry intensive utilization of land, reducing the land input in economic production and saving land resources.

6. Discussion

This paper used the data of 77 representative prefecture-level cities in China’s five national-level urban agglomerations from 2007 to 2018 as a research sample. Through the market-oriented reform of the land transfer “bid, auction, and listing” policy, the MIQ and MIP of each prefecture-level city were calculated. The results of the two measurement methods of MIQ and MIP were the same, and through the panel data model, they verified that the land marketization reform can restrain the expansion of industrial land. In addition, the impact of land market reform in different urban agglomerations on restraining the expansion of industrial land is different. The research results of this paper are consistent with Gao et al. (2016)′s research [68], where the land market has a restraining effect on land expansion. The previous research is mostly about the expansion of construction land, but the innovation of this paper is that we use the research object of the role of industrial land that promotes the development of China′s industry. China′s industrial land is divided into three categories, including industrial land that is basically pollution-free, industrial land that has a certain interference and pollution to the environment, and industrial land that seriously interferes and pollutes the environment. The industrial land in this paper covers all the current types of industrial land in China. In terms of MIL measurement methods, we used both MIQ and MIP methods for measurement for the first time, making the results of MIL more objective. We also calculated the industrial land input coefficient and described the role of land as an input element in the process of economic development. The research results of this paper can provide a certain theoretical basis and practical reference for the land market reform in other regions of China. It also provides a reference for other countries in the world that are developing in a transitional period to restrain unlimited land expansion and save land resources in the process of economic development. Due to the unavailability of data, the research failed to grasp the impact of the land market reform in all prefecture-level cities in China on the expansion of industrial land. In addition, apart from the market-oriented reforms and the control variables in the paper, there may be other factors affecting the expansion of urban industrial land. These will be further probed in the future.

Author Contributions

A.Z. conceived and designed this study. W.P. wrote the paper. All authors have read and agreed to the published version of the manuscript.

Funding

Major Project of National Social Science Foundation of China (18ZDA054), National Natural Science Foundation of China (71873053).

Institutional Review Board Statement

Not applicable.

Informed Consent Statement

Not applicable.

Data Availability Statement

The author does not disclose research data online.

Acknowledgments

This research was supported by the Major Project of National Social Science Foundation of China (18ZDA054) and the National Natural Science Foundation of China (71873053).

Conflicts of Interest

The authors declare no conflict of interest.

References

  1. Xie, D. A study on the adjustment of administrative divisions during the rapid urbanization period. Mod. City Stud. 2009, 24, 82–87. [Google Scholar]
  2. Huang, H.; Li, Y.; Wang, Z. Research on the spatiotemporal evolution and influencing factors of ecological efficiency of industrial land in provincial cities in China based on super-SBM Model. Acta Ecol. Sin. 2020, 40, 100–111. [Google Scholar]
  3. Gao, W.; Ma, K.; Liu, H. Research on the evolution of industrial land conservation and intensive use policy since China’s reform and opening up. China Land Sci. 2013, 27, 37–43. [Google Scholar]
  4. Ustaoglu, E.; Silva, F.; Lavalle, C. Quantifying and modelling industrial and commercial land-use demand in France. Environ. Dev. Sustain. 2020, 22, 519–549. [Google Scholar] [CrossRef]
  5. Choy, L.; Lai, Y.; Lok, W. Economic performance of industrial development on collective land in the urbanization process in China: Empirical evidence from Shenzhen. Habitat Int. 2013, 40, 184–193. [Google Scholar] [CrossRef]
  6. Vandermeer, M.; Halleux, J. Evaluation of the spatial and economic effectiveness of industrial land policies in Northwest Europe. Eur. Plan. Stud. 2017, 25, 1454–1475. [Google Scholar] [CrossRef] [Green Version]
  7. Tu, F.; Yu, X.; Ruan, J. ILUE under government intervention: Evidence from Hangzhou, China. Habitat Int. 2014, 43, 1–10. [Google Scholar] [CrossRef]
  8. Chen, W.; Chen, W.; Ning, S.; Liu, E.; Zhou, X.; Wang, Y.; Zhao, M. Exploring the ILUE of China’s resource-based cities. Cities 2019, 93, 215–223. [Google Scholar] [CrossRef]
  9. Seager, T.; Theis, T. A taxonomy of metrics for testing the industrial ecology hypothesis and application to design of freezer insulation. J. Clean. Prod. 2004, 12, 865–875. [Google Scholar] [CrossRef]
  10. Singh, R.; Murty, H.; Gupta, S.; Dikshit, A. An overview of sustainability assessment methodologies. Ecol. Indic. 2012, 15, 281–299. [Google Scholar] [CrossRef]
  11. Kuznets, S. Economic growth and income inequality. Am. Econ. Rev. 1995, 45, 1–28. [Google Scholar]
  12. Xiao, S.; Huang, X.; Pu, L.; Chen, Y.; Chen, Z.; Zhao, D. Resource-saving society development comprehensive evaluation index system and its application: Taking Jiangsu Province as an example. Econ. Geogr. 2008, 01, 118–123. [Google Scholar]
  13. Ye, W.; Tong, C. Commentary on the United Nations Sustainable Development Index System. China Popul. Resour. Environ. 1997, 3, 83–87. [Google Scholar]
  14. Jia, H.; Huang, X.; Yu, S. Development and countermeasures of intensive use of industrial land in China. China Land Sci. 2010, 24, 52–56. [Google Scholar]
  15. Guo, G.; Ding, C.; Wang, Y. The impact of new urbanization on industrial land use efficiency: Theoretical framework and empirical test. China Land Sci. 2016, 30, 81–89. [Google Scholar]
  16. Zou, W.; Zhao, J.; Wu, Q. Research on the impact of land tenure tax on land use efficiency of industrial enterprises: Based on the survey of typical enterprises in Jiangsu Province. China Land Sci. 2014, 28, 60–67. [Google Scholar]
  17. Tian, L.; Ma, W. Government intervention in city development of China: A tool of land supply. Land Use Policy 2009, 26, 599–609. [Google Scholar] [CrossRef]
  18. Liu, Y.; Chen, J. Land system, financing model and industrialization with Chinese characteristics. China Ind. Econ. 2020, 3, 5–23. [Google Scholar]
  19. Krugman, P. The Myth of Asia’s Miracle. Foreign Aff. 1994, 73, 62–78. [Google Scholar] [CrossRef]
  20. Lin, Y.; Cai, F.; Li, Z. Comparative Advantage and Development Strategy—Reinterpretation of the “East Asian Miracle”. Chin. Soc. Sci. 1999, 5, 4–20+204. [Google Scholar]
  21. Syrquin, M. Productivity Growth and Factor Reallocation. In Industrialization and Growth; Chenery, H., Ed.; Oxford University Press: Oxford, UK, 1986. [Google Scholar]
  22. Hsieh, C.; Klenow, P. Misallocation and Manufacturing TFP in China and India. Q. J. Econ. 2009, 124, 1403–1448. [Google Scholar] [CrossRef] [Green Version]
  23. Roland, G. Transition and Economics: Politics, Markets and Firms; MIT Press: Cambridge, UK, 2000. [Google Scholar]
  24. Cai, F.; Wang, M.; Qu, Y. China’s industrial relocation and labor mobility trend. China Ind. Econ. 2009, 8, 5–16. [Google Scholar]
  25. Cai, F. How does China’s economic growth turn to total factor productivity-driven? Chin. Soc. Sci. 2013, 1, 56–71. [Google Scholar]
  26. Liu, K. How does the land system with Chinese characteristics affect China’s economic growth—An analysis based on the multi-sector dynamic general equilibrium framework. China Ind. Econ. 2018, 10, 80–98. [Google Scholar]
  27. Feng, J.; Lichtenberg, E.; Ding, C. Balancing act: Economic incentives, administrative restrictions, and urban land expansion in China. China Econ. Rev. 2015, 36, 184–197. [Google Scholar] [CrossRef]
  28. Li, J.; Qu, F. Research on the Impact of Land Market Reform on Intensive Use of Construction Land. China Land Sci. 2012, 26, 70–75. [Google Scholar]
  29. Acemoglu, D.; Finkelstein, A. Input and technology choices in regulated industries: Evidence from the health care sector. J. Political Econ. 2008, 116, 837–880. [Google Scholar] [CrossRef] [Green Version]
  30. Buera, F.; Kaboski, J.; Shin, Y. Finance and Development: A Tale of Two Sectors. Am. Econ. Rev. 2011, 101, 1964–2002. [Google Scholar] [CrossRef] [Green Version]
  31. Brandt, L.; Rawski, T. China’s Great Economic Trans Formation; Cambridge University Press: London, UK, 2008. [Google Scholar]
  32. Wang, X.; Zhang, L.; Xu, X. Local government land transfer, infrastructure investment and local economic growth. China Ind. Econ. 2014, 7, 31–43. [Google Scholar]
  33. Liu, S.; Wang, Z.; Zhang, W.; Xiong, X. The exhaustion of the “land for development” model: An empirical study based on the threshold regression model. Manag. World 2020, 36, 80–92. [Google Scholar]
  34. Lu, X.; Jiang, X.; Gong, M. How land transfer marketization influence on green total factor productivity from the approach of industrial structure? Evidence from China. Land Use Policy 2020, 95, 104610. [Google Scholar] [CrossRef]
  35. Wang, Q.; Chen, Z.; Ye, Y.; Huang, X. The Economic Driving Mechanism of Land Market Development: Theoretical and Empirical Analysis. China Popul. Resour. Environ. 2007, 3, 75–80. [Google Scholar]
  36. Zhou, L.; Tian, L.; Gao, Y.; Ling, Y.; Fan, C.; Hou, D.; Shen, T.; Zhou, W. How did industrial land supply respond to transitions in state strategy? An analysis of prefecture-level cities in China from 2007 to 2016. Land Use Policy 2019, 87, 104009. [Google Scholar] [CrossRef]
  37. Yang, Q.; Zhuo, P.; Yang, J. The bottom-line competition between the transfer of industrial land and the quality of foreign investment: An empirical study based on the panel data of prefecture-level cities in China from 2007 to 2011. Manag. World 2014, 11, 24–34. [Google Scholar]
  38. Qian, Z.; Mou, Y. China’s land marketization level: Measurement and analysis. Manag. World 2012, 7, 67–75. [Google Scholar]
  39. Tan, D.; Huang, X.; Chen, Z.; Wang, S.; Hu, C. Analysis of the degree of land marketization in China and its influencing factors. Urban Issues 2008, 1, 14–18. [Google Scholar]
  40. Qu, S.; Hu, S.; Li, W.; Wang, H.; Li, Q. Interaction between urban land expansion and land use policy: An analysis using the DPSIR framework. Land Use Policy 2020, 99, 104856. [Google Scholar] [CrossRef]
  41. Liu, Z.; Zhang, J.; Golubchikov, O. Edge-Urbanization: Land Policy, Development Zones, and Urban Expansion in Tianjin. Sustainability 2019, 11, 2538. [Google Scholar] [CrossRef] [Green Version]
  42. Liu, T.; Cao, G.; Yan, Y.; Wang, R. Urban land marketization in China: Central policy, local initiative, and market mechanism. Land Use Policy 2016, 57, 265–276. [Google Scholar] [CrossRef]
  43. Chen, B.; Wu, C.; Huang, X.; Yang, X. Examining the Relationship between Urban Land Expansion and Economic Linkage Using Coupling Analysis: A Case Study of the Yangtze River Economic Belt, China. Sustainability 2020, 12, 1227. [Google Scholar] [CrossRef] [Green Version]
  44. Xie, H.; Zhu, Z.; Wang, B.; Liu, G.; Zhai, Q. Does the Expansion of Urban Construction Land Promote Regional Economic Growth in China? Evidence from 108 Cities in the Yangtze River Economic Belt. Sustainability 2018, 10, 4073. [Google Scholar] [CrossRef] [Green Version]
  45. Li, X.; Wang, M.; Liu, X.; Chen, Z.; Wei, X.; Che, W. MCR-Modified CA–Markov Model for the Simulation of Urban Expansion. Sustainability 2018, 10, 3116. [Google Scholar] [CrossRef] [Green Version]
  46. Zheng, Q.; Wang, K.; Huang, L.; Zheng, Q.; Abubakar, G. Monitoring the Different Types of Urban Construction Land Expansion (UCLE) in China’s Port City: A Case Study of Ningbo’s Central City. Sustainability 2017, 9, 2374. [Google Scholar] [CrossRef] [Green Version]
  47. Xiong, C.; Tan, R. Will the land supply structure affect the urban expansion form? Habitat Int. 2018, 75, 25–37. [Google Scholar] [CrossRef]
  48. Wei, Y.; Li, H.; Yue, W. Urban Land Expansion and Regional Inequality in Transitional China. Landsc. Urban Plan. 2017, 163, 17–31. [Google Scholar] [CrossRef]
  49. Chen, J.; Gao, J.; Chen, W. Urban land expansion and the transitional mechanisms in Nanjing, China. Habitat Int. 2016, 53, 274–283. [Google Scholar] [CrossRef]
  50. Quan, B.; Bai, Y.; Romkens, M.; Chang, K.; Song, H.; Guo, T. Urban land expansion in Quanzhou City, China, 1995–2010. Habitat Int. 2015, 48, 131–139. [Google Scholar] [CrossRef]
  51. He, C.; Li, J.; Zhang, X.; Liu, Z.; Zhang, D. Will rapid urban expansion in the drylands of northern China continue: A scenario analysis based on the Land Use Scenario Dynamics-urban model and the Shared Socioeconomic Pathways. J. Clean. Prod. 2017, 165, 57–69. [Google Scholar] [CrossRef]
  52. Alice, C.; Yann, L.; Harold, L. What drives land take and urban land expansion? A systematic review. Land Use Policy Int. J. Cover. All Asp. Land Use 2018, 79, 339–349. [Google Scholar]
  53. Gao, J.; Wei, Y.; Chen, W. Economic transition and urban land expansion in Provincial China. Habitat Int. 2014, 44, 461–473. [Google Scholar] [CrossRef]
  54. Xu, J.; Wang, X. Reversing Uncontrolled and Unprofitable Urban Expansion in Africa through Special Economic Zones: An Evaluation of Ethiopian and Zambian Cases. Sustainability 2020, 12, 9246. [Google Scholar] [CrossRef]
  55. Kuang, W.; Liu, J.; Dong, J.; Chi, W.; Zhang, C. The rapid and massive urban and industrial land expansions in China between 1990 and 2010: A CLUD-based analysis of their trajectories, patterns, and drivers. Landsc. Urban Plan. 2016, 145, 21–33. [Google Scholar] [CrossRef]
  56. Wu, Y.; Dong, S.; Huang, H.; Zhai, J.; Li, Y.; Huang, D. Quantifying urban land expansion dynamics through improved land management institution model: Application in Ningxia-Inner Mongolia, China. Land Use Policy 2018, 78, 386–396. [Google Scholar] [CrossRef]
  57. Wang, Z.; Zhang, H.; Chai, J. Differences in Urban Built-Up Land Expansion in Zhengzhou and Changsha, China: An Approach Based on Different Geographical Features. Sustainability 2018, 10, 4258. [Google Scholar] [CrossRef] [Green Version]
  58. Li, Z.; Luan, W.; Zhang, Z.; Su, M. Relationship between urban construction land expansion and population/economic growth in Liaoning Province, China. Land Use Policy 2020, 99, 105022. [Google Scholar] [CrossRef]
  59. Wu, C.; Huang, X.; Chen, B. Telecoupling mechanism of urban land expansion based on transportation accessibility: A case study of transitional Yangtze River economic Belt, China. Land Use Policy 2020, 96, 104687. [Google Scholar] [CrossRef]
  60. Yan, Y.; Ju, H.; Zhang, S.; Jiang, W. Spatiotemporal Patterns and Driving Forces of Urban Expansion in Coastal Areas: A Study on Urban Agglomeration in the Pearl River Delta, China. Sustainability 2020, 12, 191. [Google Scholar] [CrossRef] [Green Version]
  61. Luo, J.; Zhang, X.; Wu, Y.; Shen, J.; Shen, L.; Xing, X. Urban land expansion and the floating population in China: For production or for living? Cities 2018, 74, 219–228. [Google Scholar] [CrossRef]
  62. Shen, X.; Wang, X.; Zhang, Z.; Lu, Z.; Lv, T. Evaluating the effectiveness of land use plans in containing urban expansion: An integrated view. Land Use Policy Int. J. Cover. All Asp. Land Use 2019, 80, 205–213. [Google Scholar] [CrossRef]
  63. Yang, S.; Hu, S.; Wang, S.; Zou, L. Effects of rapid urban land expansion on the spatial direction of residential land prices: Evidence from Wuhan, China. Habitat Int. 2020, 101, 102186. [Google Scholar] [CrossRef]
  64. Hu, Y.; Kong, X.; Zheng, J.; Sun, J.; Wang, L.; Min, M. Urban Expansion and Farmland Loss in Beijing during 1980–2015. Sustainability 2018, 10, 3927. [Google Scholar] [CrossRef] [Green Version]
  65. Li, L.; Bao, H.; Robinson, G. The return of state control and its impact on land market efficiency in urban China. Land Use Policy 2020, 99, 104878. [Google Scholar] [CrossRef]
  66. Zhang, L.; Li, X.; Liu, B.; Qian, J. Can the market-oriented allocation of land elements promote the optimization of industrial structure? —Analysis based on microscopic land transaction data. China Land Sci. 2018, 32, 23–31. [Google Scholar]
  67. Yang, Q.; Peng, Y. Promotional competition and industrial land transfer: An analysis based on panel data of Chinese cities from 2007 to 2011. Econ. Theory Econ. Manag. 2015, 9, 5–17. [Google Scholar]
  68. Gao, Y.; Zhong, T. The impact of the land market on the expansion of urban construction land-Based on an analysis of 285 cities’ panel data. Resour. Sci. 2016, 38, 2024–2036. [Google Scholar]
  69. Wu, Y.; Zhou, Y. China’s urban land market equilibrium and land intensive use. Econ. Geogr. 2009, 29, 984–988. [Google Scholar]
Figure 1. The expansion process of industrial land under the investment constraints before the land market reform.
Sustainability 13 04472 g001
Figure 2. The impact mechanism of land marketization on the expansion of industrial land.
Sustainability 13 04472 g002
Figure 3. Theoretical framework of land marketization on the expansion of industrial land in different regions.
Sustainability 13 04472 g003
Figure 4. The geographical locations of the urban agglomerations.
Sustainability 13 04472 g004
Figure 5. Scale of industrial land expansion in city agglomeration from 2007 to 2018 (units: ha).
Sustainability 13 04472 g005
Table 1. Descriptive statistics of key variables from 2007 to 2018.
VariableUnitObs.MeanStd. Dev.MinMax
Industrial land expansion areahm2924592.72559.424.674406.36
Industrial land marketization rate%9240.880.2201
GDP108 yuan9243512.1564753.527176.7532,679.87
GDP per capita104 yuan9246.2321.330.59642.18
The ratio of secondary industry to GDP structure%92449.308.12066.99
Foreign direct investment108 dollar92417.0131.560308.26
Employment in the secondary industry10492446.1057.422.23429.13
Amount of industrial investment108 yuan9241461.841722.3238.8611,993.95
Industrial wastewater discharge104 tons/hm292410,789.2912,074.93091260
Industrial sulfur dioxide emissions104 tons/hm29245.747.17068.29
Industrial smoke and dust emissions104 tons/hm29243.379.420185.98
Industrial output108 yuan9245696.266696.1883.4635,976.65
Number of industrial enterprises1company9242346.422595.7612818,792
Table 2. Industrial land marketization rate by quantity of city agglomeration from 2007 to 2018.
Study Area200720082009201020112012201320142015201620172018
Overall urban agglomeration0.3810.8100.8620.9030.9230.9190.9360.9390.9640.9500.9850.975
Yangtze River Delta urban agglomeration0.3590.9070.9430.9430.9710.9750.9620.9770.9670.9580.9830.970
Pearl River Delta urban agglomeration0.1500.7640.7040.7910.8920.8430.8570.8300.8810.8490.9950.998
Beijing-Tianjin-Hebei urban agglomeration0.3070.7250.7860.8140.8990.8670.9080.9300.9620.9570.9530.958
Urban agglomeration in the middle reaches of the Yangtze River0.4350.8220.9270.9430.9460.9610.9540.9410.9770.9650.9920.993
Cheng-Yu urban agglomeration0.5000.7870.8150.9300.8710.8740.9420.9620.9820.9620.9980.952
Table 3. Industrial land marketization rate by price of city agglomeration from 2007 to 2018.
Study Area200720082009201020112012201320142015201620172018
Overall urban agglomeration0.4160.8500.9010.9360.9500.9340.9600.9630.9780.9790.9960.895
Yangtze River Delta urban agglomeration0.3590.9150.9570.9510.9780.9710.9810.9810.9860.9680.9840.926
Pearl River Delta urban agglomeration0.1800.9300.9040.9100.9690.9000.9590.9000.9120.9551.0000.918
Beijing-Tianjin-Hebei urban agglomeration0.3280.7320.8270.8900.9060.8820.9190.9550.9710.9741.0000.863
Urban agglomeration in the middle reaches of the Yangtze River0.4820.8580.9370.9540.9720.9710.9750.9670.9940.9851.0000.840
Cheng-Yu urban agglomeration0.5720.8240.8420.9460.9090.9000.9450.9800.9840.9951.0000.973
Table 4. The land input coefficient in the five city agglomerations from 2007 to 2018.
Overall Urban AgglomerationCYUABTHUAMYRUAYRUAPRDUA
20070.00520.00240.00480.00340.00520.0060
20080.00520.00290.00580.00790.00280.0044
20090.00660.00490.00770.00720.00750.0042
20100.00720.00530.00560.00770.00980.0070
20110.00710.00540.00610.00870.00790.0051
20120.00660.00540.00590.00760.00770.0050
20130.00620.00460.00610.00750.00660.0045
20140.00420.00310.00460.00490.00430.0033
20150.00330.00200.00340.00350.00370.0039
20160.00260.00140.00310.00230.00360.0032
20170.34060.94640.12620.21750.59340.9327
20180.21630.16200.28220.28880.17350.0697
Note: CYUA (Cheng-Yu urban agglomeration), BTHUA (Beijing-Tianjin-Hebei urban agglomeration), MYRUA (urban agglomeration in the Middle Reaches of the Yangtze River), YRUA (Yangtze River Delta urban agglomeration), PRDUA (Pearl River Delta urban agglomeration).
Table 5. Validation of the impact of industrial land marketization rate by quantity on the scale of industrial land expansion.
Explained Variable: Scale of Industrial Land Expansion
Explanatory VariablesOverall Urban AgglomerationYRUAPRDUABTHUAMYRUACYUA
Model 1Model 2Model3Model 4Model 5Model 6Model 7Model 8Model 9Model 10Model 11Model 12
Industrial land marketization rate−134.081 **
(−2.10)
−191.510 ***
(−3.03)
110.875
(0.65)
195.865
(1.18)
−456.245 ***
(−3.11)
−612.993 ***
(−4.24)
−139.175
(−0.74)
−556.366 ***
(−2.96)
−77.537
(−0.73)
−109.588
(−1.11)
−114.9 *
(−1.11)
−113.6
(−1.2)
GDP per capita0.178
(0.31)
0.057
(0.10)
−12.661
(−0.65)
−19.049
(−1.20)
0.575
(0.08)
−8.335
(−1.01)
45.674
(1.40)
82.406 ***
(2.60)
15.954
(1.14)
−0.004
(0.00)
0.186
(0.49)
0.191
(0.5)
The ratio of secondary industry to GDP structure9.340 ***
(3.32)
7.377 ***
(2.87)
20.975
(1.62)
1.184
(0.14)
24.335 **
(2.32)
2.139
(0.39)
17.485 ***
(2.71)
35.351 ***
(6.62)
1.891
(0.45)
−0.985
(−0.29)
10.2 ***
(2.66)
3.684
(1.2)
Foreign direct investment−6.690 ***
(−6.33)
−3.554 ***
(−3.66)
−15.40 ***
(−4.64)
−5.404 ***
(−3.05)
−2.698
(−0.67)
−0.67
(−0.22)
−2.309
(−1.38)
−3.416 **
(−2.04)
−9.554 ***
(−2.74)
−4.340
(−1.42)
4.959
(1.43)
6.44 **
(2.1)
Employment in the secondary industry0.216
(0.40)
1.162 **
(2.19)
−4.284 ***
(−3.38)
−0.979
(−0.89)
−0.516
(−0.52)
−0.492
(−0.49)
6.122
(1.60)
−1.367
(−0.51)
3.607
(1.46)
5.673 ***
(3.23)
−5.98 **
(−2.42)
−4.7 **
(−1.9)
Industrial fixed assets0.042
(1.44)
0.101 ***
(3.57)
0.095
(1.51)
0.027
(0.46)
−0.103 *
(−1.96)
0.044
(0.87)
−0.022
(−0.28)
0.062
(0.90)
−0.027
(0.45)
0.047
(0.82)
0.141
1.38)
0.078
(1.0)
Industrial waste emissions0.001
(−0.80)
0.001
(1.62)
0.001
(1.04)
0.001
(0.51)
0.001
(−0.46)
0.001
(0.39)
0.001 ***
(−3.79)
0.001
(−0.93)
0.001
(1.07)
0.001 **
(2.19)
0.001
−0.93)
0.01
(−0.6)
Industrial output−0.004
(0.661)
−0.016 *
(−1.87)
0.084 ***
(3.42)
0.031 *
(1.75)
0.001
(0.09)
0.001
(0.02)
−0.091 ***
(−2.69)
−0.025
(−0.97)
0.001
(−0.04)
0.001
(0.25)
−0.1 ***
−2.76
−0.1 ***
(−2.9)
Number of industrial enterprises0.034 **
(2.06)
0.058 ***
(4.39)
−0.028
(−1.06)
0.033 *
(1.85)
−0.043
(−1.00)
−0.011
(−0.39)
0.194 **
(2.60)
0.357 ***
(7.69)
0.122
(1.25)
0.179 **
(2.46)
0.51 ***
(2.7)
0.68 ***
10.0
−cons254.859 *
(1.67)
168.731
(1.21)
−633.370
(−0.76)
297.309
(0.56)
104.906
(0.18)
902.615 ***
(2.73)
368.171
(0.89)
−1160.33 ***
(−3.73)
214.300
(0.96)
249.425
(1.36)
−256.4
−1.09
−130.7
(−0.2)
R0.1000.2050.2980.2720.4290.2770.4130.6270.0570.350.2970.731
Note: *** p < 0.01, ** p < 0.05, * p < 0.1.
Table 6. Validation of the impact of industrial land marketization rate by price on the scale of industrial land expansion.
Explained Variable: Scale of Industrial Land Expansion
Explanatory VariablesOverall Urban AgglomerationYRUAPRDUABTHUAMYRUACYUA
Model 1Model 2Model3Model 4Model 5Model 6Model 7Model 8Model 9Model 10Model 11Model 12
Industrial land marketization rate−204.613 ***
(−3.18)
−256.179 ***
(−3.96)
80.132
(0.50)
136.700
(0.82)
−580.192 ***
(−4.05)
−636.210 ***
(−4.34)
−138.314
(−0.73)
−529.325 ***
(−2.72)
−289.6 ***
(−2.95)
−284.6 ***
(−3.00)
−89.20
(−0.77)
−95.23
(−0.9)
GDP per capita0.186
(0.33)
0.065
(0.11)
−12.821
(−0.66)
−18.560
(−1.16)
1.939
(0.27)
−8.007
(−1.07)
45.286
(1.39)
82.396 **
(2.57)
0.914
(0.06)
−9.160
(−0.69)
0.195
(0.51)
0.192
(0.5)
The ratio of secondary industry to GDP structure9.881 ***
(3.52)
7.744 ***
(3.02)
21.065
(1.63)
0.442
(0.05)
30.907 ***
(3.01)
4.018
(0.73)
17.546 ***
(2.71)
34.778 ***
(6.43)
4.179
(1.02)
0.628
(0.19)
10.2 ***
(2.63)
3.549
(1.1)
Foreign direct investment−6.695 ***
(−6.35)
−3.589 ***
(−3.71)
−15.19 ***
(−4.34)
−5.587 ***
(−3.14)
−2.603
(−0.67)
−1.446
(−0.48)
−2.315
(−1.38)
−3.509 **
(−2.09)
−17.37 ***
(−4.38)
−8.274 **
(−2.54)
5.070
(1.46)
6.51 **
(2.1)
Employment in the secondary industry0.267
(0.49)
1.223 **
(2.32)
−4.332 ***
(−3.42)
−1.032
(−0.93)
−0.450
(−0.48)
−0.407
(−0.41)
6.323 *
(1.66)
−0.528
(−0.20)
1.801
(0.75)
4.228 **
(2.32)
−5.90 **
(−2.38)
−4.6 *
(−1.9)
Industrial fixed assets0.049 *
(1.67)
0.107 ***
(3.80)
0.091
(1.45)
0.025
(0.43)
−0.075
(−1.45)
0.083
(1.62)
−0.024
(−0.31)
0.057
(0.81)
−0.053
(−0.86)
0.007
(0.11)
0.135
(1.31)
0.076
(1.0)
Industrial waste emissions0.001
(−0.93)
0.001
(1.50)
0.001
(1.03)
0.001
(0.43)
0.001
(−0.95)
0.001
(0.04)
0.001 ***
(−3.81)
0.001
(−1.00)
0.001
(1.17)
0.001 **
(2.48)
0.001
(−0.89)
0.01
(0.7)
Industrial output−0.005
(−0.55)
−0.017 **
(−2.06)
0.087 ***
(3.65)
0.032 *
(1.83)
−0.003
(−0.17)
−0.009
(−0.72)
−0.091 ***
(−2.69)
−0.029
(−1.12)
0.1 ***
(3.58)
0.055 **
(2.45)
−0.1 ***
(−2.79)
−0.1 ***
(−2.9)
Number of industrial enterprises0.034 **
(2.06)
0.058 ***
(4.39)
−0.026
(−1.00)
0.033 *
(1.85)
−0.020
(−0.49)
0.007
(0.27)
0.197 **
(2.62)
0.365 ***
(7.83)
0.039
(0.41)
0.153 **
(2.10)
0.50 ***
(2.6)
0.67 ***
9.91
−cons289.952 *
(1.90)
211.984
(1.52)
−646.095
(−0.77)
383.497
(0.72)
−180.790
(−0.32)
846.022 ***
(2.61)
362.794
(0.88)
−1150.29 ***
(−3.64)
350.838
(1.62)
334.583 *
(1.83)
−256.2
(−1.08)
−135.3
(−0.8)
R0.1060.2110.2970.2670.4700.2830.4130.6210.1300.3450.2940.730
Note: *** p < 0.01, ** p < 0.05, * p < 0.1.
Publisher’s Note: MDPI stays neutral with regard to jurisdictional claims in published maps and institutional affiliations.

