Abstract
This study analyzes 174 tank milk samples taken from 89 commercial farms located all along the Cantabrian Coast (Green Spain). Sampling was performed in two periods: autumn 2016 and spring 2017. A survey was carried out for every day of sampling to record the average lactating dairy cow production and its diet composition. For each sample, the fatty acid (FA) profile (49 FA plus its main relationships) and nine fat-soluble antioxidant (FSA) profiles (retinol (vitamin A), α- and Υ-tocopherol (vitamin E), all-trans-β-carotene, 9-cis-β-carotene, 13-cis-β-carotene, lutein, zeaxanthin, and β-cryptoxanthin) were determined. The milk production varied between 7.3 and 45.9 liters per cow per day, highlighting the diversity found among production systems. The milk fat content ranged from 2.64% to 4.38% and the protein content from 2.87% to 3.56%. Regarding the fatty acids profile, the percentage of saturated fat varied between 59.95% and 75.99%. The linolenic acid content fluctuated between 0.21 and 1.31 and rumenic acid ranged from 0.20 to 2.47 (g 100 g−1 total FA). The most important correlations between diet and milk FA were always related to the content of fresh grass and total forage (which is defined by both fresh and conserved forage derived from fresh grass (GCF)) in the diet. The content of vaccenic acid, linolenic acid, total omega-3, rumenic acid, and total CLA isomers showed the highest correlation with the proportion of fresh grass in the diet. The antioxidant contents were also highly variable, although correlations with dietary components were lower. The highest correlations were between total forage content (fresh grass (FG) plus GCF) and lutein, all-trans-β-carotene, and 13-cis-β-carotene. Diets without fresh grass had lower omega-3 content, CLA, vaccenic acid, lutein, all-trans-β-carotene, and 13-cis-β-carotene.
1. Introduction
Incorporating fresh grass into a cow’s diet translates into better quality milk production. This milk will contain more polyunsaturated fatty acids, including omega-3 isomers and CLA, which are considered to be of great nutritional benefit [1,2,3]. It will also incorporate a larger presence of antioxidants including vitamins A, E, and carotenoids, which are also of high nutritional value. The increase in carotenoids is particularly important because they are the precursors of vitamin A and its antioxidant properties [3,4]. In both the USA [5] and Europe [6], cows’ diet has notably changed throughout recent decades, from forage-based diets to grain-based diets. Due to this, the milk produced has a less healthy fatty acid profile as it has a significant increase both in saturated fatty acids and in the n6/n3 ratio. In particular, Elgersma (2015) [7] highlights that in the Netherlands during the 1960s the observed mean CLA content in summer was 15 g kg−1 of fat. However, between the years 2001 and 2002, the mean CLA content decreased to 7 g kg−1 in summer and to 5 g kg−1 in spring and autumn. This loss is mainly attributed to a change in the management of cows for greater production yield, which led to a greater consumption of concentrate and maize silage, which subsequently replaced grass. Both authors remark how the diet of the average American or European citizens is characterized by high ratios of n6/n3. Since dairy products are an essential part of these occidental diets, the consumption of milk with better FA becomes of great importance in the fight against cardiovascular diseases. Benbrook et al. (2018) [5] claim that replacing the daily recommended intakes of regular milk with grass-fed milk products may contribute to greatly reducing the omega-6/omega-3 ratio from values over 10 to below 3.1. A great diversity of production systems exists along the Cantabrian Coast (Green Spain). Most lactating cow diets are based on fresh and/or conserved forage, with the inclusion, to a greater or lesser extent, of maize silage and concentrate. In previous studies conducted along the Cantabrian Coast [8,9,10], it has been verified that milk from fresh forage-fed cows has a fatty acids profile with less saturated fats and greater content of omega-3, CLA, and vaccenic acid. This content can be up to two times higher compared to diets without fresh forage and with the presence of maize silage. The aim of this work is to analyze the variability in fatty acids and fat-soluble antioxidant profiles, and its relationship with the production systems, in order to find an indicator or a set of indicators for implementation of an authentication tool.
2. Materials and Methods
2.1. Farms
The farms included in this study were selected by looking for diversity in diets. This means that the data included are a reflection of the existing farms in the region, but they do not represent them.
The herds included in the study were made up of Holstein Friesian cows; the average percentage of Holstein Friesian cows in the sampled herds was 95.5%. The average number of calving was 3.4, with the average age being 5.2 years. The average number of days in milking (DIM) was about 180.
2.2. Sample Design
A total of 174 bulk tank milk samples coming from 2 or 4 milking sessions were collected from 89 commercial farms located in Galicia (25), Asturias (22), Cantabria (25), and Navarra (17) in two periods: autumn 2016 and spring 2017. For each sample, the chemical analysis, the fatty acid profile, and the content of nine fat-soluble antioxidants (retinol—vitamin A, all-trans-β-carotene, 9-cis-β-carotene, 13-cis-β-carotene, lutein, zeaxanthin, β-cryptoxanthin, α-tocopherol, and Υ-tocopherol—vitamin E) were determined. In addition to these parameters, and from the fatty acids identified, the main relationships between them were calculated: total saturated FA (SFA), total branched FA (BCFA), total monounsaturated FA (MUFA), c-MUFA, t-MUFA, ratio t11/t10-C18:1, total polyunsaturated FA (PUFA), CLA isomers sum, n6 isomers sum, n3 isomers sum, PUFA/SFA, n6/n3 ratio, and total unsaturated FA (UFA)/SFA.
For each sampling day, a survey was conducted in order to estimate two figures: the mean milk production per cow and the mean ingredient composition of the rations fed to lactating cows during the preceding days. It also asked for a general description of the farms. Diet composition was expressed in terms of the percentage of dry matter intake (DMI) of each component of the ration in the total DMI per cow; that is, DM of fresh grass (FG; consumed either indoor (zero grazing) or in pasture), DM of grass silage (GS), DM of maize silage (MS), DM of dry forage (DF; sum of hay, straw, alfalfa, etc.), and DM of concentrate (C).
The following equation was used to estimate the cows’ voluntary intake:
DMItotal = 12 + 0.372 × MP4FCM
The equation is based on NRC (2001) [11] and considers four per cent fat-corrected milk (kg/d), body weight (kg), and week of lactation. DMI is measured in DM day−1 per cow and MP4FCM is the 4% fat-corrected milk production (MP). This was estimated according to MP4FCM = (MP × 0.4) + (MP × fat% × 0.15). An average live weight of 620 kg for cows in mid lactation was applied. The daily intake of fresh forage (kg DM) was approximated by subtracting the sum of the dry matter intake from the other ingredients present with respect to the theoretical total daily consumption of every cow.
Each sampling day, three bulk tank milk subsamples were taken. One of the samples was immediately delivered to the corresponding official dairy control laboratory (one for each autonomous community), in order to perform the chemical analysis. The remaining two samples were frozen (<−20 °C) and sent, preserving their frozen state, to the INGACAL-CIAM laboratory to determine their fatty acids (FA) and fat-soluble antioxidants (FSA) profiles, respectively.
2.3. Livestock Farms Included in the Study
Table 1 presents the mean values for some of the characteristics found in the 89 dairy farms included in this study. The great diversity found in herd size, territorial base, livestock density, and milk production is notable. Out the total of 89 farms sampled, 86 farms were used during the autumn sampling, whereas during the spring, the number increased to 88.

Table 1.
Summary of some of the characteristics of the 89 livestock farms included in the study.
2.4. Analytical Measurements
Chemical analysis. Milk samples were analyzed for fat, protein, lactose, and solid-non-fat (SNF) contents with MilkoScan FT 6000.
Fatty acids analysis. Milk fat was extracted following the ISO 14156/IDF 172 standards [12]. FA esters methylation was performed following ISO 15884/IDF 182 [13]. Later, the FA composition was determined by a gas chromatography-flame ionization detector (GC-FID) using a capillary column BPX70 and an oven program according to the methodology described by Kramer et al. (2002) [14].
Fat-soluble antioxidants analysis. Milk antioxidant extraction. The samples were kept frozen (−20 °C) until a later analysis. Once thawed at room temperature, they were introduced into a water bath at 35 °C. Finally, carotenoids and vitamins (E and A) were simultaneously extracted following the method proposed by Gentili et al. (2013) [15].
The final matrix extracts were dried by evaporation under N2 and reconstituted in the mobile phase before being injected. The separation and quantification of compounds were carried out by an HPLC system equipped with an RP dC18, 5 µm Atlantis column and with both a photodiode array (carotenoids, 450 nm) and fluorescence detectors (vitamins A and E; excitation-emission bands at 295–330 and 330–480 nm, respectively) under chromatographic conditions similar to those described by Chaveau-Duriot et al. (2010) [16].
2.5. Statistical Analysis
The statistical software package SPSS (version 17.0; SPSS Inc., Chicago, IL, USA) was used to analyze data. Each result is expressed using standard error mean notation (SEM). The data on fatty acids and fat-soluble antioxidants present in the 174 bulk tank milk samples were grouped depending on the diet (with or without fresh forage), and depending on how the fresh forage was allocated to lactating cows (in pasture or indoor). These data were verified using an analysis of variance (ANOVA). The post hoc comparisons among group means were defined by applying a Tukey-b test in case of equal variances and a Dunnett T3 test in case of different variances.
Relationships between fatty acid and fat-soluble antioxidant profiles and dietary components were performed by applying a bivariate correlation of SPSS.
3. Results and Discussion
3.1. Milk Production and Chemical Quality of the Milk Samples
Table 2 shows several milk production and composition statistics. These data correspond to the 174 bulk tank milk samples taken (86 in autumn and 88 in spring sampled periods). Inspecting this new information, we can again see a great diversity in both the productive capacity among farms and the milk’s chemical quality.
Table 2.
Production and chemical quality data found in the samples that were analyzed the same day as the extraction was performed. Mean, deviations, and maximum and minimum values are included.
3.2. Diets
Figure 1 shows the different composition of diets with fresh forage (84 diets ranging from 0.48% to 100% of fresh forage). In these diets, maize silage is a minor component being only present in 22.6% of the samples. However, concentrate is found in 94.6% of the samples, representing 8.25% to 48.7% (on average) of dry matter in the ration. Figure 2 shows the composition of fresh forage-free diets (90 diets). Here, maize silage is found in 85.6% of the samples, comprising 10.2% to 51.4% (on average) of dry matter in the ration. Concentrate is present in all diets and is 28.9% to 63.3% of the dry matter in the ration.
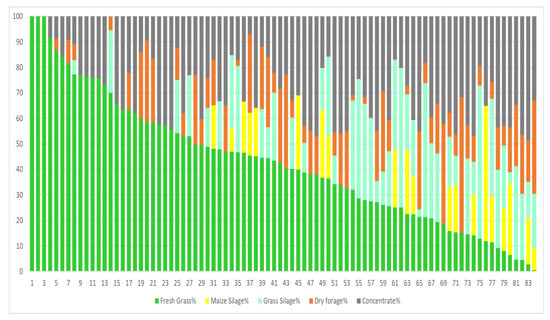
Figure 1.
Fresh forage diets. Samplings from autumn and spring (84 diets).
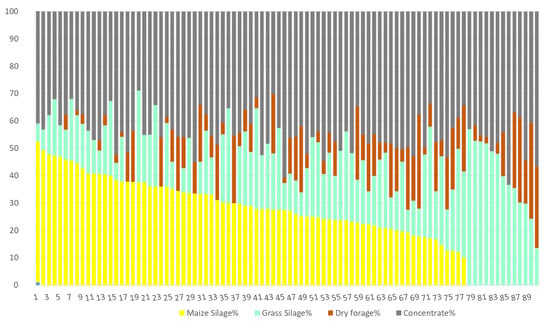
Figure 2.
Fresh forage-free diets (less than 1% DM of the ration). Samplings from autumn and spring (90 diets).
3.3. Fatty Acids Profile (FA)
Fatty acids were expressed in g per 100 g−1 FA, the most abundant being C16:0 (palmitic acid; 30.18%), cis-9 C18:1 (oleic acid; 19.70%), C14:0 (myristic acid; 11.25%), and C18:0 (stearic acid; 9.37%), accounting for 70.5% of the total milk FA; individual and overall values were very similar to those presented by other authors [17,18,19] in tank milk samples collected throughout the year in farms with different feeding management. The most abundant FA are not the most variable. More than ten fatty acids show high levels of variation between samples with the maximum value 10 to 20 times higher than the minimum value (Table 3). Among these FA, there are several isomers of oleic acid (C18:1), including c12-C18:1; vaccenic acid (t11-C18:1) and its isomer t10-C18:1; rumenic acid (main isomer of CLA, c9, t11-C18:2) and the sum of CLA isomers; C22:5-n3 (DPA, omega-3 family); trans-C18:2 n6 (omega-6 family); and C11:0. All of them have a variation coefficient greater than 50%. In some cases, the maximum value is 20 to 45 times higher than the minimum value. This is the case for two omega-6 isomers, C20:3-n6 and C22:2-n6, and an omega-3 isomer, C20:3-n3.
Table 3.
Fatty acids profile (49 fatty acids identified) in the 174 bulk tank milk samples taken from the samplings of autumn 2016 and spring 2017.
Considering some of the groups and the relationships of the FA calculated (Table 4), the values for the relationship t11/t10-C18:1 stand out due to the great variability found, with the maximum value being almost 60 times greater the lowest value. This translates to a 90.8% of variability, making it a good marker for the presence of fresh forage and sum of fresh grass (FG) plus conserved forage obtained from pastures (GCF) in the diet. This can also be inferred from the correlations table (Table 5). The sum of CLA isomers and the relationship n6/n3 also present a great variability among samples. It should be noted that 81% of the milk samples had a n6/n3 ratio smaller than 4.
Table 4.
Fatty acids profile (13 important relationships between fatty acids) identified in the 174 bulk tank milk samples extracted in autumn 2016 and spring 2017.
Table 5.
Correlation between DM percentage of each diet ingredient and the fatty acids profile of the bulk tank milk samples.
Other fatty acids, or relationships of fatty acids, such as the total saturated (SFA), cis-MUFA, total monounsaturated (MUFA), C6:0, C4:0 (butyric acid), C8:0, C16:0 (palmitic acid), C18:0 (stearic acid), and c9-c18:1-n9 (oleic acid), are considerably abundant fatty acids, but unlike the previous ones, these present little variability.
3.4. Correlation between Diet Components and FA Profile of Milk Samples
The most fluctuating fatty acids are those presenting higher correlations with the diet components (Table 5). The fresh forage content and total forage content (FG + GCF) are the components that have higher correlations with the FA, followed by the content in concentrate and maize silage. The dry forage and grass silage content in diets present lower correlations (r < 0.5) and, therefore, they are not displayed in the table.
Once more, it is confirmed that the higher percentage of fresh forage in the diets, the higher the omega-3 and CLA content [1,2,17,20]. Dhiman et al. (1999) [21] found that the content in CLA in milk is incremented linearly as the pasture content increases in the ration. The c9, t11-CLA constitutes between 75% and 90% of the total CLA isomers [22,23]. Particularly in this study, it represented 83.9% of the total CLA isomers detected by gas chromatography.
The t11-C18:1 has a high positive correlation with fresh forage (r = +0.765; p < 0.01) and a negative correlation with concentrate (r = −0.644; p < 0.01). The increase in t11-C18:1 with fresh forage is observed in many papers [1,2,17,20]. Chion et al. (2010) [24] found that when analyzing pasture-based diets, there was more CLA (+161%) and vaccenic acid (+148%) content during summer than during winter. Ferlay et al. (2008) [17] also noticed that fresh forage in the diet increases the trans C18:1 isomer content, except in t10-C18:1 and t12-C18:1. The t10-C18:1 isomer is not included in all chromatographic work. In our study, the highest correlations between FA and diet components are those of the quotient t11/t10 C18:1 (Table 5). The t10-C18:1 isomer presents a great variability among samples (coefficient of variation of 68.3%) (Table 3) and is quite similar to t11-C18:1 (64.7%); however, the correlations with diet components have been low (r < 0.5). Griinari & Bauman (2003) [25] proved that during ruminal biohydrogenation, t11-C18:1 becomes t10-C18:1 in low-fiber diets with higher starch and omega-6 content. Elgersma et al. (2003) [1] link the increment of t11-C18:1 with fiber-rich diets without mentioning t10. Borreani et al. (2013) [26] report an increase of t11-C18:1 related to the decline of the t10-C18:1 isomer in low-fiber diets. De La Torre-Santos et al. (2020) [27] proposed the t11/t10-C18:1 ratio as a marker to identify milk produced from grazing cattle. In our data, the correlation between t10 and t11 is low (r < 0.3) but negative.
The total saturated FA (SFA) percentage shows a very low correlation with diet (r < 0.5) and a negative correlation with fresh forage. Although diets without fresh forage and with maize silage and concentrate increase SFA content, these variations are small (p < 0.05). It is difficult to reduce the saturated content, as seen in Coppa’s formulas, where the increase of SFA in milk was well predicted by increases in all the conserved forages and concentrates in the cow diet [28].
Both the positive correlation in the percentage of fresh forage with C18:3-n3 (r = 0.757; p < 0.01) and the negative correlation with C18:2-n6 (r < −0.5) explain why the correlation is negative with the omega-6/omega-3 ratio (r = −0.668; p < 0.01).
Maize is negatively correlated with omega-3 (r = −0.572; p < 0.01) and positively correlated with omega-6 (r < 0.5), being positive if considering the relationship between both (n6/n3) (r = +0.546; p < 0.01). Larsen et al. (2010) [29] found more omega-3 content in milk from farms located in central Sweden compared with the southern farms. These differences were associated with the increased use of maize in the south. Ferlay et al. (2008) [17] link maize silage-rich diets with higher contents in c12-, c13-, t6+7+8-, t10-, and t12-C18:1.
As in the case of maize, the percentage of concentrate in diets shows inverse correlations to the percentage of fresh forage. The branched FA are positively correlated with the content in fresh forage and sum of forages and negatively with maize silage and concentrates. These outcomes match with other authors’ results [17,26].
The dry matter ingested by cow and day and the volume of milk produced are related to FA inversely to the content of fresh forage or total forage in the diet. That translates into negative correlations with omega-3, CLA, and the relationship t11/t10-C18:1, and positive correlations with c12-C18:1, omega-6, and the relationship omega-6/omega-3 (Table 5).
3.5. Fat-Soluble Antioxidants Profile (FSA)
The FSA, expressed in ng mL-1 (ppbv), had vitamins A and E as their most common vitamin types and all-trans-β-Carotenoid among carotenoids (Table 6). In this same table, the great variability in different FSA contents among the bulk tank milk samples is notable.
Table 6.
Fat-soluble-antioxidant profiles in the 174 bulk tank milk samples taken from the samplings of autumn 2016 and spring 2017.
The maximum values for lutein, zeaxanthin, and other carotenoids (all-trans-β-Carotene, 9-cis-β-Carotene, and 13-cis-β-Carotene) exceed between 20 and 30 times the minimum value in each case. The coefficient of variation is always over 50%. The vitamins are less variable, especially vitamin A. Regarding ruminants, vitamins are divided into two categories: those that depend on self-sufficiency, on rumen, or on endogenous supply (vitamins K, C, G, and B groups); and those whose supply is mainly through food (vitamins A and E) [30]. The majority of commercial concentrates are supplemented with vitamins A and E. In particular, vitamin E often comes as α-tocopherol, which may explain its smaller variability (Table 6). Forages are rich in vitamin E, which translates to cows which are fed with pastures or grass silage presenting higher α-tocopherol content [3,31]. However, vitamin A (retinol) is only found in animal products, meaning that only retinol precursors (carotenes) are found in forages. These latter contents vary greatly among diets. Agabriel et al. (2007) [4] affirm that retinol variations in milk are masked by the use of vitamin supplements whose nature and dose are unknown.
3.6. Correlations between Diet Components and Fat-Soluble Antioxidants Found in Milk
The FSA’s correlations with the diet components are clearly inferior to the main FA correlations. In fact, half of the correlations are found between 0.4 and 0.5 (Table 7). Due to this, in this table, unlike the previous FA correlations table, statistically significant correlations greater than 0.4 are presented.
Table 7.
Correlation (1) between the DM percentage of inclusion of each diet ingredient and the content in fat-soluble antioxidants in bulk tank milk samples.
As previously noted, the fresh forage content, but especially the total forage content (i.e., fresh grass plus GCF), along with the total concentrate in the diet, are the factors most related with the FSA milk content. Milk FSA are derived especially from green forage [32]. The more forage in the diet, the more FSA content, excluding Ɣ-tocopherol. In particular, this latter compound presents inverse correlations with the other FSA for every diet component. The β-carotene content of milk is highly dependent on its presence in the diet. Fresh forage is rich in carotenes, although this content decreases during grass conservation processes, especially depending on the exposure time of the forage to light [4]. Maize silage is poor in β-carotene and vitamin E [31]. These results agree with Agabriel et al. (2007) [4], who found that lutein and β-carotene were linked to wet forage in the diet (that is, grass and grass silage), although the correlations were slightly higher (r = +0.69 and r = +0.66; p < 0.001, respectively). They also found that there was a positive correlation with vitamin E (r = +0.51; p < 0.001), which is an outcome similar to our results.
The lack of correlation between dry forage content per ration and the content in all-trans-β-carotenes, other carotenoids, and vitamin E may be due to the fact that, even if pastures are rich in these components, they decrease drastically during the drying process and storage. This decrease is proportional to the degree of light exposure. Unlike our results, Larsen et al. (2010) [29] found higher contents in carotenoids in milks from farms located in central Sweden compared with southern farms. These differences are again linked to a greater usage of maize in the southern part of this country.
Although concentrate is fortified with vitamins A and E (the latter is usually added as α-tocopherol), there are no important correlations between the supply of vitamins proceeding from concentrate in the diet and the content of those vitamins in milk. The correlation between the ingestion of vitamin A per cow per day (in concentrate) and the content of retinol in milk is quite low (r = +0.13; p> 0.01) (data not provided). The correlation between the ingestion of vitamin E present in concentrate and the content of α-tocopherol in milk is very low and is negative (r = −0.26. p < 0.01) (data not provided). This means that the presence of those vitamins in milk is mainly due to forage consumption and not because of concentrate consumption. In fact, the correlation between concentrate content and α-tocopherol is negative (r = −0.468; p < 0.01). Vitamin A, along with 9-cis-β-carotene, presents correlations smaller than 0.4 with every component of the diet. Agabriel et al. (2007) [4] also found no correlation between diet forages and vitamin A content (p > 0.05). Lucas et al. (2006) [33] discovered that during periods of low forage intake, the content of vitamins A and E in milk is more dependent on supplementation.
Again, the intake volume (kg of dry matter consumed by each cow in a day) and the produced milk volume are related to FSA content and are inverse to their relationship with fresh forage or forages in the diet. This translates to the fact that the more the production there is (or the more intensive a diet is), the lesser the presence of carotenes and FSA is in general.
3.7. Correlations between Diet and Farm Characteristics
The diet supplied to lactating cows is not correlated with the size of the farm (UAA). Similarly, the total livestock units and livestock units ha−1, or annual milk production, have lower correlation coefficients (r < 0.4) in diet. Only daily production per cow (liters cow−1 day−1) presents relevant correlations (r > 0.6; p < 0.01) with diet components (Table 8).
Table 8.
Correlation (1) between diet components and some productive and herd characteristics.
Table 8 shows high correlation (r = +0.836; p < 0.01) between daily ingestion of dry matter and milk production per cow (liters cow−1 day−1). Maize-rich diets, presumably linked to intensive farms that grow maize, are in fact related to bigger herds, whereas fresh forage-rich diets and forages are related to smaller herds. In a more consistent way, it is deduced that fresh forage and forage-rich diets are linked to low production cows (r = −0.622, p < 0.01 and r = −0.735, p < 0.01; respectively); similarly, it is also inferred that diets rich in maize and concentrate are associated with cows with high intake and high milk production (r = +0.637, p < 0.01 and r = +0.612, p < 0.01; respectively). Slots et al. (2009) [3] link extensive systems (associated with low milk production) with an FSA increase (associated with a dilution effect).
3.8. Correlations between FA and FSA Milk Content and Farm Characteristics
Total useful agricultural area (UAA) and UAA dedicated exclusively to milk production show very low correlations with FA and FSA in milk (r < 0.4). Other farm characteristics, such as herd size (total livestock units—LU), the stocking rate (LU ha−1), or annual herd production (liters year−1), present low correlations (r ≤ 0.5). Only daily production per cow (liters cow−1 day−1) presents relevant correlations (r > 0.5; p < 0.01) with the FA and FSA profile of milk (Table 9).
Table 9.
Correlation (1) between the composition in FA and FSA in milk and some productive and herd characteristics.
Big herds, high stocking rate (intensity), high milk production by farm, and particularly high production per cow are all linked to higher values of C11:0, C12:0, C13:0, c12-C18:1, and omega-6 isomers (except C22:2-n6), as well as smaller values in every FSA with the exception of Ɣ-tocopherol. However, smaller herds and low milk production at farm and cow level are linked to milk which is richer in t11-C18:1, rumenic acid, CLA isomers sum, C23:0, C24:0, most of the omega-3 isomers (except C20:3-n3), branched FA, α-tocopherol (vitamin E), carotenes, and lutein (Table 9). From this, we can deduce that forage-rich diets (FG and FG + GCF diets) are linked to low-production cows that provide milk with higher contents in fatty acids and FSA that are considered healthy.
3.9. Differences in FA and FSA Profiles Depending on Whether or Not Fresh Forage Is Present in the Diet and How to Supply That Grass: Grazing vs. Cut and Carry (Zero-Grazed)
Milk obtained from cows eating fresh forage (84 samples) presents significantly higher mean concentrations of vaccenic acid, linolenic acid, omega-3 isomers sum, rumenic acid, t11/t10 C18:1 ratio, and a lower n6/n3 relationship (Table 10).
Table 10.
Fatty acid and fat-soluble antioxidant profiles identified in the 174 bulk tank milk samples obtained in autumn 2016 and spring 2017, depending on how the grass was supplied: grazing vs. cut and carry (zero-grazed). Only parameters with significant differences between handling systems are indicated.
Milk from grazing cows presents significantly higher concentrations of omega-3 fatty acids (omega-3 isomers sum), especially C18:3-n3 and C22:5-n3, and a lower n6/n3 relationship (represented by a different letter in the same row) than milk obtained from cows that were fed fresh forage indoors. This milk also shows a numerically higher t11/t10-C18:1 ratio compared to cows fed indoors, although this lacks statistical significance. Regarding FSA contents, milk from cows on pasture presents statistically superior contents of zeaxanthin and β-cryptoxanthin; however, there are no differences when analyzing other carotenoid content (all-trans-β-carotene and 13-cis-β-carotene).
In terms of analyzing the mean composition of diets in each group (Table 10), it is shown that farms supplying fresh forage indoors to lactating cows (N = 22) consume 22% less fresh forage and 54% more concentrate than the ones with pasture grazing (N = 48). Therefore, the results obtained are linked to differences in food management in the farms that collaborated in this study. In particular, the farms feeding fresh grass indoors provide rations significantly richer in concentrate and with a slightly lower relative consumption of FF than the ones that take cows out to pasture.
In our study, the way of ingesting fresh forage affects the content of c18:3-n3 more than the content of CLA. However, Offer (2002) [34], who compared milk produced by grazing cows and by cows fed fresh grass indoors from the same land, finds a reduction in the omega-3 content in milk in the latter, but especially in rumenic acid.
Some authors also point out a better fatty acids profile in grazing cows compared to zero-grazing [1,18,27]. This fact may be explained by the higher floristic diversity in grazing periods (when this study was performed). They also suggest this may be due to the changes suffered by fresh forage since the harvest (lipolysis) and during the time spent in the barn before its consumption. Losses in polyunsaturated fatty acids have been reported in grass immediately after cutting herbage due to the oxidative processes of plant tissues [35]. Another explanation may be that during grazing, the cows themselves select the most tender herbs.
Elgersma et al. (2008) [36] demonstrate the existence of a vertical gradient in FA concentration in grass canopies related to leaf blade ratio. These findings would explain why cows with access to upper sward horizons had higher CLA concentrations in their milk than cows offered pre-grazed swards.
4. Conclusions
Results show great variability in FA and FSA profiles among milk samples. This reflects the diversity among feeding systems in the geographic area of the study. The most variable FA are the ones linked to the consumption of fresh forage (FF) and other forages obtained from pastures. It has been verified that higher levels of fresh forage result in higher PUFA, vitamin, and carotenoid content.
The type of diet affects mainly the proportion of vaccenic, CLA, and omega-3 acids, as well as the t11/t10-C18:1 ratio. This stands out clearly as a good possible indicator of the presence of fresh forage. In the same way, excluding vitamin A, every FSA is linked to the presence of fresh forage, although FSA correlations with diet are lower than those of FA.
Milk from fresh forage-fed cows, either grazing or indoors, presents higher content of this FA than the milk from cows that do not consume FF. Differences are shown in the FA and FSA profiles between herds where lactating cows are grazing and herds where cows are fed indoors. However, in this study, it is not possible to deny that it is partly because of the latter’s consumption of less FF and more concentrate in the ration.
Choosing milk from fresh forage and forage-fed herds could allow for milk which is rich in PUFA, carotenoids, and other potential antioxidants to be put on the market. This would confer added value on milk produced on farms using more extensive traditional systems and from cows with grass-rich diets and fewer cereals.
Author Contributions
Conceptualization, A.V., F.V., G.S., L.J.R., P.E., J.B.; Methodology, L.G., A.V., F.V., A.B., P.E.; Investigation, A.V., F.V., G.S., L.J.R., P.E., I.V.-G., J.B., A.B.; Formal analysis, A.V.; Writing—Original Draft, A.V.; Writing—Review, I.V.-G., G.S., F.V. All authors have read and agreed to the published version of the manuscript.
Funding
The work presented is part of a research project funded by the National Institute for Agricultural and Food Research and Technology (INIA), project RTA2014-00086-C03.
Institutional Review Board Statement
Not applicable.
Informed Consent Statement
Not applicable.
Data Availability Statement
Not applicable.
Acknowledgments
The authors thank the LIGAL staff for their analytical work and Gonzalo Flores for their participation as project coordinator in Galicia, as well as the collaboration of the farmers from the four autonomous communities.
Conflicts of Interest
The authors declare no conflict of interest.
References
- Elgersma, A.; Tamminga, S.; Ellen, G. Comparison of the Effects of Grazing and zero-Grazing of Grass on Milk Fatty Acid Composition of Dairy Cows. In Optimal Forage Systems for Animal Production and the Environment, Proceedings of the 12th Symposium of the European Grassland Federation, Pleven, Bulgaria, 26–28 May 2003; pp. 271–274. Available online: https://books.google.com.hk/books/about/Optimal_Forage_Systems_for_Animal_Produc.html?id=UEfZAQAACAAJ&redir_esc=y (accessed on 16 April 2021).
- Couvreur, S.; Hurtaud, C.; Lopez, C.; Delaby, L.; Peyraud, J.L. The linear relationship between the proportion of fresh grass in the cow diet milk fatty acid composition and butter properties. J. Dairy Sci. 2006, 89, 1956–1969. [Google Scholar] [CrossRef]
- Slots, T.; Butle, G.; Leifert, C.; Kristensen, T.; Skibsted, L.H.; Nielsen, J.H. Potentials to differentiate milk composition by different feeding strategies. J. Dairy Sci. 2009, 92, 2057–2066. [Google Scholar] [CrossRef]
- Agabriel, C.; Cornu, A.; Journal, C.; Sibra, C.; Grolier, P.; Martin, B. Tanker milk variability according to farm feeding practices: Vitamins A and E carotenoids colour and terpenoids. J. Dairy Sci. 2007, 90, 4884–4896. [Google Scholar] [CrossRef]
- Benbrook, C.; Davis, D.R.; Bradley, J.H.; Baranski, M. Enhancing the fatty acid profile of milk through forage-based rations with nutrition modeling of diet outcomes. Food Sci. Nutr. 2018, 6, 682–700. [Google Scholar] [CrossRef] [PubMed]
- Elgersma, A.; Wever, A.C.; Nałęcz-Tarwacka, T. Grazing versus indoor feeding: Effects on Milk Quality. In Sustainable Grassland Productivity, Proceedings of the 21st General Meeting of the European Grassland Federation, Badajoz, Spain, 3–6 April 2006; Volume 11, pp. 419–427. Available online: https://books.google.com.hk/books/about/Sustainable_Grassland_Productivity.html?id=oEIjAQAAMAAJ&redir_esc=y (accessed on 16 April 2021).
- Elgersma, A. New developments in The Netherlands: Dairies reward grazing because of public perception. Grassl. Sci. Eur. 2015, 17, 420–422. [Google Scholar]
- Morales-Almaráz, E.; de la Roza Delgado, B.; González, A.; Soldado, A.; Rodríguez, M.L.; Peláez, M.; Vicente, F. Effect of feeding system on unsaturated fatty acid levels in milk of dairy cows. Renew. Agric. Food Syst. 2011, 224–229. [Google Scholar] [CrossRef]
- Villar, A.; Gradillas, G.; Fernández, C.; Gutiérrez, M.R.; Rodríguez-Loperena, M.A.; Barrachina, M.; García, J.A. Aspectos sanitarios y de calidad de la producción ecológica de leche: Infecciones mamarias y perfil de ácidos grasos. Tierras Castilla León Ganad. 2011, 179, 52–60. [Google Scholar]
- Flores, G.; Fernández-Lorenzo, B.; Dagnac, T.; Resch, C.; Pereira-Crespo, S.; Lorenzana, R.; González, L.; Agruña, M.J.; Barreal, M.; Veiga, M.; et al. Relación entre dieta y calidad de la leche en un panel de explotaciones lecheras gallegas. Rev. Afriga 2015, 118, 130–146. [Google Scholar]
- NRC-National Research Council. Nutrient Requirements of Dairy Cattle: Seventh Revised Edition; National Academies Press: Washington, DC, USA, 2001. [Google Scholar]
- ISO-IDF (International Organization for Standardization-International Dairy Federation). Milk and Milk Products—Extraction Methods for Lipids and Fat-Soluble Compounds; ISO: Brussels, Belgium, 2001. [Google Scholar]
- ISO-IDF (International Organization for Standardization-International Dairy Federation). Milk Fat—Preparation of Fatty Acid Methyl Esters; ISO: Brussels, Belgium, 2002. [Google Scholar]
- Kramer, J.K.G.; Blackadar, C.B.; Zhou, J. Evaluation of Two GC Columns (60-m SUPELCOWAX 10 and 100-m CP Sil 88) for Analysis of Milkfat with Emphasis on CLA, 18:1, 18:2 and 18:3 Isomers, and Short- and Long-Chain FA. Lipids 2002, 37, 823–835. [Google Scholar] [CrossRef]
- Gentili, A.; Caretti, F.; Bellante, S.; Ventura, S.; Canepari, S.; Curini, R. Comprehensive Profiling of Carotenoids and Fat-Soluble Vitamins in Milk from Different Animal Species by LC-DAD-MS/MS Hyphenation. J. Agric. Food Chem. 2013, 61, 1628–1639. [Google Scholar] [CrossRef]
- Chauveau-Duriot, B.; Doreau, M.; Noziere, P.; Graulet, B. Simultaneous quantification of carotenoids retinol and tocopherols in forages bovine plasma and milk: Validation of a novel UPLC method. Anal. Bioanal. Chem. 2010, 397, 777–790. [Google Scholar] [CrossRef] [PubMed]
- Ferlay, A.; Agabriel, C.; Sibra, C.; Journal, C.; Martin, B.; Chilliard, Y. Tanker milk variability in fatty acids according to farm feeding and husbandry practices in a French semi-mountain area. Dairy Sci. Technol. 2008, 88, 193–215. [Google Scholar] [CrossRef]
- Capuano, E.; Van der Veer, G.; Boerrigter-Eenling, R.; Elgersma, A.; Rademaker, J.; Sterian, A.; Van Ruth, S.M. Verification of fresh grass feeding, pasture grazing and organic farming by cows farm milk fatty acid profile. Food Chem. 2014, 164, 234–241. [Google Scholar] [CrossRef]
- Vicente, F.; Santiago, S.; Jiménez-Calderón, J.D.; Martínez-Fernández, A. Capacity of milk composition to identify the feeding system on dairy cows. J. Dairy Res. 2017, 84, 254–263. [Google Scholar] [CrossRef] [PubMed]
- Morales-Almaráz, E.; de la Roza-Delgado, B.; Soldado, A.; Martínez-Fernández, A.; González, A.; Domínguez-Vara, I.A.; Vicente, F. Parity and grazing-time effects on milk fatty acid profile in dairy cows. Anim. Prod. Sci. 2018, 58, 1233–1238. [Google Scholar] [CrossRef]
- Dhiman, T.R.; Anand, G.R.; Satter, L.D.; Pariza, M.W. Conjugated linoleic acid content of milk from cows fed different diets. J. Dairy Sci. 1999, 82, 2146–2156. [Google Scholar] [CrossRef]
- Chin, S.F.; Liu, W.; Storkson, J.M.; Ha, Y.L.; Pariza, M.W. Dietary sources of conjugated dienoic isomers of linoleic acid a newly recognized class of anticarcinogens. J. Food Compost. Anal. 1992, 5, 185–197. [Google Scholar] [CrossRef]
- Bauman, D.E.; Corl, B.A.; Peterson, G.P. The Biology of Conjugated Linoleic Acids in Ruminants; Advances in Conjugated Linoleic Acid Research; Sébédio, J.-L., Christie, W.W., Adlof, R., Eds.; AOCS Press: Champaign, IL, USA, 2003; Volume 2, pp. 146–173. [Google Scholar]
- Chion, A.R.; Tabacco, E.; Giaccone, D.; Peiretti, G.; Batelli, G.; Borreani, G. Variation of fatty acid and terpene profiles in mountain milk and “Toma piemontese” cheese as affected by diet composition in different seasons. Food Chem. 2010, 121, 393–399. [Google Scholar] [CrossRef]
- Griinari, J.M.; Bauman, D.E. Update on Theories of Diet-Induced Milk Fat Depression and Potential Applications. In Recent Advances in Animal Nutrition; Garnsworthy, P.C., Wiseman, J., Eds.; Nottingham University Press: Nottingham, UK, 2003; pp. 115–156. [Google Scholar]
- Borreani, G.; Coppa, M.; Revello-Chion, A.; Comino, L.; Giaccone, D.; Ferlay, A.; Tabacco, E. Effect of different feeding strategies in intensive dairy farming systems on milk fatty acid profiles, and implications on feeding costs in Italy. J. Dairy Sci. 2013, 96, 6840–6855. [Google Scholar] [CrossRef]
- De La Torre-Santos, S.; Royo, L.J.; Martínez-Fernández, A.; Chocarro, C.; Vicente, F. The Mode of Grass Supply to Dairy Cows Impacts on Fatty Acid and Antioxidant Profile of Milk. Foods 2020, 9, 1256. [Google Scholar] [CrossRef]
- Coppa, M.; Ferlay, A.; Chassaing, C.; Agabriel, C.; Glasser, F.; Chilliard, Y.; Borreani, G.; Barcarolo, R.; Baars, T.; Kusche, D.; et al. Prediction of bulk milk fatty acid composition based on farming practices collected through on-farm surveys. J. Dairy Sci. 2013, 96, 4197–4211. [Google Scholar] [CrossRef]
- Larsen, M.K.; Nielsen, J.H.; Butler, G.; Leifert, C.; Slots, T.; Kristiansen, G.H.; Gustafsson, A.H. Milk quality as affected by feeding regimens in a country with climatic variation. J. Dairy Sci. 2010, 93, 2863–2873. [Google Scholar] [CrossRef]
- Ballet, N.; Robert, J.C.; Williams, P.E.V. Vitamins in Forages; Forage Evaluation in Ruminant Nutrition; Givens, D.I., Owen, E., Axford, R.F.E., Omed, H.M., Eds.; CABI Publishing: Wallingford, UK, 2000; pp. 341–399. [Google Scholar]
- Butler, G.; Nielsen, J.H.; Slots, T.; Seal, C.; Eyre, M.D.; Sanderson, R.; Leifert, C. Fatty acid and fat soluble antioxidant concentrations in milk from high-and low-input conventional and organic systems: Seasonal variation. J. Sci. Food Agric. 2008, 88, 1431–1441. [Google Scholar] [CrossRef]
- Havemose, M.S.; Weisbjerg, M.R.; Bredie, W.L.P.; Nielsen, J.H. Influence of feeding different types of roughage on the oxidative stability of milk. Int. Dairy J. 2004, 14, 563–570. [Google Scholar] [CrossRef]
- Lucas, A.; Agabriel, C.; Martin, B.; Ferlay, A.; Verdier-Metz, I.; Coulon, J.B.; Rock, E. Relationships between the conditions of cow’s milk production and the contents of components of nutritional interest in raw milk farmhouse cheese. Le Lait 2006, 86, 177–202. [Google Scholar] [CrossRef]
- Offer, N.W. Effects of Cutting and Ensiling Grass on Levels of CLA in Bovine Milk. In Proceedings of the XIIIth International Silage Conference, Auchincruive, Scottish Agricultural College, Scotland, UK, 11–13 September 2002; pp. 16–17. [Google Scholar]
- Kalač, P.; Samková, E. The effects of feeding various forages on fatty acid composition of bovine milk fat: A review. Czech. J. Anim. Sci. 2010, 55, 521–537. [Google Scholar] [CrossRef]
- Elgersma, A.; van der Hoeven, E.; Witkowska, I.M.; Smit, H.J. Effects of the grazed horizon in perennial ryegrass swards on the conjugated linoleic acid concentration in milk of dairy cows. Grassl. Sci. Eur. 2008, 13, 388–390. [Google Scholar]


Publisher’s Note: MDPI stays neutral with regard to jurisdictional claims in published maps and institutional affiliations. |
© 2021 by the authors. Licensee MDPI, Basel, Switzerland. This article is an open access article distributed under the terms and conditions of the Creative Commons Attribution (CC BY) license (https://creativecommons.org/licenses/by/4.0/).