Article

Experimental Winter Monitoring of a Light-Weight Green Roof Assembly for Building Retrofit

by
Fabiana Frota de Albuquerque Landi
1,
Claudia Fabiani
1,2,* and
Anna Laura Pisello
1,2
1
CIRIAF, Interuniversity Research Center, University of Perugia, Via G. Duranti 67, 06125 Perugia, Italy
2
Department Civil and Environmental Engineering, University of Perugia, Via G. Duranti 93, 06125 Perugia, Italy
*
Author to whom correspondence should be addressed.
Sustainability 2021, 13(9), 4604; https://doi.org/10.3390/su13094604
Submission received: 12 March 2021 / Revised: 13 April 2021 / Accepted: 15 April 2021 / Published: 21 April 2021
(This article belongs to the Special Issue Architecture and Indoor Environmental Quality)

Abstract

:
Green roofs are a recurrent solution for improving environmental quality in buildings. Such systems can, among other things, reduce the urban heat island effect, improve indoor thermal comfort and visual quality, and reduce energy consumption in buildings, therefore promoting human comfort. This work presents the winter monitoring of a light-weight green roof assembly with the potential to be implemented in extensive urban areas. The green roof monitoring was compared to those of previous bituminous and cool-coating applications. Results show that the system was able to decrease heat losses maintaining a positive energy flow from solar radiation gains and a more constant indoor temperature. In a well-insulated construction, the impact during the cold season was discreet. However, compared to the reference building, a slightly lower indoor air temperature (about 1 ° C) was registered.

1. Introduction

Green roofs date back to ancient times as a traditional solution in vernacular architecture [1,2,3]. Their positive effect in terms of thermal insulation and temperature buffering potential is well known and commonly applied as a reliable passive cooling technique in buildings. The green roofs can both play a beneficial role on the macro-scale, when extensively implemented in an urban context, and on the micro-scale, when used in single building units.
From a large-scale perspective, the beneficial impact of green roofs in urban water management [4,5,6], urban heat island mitigation [7,8,9,10], urban noise reduction [11,12,13], carbon sequestration increase [2,14], visual quality improvement [5], and biodiversity conservation is well recognized such as their positive contribution [6,15] to the human well-being [16,17].
At a smaller perspective, green roofs can reduce the temperature stress on roof structures [6,11,15], improve local thermal comfort in buildings [16,18,19], and reduce energy consumption of active cooling systems [11,12,19,20]. Their extensive energy saving potential, in particular, is widely appreciated by the scientific community, which is why, in his interesting review, Santamouris [21] presented several research studies evaluating green roof’s energy savings according to the systems, its geographical location, and the associated construction techniques.
Parizotto and Lambert [11], among others, studied a single building energy performance in the south of Brazil (temperate climate), during both cold and warm seasons. They concluded that the green roof was very effective in preventing heat gains in the warm season. During the colder period, on the other hand, compared to ceramic and metallic roofs, the system was able to significantly reduce heat losses towards the outdoors.
The building stock can highly profit from green roofs retrofitting, improving the energy class of buildings and the overall quality (visual, air, thermal) of low height consolidated urban areas.
Castleton et al. [22] stated that poorly insulated buildings, which is the situation of most prior constructions reported in the United Kingdom, take the most benefits from green roof installation. Nonetheless, regulatory restrictions for building of heritage interest [23] and technical constraints on existing construction can significantly limit the use of green roofs. Technically adapting the building structure for extra loads can be very expensive. In addition, buildings might face infiltration depending on the type of green roof solution adopted. The proper specification is essential for designing an effective system. Local boundary conditions such as air temperature, relative humidity, incoming solar radiation, rain incidence, and of course the overall stratigraphy, and materials contribute to the thermal transmittance of the construction skin, and play a crucial role for the effectiveness of the roof [3,24]. Some authors discuss that for highly insulated buildings and low heating demand, the thermal effects of the green roofs are not relevant [5,7,25,26]. Berardi et al. [12] stated that if coupled with a strongly insulated surface, the influence of the system is essentially observed on the outdoors. Niachou et al. [26] found a contribution of only 2% of energy saving in well-insulated stratigraphies, with thermal conductance from 0.26 to 0.4 W/m 2 · K.
D’Orazio et al. [25] presented the experimental results of a well-insulated sloped slab combined with a green roof in a temperate climate. The study found that during winter the vegetated roof improved the insulation of the plane while during the summer it reduced incoming heat fluxes and local surface temperatures. Yet, no significant variation on thermal flux was registered in comparison with the clay roof was found a maximum difference of 1 W/m 2 . The authors highlighted the uncertainties about the U-values obtained from measured data due to the complexity of the interactions.
Santamouris [21] explained the importance of the water content and air humidity since green roof’s functioning is mostly related to the latent heat. Santamouris added that in constructions in which most of the energy loads are majorly through the opaque surfaces, the effects of the green roofs are enhanced.
Moody and Sailor [15] established parameters for the thermal behavior of green roofs and tested it in four cities in the United States concluding that the same system may be more advantageous in certain locations than others. In Portland, for example, there was a net 3% energy consumption penalty attributed to the evaporative cooling. Lazzarin et al. [20] also found that during the winter, for a hospital in north Italy, the traditional roof performed a better energetic profile than the green roof.
Takebayashi and Moriyama [27] compared five different surfaces efficiency for mitigation of urban heat island effects. During the summer, the temperature of the white high reflective coating was lower than the green roof. Simultaneously, the green roof had lower temperatures than the cement and the bare soil. During the winter, the soil and the green almost had the same temperature. The heat flux in high reflective surfaces was smaller due to less radiation absorption. The green roof even being less reflective, presented less sensible heat flux due to the evaporation effect. A similar conclusion is stated by Parizotto and Lamberts in their field measurements [11]. In their research, Pisello et al. [28] explained the potential of implementing such a solution in a constructed landscape, contributing not only for the building energy balance but also to the climate mitigation factor.
Jim, C.Y. [9] compared the thermal behavior of three types of vegetation cover in a tropical climate. The measurements taken at different highs show the impacts of the different greenery that happens especially during the day time, while at night no cooling effect was registered. The grass demonstrated to be the most effective solution for air temperature control, while at the inner surface the solutions were equivalent.

2. Objectives

In this work, we present and discuss the winter behavior of a lightweight green roof system that could be easily implemented on a large scale in populated urban contexts for the variety of benefits just discussed before.
The assembly mainly composed of recycled felt and lawn was placed on the top of a real-scale building, i.e., test-room (TR), fully monitored in terms of the most important indoor and outdoor micro-climate parameters. The continuous monitoring of this building started in 2012 and allows to operate comparisons between the selected green roof and competitive applications such a traditional bituminous, and a cool roof.
An identical building with equivalent stationary thermal properties implementing a ceramic tiled roof was taken as a reference in all comparisons. The results are compared in terms of radiation reflectance, internal and external roof surface temperatures, thermal flux, and indoor temperature.
This study aims to assess the effect of the lightweight green roof under real winter conditions in a free-float regime to investigate possible penalties.

3. Materials and Methods

3.1. Green Roof Stratigraphy

Green roofs can be classified into intensive or extensive typologies. The first type is heavier, with a thicker substract layer that allows to implement trees, but is also more maintenance demanding. The second type, on the other hand, is lighter, can only support thinner vegetation, but has lower maintenance requirements. The advantages of implementing either of these two varies not only with the type of vegetation, but with the building configuration itself as level of insulation, height, and boundary climatic conditions [6,11,12,21,28].
The green roof system investigated in this work (the “Pratotetto” from Bindi PRATOPRONTO) is an extensive green roof characterized by a lawn vegetation and a low depth substrate, which guarantees relatively low installation and maintenance costs even compared to similar extensive typologies. This specific system has as a main advantage its very low weight, which could technically allow its implementation in part of the existing built stock. According to the company that developed and registered (Bindi PRATOPRONTO), the system weights 30 kg/m 2 [29], fairly lighter than the referenced literature that reports a range of 70 to 170 kg/m 2 for extensive systems [6].
The stratigraphy is composed by the layers described in Table 1 and Figure 1.

3.2. Case Study

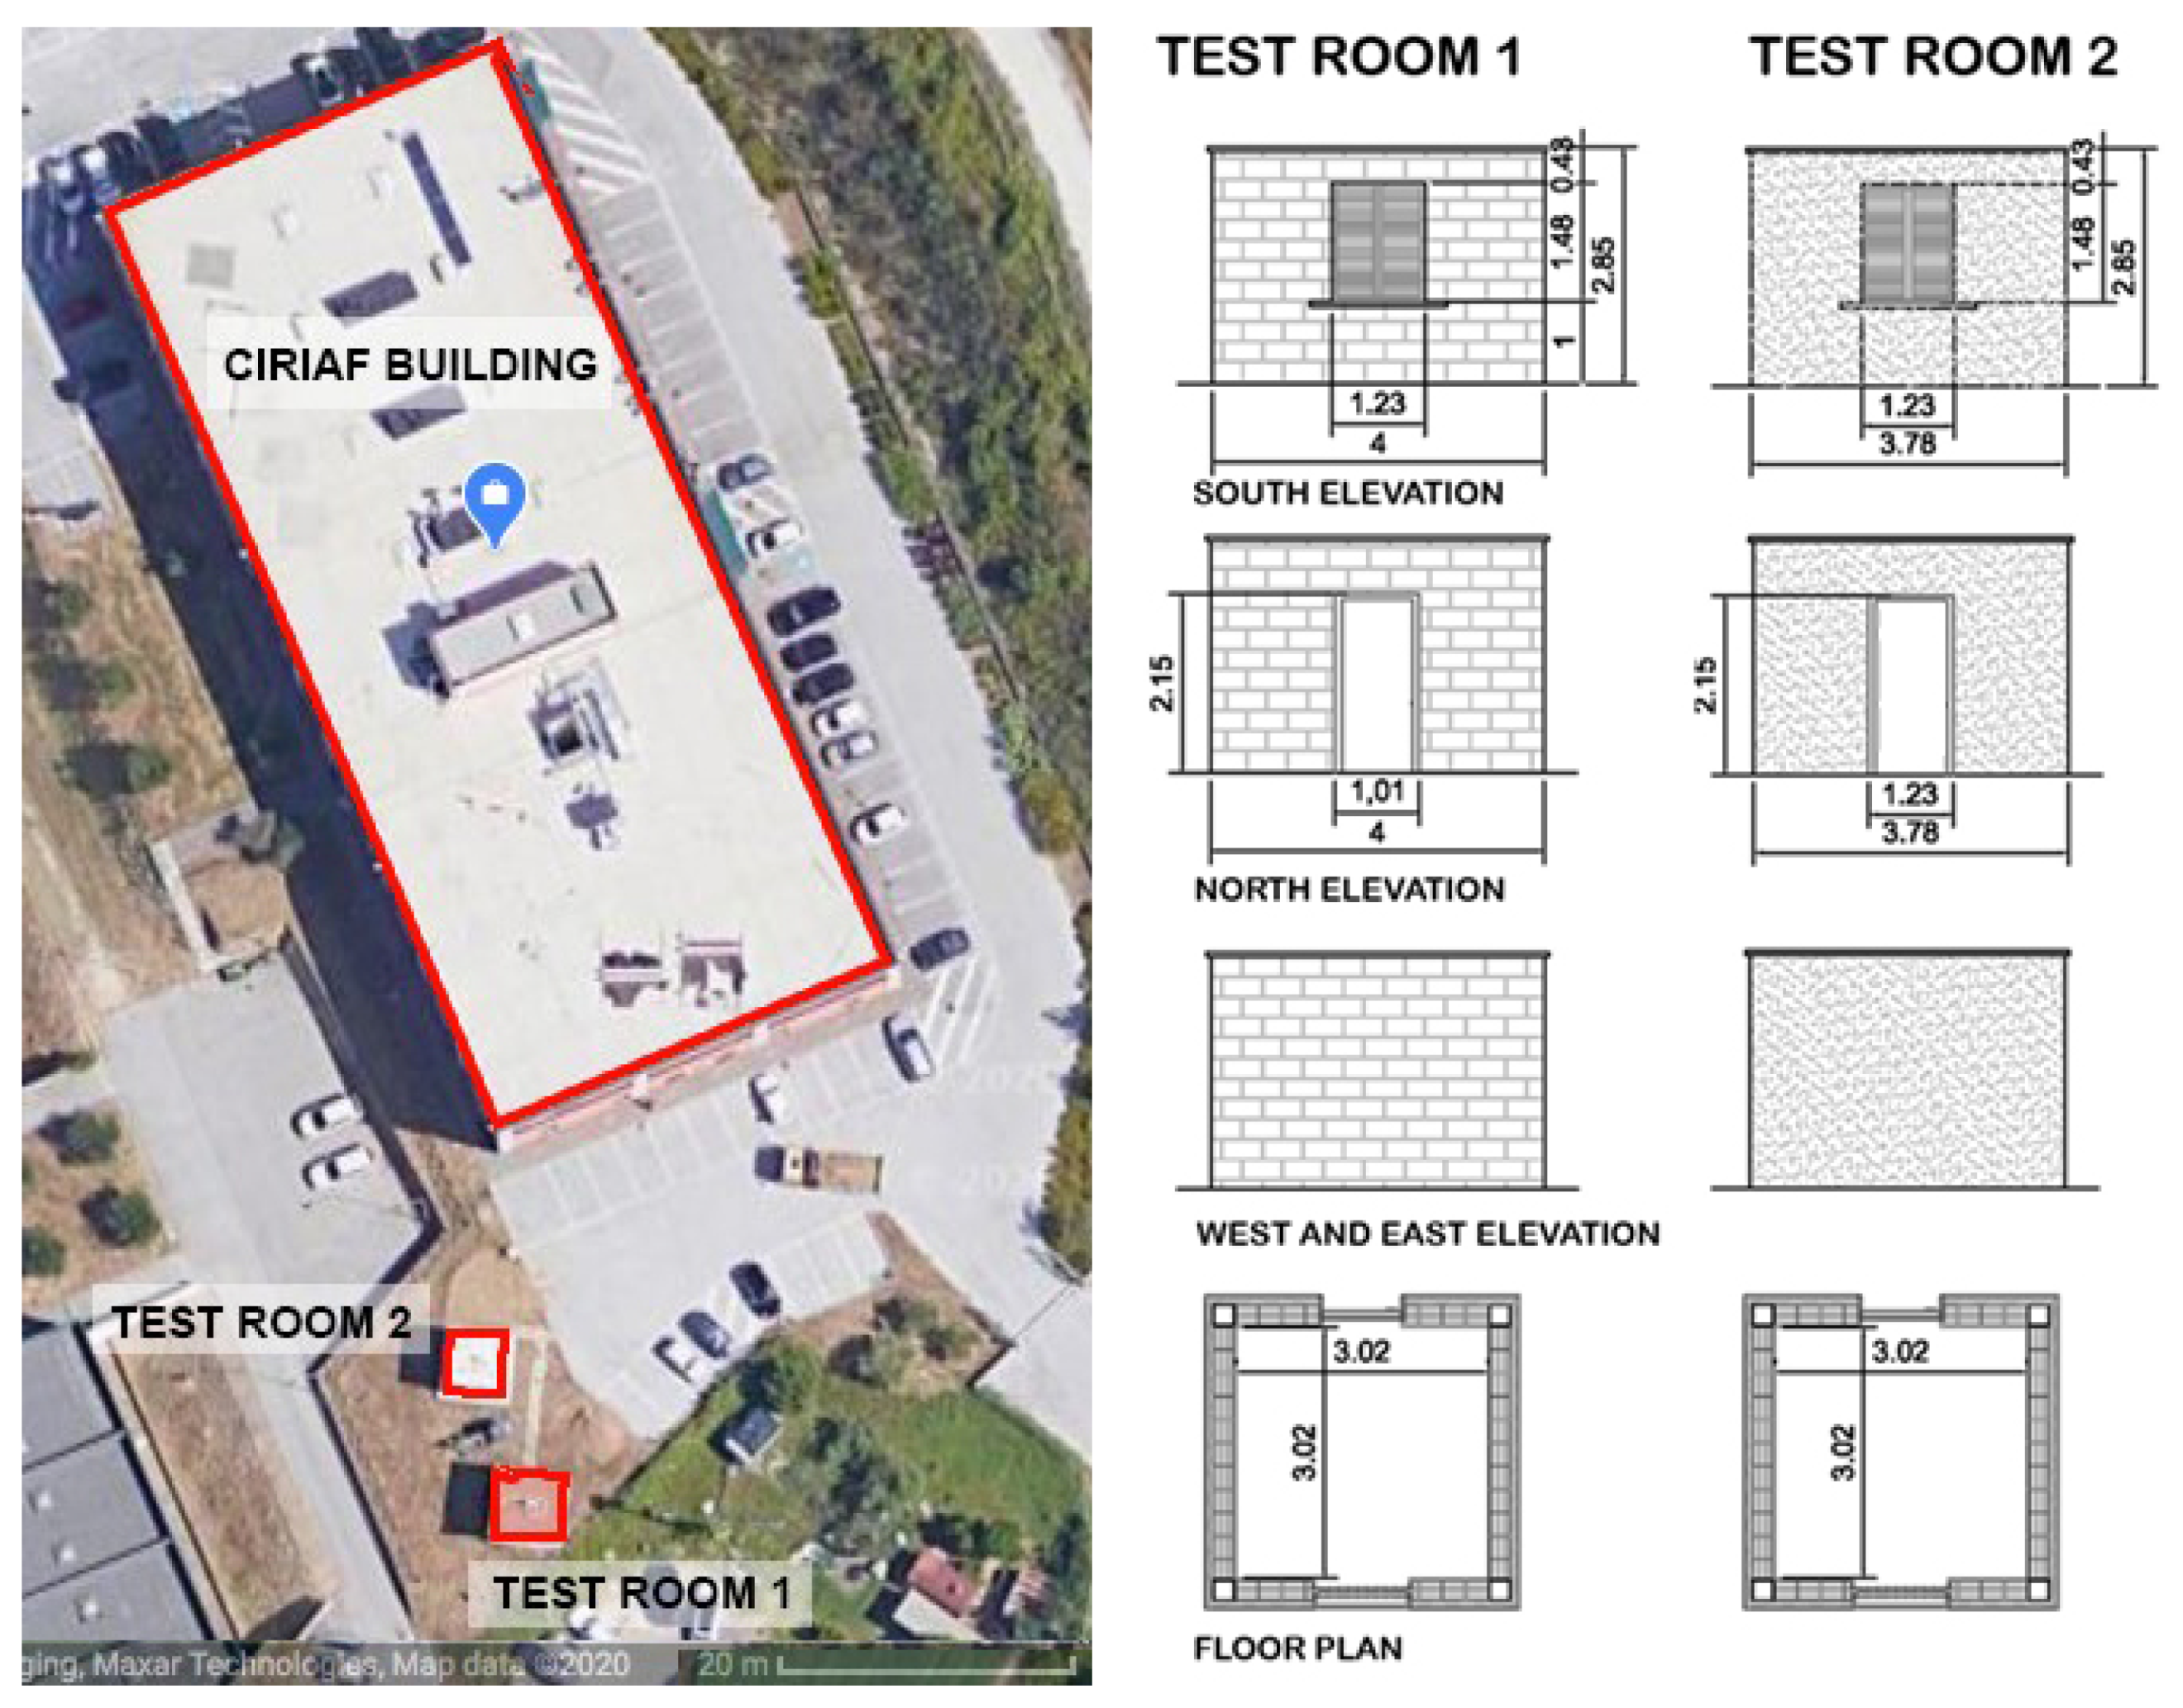
Two prototype buildings, i.e., test-rooms (TR) located at the Engineering Faculty of the University of Perugia (Italy) were monitored and the experimental campaigns’ data were collected (see Figure 2).
The location context is characterized by a temperate humid mild climate [32]. Both buildings have the same dimensions (3.78 m × 4.00 m × 2.85 m), structure, and orientation, as described in detail by Pisello et al. [31]. The real scale buildings have been monitored since 2012 and were the object of several studies regarding active and passive building systems.
The Test-room 1 (TR1) is the reference prototype building, while Test-room 2 (TR2) had its flat roof characteristics modified during time:
-
Test-room 2 (TR2-black) with bitumen coating installed from November 2012 until 9 July 2014. The coating consists of a black waterproof sheet of 1 cm, albedo 0.11 as described in [31,33].
-
Test-room 2 (TR2-white) with a white cool coating placed on 9 July 2014 until 18 September 2019. The coating was composed of a liquid waterproof polyurethane layer added to titanium dioxide and ceramic spheres, reaching 0.83 of solar reflectance [33,34].
-
Test-room 2 (TR2-green) with green extensive lightweight assembly installed on 18 September 2019 and ongoing. The system is described in previous Section 3.1.
Both test rooms are fully monitored in terms of indoor and outdoor surface temperatures and heat fluxes. Furthermore, indoor air temperature and relative humidity are also recorded. Each building has an installed pyranometer downward oriented for capturing the amount of global radiation reflected by the roof. The external surface temperature sensor was placed in direct contact with the substratum within the zoysia tenuifolia lawn, taking care to ensure perfect thermal contact with the surface.
The detailed description of the prototype buildings and the equipment setups was presented by Pisello et al. [31]. The authors demonstrated, through continuous monitoring in the winter, that both buildings have comparable energy comportment with slight variations in air and mean radiant temperature, indoor humidity, and skin surface temperature, that can be attributed to the different roofs’ albedo and transpiration rates [31].
For brevity, we summarize the roof assemblies in Table 2. The roof thermal transmittance (U-value) equals 0.25 W/m 2 · K for both buildings before the installment of the green roof assembly. Such a value can be classified as well insulated [25]. For instance, the Tabula report [35], which mapped the typologies of the building stock in Italy, considers a roof with 0.23 W/m 2 · K as a high technology renovation standard achievement.
Finally, an outdoor weather station is located on the rooftop of the CIRIAF research center, also at the Faculty of Engineering (43 ° 07 N, 12 ° 21 E). The station has a thermohygrometer, a pyranometer, a direction and speed anemometer, a sunshine duration sensor, and a rain gauge. All sensors from the weather station and prototype building collect data every 10 s and produce average values every 10 min [32].

3.3. Experimental Methodology

Green roof’s performance is a function of several factors such as climatic boundaries conditions (incoming solar radiation, air temperature, and humidity levels), design solutions of roof stratigraphy, geometry, materials, etc.
As already discussed, additional thermal insulation and thermal storage capacity provided by the roof can be numbed in a well-insulated structure, particularly in winter conditions. In our case, the experimental building has a good level of insulation, but it still allows us to evaluate the roof performance.
Therefore, in this work the winter performance of the green roof stratigaphy presented in Section 3.1 was assessed and compared to the reference tiled roof stratigraphy firstly, and in a later stage, compared to two other roof coatings that were installed on the same prototype building in the previous years.
The first step of the analysis was carried out by direct comparison of the monitored data from TR1 and TR2-green under identical boundary conditions, i.e., outdoor climatic conditions and indoor free-floating conditions.
Then, in a second stage, a comparison with measurements of the previous coatings applied to TR2, i.e., bitumen and cool coating was carried out. The bitumen coating was characterized by a very low albedo index (0.11) [34], while the white polyurethane coating or “cool-roof”, had very high albedo (0.83), thereby reflecting most of the incoming solar radiation [33,34].
Direct comparison between TR1 and TR2-green monitored profiles was carried out by also considering local meteorological boundary conditions, and involved reflected radiation, external and internal surface temperature, thermal flux, and indoor air temperature.
The same parameters were taken into account for comparing the different roof configurations. However, this time normalized reflected radiation ( R a d 1 n o r m and R a d 2 n o r m ) and external surface temperature ( T e 1 n o r m and T e 2 n o r m ) profiles were firstly calculated according to the following Equations:
R a d 1 n o r m ( t ) = R a d 1 m e a s ( t ) ( R a d m a x R a d a v e ) ; R a d 2 n o r m ( t ) = R a d 2 m e a s ( t ) ( R a d m a x R a d a v e )
T e 1 n o r m ( t ) = T e 1 m e a s ( t ) ( T m a x T a v e ) ; T e 2 n o r m ( t ) = T e 2 m e a s ( t ) ( T m a x T a v e )
where, in Equation (1), the R a d 1 m e a s and R a d 2 m e a s , in W/m 2 , are the reflected radiation measured by the pyranometers at time t for TR1 and TR2, respectively; R m a x is the maximum incoming solar radiation and R a v e is the average incoming solar radiation for the selected days, both measured in W/m 2 .
Correspondingly, Te1 m e a s and Te2 m e a s are the external surface temperatures, in ° C, measured by the sensors at time t for TR1 and TR2, respectively; T m a x is the maximum outdoor air temperature and T a v e is the average outdoor air temperature from the weather data for the selected days, both in ° C. The same calculation was also carried out for the internal surface temperatures (Ti1 m e a s and Ti2 m e a s and the indoor air temperatures (Ta1 m e a s and Ta2 m e a s ).
In sequence, the normalized reflected radiation difference ( Δ R a d n o r m ), the normalized external and internal surface temperature differences ( Δ T e n o r m and Δ T i n o r m ), the normalized indoor air temperature differences ( Δ T a n o r m ), and the normalized heat flux difference ( Δ q n o r m ) between the roofs were also calculated according to Equations:
Δ R a d n o r m ( t ) = R a d 1 n o r m ( t ) R a d 2 i , n o r m ( t )
Δ T e n o r m ( t ) = T e 1 n o r m ( t ) T e 2 i , n o r m ( t )
Δ T i n o r m ( t ) = T i 1 n o r m ( t ) T i 2 i , n o r m ( t )
Δ T a n o r m ( t ) = T a 1 n o r m ( t ) T a 2 i , n o r m ( t )
Δ q n o r m ( t ) = q 1 ( t ) q 2 i ( t ) q 1 m a x q 1 a v e
where, in Equation (3), R a d 1 n o r m is the normalized value for the reflected radiation from TR1 at time t, while R a d 2 i , n o r m is the normalized value for the reflected radiation from TR2 at time t, both obtained by Equation (1).
Correspondingly, Te1 n o r m is the normalized value for TR1 at time t; Te2 i , n o r m is the normalized value for TR2 at time t, both obtained by Equation (2).
In Equations (3)–(7), the i-index can be either 1, 2, or 3 and indicates the specific roof configuration of TR2, i.e., 1 = green, 2 = white, and 3 = black.
Each of the above-mentioned profiles was post-processed in order to define the average winter behavior. The days selected correspond to the maximum number of days monitoring with comparable winter outdoor conditions (air temperature and radiation) and the test-rooms operated under a free-floating regime.
Additionally, the normalized temperature and radiation profiles of 3 consecutive days were also compared for better investigating the differences among the various configurations.

4. Results and Discussion

4.1. Global Reflected Radiation

4.1.1. TR2-Green Compared with Tiled Roof (TR1)

Figure 3 shows the global incoming radiation profile from the weather station and the reflected radiation profiles for TR1 and TR2-green in the 3 selected representative days. As expected, TR2-green is always associated with lower reflected radiation values, while the reflected radiation peak on TR1 is 171 W/m 2 , against a value of 148 W/m 2 in TR2-green. Both peaks were registered on the second day, at 13 h during correspondence to the peak of incoming solar radiation (750 W/m 2 ). The mean difference is of 12 W/m 2 higher on TR1, i.e., about 7% of the maximum registered reflected radiation.
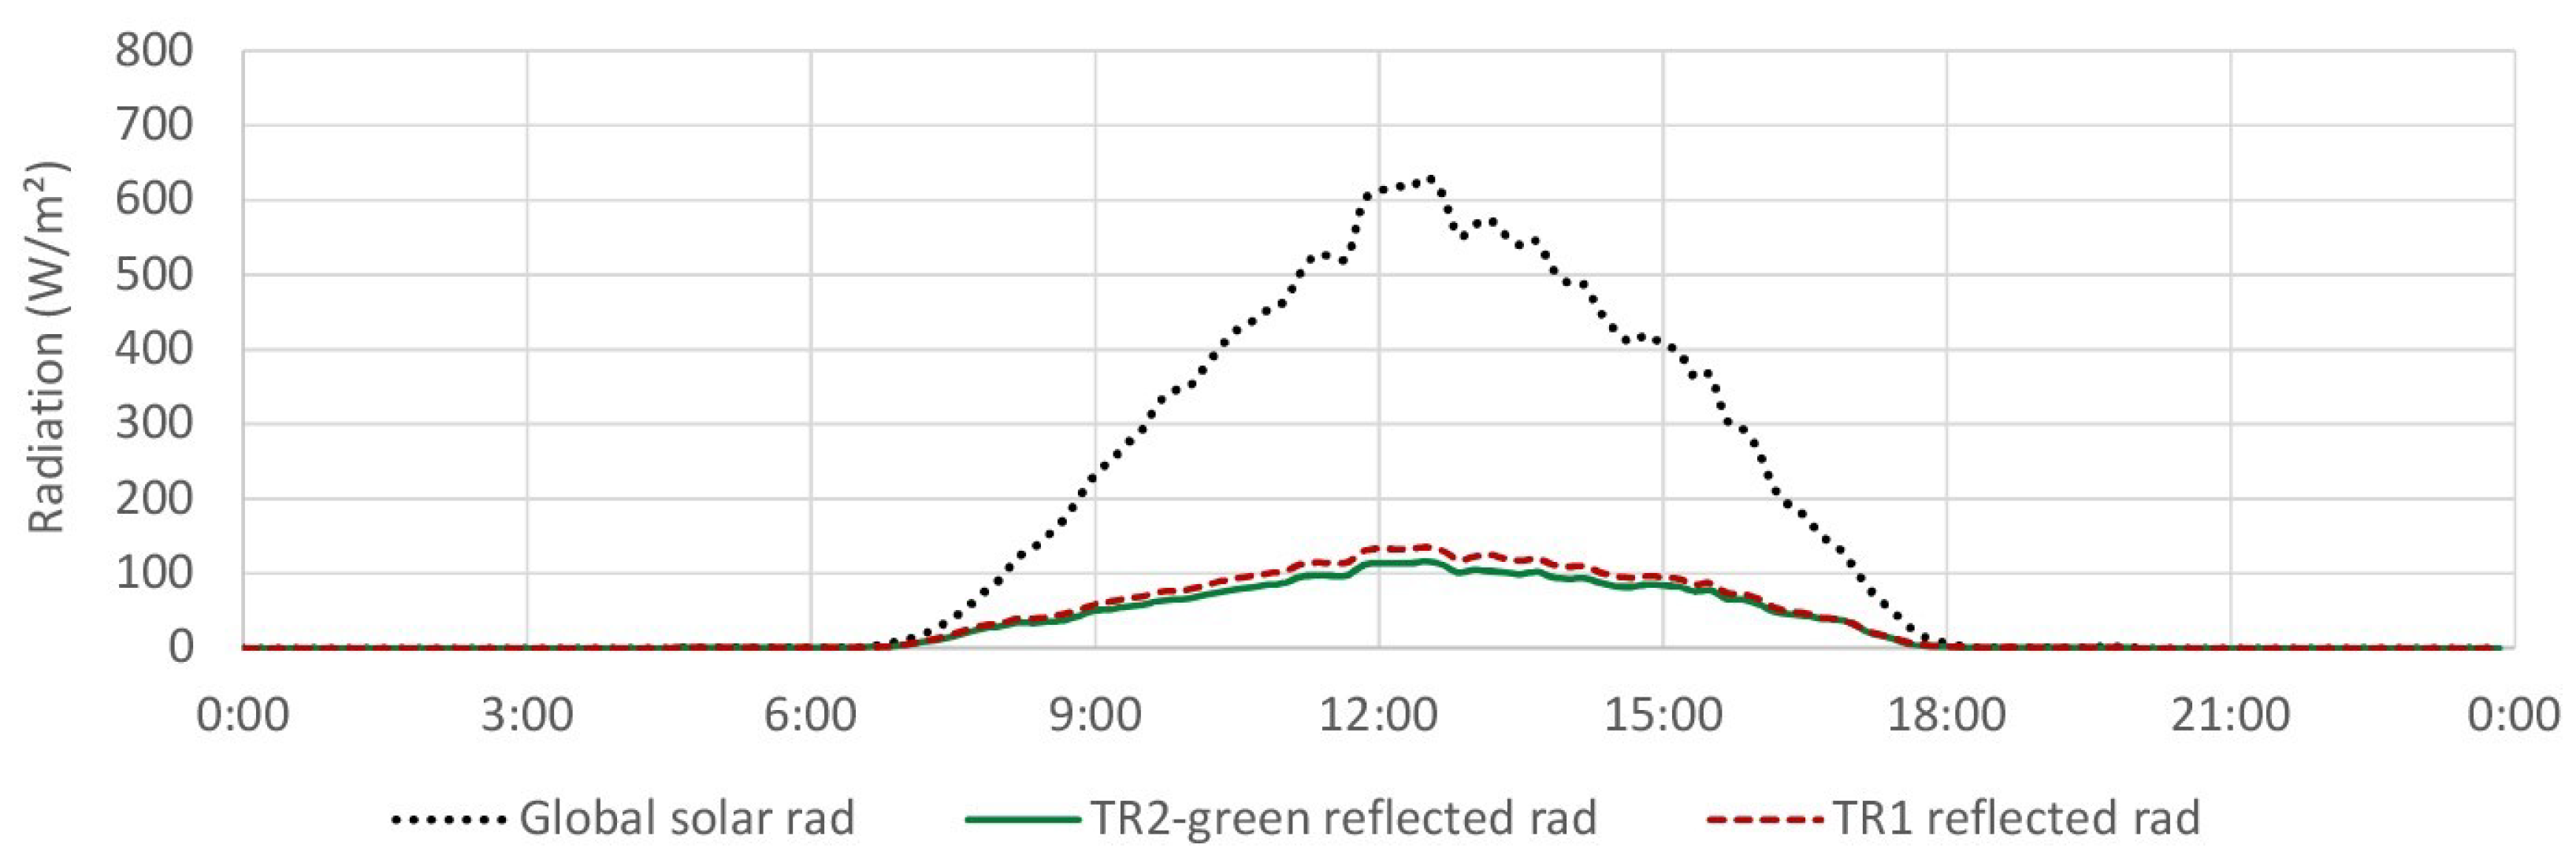
The average results for the selected 25 days, (Figure 4), show peak values of 136 W/m 2 on TR1, and 116 W/m 2 on TR2-green registered at 12:30, corresponding to an average difference of about 8 W/m 2 , i.e., 6% of the maximum registered reflected radiation. TR1 average reflected radiation was 55 W/m 2 , while TR2-green only reached 47 W/m 2 .

4.1.2. TR2-Green Compared with Black and White Coating

During the 3-days observed, in Figure 5, the radiation reflected by TR2-white is the highest: about 30% more than TR1.
TR2-white is considered a cool coating, therefore, it has a large reflectance value (around 70–85%). The green roof absorbs slightly more radiation than the ceramic tiles, with peak difference (regarding TR1) of about 8%.
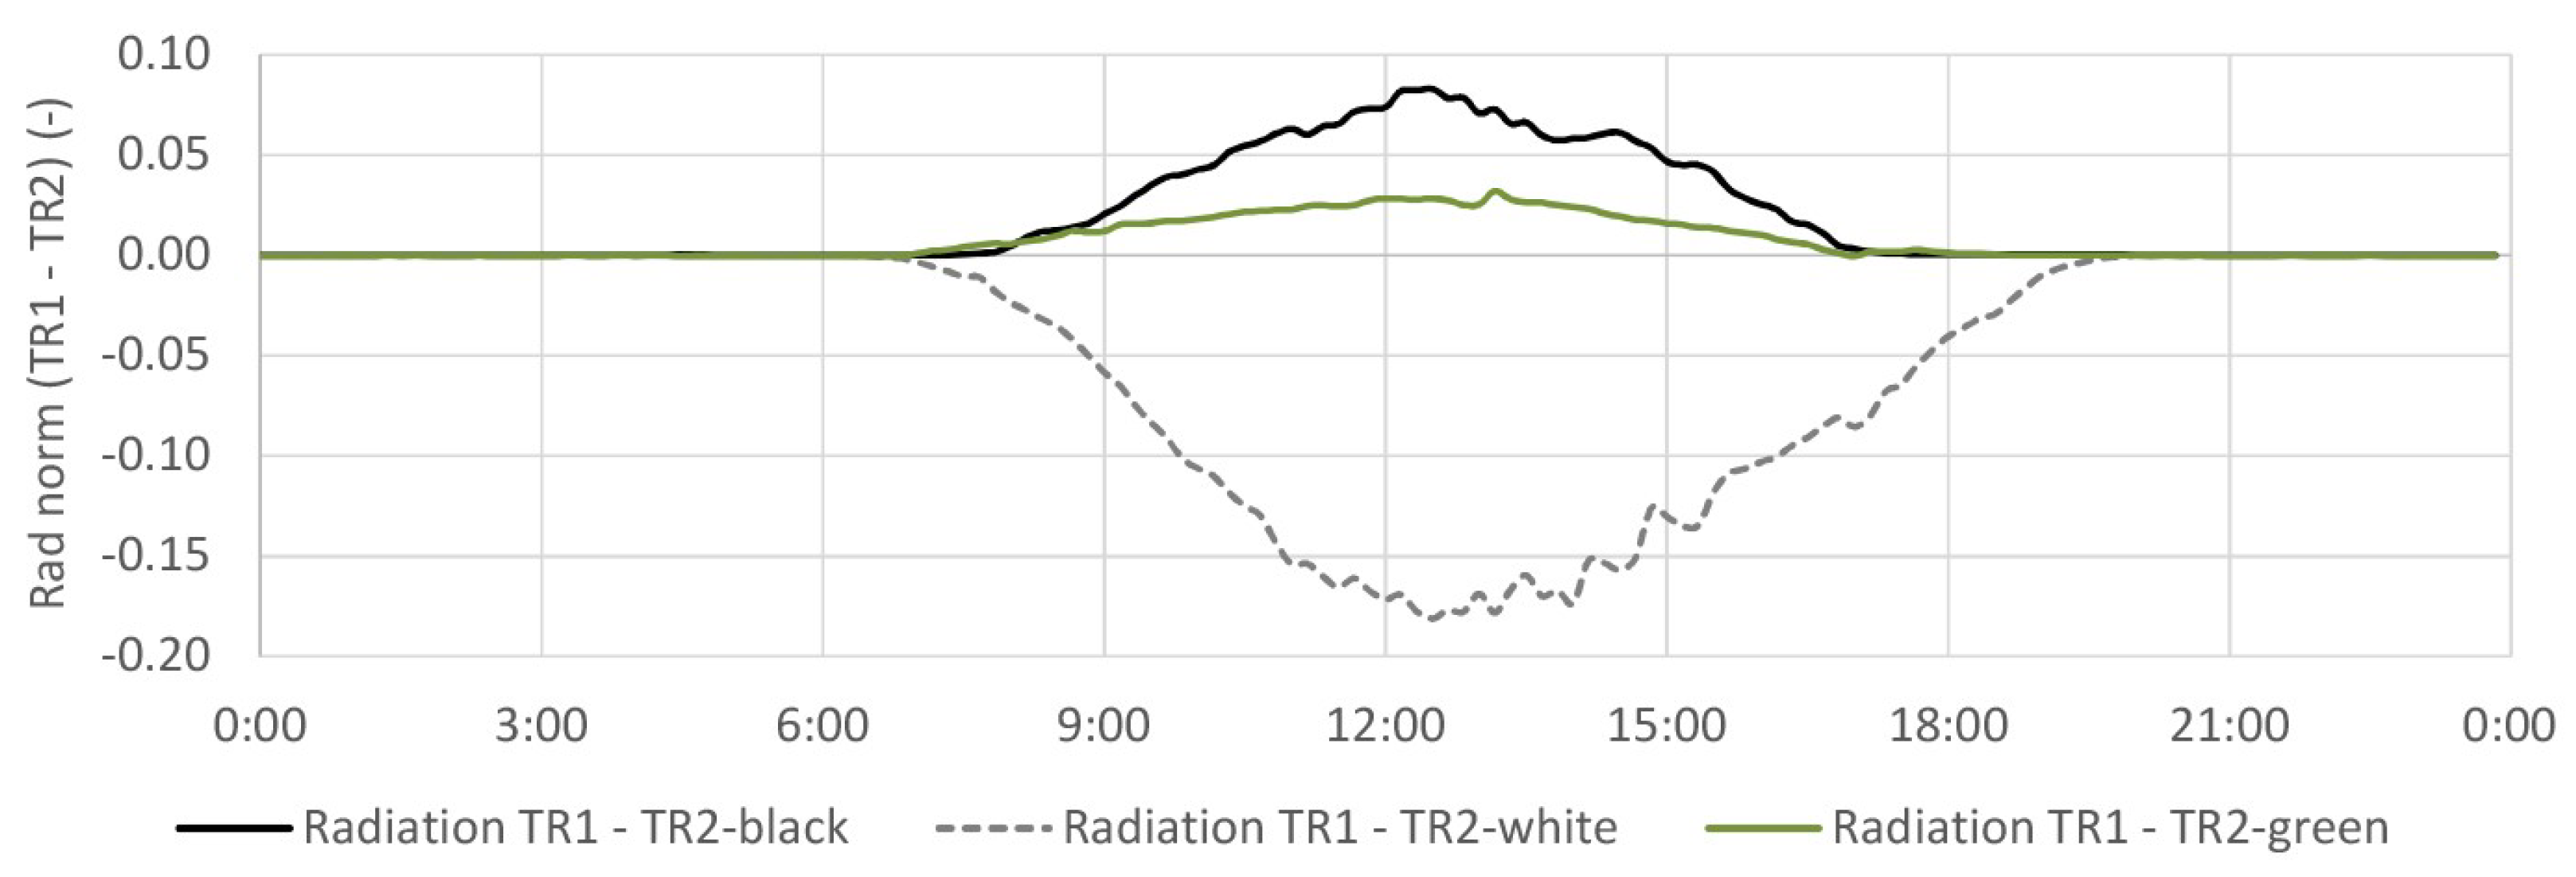
The calculated average from 25-days confirms the behavior. In Figure 6, TR2-white had higher peaks of reflectance compared to TR1, being more responsive to the solar incoming radiation. For TR2-black, it is assumed a typical reflectance value of 4–8% [36]. TR2-black absorbs more of the incoming radiation, with peak value at 12:30.
Concerning the solar heat gains through incoming radiation, the reflectance variation between the surfaces affects the buildings’ thermal performance. According to Pisello [36], a red natural clay tile solar reflectance is about 28 to 44%, while a grass-covered area typically is 20%. This difference is observed on the TR1 and TR2 measurements, where TR2-green reflected about 14% less than TR1.
As stated by Berardi et al. [12], for green roofs, about 20–30% of the solar radiation is reflected while up to 60% is employed through photosynthesis. The rest is thermally transmitted through the assembly.

4.2. External Surface Temperature

4.2.1. TR2-Green Compared with Tiled Roof (TR1)

On the 3 days (Figure 7), TR1 average temperature is 16.8 ° C, with a maximum of 41.3 ° C, and a minimum of 3.3 ° C, which is almost double the TR2-green, with average temperature of 8.3 ° C, maximum of 22.3 ° C, and minimum 0.8 ° C.
The tiled roof presented on average 8.5 ° C higher temperature than the green roof, this might generate non-negligible thermal stress on the surface and reduce the lifespan of the components. The total temperature gap in the tiled roof is almost 38 ° C, while the green roof recorded 21 ° C.
Higher external surface temperatures could contribute to warm the building during the cold season [37]. However, reducing the temperature gap also translates in reducing the structure stress.
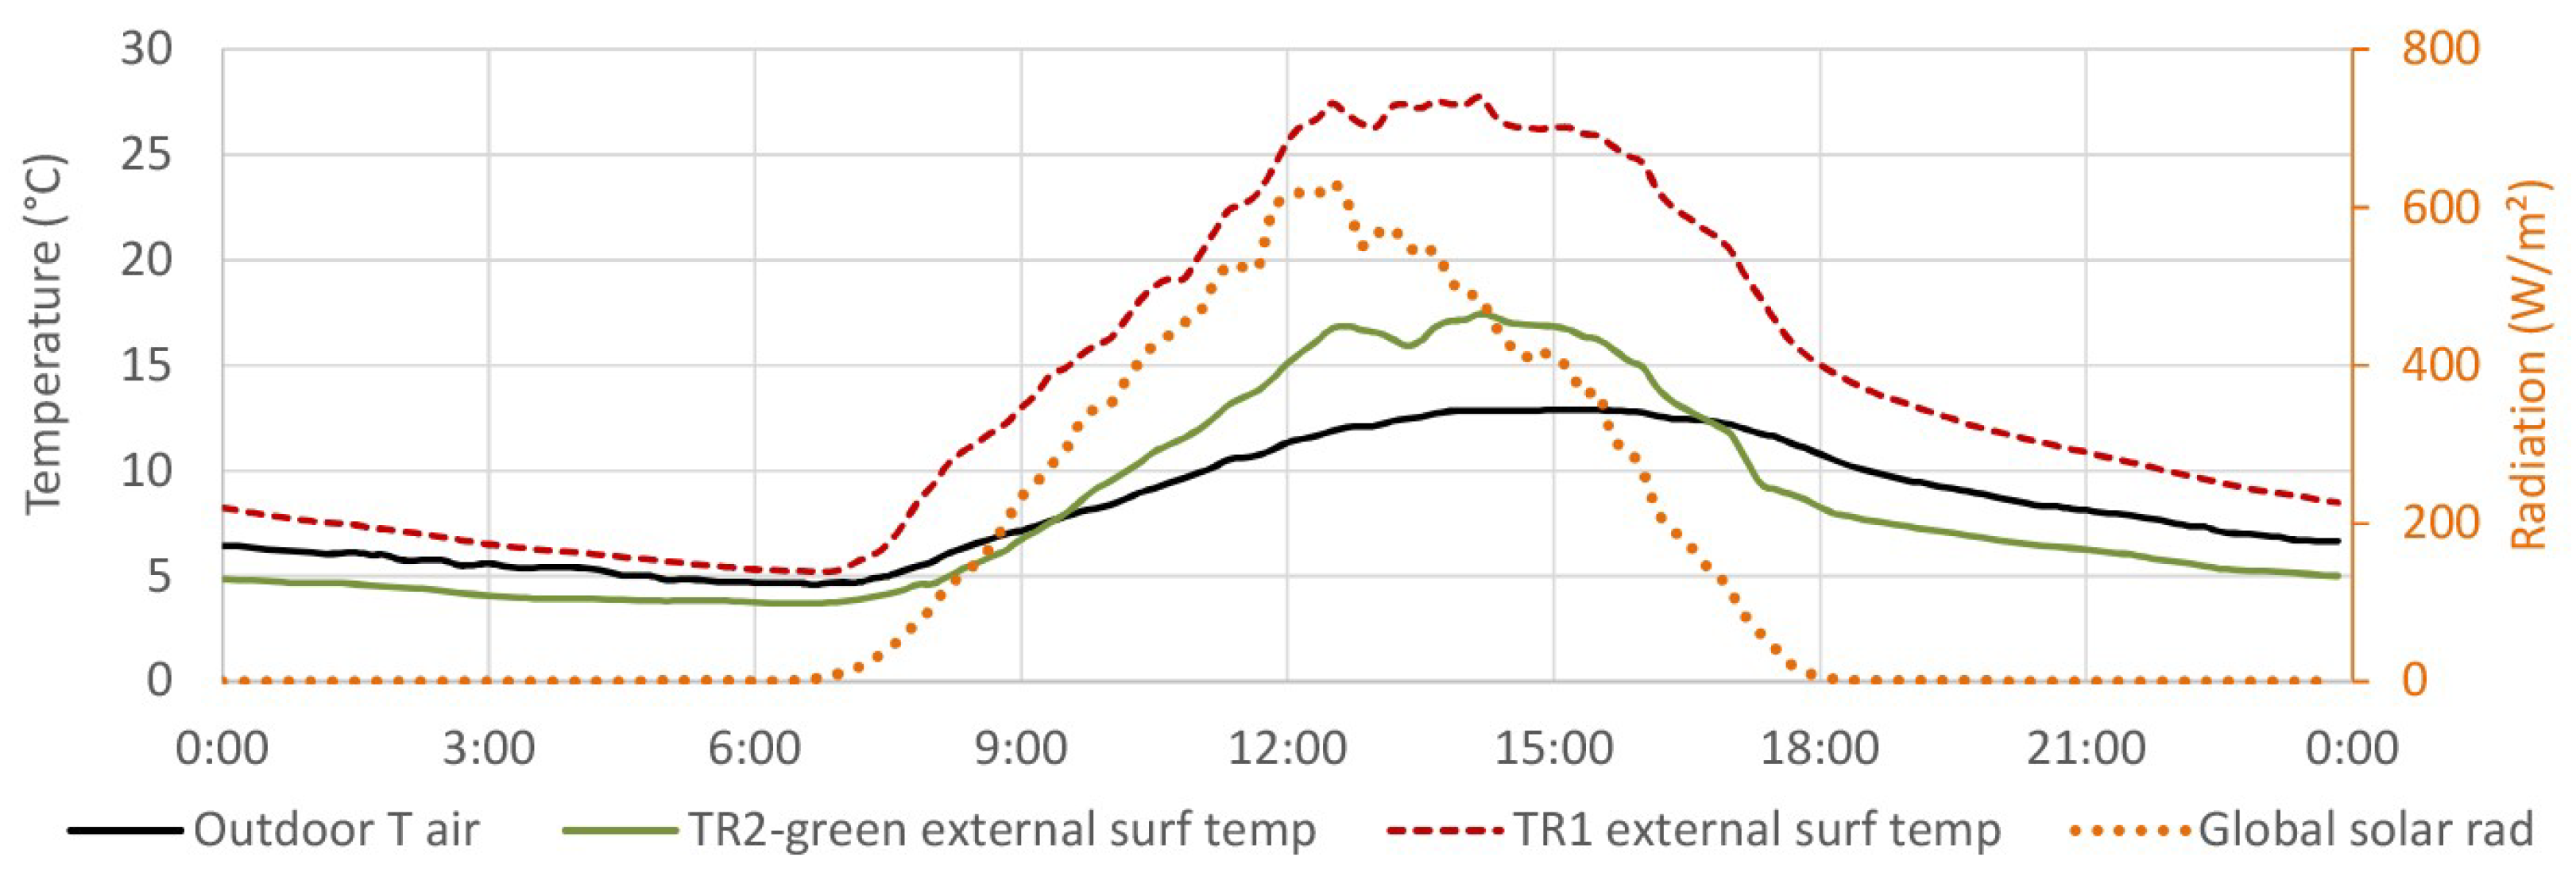
Figure 8 shows the average results, depicting a small reduction in the registered thermal gap. However, a similar behavior is still registered. TR1 average temperature is of 13.8 ° C, with a peak of 27.3 ° C, while TR2-green average temperature is 8.2 ° C, and a maximum temperature of 17.4 ° C is found at 14:10. The temperature gap reduces to 22.5 ° C in TR1 and becomes while TR2-green was 13.7 ° C in TR2-green.

4.2.2. TR2-Green Compared with Black and White Coating

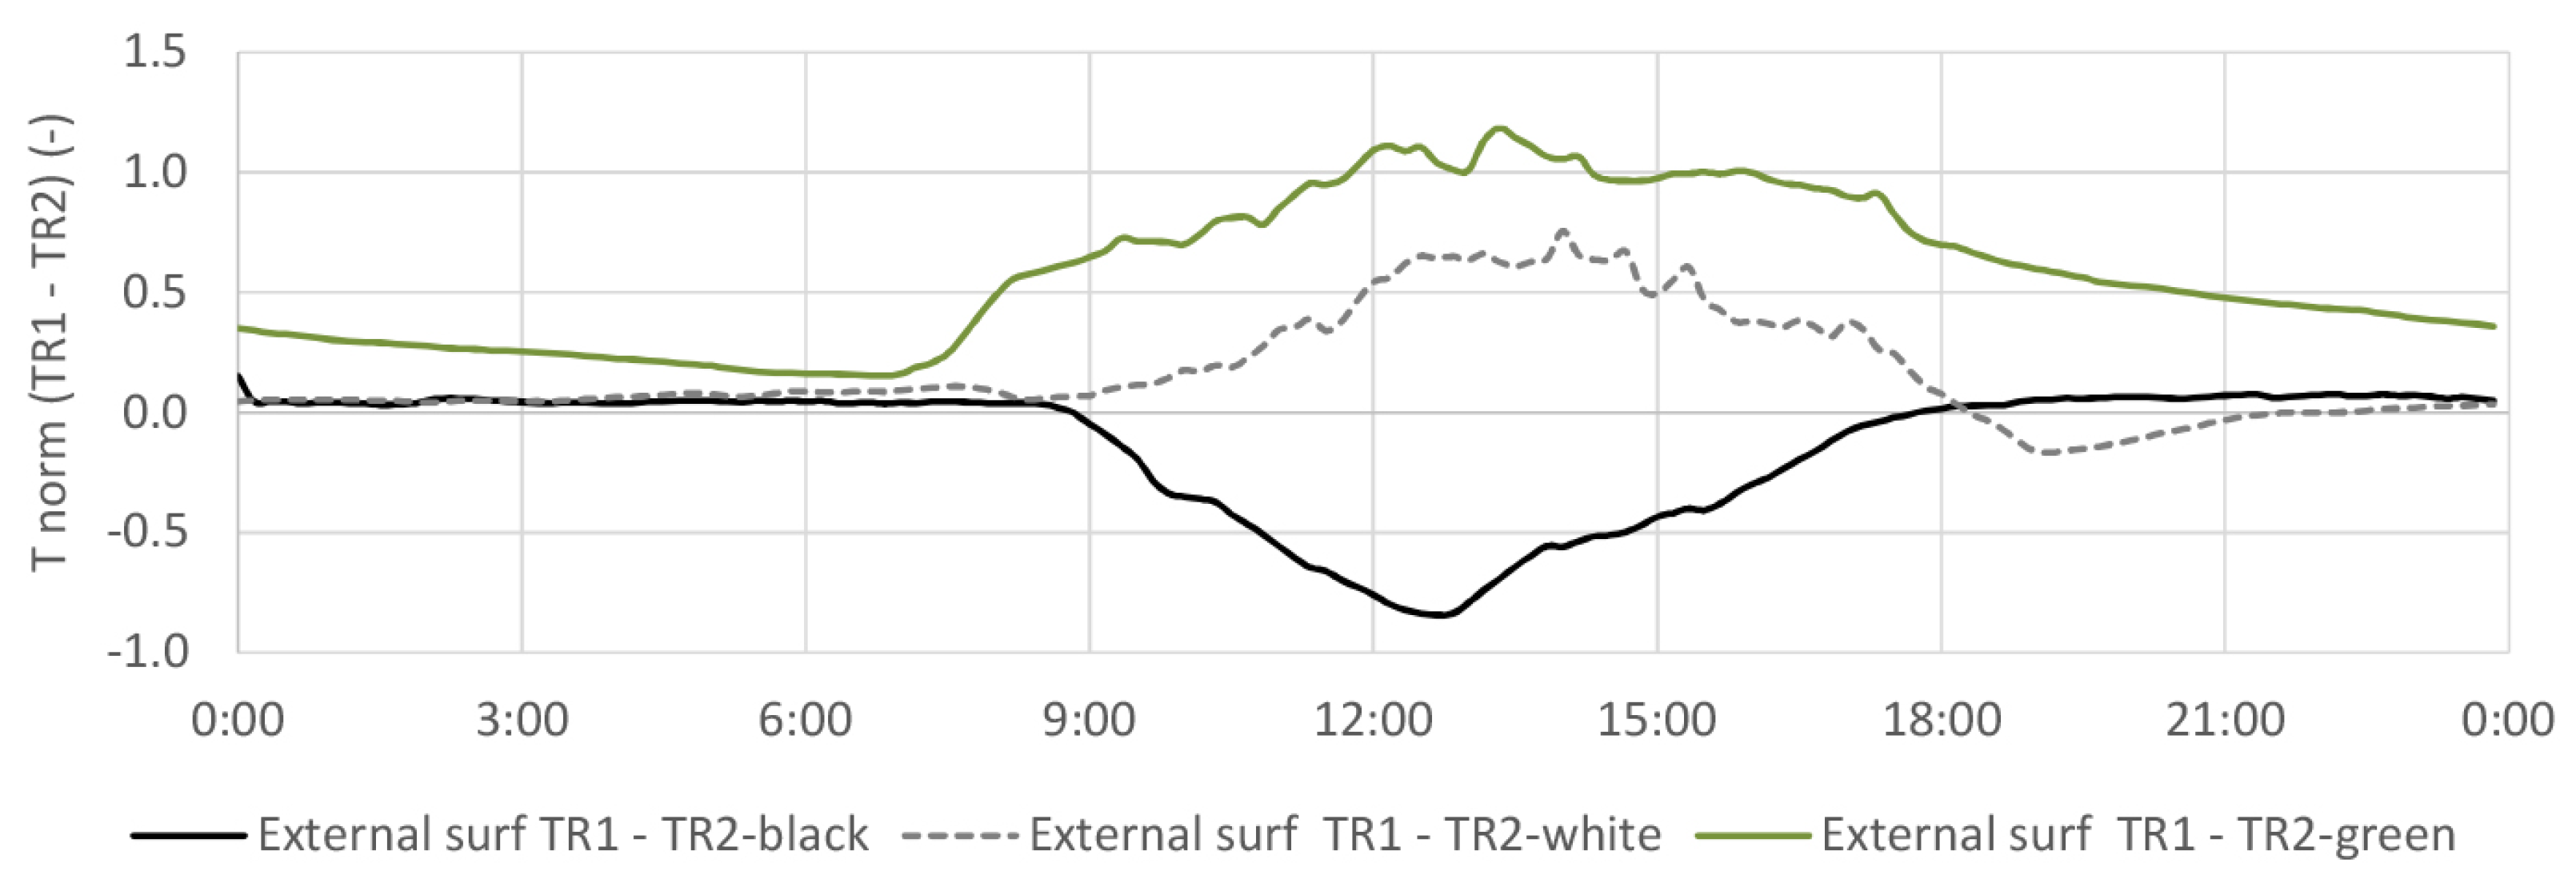
Figure 9 shows the normalized external temperature, the difference observed during the 3 days exhibit TR2-green and TR2-white with lower temperatures than TR1 of about 2.9 on the peaks. TR2-green presented less temperature fluctuations during the day, while the TR2-white had more. TR2-black reached a higher difference on the third day of 3.6 compared to TR1.
The measurements were taken during the first months of the implementation of the light-weight green roof. Since Zoysia tenuifolia is a macrotherm species, it was necessary to maintain high water contents within the system by combining artificial irrigation and rain. During the 25 days of monitoring presented in this work, the water content was exclusively provided by sprinkler irrigation, since it did not rain. An alarm system was active to assure a minimum water content in the felt layers.
Therefore, the additional sensible and latent heat storage contribution introduced by the large water content increased the overall storage capacity of the system. In fact, in Figure 9, the green roof reached the peak and maintained the temperature more stable during the day, and also after 18:00.
The 25-days observation (Figure 10) shows cooler peak temperatures on TR2-green, followed by TR2-white, and TR2-black that had higher surface temperature than TR1. Nonetheless, the results are less accentuated than the 3-consecutive days measurements.
Considerable temperature differences in external surface were also reported in other field experiments such as Liu and Baskaran [38], Niachou et al. [26], Parizotto and Lamberts [11], Guattari et al. [39] to name a few.
TR2-green presented lower temperatures also in comparison with TR2-white, an effect that might be attributed to the water content, and the evapotranspiration. It is also possible to conclude that the temperature remained more stable in TR2-green.

4.3. Internal Surface Temperature

4.3.1. TR2-Green Compared with Tiled Roof (TR1)

We observed similar internal roof surface temperature profile for the 3 and 25-days time series, in Figure 11 and Figure 12.
Respectively, the average temperatures for the TR1 were 10.5 ° C (3-days) and 10.7 ° C (25-days), and 8.6 ° C (3-days) and 9.6 ° C (25-days) for TR2-green. The TR2-green had lower inner surface temperature compared to TR1, by about 2 ° C, which is a disadvantage during the winter season. TR2-green registered around 2 ° C and 1.5 ° C lower temperatures than TR1.

4.3.2. TR2-Green Compared with Black and White Coating

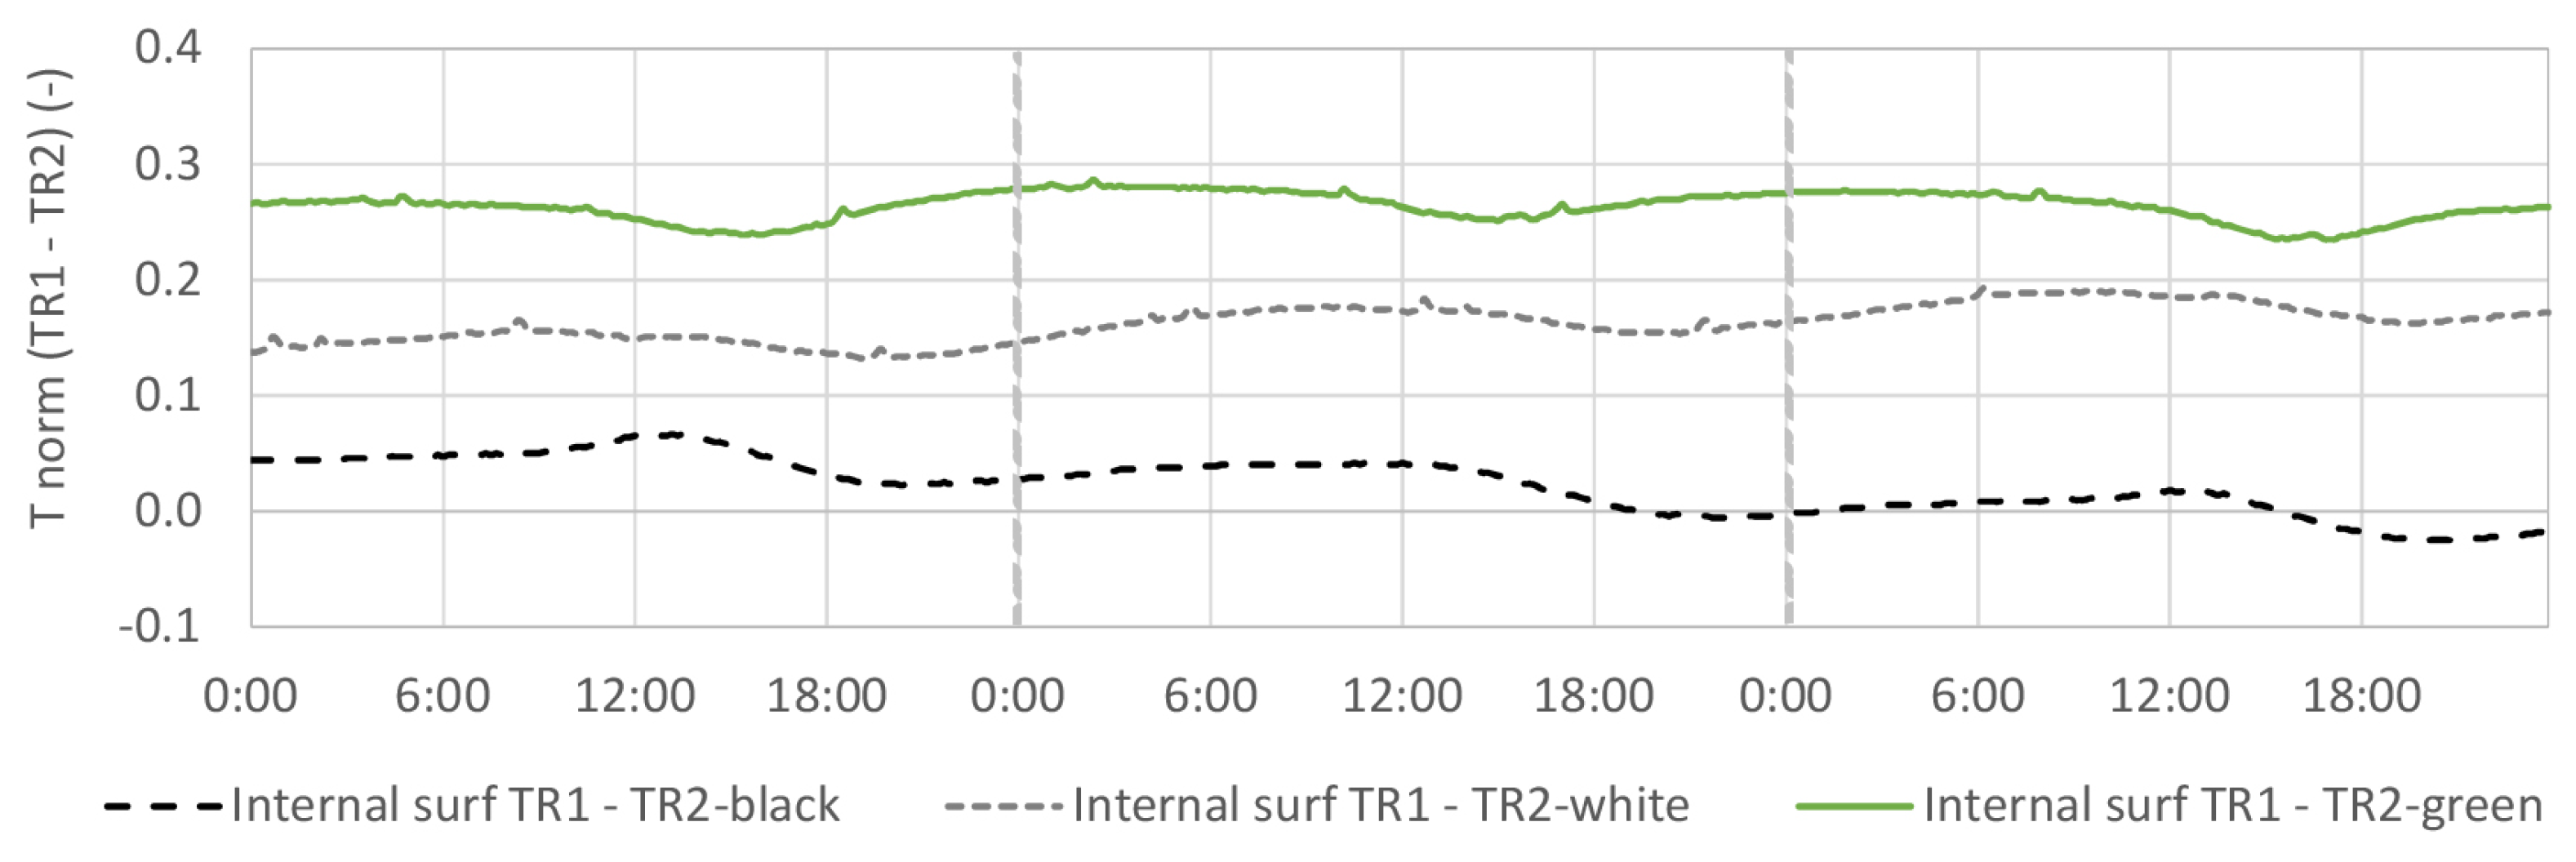
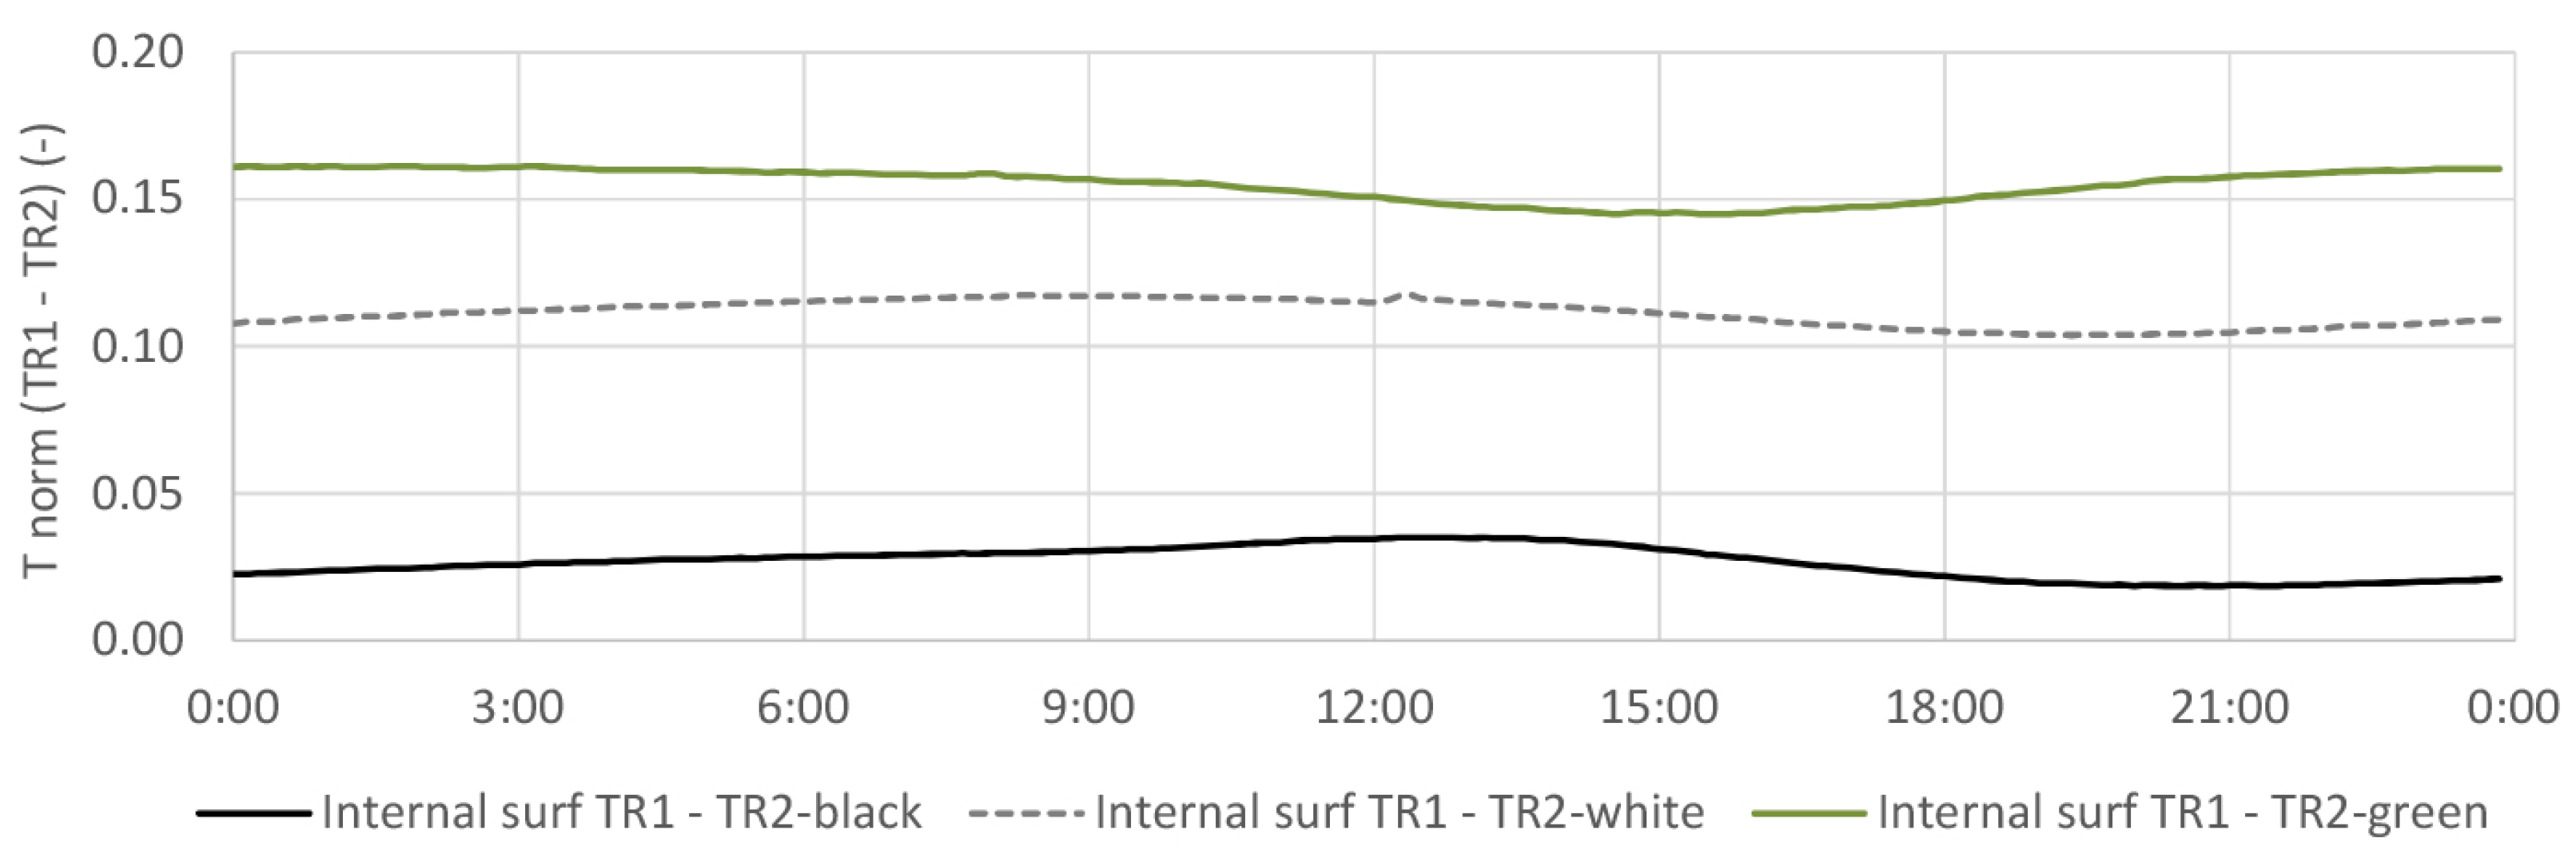
On the internal roof surface, the calculated difference of the TR2-black and the reference TR1 is the lowest.
During the 3 representative days, in Figure 13, it is possible to observe that only TR2-black had higher temperatures than TR1, and that occurred during the night. In Figure 13 and Figure 14, for all configurations, a smooth deviation can be noticed around 15:00.
TR2-green lower temperature in comparison with TR2-black and TR2-white could be an effect of the high water content stored in the felt layers, due to the added thermal capacity.

4.4. Thermal Flux

4.4.1. TR2-Green Compared with Tiled Roof (TR1)

Figure 15 shows the TR2-green and TR1 heat flux profile for the 3 representative winter days. As can be seen, the green roof is usually associated to higher heat flux values compared to the reference. Additionally, these values are always positive, i.e., the heat flow is always from the outdoors to the indoors. Negative values are instead registered for the reference roof, with a minimum of about −0.5 W/m 2 around 7:00.
TR2-green average flux is 0.9 W/m 2 , and extreme values of 2.4 W/m 2 and 0.2 W/m 2 are found in the morning at 6:00–7:00, and afternoon 14:00–15:00, respectively. On the other hand, TR1 average flux is 0.4 W/m 2 , and peak is 1.2 W/m 2 .
The profile of TR1 and TR2-green, in Figure 16, shows the average heat flux during 25 consecutive winter days. The peak heat flux (1.5 W/m 2 ) is almost double that registered in the reference building (around 0.8 W/m 2 ). Both TR1 and TR2-green had the peak flux shifted in comparison to the highest incoming solar radiation. During the early morning (4:00) until 9:30, TR1 dissipates heat towards the outdoors, while the heat flux in TR2-green remains positive.

4.4.2. TR2-Green Compared with Black and White Coating

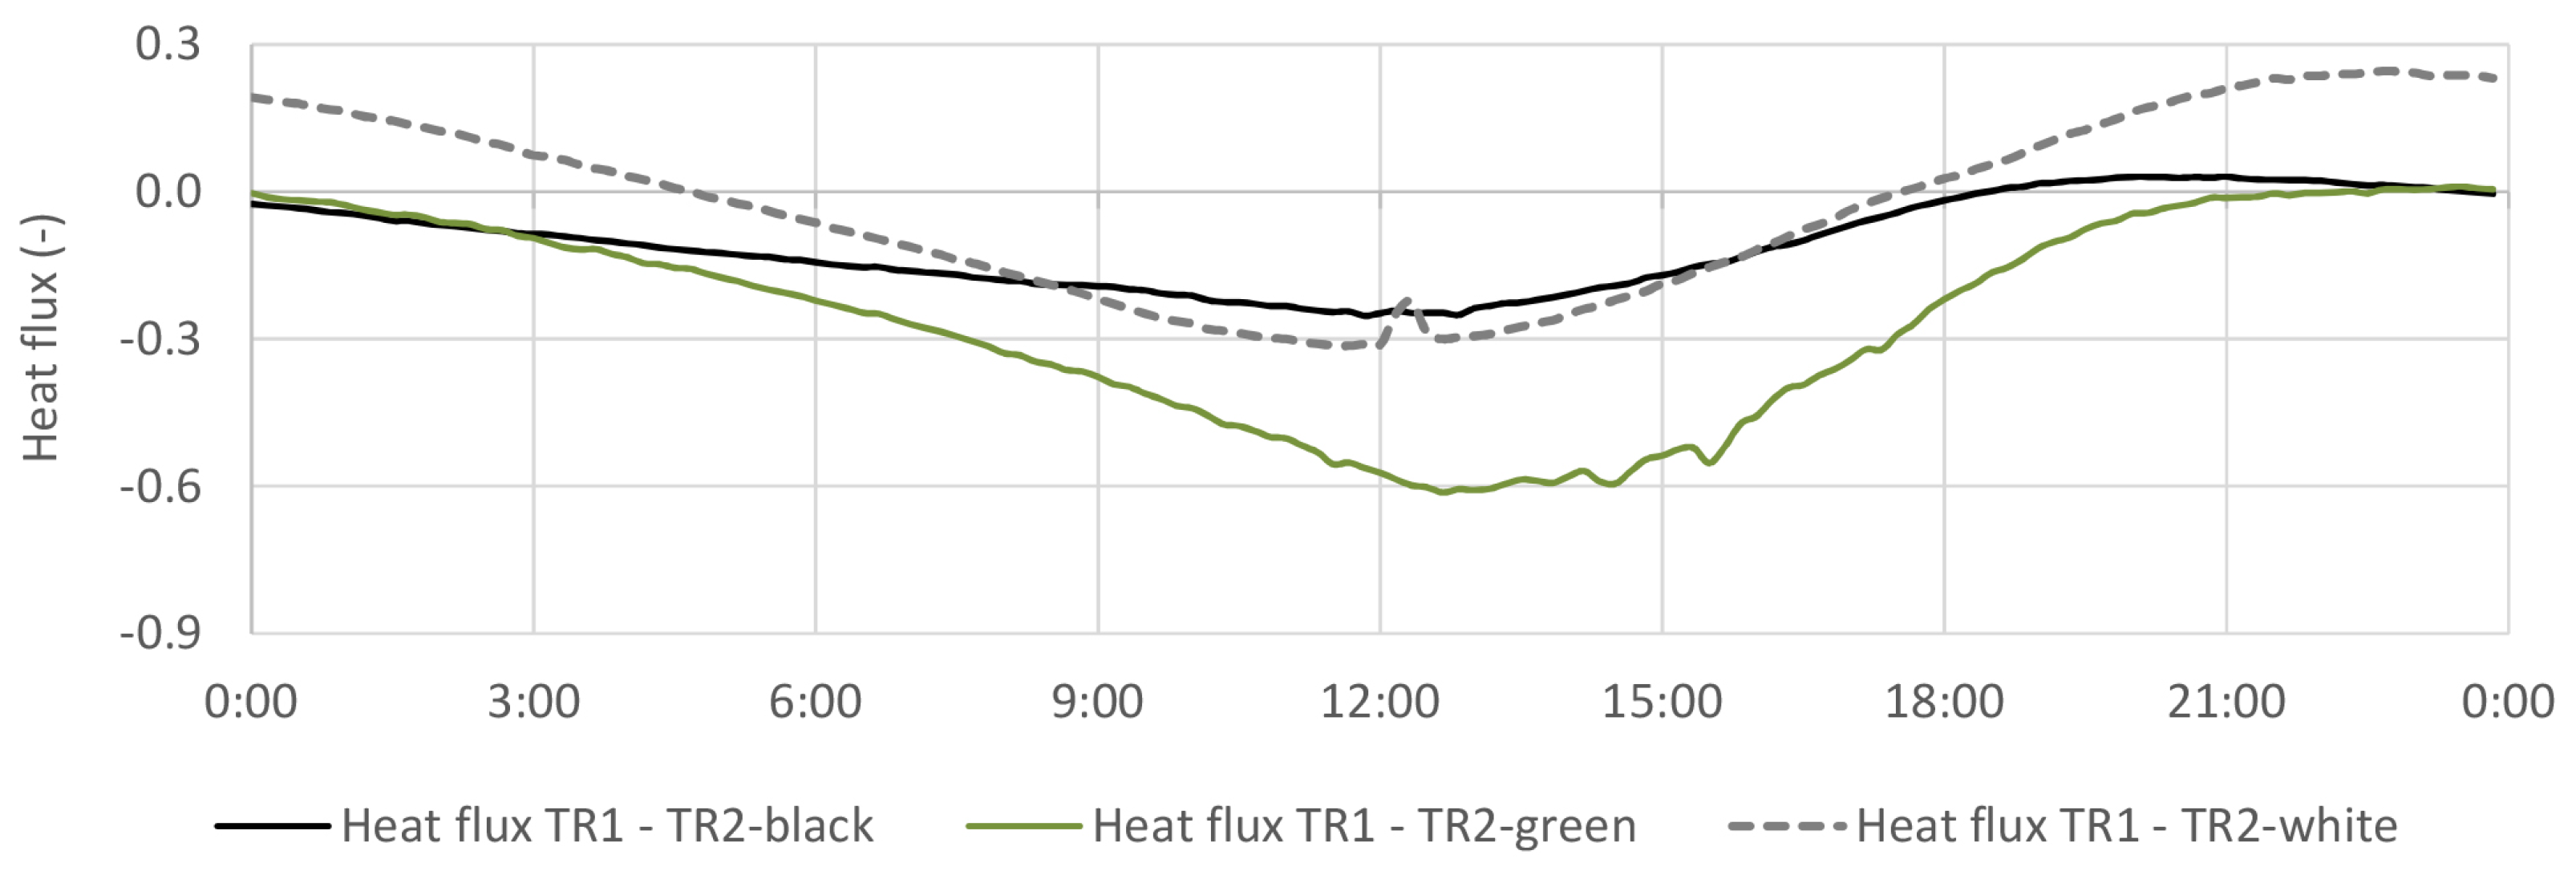
The thermal heat flux differences between the reference building and the three configurations of TR1 during the three selected consecutive days are presented in Figure 17.
The contrast in heat flux between TR2-black and TR1 are more accentuated in the night periods. The positive values show that the heat flux in TR1 was higher than TR2-black, except on day one, when both buildings show a similar behavior. Higher differences can be found when comparing TR2-white and TR1 (dotted gray line) in Figure 17. During the night, TR2-white had lower heat flux rates than TR1 and around noon the overall performance of the coatings reverse. In the TR2-green case, similar flux rates are found during the night, while the increased thermal inertia of the roof causes higher differences during the daylight hours.
The average normalized profiles in Figure 18 show that the TR2-black configuration behaves very similarly to the reference building, while the green configuration shows the highest differences in the early afternoon.
Indeed, the green roof had the highest thermal flux variation with respect to TR1 (0.6). The registered peak follows the incoming solar radiation, and drops to reach TR1 values around midnight. This is probably due to the large amount of water retained in the growing layer (as explained in Section 4.2) that increases the conductivity and interferes with the evaporation process [40,41,42].
In addition, in our case, the building is characterized by a good level of insulation, therefore, a significant heat flux reduction cannot be noticed. The high-water content of the felt subtract enters as thermal capacity enhancement and thermal conductivity increment [43] of the assembly.
Liu and Baskaran [38] observed a reduction of about 10 to 30% in the heat flow in the colder season. The observed effect of the freeze water was a reduction of the insulation value. According to Andenæs et al. [5], it is hard to precise the insulation response, but for sure there is a heat flow reduction even in high insulated constructions and in cold climates, where they are very discreet.
Bellazzi et al. [44] demonstrated that the discrepancy between calculated and measured thermal resistance of a green roof substrate could reach up to 40% according to the soil composition, compaction, and humidity. The authors highlighted the importance of developing standard calculations for substrates and drainage layer to reduce these distortions.

4.5. Indoor Air Temperature

4.5.1. TR2-Green Compared with Tiled Roof (TR1)

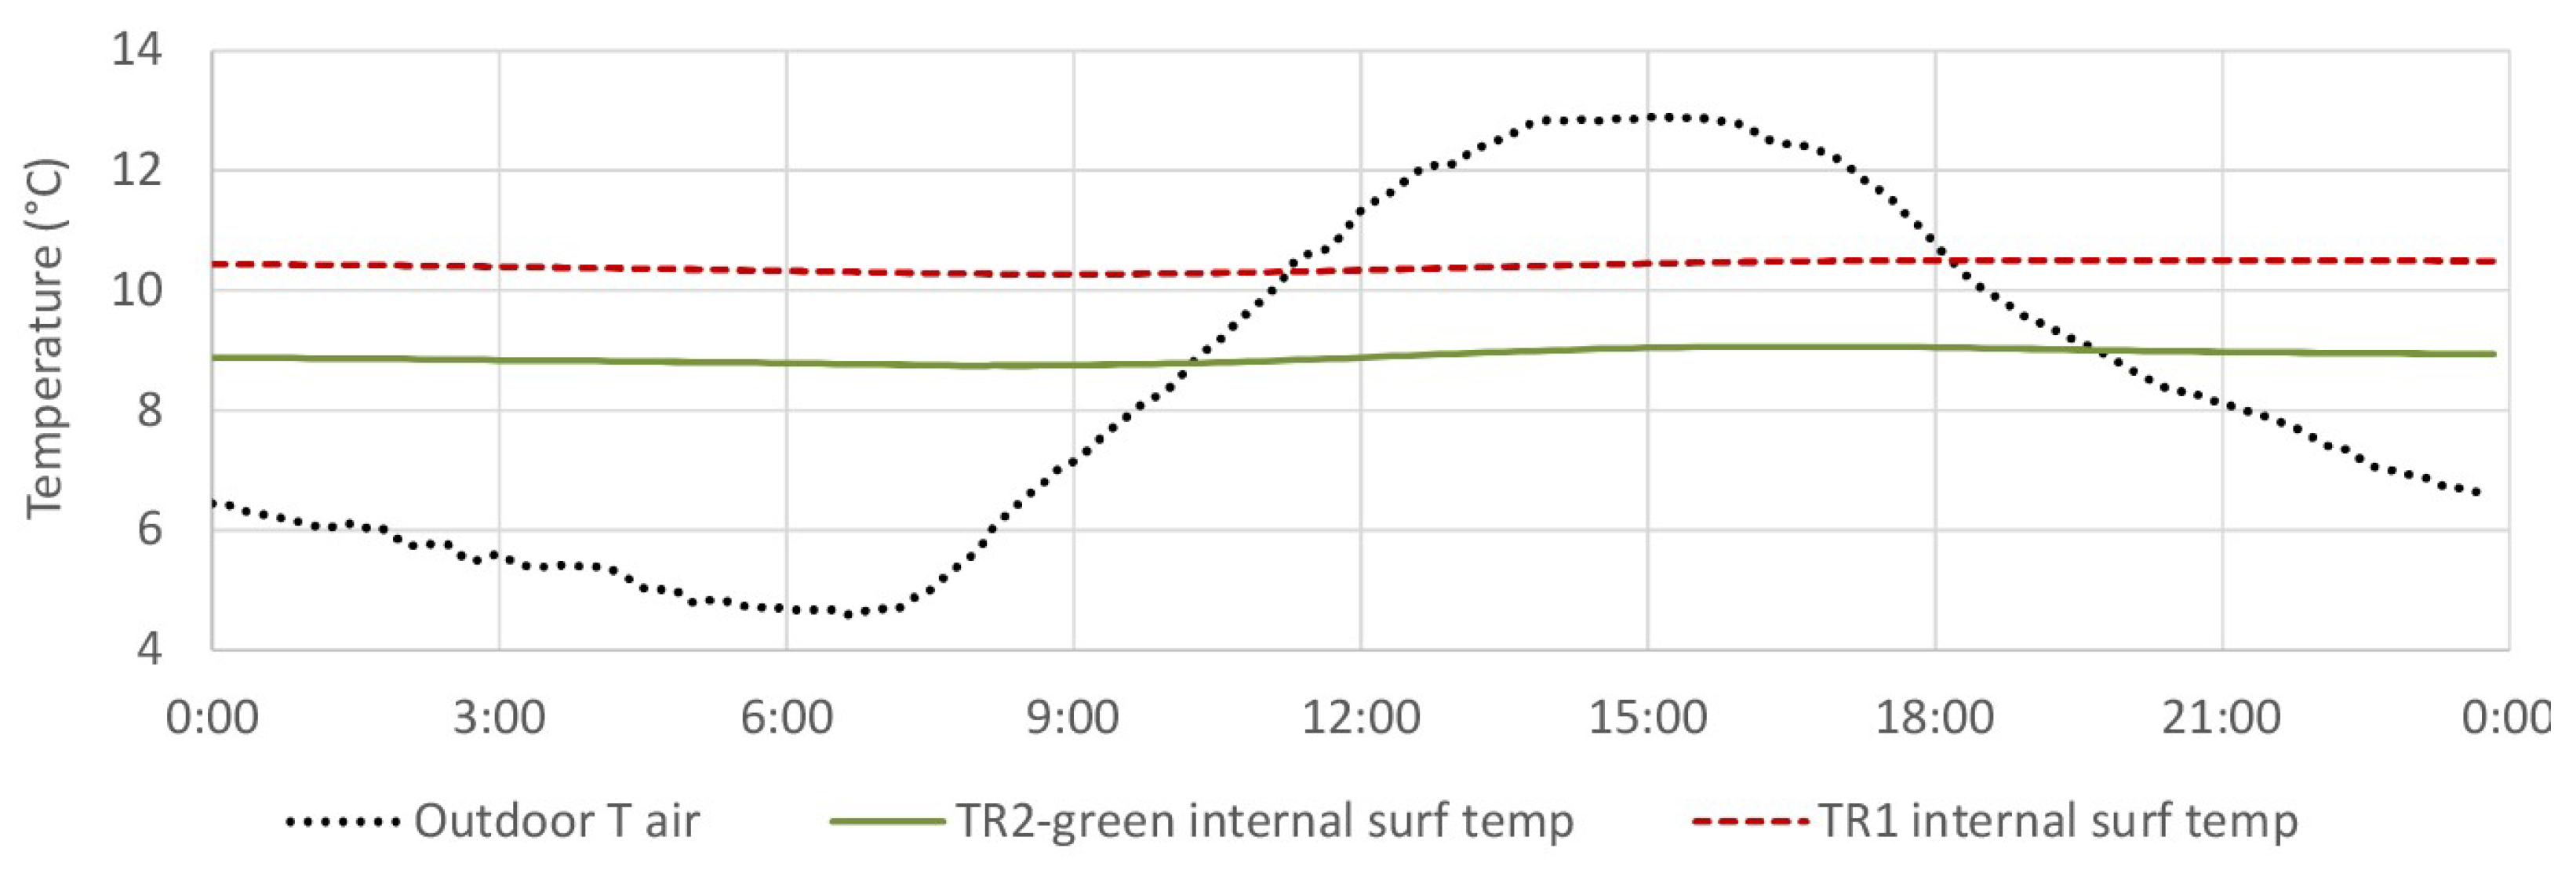
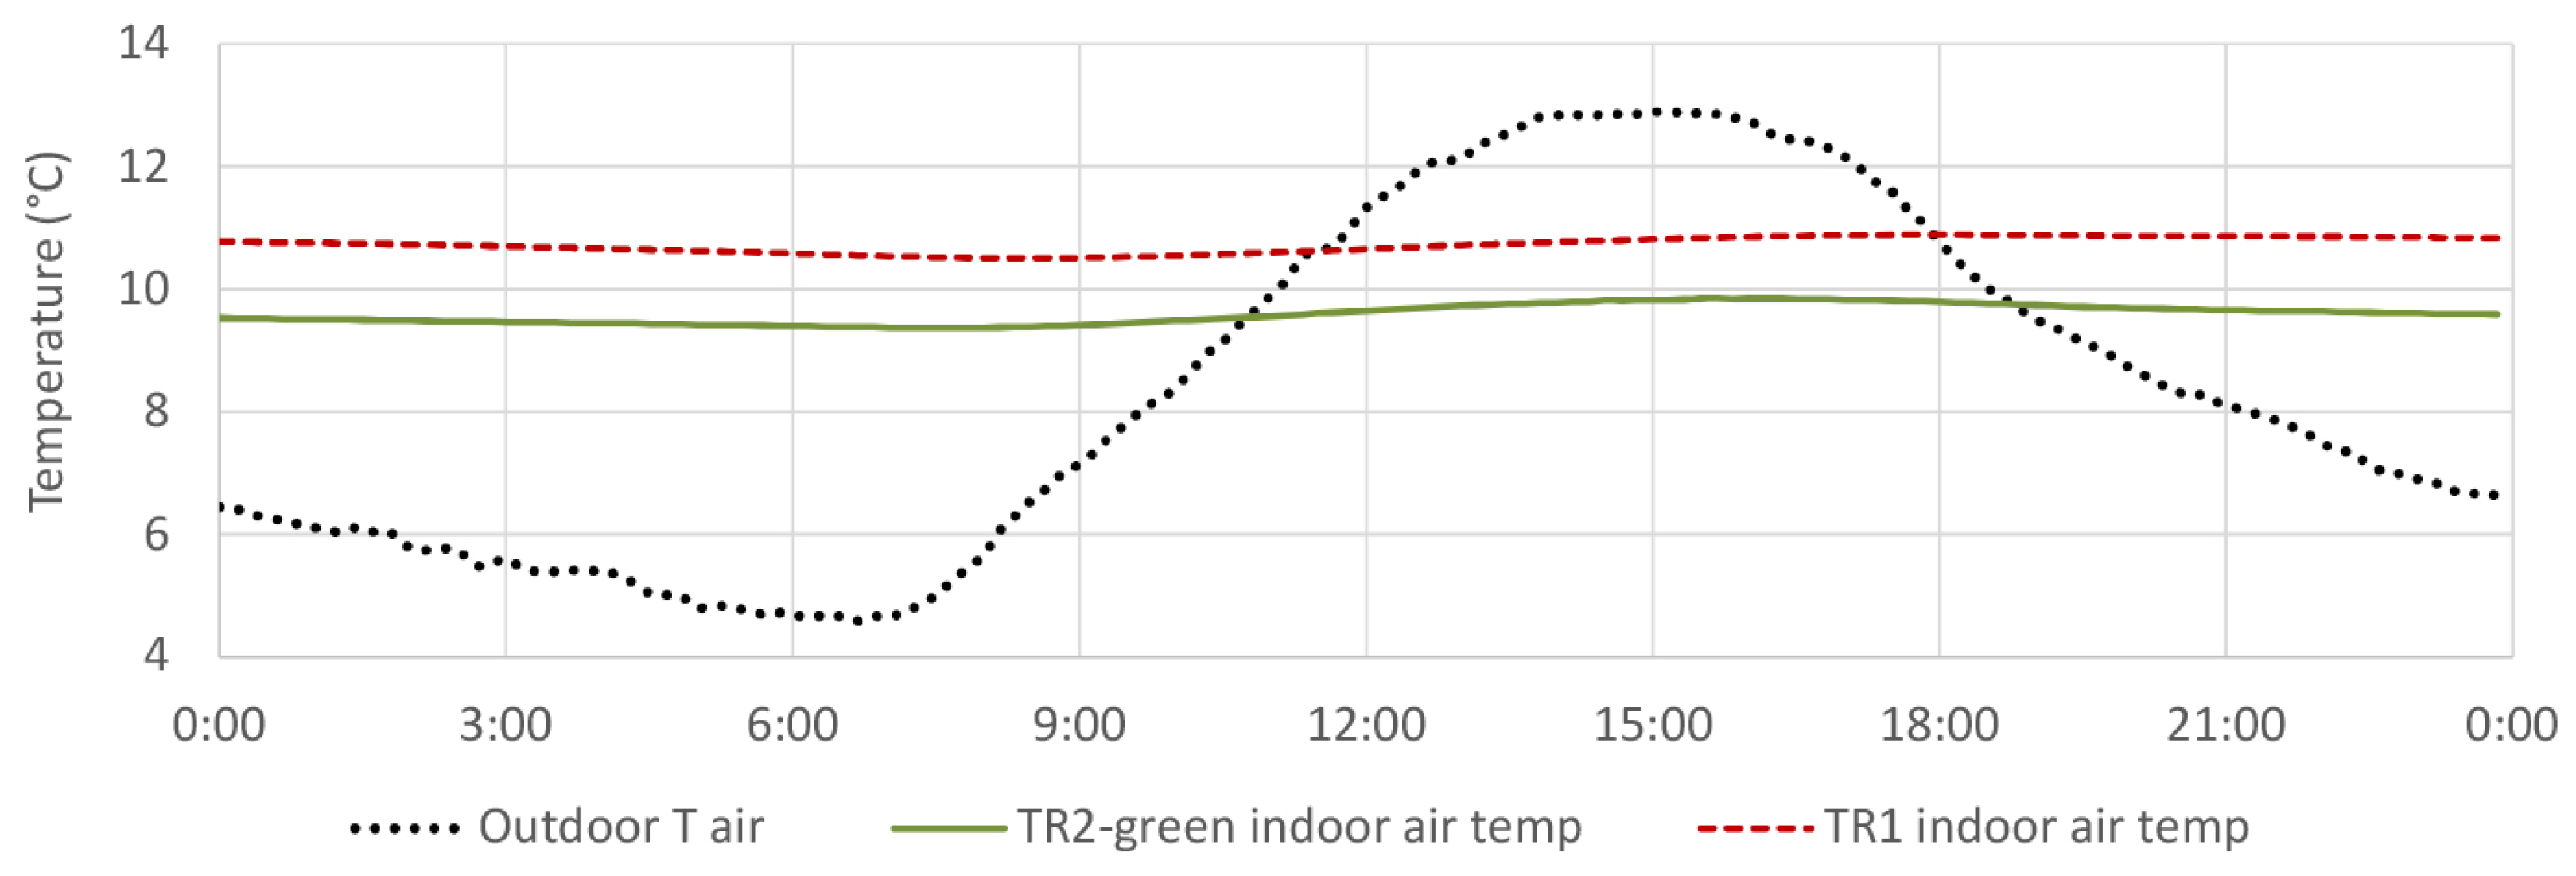
On the 3-days series (see Figure 19), the average temperature inside TR1 is 10.9 ° C, while it is about 9.3 ° C in the case of TR2-green. During the 25 days (see Figure 20) the TR1 average temperature is 10.7 ° C and TR2-green average temperature is 9.6 ° C. Overall, the buildings’ temperature varies around 1 ° C.
Both buildings maintain higher temperature than the outdoors, meaning that the solar heat gains were kept inside. The TR2-green indoor temperature is 2 ° C lower than TR1, suggesting that the TR2-green configuration is less effective in absorbing the energy from the sun. However, the increased thermal mass provided by the roof could increase the capability of the roof to store the indoor heat, as well as reduce heat losses towards the outdoors when air-conditioning is used.

4.5.2. TR2-Green Compared with Black and White Coating

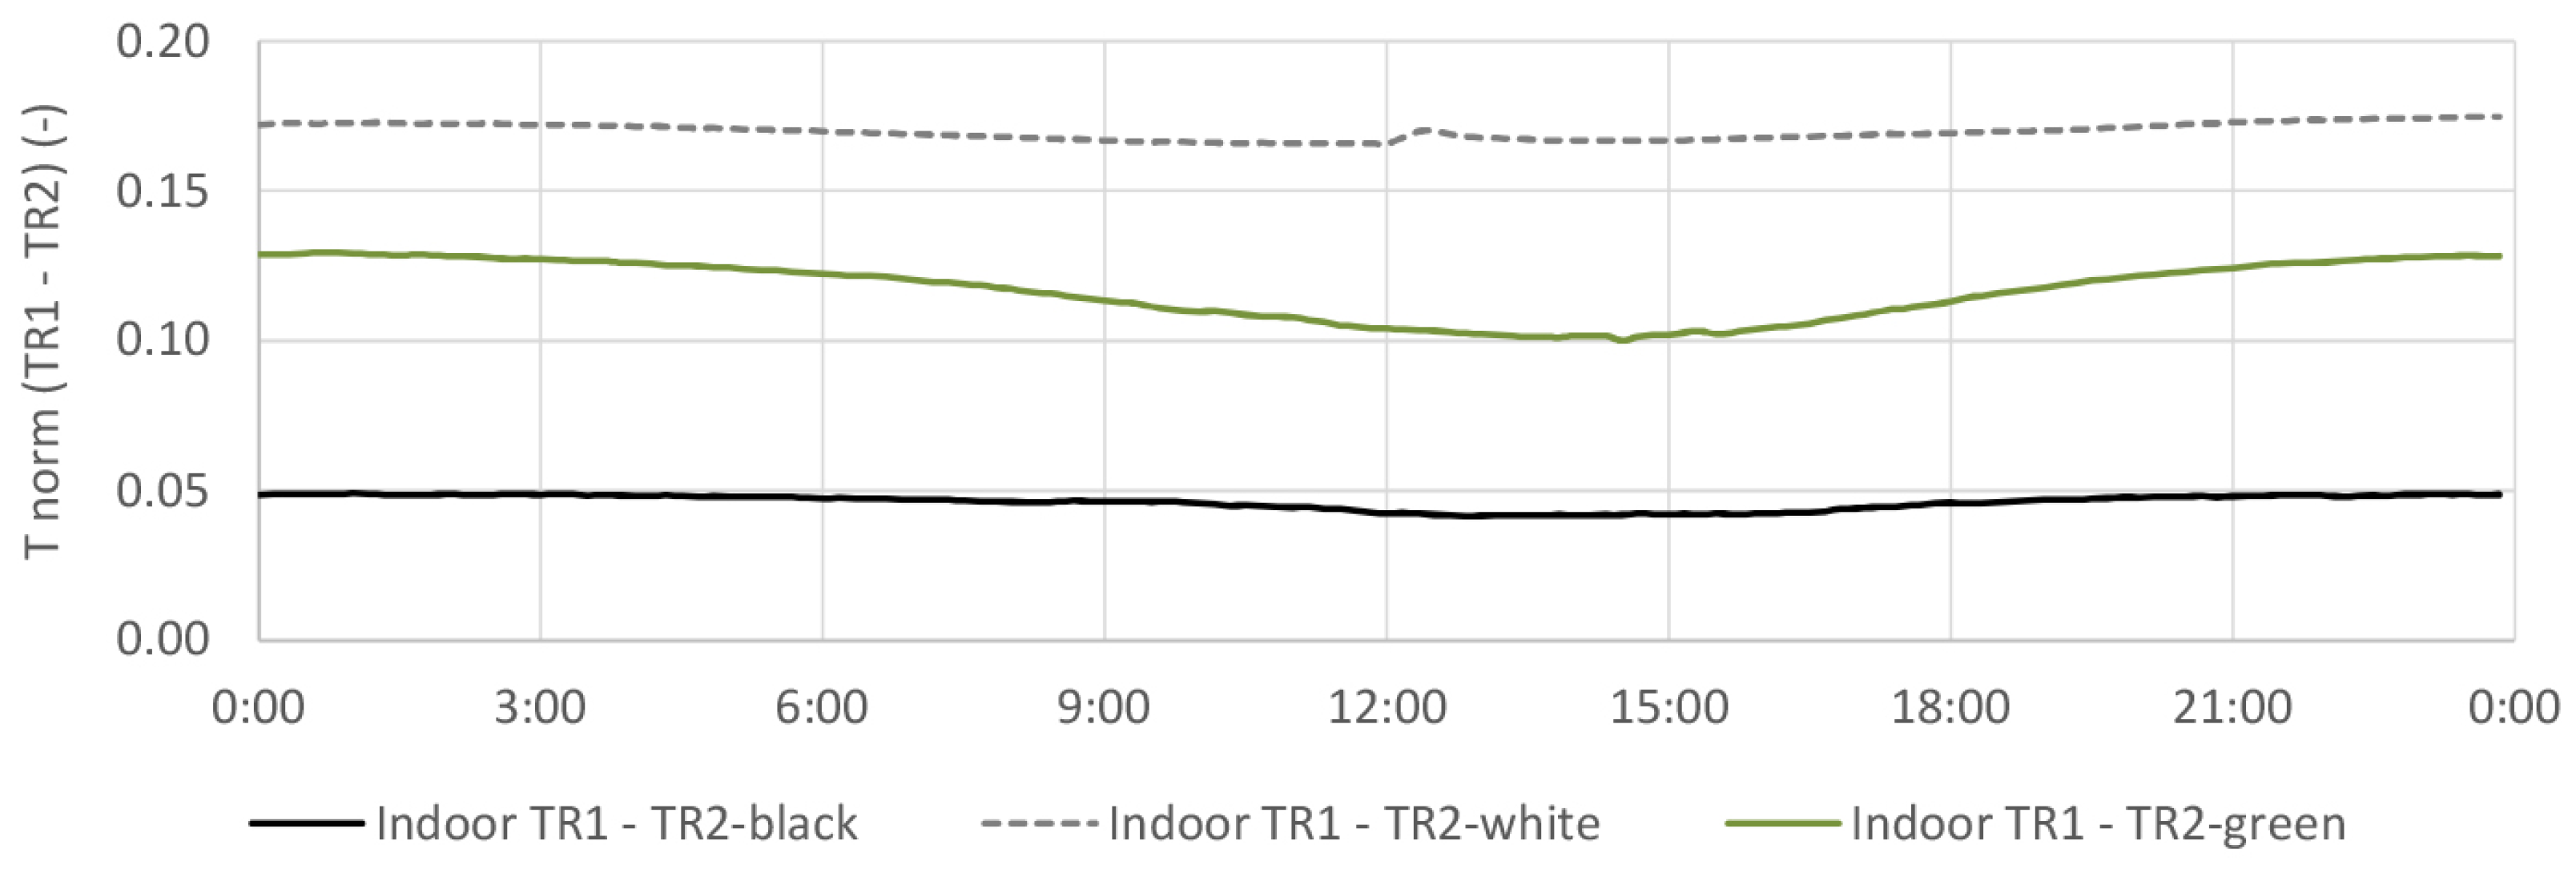
In both Figure 21 and Figure 22, the indoor air temperature of TR1 is always higher than the TR2. The highest temperature difference is found for the TR2-white, because the well-known winter penalty of cool roof solutions drastically reduces the positive solar heat gains in the colder season.
Even though TR2-green presents lowest internal surface temperatures compared to the other configurations (Section 4.3), it is not associated to the lowest indoor air temperature profile. This is probably a consequence of the increase in the thermal mass of the green roof stratigraphy, which allows to maintain the internal heat gains from the monitoring systems (data-loggers, converters, downloading station) in the indoor environment. Maiolo et al. [45] performed one year of measurements with four different green roofs in the Mediterranean climate. In winter, the researchers attributed to the green roofs a reduction of heat losses and higher temperature under the green roof layer since, in that case, the temperature inside was maintained constant (20 ° C).

4.6. Discussion over the Obtained Results

The real scale monitoring of the extensive lightweight green roof solution carried out in this work under winter conditions, allowed to define the main performance of the selected green roof stratigraphy in comparison to a more common tiled roof and to a dark and cool membrane application. The Pratotetto prototype (TR2-green) showed the second lowest solar reflectance trend, after the dark roof configuration, and the lowest external surface temperature. This is essentially due to the combination of both biological and purely physical phenomena.
On the one hand, as testified by Berardi et al. [12], in green roof solutions, part of the incident solar radiation is absorbed by photosynthesis. Indeed, as demonstrated by Feng et al. [46] a large part of the incoming solar radiation absorbed by the roof can be employed for this process (about 9.5% in this study), which entails a serious reduction on the amount of heat stored within the roof. From a biological point of view, the stage of development of the vegetation, influencing their color and also the amount of substrate exposed was also shown to play a significant role, particularly in the winter period [25]. In his work about green infrastructures, Del Barrio [47] also identified two additional significant aspects to be taken into account for explaining solar reflectance values of green surfaces: the leaf area index (LAI) and the plant’s geometric features, both composing the canopy as a shadowing component. The “Pratotetto” prototype is a thin, bright green, and relatively dense lawn vegetation, so most probably a large part of the incoming radiation is used for biological processes, thus reducing both solar reflectance and local external surface temperature values. Low surface temperatures in the area near the roots of the selected lawn was also observed by Takebayashi et al. [27] in their study on the surface heat budget of green roofs for urban heat island (UHI) mitigation purposes, and a similar temperature reduction was also also observed by Teemusk and Mander [48] not only in summer but also in winter conditions, although in a buffered way, and in other relevant studies [3].
In addition to the explained biological processes, the registered external surface temperature reductions could also be associated to the increased heat storage capacity of the external layer due to the amount of water absorbed by the green roof substrate compared to the non-permeable solutions. Indeed the related increased storage capacity produces a reduction of the overall thermal fluctuations of the roof which was also observed by similar research studies. Maiolo et al. [45], for example, in their real-time monitoring of green roof solutions, registered lower thermal fluctuations and an overall reduction of more than 50% on the maximum temperature in comparison with a traditional roof. In the winter Mediterranean context, Maiolo et al. [45], observed that the green roof was able to contain cold waves. Their study also showed that the temperature under the green roof was higher than in the drainage layer, which differs from in the TR2-green, most probably due to the assembly configuration, in particular the drainage layer, and the water content. On the other hand, the green roof reported by Parizotto et al. [11], demonstrated solar heat gains reduction in 70 and 84% in comparison with other systems during the cold period.
Regarding local thermal flux variations, as stated by D’Orazio et al. [25], many factors can influence the performance of a green roof solution. Most literature studies report a reduction in the registered heat flux. However, as reported in Section 4.4, the water content can severely affect the thermal budget of a green roof.
Scharf and Zluwa [3] declared that green roofs reduce heat flux according to the specific type of substrate and to its thickness. Some studies report increased thermal insulation capacities [48], while others found thermal conductance variations attributed to green roofs neglectable in the case of well-insulated roofs [26].
In this study, carried out considering a well insulated prototype building, the green roof showed the highest thermal flux variation with respect to the reference roof configuration (TR1), probably due to the large amount of water retained in the growing layer that increases the conductivity and interferes with the evaporation process [40,41,42].
Despite the lower external surface temperature and the higher heat flux values registered, the TR2-green prototype building presented higher inside air temperatures compared to the TR2-white prototype. This can be in part attributed to some heat loss prevention from the added layer as noticed by Parizotto et al. with 44 and 52% reduction in comparison with the ceramic and metallic solutions. In their study in Toronto, Liu et al. [38] also observed a similar effect due to heat loss reduction. Overall, the obtained results were discreet due to the high insulation of the building [25,26], to the relatively early stage of the vegetation development, and the winter season when in general, fewer differences can be observed [24].
Lastly, concerning the evapotranspiration, Cascone et al. [49] showed that this process, which is strictly connected to the green roof cooling capability, is essentially affected by factors such as water content, pore resistance, radiation incidence, LAI, wind speed, air relative humidity, and soil and assembly configurations. The authors showed that low levels of air humidity and low water volume of the substrate decreased the evapotranspiration process. At the same time, low relative humidity combined with high radiation levels increased the rate of transpiration. This is probably why higher heat flux variations are generally registered in the Pratotetto prototype building in sunny days around noon. Indeed, the literature reviewed attributed the larger part of the evapotranspiration in winter conditions to the vapor pressure difference registered in the central hours of the day, which influenced the assembly heat flux rates.

5. Conclusions

In this work, a lightweight green roof assembly was implemented in a real flat roof prototype building and monitored during winter 2019/2020. Data was collected and compared with measurements taken simultaneously from an equivalent reference prototype building. Later on, the results were also compared to a traditional and a cool building coating applied on the same prototype building, in similar boundary conditions. This research, employing field measurements, can help to understand in which extension this light system can contribute to an improvement of the built environment with a behavior that is not completely predictable with mathematical models.
Regarding the external surface, the measurements demonstrated lower temperature that penalized the prototype building during the winter, preventing heat gains. However, this effect can help to extend the life of the structure with stress reduction. Results showed that the green roof, under free-floating conditions, can reduce heat losses through the prototype building envelope, compared to cool and black roof configurations and maintain a positive heat flow during the day even when applied on a highly insulated roof. The fluctuation of the water content was shown to produce variations in the thermal transport properties of the roof, particularly increasing the storage capacity of the structure.
Despite showing lower indoor surface temperatures compared to the cool and black roofs, the green roof allowed to preserve higher indoor air temperatures in free-floating conditions than the cool configuration. This is probably because the increased thermal capacity of the green roof allowed to better store the internal thermal loads produced by the monitoring equipment in the test-room. This suggests that the green roof surface could outperform the other alternatives when the air conditioning is on.
Further studies will assess the thermal performance of the assembly during the summer season, and, under the life cycle assessment and life costing methodologies, the potential environmental impact and financial feasibility of the green roof could be determined.

Author Contributions

Conceptualization, C.F., A.L.P.; methodology, F.F.d.A.L., C.F.; formal analysis, F.F.d.A.L., C.F.; investigation, F.F.d.A.L.; data curation, F.F.d.A.L.; writing—original draft preparation, F.F.d.A.L.; writing—review and editing, C.F., A.L.P.; visualization, F.F.d.A.L.; supervision, C.F., A.L.P.; project administration, A.L.P.; funding acquisition, A.L.P. All authors have read and agreed to the published version of the manuscript.

Funding

This research received no external funding.

Data Availability Statement

The data presented in this study are available on request from the corresponding author. The data are not publicly available due to pending permission requirements from the green roof producer.

Acknowledgments

Fabiana Frota de Albuquerque Landi’s acknowledgments are due to the PhD school in Energy and Sustainable Development from University of Perugia.

Conflicts of Interest

The authors declare no conflict of interest.

Abbreviations

The following abbreviations are used in this manuscript:
TRTest-room
TR1Test-room 1 (reference prototype building)
TR2Test-room 2 (modified-black, -white, -green prototype building)
U-valueThermal transmittance
λ Thermal conductivity
ρ Density
CSpecific heat capacity
dThickness
CIRIAFInteruniversity Research Center
R a d 1 n o r m , R a d 2 n o r m Normalized reflected radiation
T e 1 n o r m , T e 2 n o r m Normalized external surface temperature
R a d 1 m e a s , R a d 2 m e a s Reflected radiation
R m a x Maximum incoming solar radiation
R a v e Average incoming solar radiation
Te1 m e a s , Te2 m e a s External surface temperatures
T m a x Maximum outdoor air temperature
T a v e Average outdoor air temperature
Ti1 m e a s , Ti2 m e a s Internal surface temperatures
Ta1 m e a s , Ta2 m e a s Indoor air temperatures
Δ R a d n o r m Normalized reflected radiation difference
Δ T e n o r m , Δ T i n o r m Normalized external and internal surface temperature difference
Δ T a n o r m Normalized indoor air temperature difference
Δ q n o r m Normalized heat flux difference
LAILeaf area index
UHIUrban heat island

References

  1. Lundholm, J.T.; Peck, S.W. Introduction: Frontiers of green roof ecology. Urban Ecosyst. 2008, 11, 335–337. [Google Scholar] [CrossRef]
  2. Cascone, S. Green roof design: State of the art on technology and materials. Sustainability 2019, 11, 3020. [Google Scholar] [CrossRef] [Green Version]
  3. Scharf, B.; Zluwa, I. Case study investigation of the building physical properties of seven different green roof systems. Energy Build. 2017, 151, 564–573. [Google Scholar] [CrossRef]
  4. Johannessen, B.G.; Hanslin, H.M.; Muthanna, T.M. Green roof performance potential in cold and wet regions. Ecol. Eng. 2017, 106, 436–447. [Google Scholar] [CrossRef]
  5. Andenæs, E.; Kvande, T.; Muthanna, T.M.; Lohne, J. Performance of blue-green roofs in cold climates: A scoping review. Buildings 2018, 8, 55. [Google Scholar] [CrossRef] [Green Version]
  6. Oberndorfer, E.; Lundholm, J.; Bass, B.; Coffman, R.R.; Doshi, H.; Dunnett, N.; Gaffin, S.; Köhler, M.; Liu, K.K.Y.; Rowe, B. Green Roofs as Urban Ecosystems: Ecological Structures, Functions, and Services. BioScience 2007, 57, 823–833. [Google Scholar] [CrossRef]
  7. Santamouris, M.; Pavlou, C.; Doukas, P.; Mihalakakou, G.; Synnefa, A.; Hatzibiros, A.; Patargias, P. Investigating and analysing the energy and environmental performance of an experimental green roof system installed in a nursery school building in Athens, Greece. Energy 2007, 32, 1781–1788. [Google Scholar] [CrossRef]
  8. Taleghani, M. Outdoor thermal comfort by different heat mitigation strategies—A review. Renew. Sustain. Energy Rev. 2018, 81, 2011–2018. [Google Scholar] [CrossRef]
  9. Jim, C.Y. Effect of vegetation biomass structure on thermal performance of tropical green roof. Landsc. Ecol. Eng. 2012, 8, 173–187. [Google Scholar] [CrossRef] [Green Version]
  10. Li, D.; Bou-Zeid, E.; Oppenheimer, M. The effectiveness of cool and green roofs as urban heat island mitigation strategies. Environ. Res. Lett. 2014, 9. [Google Scholar] [CrossRef]
  11. Parizotto, S.; Lamberts, R. Investigation of green roof thermal performance in temperate climate: A case study of an experimental building in Florianópolis city, Southern Brazil. Energy Build. 2011, 43, 1712–1722. [Google Scholar] [CrossRef]
  12. Berardi, U.; GhaffarianHoseini, A.H.; GhaffarianHoseini, A. State-of-the-art analysis of the environmental benefits of green roofs. Appl. Energy 2014, 115, 411–428. [Google Scholar] [CrossRef]
  13. Van Renterghem, T. Green roofs for noise reduction: Literature review and new approaches. In Proceedings of the INTER-NOISE 2017—46th International Congress and Exposition on Noise Control Engineering: Taming Noise and Moving Quiet, Hong Kong, China, 27–30 August 2017. [Google Scholar]
  14. Shafique, M.; Xue, X.; Luo, X. An overview of carbon sequestration of green roofs in urban areas. Urban For. Urban Green. 2020, 47, 126515. [Google Scholar] [CrossRef]
  15. Moody, S.S.; Sailor, D.J. Development and application of a building energy performance metric for green roof systems. Energy Build. 2013, 60, 262–269. [Google Scholar] [CrossRef]
  16. Naranjo, A.; Colonia, A.; Mesa, J.; Maury, H.; Maury-Ramírez, A. State-of-the-art green roofs: Technical performance and certifications for sustainable construction. Coatings 2020, 10, 69. [Google Scholar] [CrossRef] [Green Version]
  17. Williams, K.J.; Lee, K.E.; Sargent, L.; Johnson, K.A.; Rayner, J.; Farrell, C.; Miller, R.E.; Williams, N.S. Appraising the psychological benefits of green roofs for city residents and workers. Urban For. Urban Green. 2019, 44, 126399. [Google Scholar] [CrossRef]
  18. Pastore, L.; Corrao, R.; Heiselberg, P.K. The effects of vegetation on indoor thermal comfort: The application of a multi-scale simulation methodology on a residential neighborhood renovation case study. Energy Build. 2017, 146, 1–11. [Google Scholar] [CrossRef]
  19. Hao, X.; Xing, Q.; Long, P.; Lin, Y.; Hu, J.; Tan, H. Influence of vertical greenery systems and green roofs on the indoor operative temperature of air-conditioned rooms. J. Build. Eng. 2020, 31, 101373. [Google Scholar] [CrossRef]
  20. Lazzarin, R.M.; Castellotti, F.; Busato, F. Experimental measurements and numerical modelling of a green roof. Energy Build. 2005, 37, 1260–1267. [Google Scholar] [CrossRef]
  21. Santamouris, M. Cooling the cities—A review of reflective and green roof mitigation technologies to fight heat island and improve comfort in urban environments. Sol. Energy 2014, 103, 682–703. [Google Scholar] [CrossRef]
  22. Castleton, H.F.; Stovin, V.; Beck, S.B.; Davison, J.B. Green roofs; Building energy savings and the potential for retrofit. Energy Build. 2010, 42, 1582–1591. [Google Scholar] [CrossRef]
  23. Pisello, A.L.; Rossi, F.; Cotana, F. Summer and winter effect of innovative cool roof tiles on the dynamic thermal behavior of buildings. Energies 2014, 7, 2343–2361. [Google Scholar] [CrossRef] [Green Version]
  24. Pianella, A.; Aye, L.; Chen, Z.; Williams, N.S. Substrate depth, vegetation and irrigation affect green roof thermal performance in a mediterranean type climate. Sustainability 2017, 9, 1451. [Google Scholar] [CrossRef] [Green Version]
  25. D’Orazio, M.; Di Perna, C.; Di Giuseppe, E. Green roof yearly performance: A case study in a highly insulated building under temperate climate. Energy Build. 2012, 55, 439–451. [Google Scholar] [CrossRef]
  26. Niachou, A.; Papakonstantinou, K.; Santamouris, M.; Tsangrassoulis, A.; Mihalakakou, G. Analysis of the green roof thermal properties and investigation of its energy performance. Energy Build. 2001, 33, 719–729. [Google Scholar] [CrossRef]
  27. Takebayashi, H.; Moriyama, M. Surface heat budget on green roof and high reflection roof for mitigation of urban heat island. Build. Environ. 2007, 42, 2971–2979. [Google Scholar] [CrossRef] [Green Version]
  28. Pisello, A.L.; Piselli, C.; Cotana, F. Thermal-physics and energy performance of an innovative green roof system: The Cool-Green Roof. Sol. Energy 2015, 116, 337–356. [Google Scholar] [CrossRef]
  29. Bindi Pratopronto. Available online: http://www.pratopronto.it/index.phpoption=com_content&view=article&id=51&Itemid=57 (accessed on 30 January 2020).
  30. RecycleTherm Km0. Isolante Termoacustico in Fibre Tessili Riciclate a Filiera Corta; Manifattura Maiano s.p.a.: Via Maiano, Italy, 2014. [Google Scholar]
  31. Pisello, A.L.; Cotana, F.; Nicolini, A.; Buratti, C. Effect of dynamic characteristics of building envelope on thermal-energy performance in winter conditions: In field experiment. Energy Build. 2014, 80, 218–230. [Google Scholar] [CrossRef]
  32. Kousis, I.; Fabiani, C.; Gobbi, L.; Pisello, A.L. Phosphorescent-based pavements for counteracting urban overheating—A proof of concept. Sol. Energy 2020, 202, 540–552. [Google Scholar] [CrossRef]
  33. Pisello, A.L.; Castaldo, V.L.; Cotana, F. Dynamic thermal-energy performance analysis of a prototype building with integrated phase change materials. Energy Procedia 2015, 81, 82–88. [Google Scholar] [CrossRef] [Green Version]
  34. Pisello, A.L.; Castaldo, V.L.; Piselli, C.; Fabiani, C.; Cotana, F. Thermal performance of coupled cool roof and cool façade: Experimental monitoring and analytical optimization procedure. Energy Build. 2017, 157, 35–52. [Google Scholar] [CrossRef]
  35. Corrado, V.; Ballarini, I.; Corgnati, S.P. Typology Approach for Building Stock: National Scientific Report on the TABULA Activities in Italy; Politecnico di Torino: Turin, Italy, 2012. [Google Scholar]
  36. Pisello, A.L. High-albedo Roof Coatings for Reducing Building Cooling Needs; Elsevier Ltd.: Amsterdam, The Netherlands, 2015; pp. 243–268. [Google Scholar] [CrossRef]
  37. Peng, L.L.; Jim, C.Y. Seasonal and diurnal thermal performance of a subtropical extensive green roof: The impacts of background weather parameters. Sustainability 2015, 7, 11098–11113. [Google Scholar] [CrossRef] [Green Version]
  38. Liu, K.; Baskaran, B. Thermal Performance of Green Roofs in Cold Climates. In Proceedings of the World Sustainable Building Conference, Tokyo, Japan, 27–29 September 2005; pp. 1–8. [Google Scholar]
  39. Guattari, C.; Evangelisti, L.; Asdrubali, F.; De Lieto Vollaro, R.L. Experimental evaluation and numerical simulation of the thermal performance of a green roof. Appl. Sci. 2020, 10, 1767. [Google Scholar] [CrossRef] [Green Version]
  40. Sandoval, V.; Suárez, F.; Vera, S.; Pinto, C.; Victorero, F.; Bonilla, C.; Gironás, J.; Bustamante, W.; Rojas, V.; Pastén, P. Impact of the properties of a green roof substrate on its hydraulic and thermal behavior. Energy Procedia 2015, 78, 1177–1182. [Google Scholar] [CrossRef] [Green Version]
  41. Issa, R.J.; Leitch, K.; Chang, B. Experimental Heat Transfer Study on Green Roofs in a Semiarid Climate during Summer. J. Constr. Eng. 2015, 2015, 1–15. [Google Scholar] [CrossRef]
  42. Ayata, T.; Tabares-Velasco, P.C.; Srebric, J. An investigation of sensible heat fluxes at a green roof in a laboratory setup. Build. Environ. 2011, 46, 1851–1861. [Google Scholar] [CrossRef]
  43. Libessart, L.; Kenai, M.A. Measuring thermal conductivity of green-walls components in controlled conditions. J. Build. Eng. 2018, 19, 258–265. [Google Scholar] [CrossRef]
  44. Bellazzi, A.; Barozzi, B.; Pollastro, M.C.; Meroni, I. Thermal resistance of growing media for green roofs: To what extent does the absence of specific reference values potentially affect the global thermal resistance of the green roof? An experimental example. J. Build. Eng. 2020, 28. [Google Scholar] [CrossRef]
  45. Maiolo, M.; Pirouz, B.; Bruno, R.; Palermo, S.A.; Arcuri, N.; Piro, P. The role of the extensive green roofs on decreasing building energy consumption in the mediterranean climate. Sustainability 2020, 12, 359. [Google Scholar] [CrossRef] [Green Version]
  46. Feng, C.; Meng, Q.; Zhang, Y. Theoretical and experimental analysis of the energy balance of extensive green roofs. Energy Build. 2010, 42, 959–965. [Google Scholar] [CrossRef]
  47. Palomo Del Barrio, E. Analysis of the green roofs cooling potential in buildings. Energy Build. 1998, 27, 179–193. [Google Scholar] [CrossRef]
  48. Teemusk, A.; Mander, Ü. Greenroof potential to reduce temperature fluctuations of a roof membrane: A case study from Estonia. Build. Environ. 2009, 44, 643–650. [Google Scholar] [CrossRef]
  49. Cascone, S.; Coma, J.; Gagliano, A.; Pérez, G. The evapotranspiration process in green roofs: A review. Build. Environ. 2019, 147, 337–355. [Google Scholar] [CrossRef]
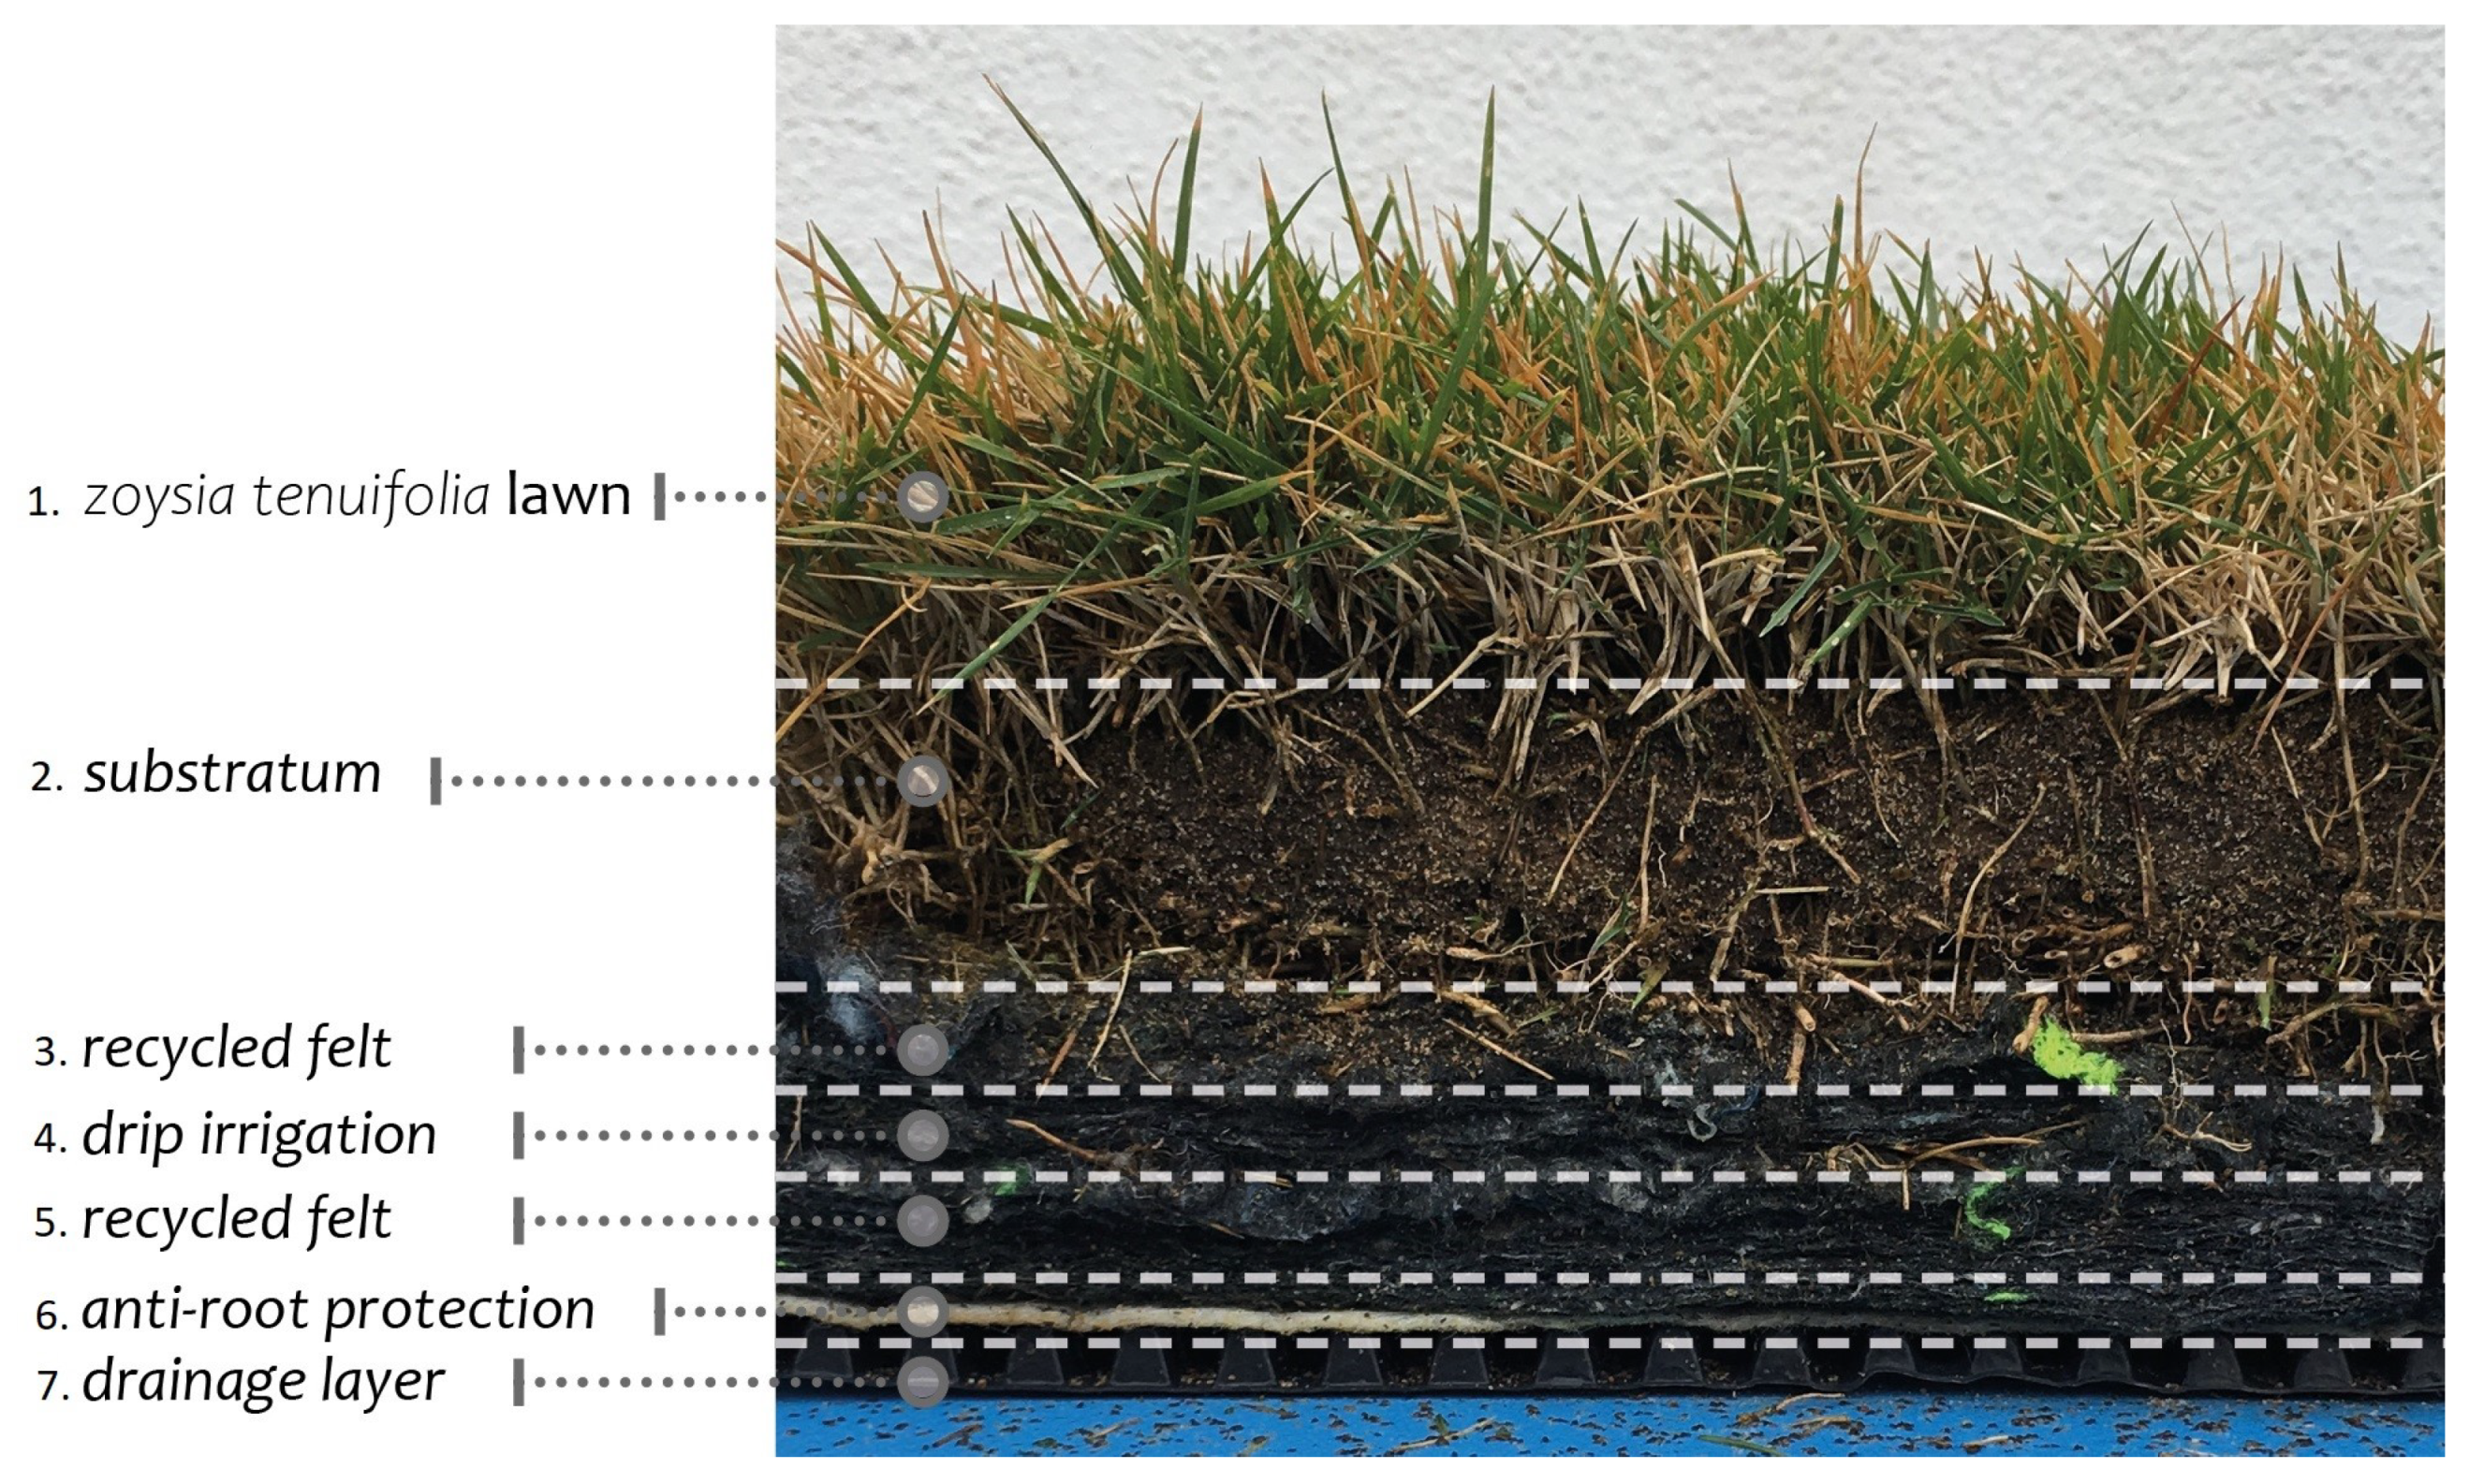
Figure 1. Stratigraphy in detail.
Sustainability 13 04604 g001
Figure 2. Research center and prototype buildings situation (Test-rooms 1 and 2). Source: Google maps, 2020, ref. [31].
Sustainability 13 04604 g002
Figure 3. Global incoming radiation and reflected radiation from TR1 and TR2-green measurements during the three representative consecutive days.
Sustainability 13 04604 g003
Figure 4. Average global incoming radiation and reflected radiation from TR1 and TR2-green during 25 days.
Sustainability 13 04604 g004
Figure 5. Normalized reflected radiation difference between TR1 and TR2 during 3 days.
Sustainability 13 04604 g005
Figure 6. Average normalized reflected radiation difference between TR1 and TR2 during 25 days.
Sustainability 13 04604 g006
Figure 7. TR1 and TR2-green external surface temperatures ( ° C) during 3 days. The graph also presents the incoming solar radiation that impacts on heat gains. The mean outdoor temperature is 8.8 ° C, with peak of 16.3 ° C, and minimum of 1.9 ° C.
Sustainability 13 04604 g007
Figure 8. TR1 and TR2-green average external surface temperatures ( ° C) during 25 days. The mean outdoor temperature is 9.3 ° C, with peak of 12.9 ° C, and minimum of 4.6 ° C.
Sustainability 13 04604 g008
Figure 9. TR1 and TR2 normalized difference on external surface temperature for black, white, and green roofs during 3 days.
Sustainability 13 04604 g009
Figure 10. TR1 and TR2 normalized difference on external surface temperature for black, white, and green roofs’ average during 25 days.
Sustainability 13 04604 g010
Figure 11. Internal surface temperature ( ° C) of TR1 and TR2-green during 3 days.
Sustainability 13 04604 g011
Figure 12. Average internal surface temperature ( ° C) of TR1 and TR2-green during 25 days.
Sustainability 13 04604 g012
Figure 13. Difference of TR1 and TR2 normalized values (internal surface) for black, white, and green roofs during 3 days.
Sustainability 13 04604 g013
Figure 14. Difference of TR1 and TR2 normalized values (internal surface) for black, white, and green roofs during 25 days.
Sustainability 13 04604 g014
Figure 15. Thermal heat flux (W/m 2 ) of TR1 and TR2-green during 3 days and incoming solar radiation.
Sustainability 13 04604 g015
Figure 16. Thermal heat flux (W/m 2 ) of TR1 and TR2-green average during 25 days and incoming solar radiation.
Sustainability 13 04604 g016
Figure 17. Thermal heat flux differences of TR1 and TR2-black, TR2-white, and TR2-green day for 3 days, normalized.
Sustainability 13 04604 g017
Figure 18. Thermal heat flux differences of TR1 and TR2-black, TR2-white, and TR2-green day average (for 25 days), normalized.
Sustainability 13 04604 g018
Figure 19. Indoor air temperature ( ° C) of TR1 and TR2-green during 3 days. Average outdoor temperature is 8.8 ° C, with a total gap of 14.4 ° C.
Sustainability 13 04604 g019
Figure 20. Indoor air temperature ( ° C) of TR1 and TR2-green during 25 days. Outdoor mean temperature was 8.4 ° C, and the total temperature gap was 19.7 ° C, with peaks of 18.0 ° C and minimum of −1.6 ° C.
Sustainability 13 04604 g020
Figure 21. Difference of TR1 and TR2 normalized values regarding indoor air temperature for black, white, and green roofs during 3 days.
Sustainability 13 04604 g021
Figure 22. Difference of TR1 and TR2 normalized values regarding indoor air temperature for black, white, and green roofs (average) during 25 days.
Sustainability 13 04604 g022
Table 1. Green roof main thermo-physical properties ( λ = thermal conductivity, ρ = density, C = specific heat capacity, and d = thickness).
Main Thermophysical Properties
Layers Green Roof λ ρ Cd
[W/m · K][kg/m 3 ][J·kg 1 · K 1 ][m]
(1–2) turfgrass1. zoysia tenuifolia0.32160017200.18
2. substratum
(3–5) felt layer3. recycled felt [30]
4. irrigation drip0.0368013000.06
5. recycled felt [30]
6. anti-root protection layer0.0512013000.01
7. drainage layer0.25170014000.7
Table 2. TR1 and TR2 roof main thermo-physical properties [31] ( λ = thermal conductivity, ρ = density, C = specific heat capacity, d = thickness, and R = resistivity).
Main Thermophysical Properties
Layers λ ρ CdR
[W/m · K][kg/m 3 ][J·kg 1 · K 1 ][m][m 2 K·W 1 ]
TR10.25
Clay tile1.0020008000.015
Mineral wool0.0416010300.015
Air gap 1.3 0.050.23
Mineral wool0.0386010300.08
Aerated concrete slab0.1650012900.20
Gypsum plastering0.460010000.015
TR20.25
Bitumen sheet0.23110010000.01
Mineral wool0.0416010300.10
Aerated concrete slab0.1650012900.20
Gypsum plastering0.4060010000.015
Publisher’s Note: MDPI stays neutral with regard to jurisdictional claims in published maps and institutional affiliations.