Abstract
Due to the significant increase in the age of infrastructure globally, maintenance of existing structures has been prioritized over the construction of new structures, which are very costly. However, many infrastructure facilities have not been managed efficiently due to a lack of well-trained staff and budget limitations. Bridge management systems (BMSs) have been constructed and operated globally to maintain the originally designed structural performance and to overcome the inefficiency of maintenance practices for existing bridges. Unfortunately, because most of the current BMSs are based on 2D information systems, bridge maintenance data and information are not utilized effectively for bridge management. To overcome these problems, studies of BMSs based on building information modeling (BIM) have significantly increased in number. Most previous studies have proposed comprehensive frameworks containing approximate and limited information for maintenance to utilize BIM technology. Moreover, the utilization level of the maintenance information is less efficient because detailed information regarding safety diagnosis and maintenance are not included in data formats that are interpretable by computer algorithms. Therefore, in this study, a BIM-based BMS, including detailed information relating to safety diagnosis and maintenance, was constructed for the sustainability of bridge maintenance. To consider detailed information in the BMS, a maintenance data schema and its information system were established via the compilation of detailed information for safety diagnosis, repair and strengthening, remaining life, and valuation. In addition, a web data management program (WDMP) was developed using the maintenance data schema and information system, and was connected with the Midas CIM, which is a 3D modeling program. Finally, a prototype of the proposed BMS was established for an actual bridge in Korea. The proposed BMS in this study may be expected to improve the existing management practices for maintenance, and to reduce maintenance cost and information loss.
1. Introduction
Due to the significant increase in the age of infrastructure globally, maintenance of existing structures has been prioritized over the construction of new structures, which are very costly. However, many infrastructure facilities have not been managed efficiently due to a lack of well-trained staff and budget limitations. Bridge management systems (BMSs) have been constructed and operated globally to maintain the originally designed structural performance and to overcome the inefficiency of maintenance practices for existing bridges. Unfortunately, because most of the current BMSs are based on 2D information systems, bridge maintenance data and information are not utilized effectively for bridge management. To overcome these problems, studies of BMSs based on building information modeling (BIM) have been significantly increased in number [1,2,3].
BIM technology utilizes object-based 3D information models that innovatively improve traditional and inefficient 2D approaches for the planning, design, construction, and maintenance of infrastructure. BIM technology was first used in building designs involving uniform components as a tool to manage and share information throughout the lifecycle of a building, based on 3D information modeling [4,5,6,7,8]. The Industry Foundation Classes (IFC) open data model is an international open standard developed by buildingSMART, and is widely used for data exchange [9]. Until version IFC4, the IFC standard was mainly focused on buildings. Due to increasing international demand for an IFC data schema for infrastructure, an IFC extension project for infrastructure facilities was initiated. The IFC Alignment project, the first step of this extension project for infrastructure, was conducted to develop a neutral data model for capturing the alignment of linear infrastructure facilities as a basis for the IFC infrastructure standard. The results of the IFC Alignment project were included from version IFC4.1. Based on the IFC Alignment project, the IFC Bridge project was implemented to extend the IFC data schema to include bridges. Following the inclusion of the results of the IFC Bridge project in the most recent version, IFC4.2, bridge modeling techniques have been drastically improved. However, the bridge data schema for the whole lifecycle remain incomplete because the IFC Infrastructure project is at the initial stage, and thus is focused on the improvement of modeling. To overcome the limitations of the current IFC, an increasing number of studies in the BIM and BMS fields have been undertaken to extend the data schema based on the IFC [10,11,12].
In a similar manner to that of the extension process data model in the IFC, studies of BIM for bridges initially focused on modeling techniques, such as modeling based on linear layouts and variables, and the establishment of component libraries to address geometric non-uniform characteristics [2]. When these modeling techniques attained maturity, BIM began to be applied to BMSs to manage information and data pertaining to the whole lifecycle of a bridge. The information involved in each stage (planning, design, construction, and maintenance) is determined by the requirements of the consumer, and links between pieces of information in each management stage must be created to manage the entire lifecycle information of the bridge via BIM. Because of these characteristics of BIM, studies on the design/construction stage, such as crash checks, schedule and cost management, quantity calculation, and design modification of the bridge, were conducted in advance [13,14,15,16,17]. Therefore, the use of BIM at the design/construction stages resulted in an increasing number of on-site applications due to the benefits of reduced construction periods, costs, and errors.
BIM application studies of the maintenance stage have been conducted in parallel with studies on the design/construction stages. However, on-site BIM applications have been insufficient because the importance of bridge aging was recognized relatively late. Topics on BIM application studies for bridge maintenance include safety diagnosis, schedule management, visualization of historical information, maintenance decision making, and efficient asset management. Ref. [1] first presented the requirements and framework required to establish a model-based bridge lifecycle management system (MBLMS) that can share web-based information, and its effectiveness was verified via the application of MBLMS to the safety diagnosis of an actual bridge. Subsequently, studies on detailed techniques for safety diagnosis using BIM began to be conducted. Ref. [18] developed techniques to express damage in 3D models using photography generated during safety diagnosis to minimize the error of damage between the actual structure and the 3D model. Moreover, [19] developed a system that presents damage in a 3D model as a damage cube containing size information; the system can calculate the load-carrying capacity of a bridge, with its section losses due to aging accounted for in the calculation. Due to the development of these detailed techniques for BIM bridge maintenance, [3] recently developed a BIM-based BMS for cable bridges, including efficient modeling techniques, an expression technique for the defects of bridges, and whole-lifecycle information. Other previous studies on BIM-based BMSs also proposed comprehensive frameworks, including whole-lifecycle information, to apply BIM technology to bridge maintenance. However, the usability of this information in BMS is limited because most of the information is stored in document form, and detailed information on safety diagnosis and maintenance is not written in a data format that is easily interpretable by computer algorithms. In addition, decision making for maintenance needs to be supplemented with scientific evidence for efficient management. The remaining life and the bridge value are usually used as scientific evidence for reasonable decision making for bridge maintenance. Therefore, detailed information of the bridge diagnosis, maintenance, remaining life, and valuation in a useable data format is essential in BMS for an efficient use of the bridge maintenance information.
This study aimed to establish a BIM-based BMS for the sustainability of bridge maintenance based on the maintenance data schema and its information system, including detailed bridge information relating to diagnosis, maintenance, remaining life, and valuation in a useable data format. Detailed information in the data format of the BMS can improve the usability of information, ensuring cost-effective maintenance is available through connected activities such as proper decision making and retrofitting. To achieve these goals, in this study, the bridge information system and the detailed information required for safety diagnosis and maintenance of bridges were investigated through existing studies, diagnosis guide manuals, and inspection reports. In addition, detailed information required to derive the remaining life and the bridge value, which can be used as scientific evidence for decision making, was also investigated by reviewing existing studies and manuals. Based on the detailed information, a maintenance data schema was defined for better usability of bridge maintenance information. Using the maintenance data schema and its information system, a web data management program (WDMP) was developed and linked with Midas CIM, which is a 3D modeling program that can be transformed into IFC format. The Java program was adopted to provide a user interface for the WDMP. Moreover, C++ was utilized to auto-calculate results which can be derived for safety diagnosis, the remaining life, and the bridge value, and link data required to be entered repeatedly. The prototype of the proposed BMS consisting of the WDMP and Midas CIM was applied to an actual bridge in Korea.
2. Investigation of Required Information for Bridge Maintenance
2.1. Safety Diagnosis and Maintenance
In several developed countries, the diagnosis of bridge safety has been performed by a management authority according to inspection manuals published by each country. Information on the safety diagnosis is reported in the form of an electronic document and accumulated in a bridge management system. However, because only brief information about the overall condition of the bridge is stored in a data format and most of the information is stored in document format, the usability of this information and its application to BIM technology is very limited. In addition, the effective management of bridges requires scientific evidence for reasonable decision making about maintenance. A bridge’s remaining life, which is calculated with consideration of deterioration degree, and its value, which is calculated using accounting methods, can be used as scientific evidence for reasonable decision making. Therefore, in this study, the safety diagnosis system and information required to be stored in a data format for effective maintenance were investigated from literature to establish a BMS based on BIM technology. In addition, inspection units and member identities (IDs) were defined to effectively manage bridge information stored in a data format according to information levels.
2.1.1. Safety Diagnosis System
In the United States, the safety diagnosis of a bridge is conducted according to the safety diagnosis policies established by the National Bridge Inspection Standards (NBIS). The types of safety diagnoses are divided into “initial”, “routine”, “damage”, “in-depth”, “fracture critical”, “underwater”, and “special”. Furthermore, the range of inspection is determined according to the results of the “initial” and “routine” diagnoses performed at certain intervals. The detailed procedures and methods are divided into the bridge level, to determine the approximate overall condition of the bridge, and the element level, to evaluate the change in the condition of each member. For bridge-level procedures, safety diagnosis is performed according to the Bridge Inspector’s Reference Manual [20] and the Recording and Coding Guide for the Structure Inventory and Appraisal of the Nation’s Bridges (Coding Guide) established by the Federal Highway Administration (FHWA). The data obtained via inspection are stored in the National Bridge Inventory (NBI). For element-level procedures, safety diagnosis is performed using methods that evaluate the damage of each member, based on the Manual for Bridge Evaluation (MBE) and the Manual for Bridge Element Inspection (MBEI) established by the America Association of State Highway and Transportation Officials [21]. Inspection types are divided into “condition”, to assess the condition of the bridge; “load rating and posting”, to assess structural safety; and “appraisal”, to assess service performance. It is necessary to represent the condition rating of the bridge to utilize inspection results efficiently. The Coding Guide proposes calculation of the sufficiency rating (SR), as shown in Equation (1), to represent the condition of the bridge as a numerical value, using the inspection results for each inspection type.
where (55% max) represents structural adequacy and safety, (30% max) represents serviceability and functional obsolescence, (15% max) represents essentiality for public use, and (13% max) represents special reductions.
In Japan, the safety diagnosis guideline for bridge maintenance is proposed by the Japan Society of Civil Engineers [22]. A maintenance plan is developed after the completion of a construction to maintain the performance of structures within the allowable range during the service period. The performance requirements in the maintenance of an ordinary structure are safety, serviceability, hazards to third parties, esthetic appearance and landscape, and durability. Diagnosis is conducted according to the developed maintenance plan, and the plan is consistently revised based on diagnosis results. Diagnosis types are classified into “initial”, “routine”, “regular”, “extraordinary”, and “emergency”. “Initial” diagnosis is conducted when identifying the initial conditions of the structure and the result of the initial diagnosis is used as a reference for condition changes. The scope of an inspection varies depending on the type of diagnosis. Inspection types are classified into “visual observation and hammer tapping” to identify the appearance of structure; “non-destructive test”, which is an investigation conducted using non-destructive testing equipment; “local destructive test”, which is an investigation conducted primarily by collecting core samples; “loading test” to evaluate the mechanical behavior or properties of existing structures; “environmental investigation” to evaluate loads and environmental actions; “material test” to select the proper method of repair and strengthening; and “driving feeling” to investigate excessive deflection or vibration and serviceability. After inspection, the deterioration mechanism is identified, and the deterioration progress is predicted for decision making. However, the method of calculating the condition rating for efficient maintenance of numerous bridges is not proposed in the guideline.
In Korea, the safety diagnosis of bridges is performed by the management authority of each bridge according to special laws on facility safety management and using the “Detailed Guideline for Safety Inspection and Precision Safety Diagnosis” published by the Korea Infrastructure Safety and Technology Corporation (KISTEC) [23]. The types of safety diagnoses conducted at certain intervals, depending on the condition of a bridge, are divided into “regular”, “precision”, “emergency”, and “precision safety”. In addition, inspection types are divided into “appearance examination,” to evaluate the appearance condition of the bridge; “investigation/material test” to evaluate the material condition of the bridge via the use of additional test equipment; and “structural safety” to evaluate its structural safety via the performance of loading test and numerical analysis. The diagnosis flow of “precision safety diagnosis”, including all inspection tasks, is shown in Figure 1a, with the ranges of basic and choice tasks for each inspection type varying depending on the type of safety diagnosis. In addition, [24] recently established the “Detailed Guideline for Safety and Maintenance Implementation of Facilities (Performance Evaluation)” by introducing the concept of performance in safety diagnosis as the requirement to inspect both structural safety and serviceability. As shown in Figure 1b, the diagnosis flow of performance evaluation defines “safety performance assessment” by integrating “structural safety” with “appearance examination” and revises “investigation/material test” as an independent inspection type for durability assessment. In addition, “service performance” is a type of inspection included to inspect the serviceability of a bridge. Diagnosis and inspection are performed according to [23,24] at certain intervals and the condition rating of the bridge condition is calculated to manage it efficiently. The bridge condition rating calculated by the process shown in Figure 2 is represented as the defect index. The defect of a member is graded from A to E, and the defect for each grade is scored to calculate the grade and defect index of the overall bridge.
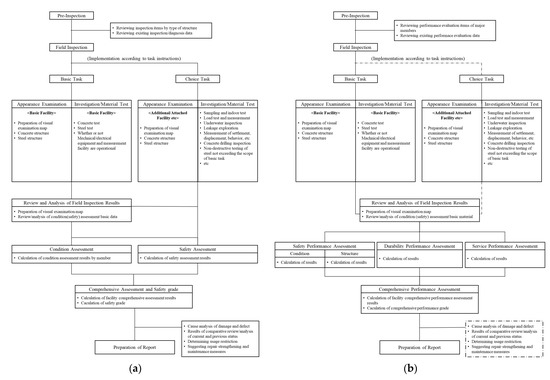
Figure 1.
Safety diagnosis flow: (a) precision safety diagnosis; (b) performance evaluation.
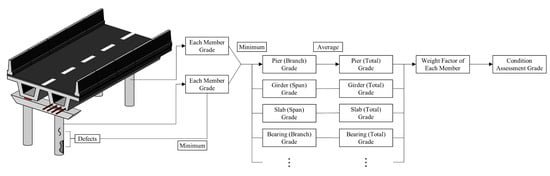
Figure 2.
Process of condition assessment.
The above review and comparison of the diagnosis systems for three countries demonstrates the differences in the diagnosis types, definitions of bridge performance, and evaluation processes of diagnosis results. However, the inspection types that inspect the appearance condition, material condition, structural safety, and service performance are similar. The appearance condition is primarily investigated by visual observation and simple equipment, and the material condition is investigated using additional equipment for non-destructive and local-destructive tests. In addition, structural safety is investigated using hand calculations, numerical analysis, and loading tests; service performance assessment, such as driving feeling, traffic volume, and inspection facility, is one of the main types of inspections to investigate the usefulness of a facility to users. Therefore, establishing an information system that can be used internationally requires information on diagnosis systems to be organized according to the inspection type.
2.1.2. Diagnosis System Based on the Integrated Inspection Type
To maintain facilities effectively using BMS based on BIM technology, the BMS should not only provide the visual identification of the safety diagnosis history but also include data usability. Data usability in this study refers to the linkage between repeatedly entered data and automation of calculation processes for diagnosis results by utilizing accumulated information. A BMS that includes data usability can reduce the time, cost, and difficulty of the diagnosis task for an inspector. For data usability, information obtained through safety diagnosis should accumulate systematically. In addition, detailed information on each inspection item, such as defect type and defect degree, should be included in the information system of the BMS to evaluate bridge performance and provide diagnosis results that can be used for decision making. Inspection items such as cracks, deterioration, carbonation depth, safety factor, and traffic volume, are classified by inspection type, and the inspected item range is decided according to diagnosis type. As mentioned earlier, the diagnosis flow of each country differs in diagnosis type, definition of bridge performance, and evaluation process of diagnosis results, but the inspection types are similar. Therefore, in this study, an integrated inspection that encompasses all of the inspection types of each country was defined, and a diagnosis system was organized based on an integrated inspection to establish a maintenance data schema and information system that can be used internationally. The diagnosis system based on integrated inspection is presented in Figure 3. In addition, the inspection items according to inspection type are derived from each diagnosis manual and applied to the integrated information system.
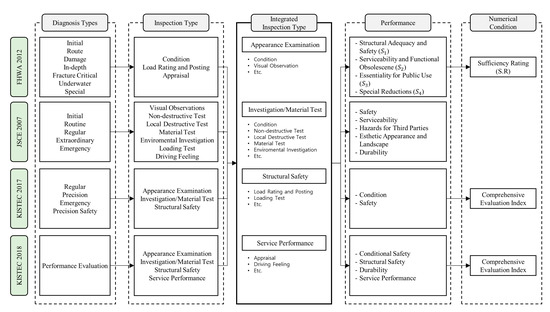
Figure 3.
Diagnosis system based on the integrated inspection type.
2.1.3. Repair and Strengthening
Because the condition of a bridge can be improved by remedial measures, the information on repair and strengthening is an important piece of information to maintain the bridge efficiently. Information on repair and strengthening is used to evaluate the degree to which the bridge’s condition has changed, and the maintenance cost required to preserve and improve it. In addition, these factors are useful for rational decision making, such as revising the maintenance plan and determining the objective of bridge performance. Therefore, information on repair and strengthening is needed to be systematically included in the BMS. In this study, items of repair and strengthening were derived from various maintenance manuals, and information was organized according to the same information level as that of diagnosis.
2.1.4. Definition of Inspection Units and Member IDs
The bridge condition rating evaluated as the result of diagnosis is required to determine the order of priority for maintenance and to distribute the budget efficiently. The definition and calculation process of a condition rating differ for each country, but the evaluations of the condition rating based on defects on each member and inspection unit, such as cracks on the 4th girder of the 3rd span, are similar. Therefore, in this study, the IDs of members and inspection units, as shown in Table 1, are defined to systematically manage the information and automate the calculation process of the numerical condition.

Table 1.
Definition of inspection units and member IDs.
2.2. Remaining Life
Bridge structures constructed primarily using reinforced concrete and steel degrade over time because of deterioration. Therefore, evaluating the exact life of a bridge using scientific evidence based on its current state is essential for the efficient maintenance and longevity of the bridge. Various studies have been conducted on the estimation of deterioration and remaining life, with an increasing emphasis on the importance of proper maintenance. Chloride attack, carbonation, alkali-aggregate, frost attack, and chemical erosion are considered the forms of deterioration that should be considered when estimating the remaining life of reinforcement concrete. However, no studies on quantitative calculation methods to estimate the remaining life of structures affected by alkali aggregate have been reported. Additionally, establishing a uniform estimation process for the remaining life of a structure affected by chemical erosion is difficult because chemical erosion occurs only in special environments, and deterioration mechanisms vary depending on environmental factors. In addition, the existence of data required to derive the equations for remaining life should be considered when applying these estimation equations to the BMS. Therefore, in this study, a proper estimation method for remaining life of reinforced concrete and fatigue of steel based on deteriorations such as chloride attack, carbonation, and frost attack was determined, and information items required for the calculation of remaining life were derived.
2.2.1. Chloride Attack
Chloride attack is defined as a deterioration phenomenon that causes the corrosion of steel, and the cracking and spalling of concrete, via the penetration of chloride ions. The period of a chloride attack is divided into initiation, propagation, acceleration, and limitation. Generally, the time before the propagation period, when chloride concentration attains a critical value at the location of a rebar, is considered as the remaining life with respect to the chloride attack. The diffusion of chloride ions is a dominant factor in estimating the remaining life of a reinforcement concrete member with respect to chloride attack. Thus, in the initiation period, the diffusion factor of chloride ions and the time taken to attain critical chloride concentration at the location of a rebar can be estimated using Fick’s 2nd law (Equation (2)). Using Equation (2), the governing equation is then derived as Equation (3). Refs. [25,26] derived Equation (4) from Equation (3) to predict when corrosion occurs, assuming that the concentration, diffusion factor, and critical concentration of the chloride that penetrates from the surface of the concrete are constant with respect to time. Equation (4) is also adopted in various design standards and manuals to predict the remaining life with respect to a chloride attack. If the value of chloride concentration is measured, the diffusion factor can be obtained via the inverse calculation of Equation (3), whereas if there are no measured values and the value for ordinary Portland cement is used, Equation (5) can be used. An improved calculation formula that considers the deicing chemical and change in chloride diffusion factor and other factors over time exists to predict remaining life, but Equations (3) and (4) were adopted and applied to the information system in this study because it is difficult to obtain the aforementioned information for chloride from ordinary diagnosis.
where is the chloride concentration at time and depth , is the chloride concentration of surface, is the chloride diffusion factor, is the error function, is the surface chloride concentration, is the initial chloride concentration of concrete, is the critical chloride concentration, and is the effective water/cement ratio.
2.2.2. Carbonation
Carbonation is defined as a deterioration phenomenon that decreases the pH of a pore solution via a reaction between carbon dioxide and cement hydrate, which causes cracking and spalling in concrete by promoting the corrosion of steel. The remaining life with respect to carbonation, as with that of chloride attack, is calculated as the time when the corrosion of a rebar is initiated. Carbonation is the deterioration that occurs via diffusion of carbon dioxide and is generally calculated using Equation (6), which is based on the law, because carbonation depth is known to be proportional to the square root of time. The calculation method for the carbonation diffusion factor was proposed by various researchers [27,28] and design standards, but it is not appropriate to be applied to BMS maintenance because of the difficulty in obtaining detailed information, such as surrounding environment, cement type, aggregate type, and construction degree, from safety diagnosis. Therefore, in this study, the calculation formula for the carbonation diffusion factor (Equation (7)), which is generally used, was applied to this information system.
where is the carbonation depth, is the carbonation diffusion factor, is time, and is the effective water/binder ratio.
2.2.3. Frost Attack
Frost attack is defined as a deterioration phenomenon that causes the cracking and popping out of concrete via the repeated freezing and thawing of moisture within the concrete. Concrete damage by frost attack is normally represented as the decrease in the relative dynamic modulus (RDM). Ref. [29] proposed a set of reduction formulas for the RDM according to air content, water/cement ratio, and number of freezing–thawing cycles, as expressed by Equations (8)–(10), based on the freezing–thawing model developed by Walton et al. (1990). In addition, the remaining life formula in terms of frost attack is derived as Equation (11), under the assumption that the RDM decreases by 70%, and verification was performed using the experiment results of [30,31]. Equation (11), which has been verified by various experiment results, is applied to this information system because only a few calculation formulas for remaining life with respect to frost attack have been proposed.
where is the number of freezing–thawing cycles, is the air content coefficient, is the coefficient of effective water/cement ratio, is the air content, is the effective water/cement ratio, is the time to attain the critical damage caused by frost attack, is the total number of freezing-thawing cycles, is the annual number of freezing-thawing cycles, and is the allowable degree of frost attack damage.
2.2.4. Fatigue
The fatigue of steel is defined as a deterioration phenomenon that causes cracks to occur via repeated vehicle loads acting on a member, with expanding cracks causing the member to fracture. Stress caused by repeated vehicle loads generally does not exceed the yield stress of the on-site bridge; however, stress concentration due to material defects, residual stress, and fine cracks results in the expansion of cracks. Therefore, the remaining life in terms of fatigue is calculated as the number of years until the crack expands to a critical size. Ref. [32] proposed fatigue life, as expressed by Equation (12), based on the results of an experiment involving constant cyclic stress. Because the following equation was proposed through the results of an experiment and adopted in the design standard, it was applied to the information system in this study.
where is the remaining life, is the resistance factor, is the fatigue constant according to detail classification, is the repetition number of stress range by a truck, is the average daily truck traffic in one direction of a single lane, is the ratio of truck traffic in a single lane, is the average daily truck traffic in one direction, is the effective stress range, is the partial load factor, and is the measured and calculated stress range.
2.3. Asset Valuation
The valuation of a bridge, which is an SOC structure, is defined as a financial representation of the asset value based on the perspectives of engineering, accounting, and sociology. Due to the accelerated aging of infrastructure globally, the necessity for research on valuation emerged to support efficient management. Valuation methods are largely divided into the historical cost (HC) method, which utilizes construction cost, and the replacement cost (RC) method, which replaces the construction cost with the cost of constructing a new bridge under the same condition. The HC method can assess the objective asset value if related accounting and engineering data are sufficient; otherwise, if the asset lists are mostly incomplete, assessment of the financial status and determination of the time historical cost for a given bridge may be difficult. Conversely, the RC method is a relatively simple method to assess an asset value because it is not required to consider additional costs according to time history; however, the asset value may not be assessed objectively if the calculated replacement cost is incorrect.
In the United States, the GASB34 was published by the Governmental Accounting Standards Board (GASB) [33] to assess the values of bridges. GASB34, which is based on the concept of the HC method, assesses assets via an accounting approach by proposing depreciation and modified valuation methods. GASB34 (depreciation) depreciates historical costs via the straight-line method, which assumes that the value of a bridge decreases steadily throughout its service life. In addition, the value is assessed under the condition that ordinary maintenance cost is regarded as a cost, and the improvement cost, which is used to significantly improve the functions of an asset, is regarded as an asset. Conversely, GASB34 (modified) does not depreciate the historical cost, under the assumption that the condition of the bridge is properly preserved through management; ordinary maintenance and preservation costs are considered as costs, whereas the improvement cost is considered as an asset. Meanwhile, the UK Roads Liaison Group (UKRLG) [34] in the United Kingdom and the New Zealand National Asset Management Steering Group (NZ NAMS) [35] in New Zealand proposed the depreciation replacement cost (DRC) method, which is a valuation method based on the concept of the RC method. The DRC is a method of assessing asset value via the determination and depreciation of the replacement cost of a bridge. Although the DRC is subdivided into various methods of valuation according to the depreciation process, the straight-line method, which has been previously mentioned, is primarily used to calculate depreciation because accurately calculating the depreciation cost of a bridge is difficult. Other valuation methods were also investigated in this study; the valuation methods for the HC and RC are presented in Table 2.
Table 2.
Asset valuation methodology [36].
As a result of the investigation for various valuation methods, the process of calculating each detailed cost is different, but the assessment of asset value based on an accounting approach that uses the concepts of asset, benefit, and cost is the same. However, because a bridge is an asset constructed for public benefit at the national level and does not generate any financial benefit from an accounting perspective, the bridge’s value can be evaluated via the subtraction of the cost from the asset value in both the HC and RC methods. The present total construction cost is classified as an asset, whereas the depreciation and maintenance costs used to manage the bridge are classified as costs.
2.3.1. Present Total Construction Cost
The calculation process for the present total construction cost varies depending on the HC and RC methods. The HC method, which utilizes historical cost incurred at the time of construction, calculates the present total construction cost using Equation (16). The total construction cost should be evaluated including the costs of construction, land, and equipment. The total construction cost of the bridge that is provided by a BMS operated in each country can also be used. In addition, a real discount rate is applied to the equivalent conversion of the historical cost at the present time to consider the difference in time values between the construction and present years due to price change. Conversely, the RC method, which utilizes the cost required to construct a new and identical bridge at the present time, calculates the present total construction cost using Equation (17). The average construction cost for the entire bridge can be used as a standard substitution cost (SSC), but a more reliable value can be assessed if the SSC is calculated with consideration of bridge components, technology, and social and environmental factors.
where is the present total construction cost, is the total construction cost, is the real discount rate, is the valuation year, is the construction year, and is the bridge area.
2.3.2. Maintenance Cost
When the bridge value is assessed using the HC method, the maintenance cost is deducted from the asset as a cost. Conversely, in the RC method, which does not require the time history to be reflected, the maintenance cost is not considered. The maintenance cost calculated using Equation (18) is divided into the ordinary maintenance cost, preservation cost required to preserve the condition of an asset, and improvement cost required to improve the condition of the asset. The preservation cost is considered as either an asset or cost, depending on the valuation method, based on the historical cost.
where is the maintenance cost, is the ordinary maintenance cost, is the preservation cost, and is the improvement cost.
2.3.3. Depreciation Cost
The depreciation cost, which is an important piece of information required to estimate the deterioration of a bridge’s value, is considered a cost. To accurately calculate the decrease in value of a long-lived bridge, the straight-line method, which calculates the depreciation cost based on the assumption that value decreases steadily throughout the available life, is mostly used for valuation. The depreciation cost using the straight-line method is calculated using Equation (19). For the available life required to calculate the depreciation cost, the bridge remaining life, which is generally determined and calculated through investigation/material tests, can be used. The straight-line method has an advantage in that the depreciation cost for numerous bridges can be calculated in a simple manner; however, a realistic decrease in value cannot be reflected because depreciation due to the aging of a bridge is not consistent with respect to time. The limitations of the straight-line method can be overcome by the written-down replacement cost (WDRC) method, introduced in Table 2, by utilizing the bridge health index (BHI). The BHI is derived via a safety diagnosis to calculate depreciation cost. The BHI is a numerical value representing the condition of a bridge with respect to its aging. The BHI can also be expressed as the defect index (DI). The depreciation cost is calculated using the BHI as in Equation (20) and requires historical information of safety diagnosis, but a more realistic depreciation cost can be calculated compared with that calculated using the straight-line method.
where is the depreciation cost, is the residual value, is the available life, and is the number of usage years.
2.3.4. Bridge Value
As previously mentioned, because a bridge is an asset constructed for public benefit at the national level and does not generate financial benefit from an accounting perspective, its value is assessed via the deduction of the cost from the asset (Equation (21)). Maintenance cost is not considered when the value is assessed by using the RC method. In this study, the information required to calculate the bridge value using the HC and RC methods was compiled and applied to the information system, and the data links for data usability were investigated.
3. Detailed Information for Maintenance Data Schema
3.1. Bridge
A bridge description table, which provides brief information about a bridge, is generally included in the inspection report after a safety diagnosis is performed. Because the attribute data for each bridge written in the description table should be included in the report on safety diagnosis, complete attribute data for bridges are easy to obtain. In addition, some of the attribute data can also be used to estimate the remaining life and value of the bridge. Therefore, these data are applied to the maintenance data schema refer to the description. Bridge attribute data consisted of bridge name, bridge ID, management number, completion date, construction cost, location, design load, route name, length, width, height, structure type (superstructure, substructure), basement type (abutment, pier), bearing type, expansion joint, cross facility, and attachment facility.
3.2. Member (Bridge Component)
Information on each member is determined at the planning/design stages and confirmed at the construction stage. Because information on each member is not included in the report on safety diagnosis, it should be obtained through structural design documents prepared at the design stage. Although structural design documents contain the information required to design each member, not all information can be applied to the BMS due to the volume of information, and not all information is useful for structure maintenance. Therefore, in this study, information required to identify the properties of a member and to manage diagnosis information based on members are included in member attribute data. In addition, information on each member that is required to estimate the remaining life and the bridge value is included. Finally, the member attribute data derived in this study consisted of the member ID, member type, component material, dimensions, capacity, quantity, production cost, material properties of concrete (water/cement ratio, water/bond ratio, design cover thickness, compressive strength), and material properties of steel (yield strength and ultimate strength).
3.3. Safety Diagnosis and Maintenance
Detailed information for each inspection item should be included in the BMS to utilize the information on safety diagnosis as a valuable factor for maintenance decision making. In this study, detailed information was derived as listed in Table 3, via the investigation of reports on safety diagnosis performed previously, such that information on both existing, currently operational bridges and new bridges can be managed. Because reports, including those on loading tests and calculation processes for safety rates, are submitted separately, and including all this information as data to be used in BMS is difficult, only safety grade and inspector opinion were applied to the BMS information system as detailed information on structural safety. In addition, because service performance is not a quantitative but a qualitative evaluation, only the detailed information as used for structural safety was applied to the information system.
Table 3.
Required detailed information by inspection type.
3.4. Remaining Life and Valuation
BIM should aim to efficiently manage bridges through processing and reusing of information rather than the simple accumulation of maintenance histories. As previously mentioned, because the remaining life and value of a bridge can be utilized for efficient decision making regarding its maintenance, estimation methods for the remaining life with respect to each deterioration type and valuation methods are established via investigations of previous studies and guidelines. Detailed information for use in calculations for remaining life and valuation, in addition to the corresponding linkage directions, are listed in Table 4 and Table 5 to establish an information system applicable to BMSs via the linkage of pieces of information relevant to safety diagnosis, remaining life, and valuation.
Table 4.
Information library items and linkages relevant to remaining life.
Table 5.
Information library items and linkages relevant to valuation
Detailed information required to calculate the remaining life of a bridge is divided into factors and constants, measurements, member attribute data, and bridge attribute data. For factors and constants, the values can be obtained from existing research or from guidelines that propose calculation formulas for each deterioration. Measurements such as chloride concentration, measurement depth, carbonation depth, number of annual freezing–thawing cycles, and average daily truck traffic can be linked to measured values from the investigation/material test conducted during safety diagnosis and performance evaluation. The water/cement ratio, water/bond ratio, air content of concrete, and design cover thickness are classified as member attribute data, whereas usage life is classified as bridge attribute data. Attribute data of a bridge and members can be obtained from safety diagnosis reports and structural design documents, and should be included in the BMS for bridge maintenance.
Detailed information required for the valuation of a bridge are divided into bridge attribute data, maintenance, depreciation, and real discount rate. The construction cost, land cost, equipment cost, and bridge area required to calculate the present total construction cost can be obtained from bridge attribute data, whereas the average unit cost of construction is determined using the properties of the bridge or the values proposed in the guidelines. The ordinary maintenance cost, preservation cost, and improvement cost are categorized under maintenance information. The cost of preservation and improvement can be considered as information on repair and strengthening conducted to preserve or improve the condition of the bridge. The depreciation cost is calculated mostly via the straight-line and BHI methods (Figure 4). The residual value, present total construction cost, remaining life, and usage years are required when using the straight-line method. The residual value can either be calculated or be provided by guidelines. Usage years can be linked to bridge attribute data, whereas remaining life can be linked to the value calculated through the previously mentioned calculation formula. Conversely, the calculation of the depreciation using the BHI, which is a method that considers bridge condition, can be linked to safety diagnosis results, such as the grade of the condition assessment and conditional safety. Furthermore, the real discount rate is a required item that represents the historical value of the bridge as its present value when the bridge value is calculated using the HC method and should be calculated with consideration of the inflation rate of the currency value.
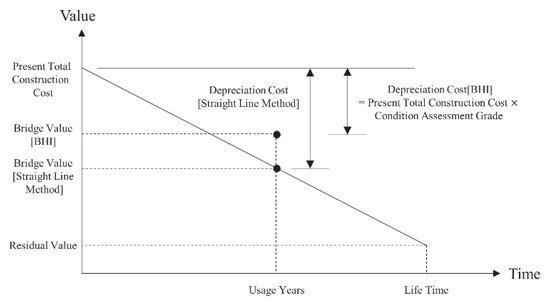
Figure 4.
Method of calculating depreciation cost.
4. Maintenance Data Schema and Information System
To apply BIM to bridge maintenance, the information required for maintenance should be linked to a 3D model, and each piece of information should be distributed appropriately according to the information system. In this study, the information system shown in Figure 5 was derived based on the maintenance data schema including detailed information for safety diagnosis, remaining life, and valuation. Entities are defined by considering safety diagnosis flow, inspection items, and information level. Attribute data in each entity are defined by considering detailed information mentioned earlier. In addition, information of results for diagnosis, remaining life, and valuation are also included. The calculation process of results was undertaken using C++. The calculation process and attribute data for diagnosis are based on a Korean example and can also be applied to examples of other countries. The Bridge entity includes attribute data, such as bridge name, completion date, construction cost, and bridge dimension, to manage the various bridges in one system. Diagnosis_plan and Inspection_type entities consist of the diagnosis plans and inspection types to manage the inspection history for each bridge. The diagnosis plan includes information for the diagnosis year and type such as “regular diagnosis,” “precision diagnosis,” “emergency diagnosis”, and “precision safety diagnosis” in the case of Korea. Inspection types are divided into two group. The first group includes inspection types (appearance examination, investigation/material test, repair/strengthening, and remaining life) that are accumulated at the member level, whereas the second group includes inspection types (structural safety, service performance and valuation) that are accumulated at the bridge level. Inspection_unit and Member entities are included in the information system to distinguish the location of inspection items and to link the WDMP with Midas CIM. Attribute data in the Member entity, such as member id, dimensions, and capacity, can be utilized in various cases. Classification entities are divided into three groups to classify inspection history according to material, bridge type, and valuation type. Entities that represent history information for inspection, remaining life, and valuation are allocated to the lowest information level. History entities for safety diagnosis and maintenance can be represented by one entity because they have same attribute data, whereas history entities for remaining life and valuation need to be divided into several entities according to items. In the information system, therefore, history entities for remaining life and valuation were defined according to items in Table 4 and Table 5. Attribute data for each history entity is the same as the detailed information in Table 3, Table 4 and Table 5. Lastly, additional entities (Safety_diagnosis_results, Performance_eval_results, Remaining_life, and Valuation) for representing maintenance results were defined. They include attribute data auto-calculated using C++.
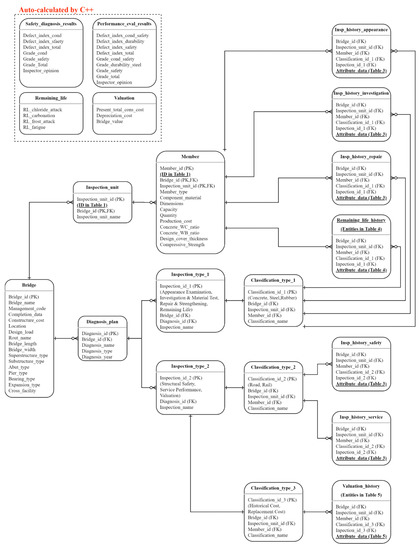
Figure 5.
Entity relation diagram (ERD) for the information system.
Attribute data on appearance examinations, investigation/material tests, structural safety, service performance, and repair/strengthening are accumulated in reports when safety diagnosis and maintenance is performed. The attribute data of the bridge and members are determined at the planning, design, and construction stages. Therefore, this information can be obtained completely from existing documents and utilized to estimate the remaining life and assess the bridge value for efficient decision making. Therefore, using the information system developed in this study, a BMS can be established not only for new bridges, but also existing bridges.
5. Bridge Management System (BMS)
For BIM-based efficient management and sharing of information generated from bridge maintenance, information should be managed on the web and visually identified with a 3D bridge model. Midas CIM is a 3D bridge modeling program, but an application program interface (API), which can allow the information structure to be extended by users, is not provided in Midas CIM. Therefore, in this study, a web data management program (WDMP) based on the maintenance data schema established above was separately developed and connected to a Midas CIM to construct the BMS illustrated in Figure 6. For program connection and representation of the information location on the bridge, symbols for bridge ID, inspection unit ID, member ID, and location coordinates were used. By selecting the symbol, users can link the history entity in the WDMP to a symbol in Midas CIM, and check the previously linked related attribute data of the bridge, members, and inspections. The prototype of the BMS developed in this study was applied to an actual bridge in Korea, and the performance, calculation process, and diagnosis flow relating to Korea was applied in the WDMP.
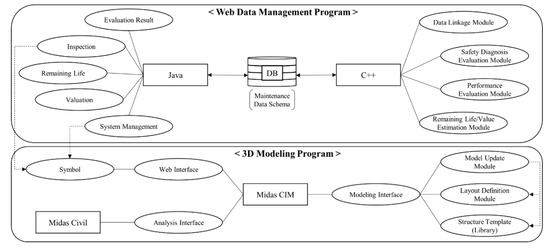
Figure 6.
Framework of the BMS and the connection between the WDMP and Midas CIM.
5.1. Web Data Management Program (WDMP)
The WDMP was established using Java for sharing information on the web, and C++ for data link and automatic calculation. Users can manage information through Java, and the input information is accumulated in the database (DB) based on the maintenance data schema visualized in Figure 5. Functions that can be implemented in Java consist of System Management, Inspection, Remaining Life, Valuation, and Evaluation Result. In System Management, the configuration of bridge components and attribute data of the bridge and members is managed. The weighted factors for evaluation of the diagnosis result and use management are also available. In Inspection, historical information on diagnosis for appearance examination, investigation/material tests, structural safety, service performance, and repair/strengthening are managed. In addition, information required to calculate the remaining life and value of the bridge is managed in Remaining Life and Valuation, and automatically calculated results are expressed in Evaluation Result.
C++ was utilized in the WDMP to include functions for data linking and automatic calculation. Information accumulated in the DB thorough Java are automatically linked and reflected in the C++ module. A Data Linkage Module can minimize repetitive tasks of information input and prevent information loss. A Safety Diagnosis Evaluation Module and Performance Evaluation Module are established separately because, in Korea, evaluation methods for bridges are divided into safety diagnosis and performance evaluation, and the evaluation processes are different, as previously mentioned. In addition, the remaining life and value of a bridge are automatically calculated by the Remaining Life/Value Evaluation Module.
The screen that represents the main functions of the WDMP is shown in Figure 7, Figure 8 and Figure 9. In the bridge management menu (Figure 7) of system management, users can manage the bridge tree that represents the configuration of bridge components. The bridge tree includes bridge name, diagnosis plan, inspection unit ID, and member ID. Once a user creates a bridge or a member, their attribute data can be managed. The other main function of the WDMP is input of historical attribute data for diagnosis, remaining life, and valuation (Figure 8). A user can input historical information to each bridge and member created in the bridge management menu. Some data mentioned in Table 4 and Table 5 are automatically linked with data entered previously. The level of historical information is divided into bridge and member levels. The information level is defined according to inspection type in Figure 5. The final main function is auto-calculation of results including diagnosis, the remaining life, and the bridge value (Figure 9). Results of remaining life and valuation can be used as scientific evidence for decision making about maintenance. Using entered historical information, results are auto-calculated by C++. In the WDMP, because all information that can be managed is stored in a data format, data usability is improved via data linking and auto-calculation. However, sensor data and the decision-making process is not included in the WDMP. Addressing these points will improve the usefulness of the WDMP.
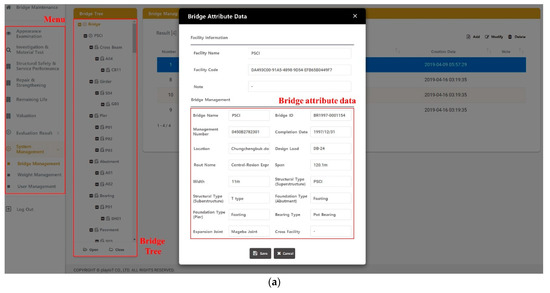
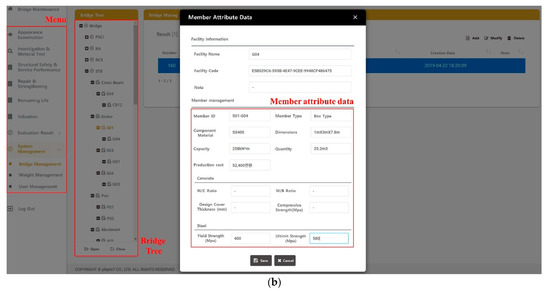
Figure 7.
Bridge management: (a) bridge attribute data; (b) member attribute data.
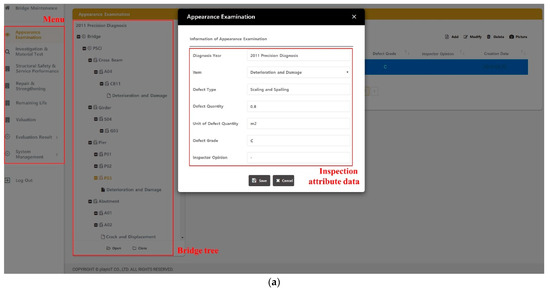
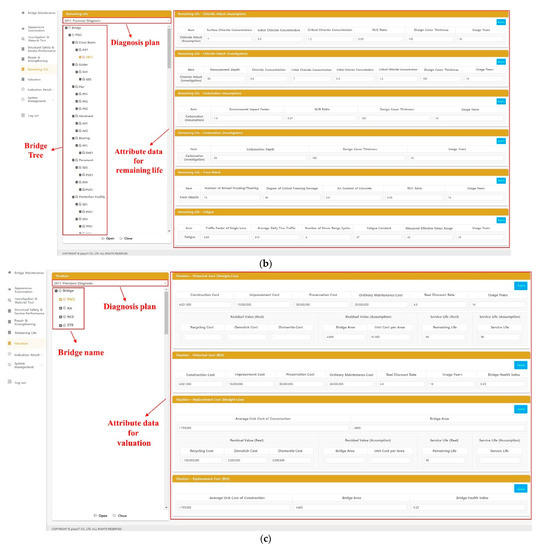
Figure 8.
Input of historical attribute data: (a) diagnosis; (b) remaining life; (c) valuation.
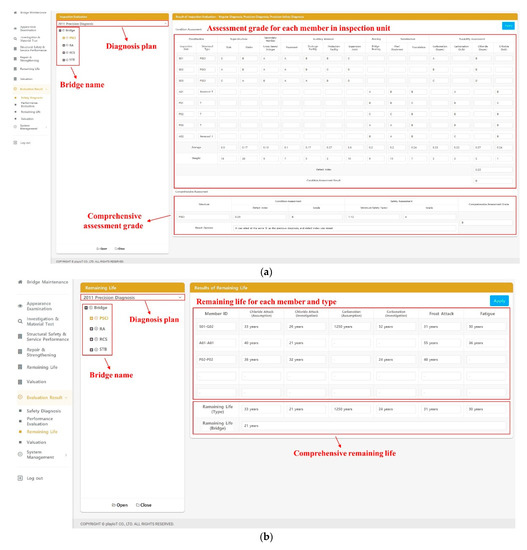
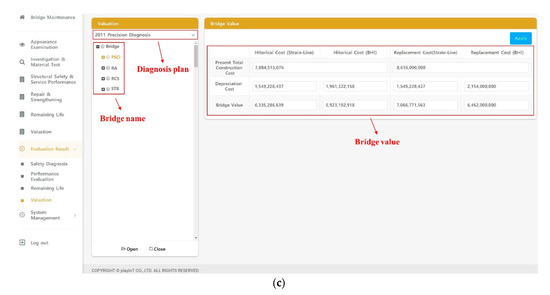
Figure 9.
Auto-calculated results: (a) diagnosis; (b) remaining life; (c) valuation.
5.2. Bridge 3D Modeling Program
The 3D modeling program Midas CIM (Figure 10) was adopted to construct a BIM-based BMS. A solid-shaped modeling technique that uses a structure template reflected in the master line of the bridge is applied in the CIM. Additionally, the CIM also provides a parametric component library based on the configuration system of a work breakdown structure (WBS). The structure template created via a combination of components can be reused in the modeling of other similar bridges. The modeling technique, which uses a template based on parametric components, can dramatically decrease the amount of time required to model another similar bridge, although the initial modeling for a particular bridge does consume a large amount of time. In addition, a model-updating module that can visually modify a component’s shape and master line layout is included in the CIM, thus immediately reflecting model modification, due to design changes, repair, and strengthening, after the modeling is completed. Moreover, Midas CIM provides IFC import and export based on the IFC4 version.
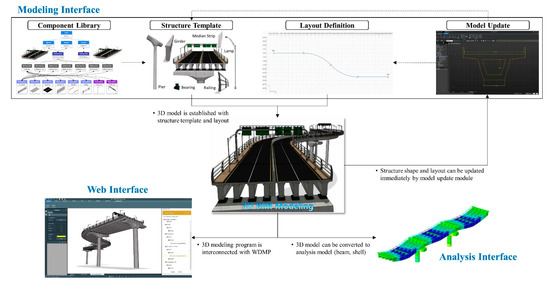
Figure 10.
Overview of the bridge 3D modeling program (Midas CIM).
During the safety diagnosis of a certain bridge, structural analysis is performed to assess the structural safety. For this process, a significant amount of time is required to construct a model for finite element analysis. Functions for extracting a 3D object based on a center line that can be converted to a structural analysis model in 1D or 2D, and for automatically generating a finite element mesh, are established in CIM. The converted structural model is linked to Midas Civil, finite element analysis program, which can reduce the time required to construct a model during safety diagnosis. In addition, a web interface was developed in the CIM to link the 3D information model with the WDMP. The configuration system of the bridge, its attribute data, and diagnosis history can be checked through this web interface. The locations of each diagnosis history are expressed in the 3D model using a hexagonal symbol. The inspection type is distinguished by symbol color, and the symbols are linked to the WDMP via an ID consisting of location coordinate, bridge ID, inspection unit ID, and member ID (Figure 11).
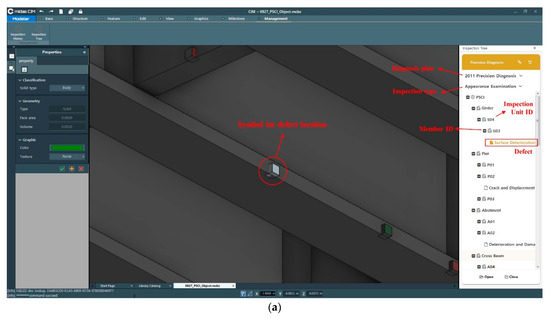
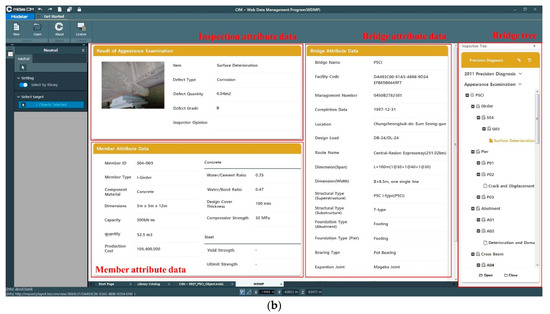
Figure 11.
BMS configured with Midas CIM and the WDMP: (a) representation of inspection location using symbols; (b) attribute data linked by symbol.
The BMS consisting of the WDMP and 3D model, which overcomes the limitation of traditional 2D-based work, can help users to easily check the location and information for inspection. In addition, information is managed on the web by the WDMP. Therefore, stakeholders can manage the bridge and share information effectively. However, at present, the information structure of the WDMP and the 3D model is similar to that of the IFC, but not completely based on IFC. Additionally, the WDMP and 3D model are not constructed in one system. Therefore, in the future, a BMS including the 3D model and WDMP is required to be constructed in one system based on the IFC format.
6. Conclusions
In this study, a BMS consisting of a WDMP and Midas CIM was established for the sustainability of bridge maintenance based on the maintenance data schema and information system. The time and cost required to manage numerous bridges are expected to decrease using this developed BMS. The results derived in the process of establishing a BMS based on BIM technology are as follows:
- The maintenance data schema and information system considering detailed information for not only diagnosis, but also remaining life and valuation, were established by investigating existing studies, diagnosis guide manuals, and inspection reports. The remaining life and the bridge value can be used as scientific evidence for decision making about bridge maintenance.
- A WDMP, based on the maintenance data schema and information system, was developed to efficiently manage and share information generated through maintenance. The WDMP was constructed using Java for information management on the web, and C++ for data linking and automatic result calculation.
- The BMS was established by connecting the WDMP with Midas CIM, which is a 3D modeling program. Midas CIM provides IFC export and import based on the IFC4 version. Symbols including location coordinates, bridge ID, inspection unit ID, and member ID are used for connection. The developed BMS is expected to reduce the time and cost of bridge maintenance through efficient decision making and retrofitting. Further study is required to develop the BMS in a single system comprising the WDMP and Midas CIM based on the IFC format. In addition, sensor data and the decision-making process need to be included in the BMS to improve the usefulness of the platform.
Author Contributions
Conceptualization, Y.J.K.; Investigation, N.B.; W.S.H. and Y.W.K.; Project administration, N.B. and Y.J.K. All authors have read and agreed to the published version of the manuscript.
Funding
This research was supported by the National Research Foundation of Korea (NRF) grant funded by the Korea Government (MIST) (Grant No. 2020R1A2C201445012).
Institutional Review Board Statement
Not applicable.
Informed Consent Statement
Not applicable.
Data Availability Statement
Not applicable.
Conflicts of Interest
The authors declare no conflict of interest.
References
- Hammad, A.; Zhang, C.; Hu, Y.; Mozaffari, E. Mobile model-based bridge lifecycle management system. Comput. Aided Civ. Infrastruct. Eng. 2006, 21, 530–547. [Google Scholar] [CrossRef]
- Bień, J. Modelling of structure geometry in bridge management systems. Arch. Civ. Mech. Eng. 2011, 11, 519–532. [Google Scholar] [CrossRef]
- Shim, C.S.; Kang, H.; Dang, N.S.; Lee, D. Development of BIM-based bridge maintenance system for cable-stayed bridges. Smart Struct. Syst. 2017, 20, 697–708. [Google Scholar] [CrossRef]
- Yan, W.; Culp, C.; Graf, R. Integrating BIM and gaming for real-time interactive architectural visualization. Autom. Constr. 2011, 20, 446–458. [Google Scholar] [CrossRef]
- Becerik-Gerber, B.; Jazizadeh, F.; Li, N.; Calis, G. Application areas and data requirements for BIM-enabled facilities management. J. Constr. Eng. Manag. 2012, 138, 431–442. [Google Scholar] [CrossRef]
- Lee, G.; Sacks, R.; Eastman, C.M. Specifying parametric building object behavior (BOB) for a building information modeling system. Autom. Constr. 2006, 15, 758–776. [Google Scholar] [CrossRef]
- Akhoundan, M.R.; Khademi, K.; Bahamanoo, S.; Wakil, K.; Mohamad, E.T.; Khorami, M. Practical of computational building information modeling in repairing and maintenance of hospital building-case study. Smart Struct. Syst. 2018, 22, 575–586. [Google Scholar] [CrossRef]
- Zabin, A.; Khalil, B.; Ali, T.; Abdalla, J.A.; Elaksher, A. A semi-automated method for integrating textural and material data into as-built BIM using TIS. Coupled Syst. Mech. 2020, 5, 127–146. [Google Scholar] [CrossRef]
- ISO 19739-1:2018. Industry Foundation Classes (IFC) for Data Sharing in the Construction and Facility Management Industries; Innovations Moving Transport Forward; ISO: Geneva, Switzerland, 2018. [Google Scholar]
- Jeong, S.W.; Hou, R.; Lynch, J.P.; Sohn, H.; Law, K.H. An information modeling framework for bridge monitoring. Adv. Eng. Softw. 2017, 114, 11–31. [Google Scholar] [CrossRef]
- Park, S.I.; Park, J.W.; Kim, B.G.; Lee, S.H. Improving applicability for information model of an IFC-based steel bridge in the design phase using functional meanings of bridge components. Appl. Sci. 2018, 8, 2531. [Google Scholar] [CrossRef]
- Wan, C.; Zhou, Z.; Li, S.; Ding, Y.; Xu, Z.; Yang, Z.; Xia, Y.; Yin, F. Development of a bridge management system based on the building information modeling technology. Sustainability 2019, 11, 4583. [Google Scholar] [CrossRef]
- Lee, K.M.; Lee, Y.B.; Shim, C.S.; Park, K.L. Bridge information models for construction of a concrete box-girder bridge. Struct. Infrastruct. Eng. 2012, 8, 687–703. [Google Scholar] [CrossRef]
- Marzouk, M.; Hisham, M. Implementing earned value management using bridge information modeling. Ksce J. Civ. Eng. 2014, 18, 1302–1313. [Google Scholar] [CrossRef]
- Fanning, B.; Clevenger, C.M.; Ozbek, M.E.; Mahmoud, H. Implementing BIM on infrastructure: Comparison of two bridge construction projects. Pract. Period. Struct. Des. Constr. 2015, 20. [Google Scholar] [CrossRef]
- Kim, H.S.; Kim, S.-K.; Borrmann, A.; Kang, L.S. Improvement of realism of 4D objects using augmented reality objects and actual images of a construction site. Ksce J. Civ. Eng. 2017, 22, 2735–2746. [Google Scholar] [CrossRef]
- Shim, C.S.; Lee, K.-M.; Kang, L.S.; Hwang, J.; Kim, Y. Three-dimensional Information model-based bridge engineering in Korea. Struct. Eng. Int. 2018, 22, 8–13. [Google Scholar] [CrossRef]
- Shimizu, T.; Yoshikawa, S.; Takinami, H.; Misaki, N.; Takahashi, Y.; Nakayama, T.; Uchida, O.; Kondo, K. Development of bridge management system using three-dimensional model. J. Jpn. Soc. Civ. Eng. Ser. F3 2013, 69, I_45–I_53. [Google Scholar] [CrossRef]
- McGuire, B.; Atadero, R.; Clevenger, C.; Ozbek, M. Bridge Information Modeling for Inspection and Evaluation. J. Bridge Eng. 2016, 21. [Google Scholar] [CrossRef]
- FHWA. Bridge Inspector’s Reference Manual; Federal Highway Administration: Washington, DC, USA, 2012. [Google Scholar]
- AASHTO. Bridge Element Inspection Guide Manual; American Association of State Highway and Transportation Officials: Washington, DC, USA, 2010. [Google Scholar]
- JSCE Standard Specifications for Concrete Structures-Maintenance; Japan Society of Civil Engineers: Tokyo, Japan, 2007.
- KISTEC Detailed Guideline for Safety Inspection and Precision Safety Inspection; Korea Infrastructure Safety Corporation: Jinju, Korea, 2017.
- KISTEC Detailed Guideline for Safety and Maintenance Implementation of Facilities (Performance Evaluation); Korea Infrastructure Safety Corporation: Jinju, Korea, 2018.
- Browne, R.D. Mechanisms of corrosion of steel in concrete in relation to design, inspection, and repair of offshore and coastal structures. J. Am. Concr. Inst. 1980, 65, 169–204. [Google Scholar]
- Tuutti, K. Corrosion of Steel I Concrete; Swedish Cement and Concrete Research Institute: Stockholm, Sweden, 1982. [Google Scholar]
- Hamada, M. Neutralization(carbonation) of concrete and corrosion of reinforcing steel. In Proceedings of the 5th International Symposium on the Chemistry of Cement, Tokyo, Japan, 6–12 October 1968. [Google Scholar]
- Kishimoto, Y.; Hokoi, S.; Harada, K.; Takada, S. Prediction model for carbonation of concrete structure considering heat and moisture transfer. J. Struct. Constr. Eng. 2005, 70, 17–23. [Google Scholar] [CrossRef]
- Al-Neshawy, F. Computerised Prediction of the Deterioration of Concrete Building Facades Caused by Moisture and Changes in Temperature. Ph.D. Thesis, Aalto University, Espoo, Finland, 2013. [Google Scholar]
- Walton, J.C.; Plansky, L.E.; Smith, R.W. Models for Estimation of Service Life of Concrete Barriers in Low-Level Radioactive Waste Disposal; Office of Nuclear Regulatory Research: Washington, DC, USA, 1990. [Google Scholar]
- Tanesi, J.; Meininger, R. Freeze-Thaw Resistance of Concrete with Marginal air Content; Fedral Highway Administration: Washington, DC, USA, 2007. [Google Scholar]
- AASHTO. The Manual for Bridge Evaluation; American Association of State Highway and Transportation Officials: Washington, DC, USA, 2011. [Google Scholar]
- GASB. Guide to Implementation of GASB Statement 34 on Basic Financial Statement and Management’s Discussion and Analysis for State and Local Governments; Governmental Accounting Standard Board: Norwalk, CT, USA, 2000. [Google Scholar]
- UKRLG. Guidance Document for Highway Infrastructure Asset Valuation; UK Roads Liaison Group: London, UK, 2005. [Google Scholar]
- NZ NAMS. New Zealand Infrastructure Asset Valuation and Depreciation Guidelines; New Zealand National Asset Management Steering Group: Thames, New Zealand, 2006. [Google Scholar]
- AN, J.M.; Park, J.B.; Lee, D.Y.; Lee, M.J. A study on asset valuation method for road facilities maintenance. Korea J. Constr. Eng. Manag. 2012, 13, 141–151. [Google Scholar]


Publisher’s Note: MDPI stays neutral with regard to jurisdictional claims in published maps and institutional affiliations. |
© 2021 by the authors. Licensee MDPI, Basel, Switzerland. This article is an open access article distributed under the terms and conditions of the Creative Commons Attribution (CC BY) license (https://creativecommons.org/licenses/by/4.0/).