1. Introduction
In the last decades, the concern of global society has shifted from the concept of environmental protection to that of sustainability. The latter is a broad concept that does not focus just on measuring the environmental impact of a process or product, but, rather, on finding a balance between the environmental, economic, and social dimensions [
1]. For this reason, impact evaluation must be done in a way that allows to consider all three dimensions at once, to be able to provide valuable information to decision-makers. A conceptual framework aimed at performing this task was developed by the Life Cycle Initiative of the United Nations’ Environment Programme (UNEP) and it is called Life Cycle Sustainability Assessment (LCSA) [
2]. The UNEP framework includes environmental. Life Cycle Assessment (LCA), Life Cycle Costing (LCC) and Social Life Cycle Assessment (SLCA). LCA can rely on well-established indicators, which are developed, characterized and discussed within the scientific community. LCC assessment, on the contrary, is a technique used to predict and assess the cost performances of products or assets [
3], widely used in the business world, public procurement and policy environments, to compare different project alternatives and to identify the one characterized by the lowest cost [
4]. The LCC analysis encompasses all the relevant costs that occur throughout the life of an alternative, not simply the original expenditures [
4].
This study is aimed at developing an indicator for LCC as it were an LCA indicator: costs are treated like characterization factors, while the classification and characterization phases are carried out like in a conventional Life Cycle Impact Assessment (LCIA) [
5]. Unlike conventional LCC, the proposed indicator only considers costs related to natural resources used along the life cycle of a product or service and is called Commodity Life Cycle Cost or C-LCC indicator. Such indicator, which does not encompasses all life cycle costs of a product, is able to quantify, in monetary units, the extent to which a product or process exploits natural resources during its life cycle. Such indicator can become an important tool for the development of policies aimed at promoting the principles of circular economy and to reach the goals set by the Green New Deal, a plan developed by the European Union (EU) with the goal to make EU’s economy sustainable and carbon-neutral by 2050 [
6].
The development of an economic indicator, expressed in monetary units, for both environmental impacts and resource costs, can be useful to include LCA and LCC in decision making [
7], and to provide additional arguments to the implementation of policies aimed at reducing non-renewable resource consumption. In the case of air emissions, the environmental impact can be assessed with well-established methodologies, like the so-called impact pathway method and the consequent monetary estimation of externalities (see Girardi et al. [
8] for an application to passenger cars) In the case of natural resource depletion the picture is less clear-cut, even though the mineral and fossil depletion indicators developed by ReCiPe [
9] represent a widely used tool.
The C-LCC indicator we propose in the present paper has been developed from the concept of raw material cost defined by Wilting and Hanemaaijer [
10], which is the cost of all natural resources purchased and used during the production of a given good. Such cost can be expressed as the sum of all market prices of raw materials used, excluding all other costs like, for example, labour or depreciation. The C-LCC indicator extends this approach to the entire life cycle of a product and represents an economic measure of natural resource use.
Since the C-LCC indicator is based on market prices (or their proxies), which are a measure of resource scarcity, it can therefore be interpreted as measure of the extent to which a given product/process exploits natural resources during its life cycle. Other LCA indicators of resource use/depletion are available in the literature but only a few of them are of economic type. Furthermore, most of them rely on strong assumptions regarding available reserves, current and future rates of consumption and supply and demand, undermining the robustness of their results. Our proposed indicator avoids this problem using market prices as a proxy for resource scarcity.
The C-LCC indicator can, as a result, be useful for the development of policies aimed at promoting an efficient use of raw materials as the Roadmap to a Resource Efficient Europe outlines [
11]. Alternative versions of the indicator-the first calculated from open-source market prices and the second based on the list of critical raw materials provided by the European Commission-are also developed and compared with the baseline version.
This paper is organized as follows.
Section 2 reviews the exiting literature on LCA indicators of natural resource depletion.
Section 3 outlines the theoretical background of the proposed methodology, information on the data used in the calculation of the C-LCC indicator and on the case study on batteries for stationary storage.
Section 4 shows the baseline results of the case study and of the uncertainty assessment. In particular, in
Section 4,
Section 4.5 and
Section 4.6 provide a comparison between the C-LCC indicator and other economic indicators of resource depletion (namely the ReCiPe’s Mineral and Fossil Resource Depletion indicators) and between the baseline and a “critical materials” version of the indicator.
Section 5 discusses the results and
Section 6 concludes.
2. Literature Review
The availability of natural resources is a very important issue for our society since humans are dependent upon them for their individual metabolism and for their economic activities [
12]. The debate on how resource use should be addressed in LCA studies is therefore very animated and has led to the development of a wide array of impact assessment methods, each of which seeks to assess different aspects of mineral resource use [
13].
Sonderegger et al. [
14] perform a review of methods for the assessment of natural resource use in the LCA framework and categorize them on the basis of their impact mechanisms in four categories: depletion methods, future effort methods, thermodynamic accounting methods and supply risk methods. According to the authors, the methods included in the first two categories are those traditionally used in the LCA literature, while the others are more useful in providing complementary information.
Building from Sonderegger et al. [
14], Berger et al. [
13] provide recommendations for the application-dependent use of the methods and for further methodological development. Future efforts methods are the biggest category and include one the most applied methods for resource depletion in LCA: the ReCiPe method [
15]. Such methods seek to assess the consequences of current mineral resource use on the efforts that the society, in the future, will have to make to extract the same amount of mineral resource. Future generations will have three options to use an unity of a given resource: reuse an unity of the same resource already used in the past (recycling), extract another unity or exploit technology improvements (and therefore the type of resource used) [
14]. Most existing future efforts methods are based on the assumption that ore grades in the future will be lower than current ones, which will lead to an increase in extraction cost and, therefore to ever-increasing prices for future generations [
15].
Sonderegger et al. [
14] place the ReCiPe method–against which the C-LCC indicator is compared–in the so-called cost-only sub-category, since it quantifies the surplus cost potential (SCP) of mining and milling activities per unit of metal extracted, fully accounting for mine-specific differences in costs. The surplus cost potential indicator is calculated as the average cost increase resulting from all future metal extractions, as quantified via cumulative cost-tonnage relationships [
16]. Even though the ReCiPe Mineral and Fossil Resource Depletion indicators are expressed in monetary units, they use information from the supply side only, while also changes in demand or technological development can influence resource availability.In most cases, and the ReCiPe indicators make no exception, depletion and future efforts methods focus on the long-term or absolute depletion of materials, since they must be preserved for future generations (time horizon of 100–1000 years) [
15]. Such methods, however, as Vogtländer et al. [
15] point out, are based on information that is very uncertain: the ultimate reserves of given resources present in the Earth’s crust and the deaccumulation of such reserves. Current data on ultimate extractable reserves do not take into account the fact that new discoveries can take place in the future or the (auspicial) reduction of primary mining because of increasing recycling rates or replacement of certain resources by other materials. Most environmentalists adhere to a fixed-stock paradigm as a precautionary principle, even though experts from the mining industry are generally more optimistic [
15].
In any case it is very hard to make reliable forecasts for the depletion of mineral resources on very long time horizons [
15]. Rötzer and Schmidt [
17] discuss whether the assumption of declining ore grades should be taken as a proxy for resource exhaustion. They show, using copper as an example, that ore grades only are not sufficient to make statements on the availability of raw materials but that, instead, they should be taken as a proof of the enormous progress made by mining technology as showed by the long-term trend of real prices that has been almost constant since the early 1900s. What decreasing ore grades do influence is expenditure on input materials, overburden, energy and emissions, which have, in turn, consequences on the environment [
17].
The problem associated with the uncertainty that permeates future ore grades and future extraction cost has spurred the development of alternative indicators: some still belonging to the future efforts methods, others to the thermodynamic and supply risk methods, as outlined by Sonderegger et al. [
14].
The economics-only methods, which can still be placed among the future efforts methods, are based on mineral resource prices and economics, avoiding to make any assumption on future ore grades or extraction cost. Examples are the future welfare loss approach and the LIME2 method, developed by Huppertz et al. [
18] and Itsubo and Inaba [
19] respectively. The future welfare loss (FWL) approach is a market-price method that assumes that market prices incorporate information from market agents on resource availability, future backstop technologies, recycling potentials, evolution of reserves and extraction cost. Huppertz et al. [
18] base their method on the Hotelling rule, according to which private agents discount future costs and benefits at a higher rate than society as a whole. The rationale behind this indicator is that the future scarcity value of a resource is already included in the resource price: the difference between the price and the extraction cost of the resource. Such difference is the economic rent, which is the NPV of the expected future revenue from extracting the resource. The authors, however, argue that this rent is calculated using a discount rate (market discount rate) which is higher than the social discount rate, leading to an underestimation of the true value: lower rent can lead to a faster depletion of the resource than in the social optimum. In other words, the FWL approach assesses the potential externality of missed rents due to overconsumption. The FWC therefore allows to calculate the social cost of resource exhaustion to be used in either cost-benefit analysis (CBA) or LCA. Shortcomings of this approach are the fact that the authors assume constant extraction cost (75% of market price) and the uncertainty that permeates the price elasticity of future demand for resources. Itsubo’s and Inaba’s [
19] LIME2 method is based on the concept of user cost proposed by El Serafy [
20], who argues that a part of the earning generated from the sale of finite resources must be re-invested to guarantee the renewal of the resource.
As already mentioned, alternative methods to future efforts methods based on the concept of decreasing ore grades are supply risk ones. Among these, the most important are the economic scarcity potential (ESP) method [
21] and the GeoPolRisk indicator of Gemechu et al. [
22].
Some authors ([
15,
23,
24]) have been highlighting the importance of including criticality within LCA studies, as the debate on critical raw materials unfolds in many countries. Critical materials are those economically important materials characterized by supply risks, which can depend on their physical availability and/or geopolitical factors.
The indicator developed in this study avoids, like the FWL indicator [
18], to make assumptions on the pace at which ore grade will be declining in the future or on the extent of reserves and develops an economic indicator based on market prices–conceptually inspired by life cycle costing techniques–aimed at quantify the extent to which a product or process exploits natural resources during its life cycle. An alternative version of the indicator, based on critical raw materials, was also developed. The following section details the methodology.
3. Materials and Methods
The development of the C-LCC indicator is based on Wilting and Hanemaaijer [
10], who define an indicator of the share of raw materials on total production cost, with the aim of providing decision-makers with a tool to predict the effects of pricing policy on the use of natural resources. They develop the concept of
basic raw material cost (BRMC), which can be defined as the cost of all the natural resources purchased and used during the production process. The BRMC can be approximated with the market price of all raw materials used, excluding all other costs, such as labour or depreciation. The authors argue that the basic raw materials cost is a good indicator for resource use within an economy because it does not include value added from component-supplier chains and is-similarly-a good indicator for the potential behavioural effects of natural resource pricing. The original BRMC, developed by Wilting and Hanemaaijer [
10] can be thought as a country-level life-cycle costing (LCC) assessment focused on just the production phase and considering natural resources only. We extend this approach to the entire life cycle and apply this concept at product level.
Even though the C-LCC indicator does not consider all costs related to the life cycle of a product like a conventional LCC assessment, is able to quantify, in monetary units, the extent to which a product or process exploits natural resources during its life cycle.
The C-LCC indicator is calculated starting from market prices and, for this reason, does not need to make assumptions on natural resource reserves, future consumption or technological development, because, market price as suggested by Smith [
25] and Huppertz et al. [
18] is already a measure of scarcity. Market prices incorporate extraction cost, user cost and market operators’ expectations on the future availability of a given resource. Market prices must be observed, nonetheless, for a sufficiently long period because, in the short term, supply- or demand-side shocks can trigger large fluctuations from the long-term equilibrium.
The measurement of the scarcity level of natural resources is important to develop and implement policies aimed at promoting sustainable development. In the economic literature it is possible to identify three resource scarcity measures: market price, extraction cost and user cost [
26]. These indicators are related by the following relationship:
where
is the market price of a given resource,
is extraction marginal cost and
is user cost. While market price and extraction cost are concepts somewhat familiar, user cost might not. It captures the non-extractive economic cost of current depletion, including the foregone regeneration if the resource is renewable or the foregone future use if the resource is not renewable. It also includes the contribution of stocks: abundant reserves might decrease extraction or harvest cost [
26].
Quantification approaches of resource scarcity based on extraction costs are grounded on the concept of decreasing marginal returns of a finite natural resource, a concept at the basis of classical economic theory: the cost of extraction increases as demand and depletion increase. This process that can be offset by technological progress only [
26]. Vieira et al. [
16] follow an extraction cost approach (a “cost only” approach, belonging to the future efforts methods, to follow the classification proposed by Sonderegger et al. [
14]) for the development of the methodology to calculate the ReCiPe economic indicators based on the SCP, which will be described in detail later.
Krautkraemer [
26] points out that the extraction cost approach is a static measure of resource scarcity because it does not take into account factors that, in the future, might influence the ease of extraction of a given resource or its scarcity altogether. Vieira et al. [
16] acknowledge this limitation in their calculations of the surplus cost potential, which is in turn used to compute the ReCiPe Mineral and Fossil Resource Depletion indicators. Extraction costs can be substantially affected by changes in mine type, ore type, new discoveries or technological development. Under this approach, moreover, only supply side information is used to estimate resource scarcity, while also changes in demand can greatly affect resource availability.
Market price and user cost, on the contrary, incorporate information regarding current resource demand and, at least partially, also on expectations towards future demand. To this extent, Fischer [
25] points out that a measure of resource scarcity should have just one essential property: it should be able to summarise all sacrifices, both direct and indirect, made to obtain a unit of the resource.
Even though this definition seems to refer to factors related to the supply side only, it is not the case. The word “made” implies willingness to pay, which is a demand-related factor, and the word “indirect cost,” can be interpreted as the cost of the foregone future consumption due to current consumption. Fischer [
25] also highlights that extraction cost does not capture this indirect component and that market price is the measure to be preferred, also because it is related to stock changes, at least in the medium run. Nonetheless, market price has some limitations because it is not able to take into account the “environmental effects of resource use” that is externalities-and Fischer [
25] highlights the need to adjust scarcity measures-namely market prices-to reflect the consumption of environmental resources of common property.
The starting point for the development of the C-LCC indicator was the list of materials considered in the LCA indicator Mineral and Fossil and Renewable Resource Depletion from the International Reference Life Cycle Data System (ILCD) [
27]. The second step of the analysis was the identification, for each material or energy flow, of a data source for the corresponding market price. Priority was given to open source databases even though it was not always possible to find one. In many cases, since it was not possible to identify a reference price for a given commodity, alternative approaches were used-namely unit values calculated from international trade data.
An alternative version of the indicator, based on open source data only, was also developed, calculated and compared to the baseline version.
The list of materials included in the LCA indicator Mineral fossil and renewable resource depletion can be extended to include all material flows that characterize a given product or process and that might not be included in the ILCD indicator. This is was done in the case study presented in this paper.
Raw materials like water or land use changes, although quantifiable in physical terms, were not included in this first version of the C-LCC indicator because-in most cases-no price must be paid for their use. They are, in other words, externalities of the production-use-disposal processes and therefore have not been considered. The monetization of such externalities would be nonetheless important for the full assessment of the amount of natural resources used in the life cycle: for this reason, next versions of the C-LCC indicator will be developed considering their inclusion.
The future inclusion of externalities, especially negative ones, in the C-LCC indicator is important also to make the indicator more comparable to other resource exploitation economic indicators already available in the literature, such as the ReCiPe Mineral and Fossil Resource Depletion indicators [
9,
28]. The main objective of the ReCiPe method is to transform long life cycle inventories in a limited number of indicators that express the impact of a product in different environmental categories. ReCiPe indicators are available at both midpoint and endpoint level.
The ReCiPe indicators assess the exploitation of mineral and fossil resources, by a product during its life cycle, under an economic point of view: Mineral Resource Scarcity and Fossil Resource Scarcity. These indicators were developed because, in many cases, the real constraint in resource use is their economic rather than physical availability. Even though a given resource might be available in the Earth’s crust, its extraction might not be economically viable [
16]. The starting point for the calculation of the ReCiPe economic indicators is the surplus cost potential (SPC), which is an indicator of the future economic scarcity of a resource and is calculated as the average cost increase resulting from all future metal extractions [
16]. Vieira et al. [
16] calculate the surplus cost potential for twelve metals and argue that it can represent a good resource scarcity indicator in LCA. The concept of SPC is used as endpoint characterization factor in the calculation of the ReCiPe Mineral Resource Scarcity and Fossil Resource Scarcity indicators [
29], which now account for about seventy minerals [
28].
The ReCiPe indicators can be interpreted as indicators of future economic scarcity of a resource, and therefore they quantify an externality: today’s extraction makes tomorrow’s extraction more difficult. The C-LCC indicator is based on market prices and, therefore, assesses resource scarcity at the moment of the evaluation. However, we assume that market prices incorporate economic operators’ expectations towards resource availability in the foreseeable future but ignoring-in most cases-social and environmental costs associated with the extraction and consumption of such resources, as pointed out by Fischer [
25]. For this reason, ReCiPe and C-LCC indicators can be thought as complementary tools, which measure the consequences of resource exploitation from different angles and with different techniques. ReCiPe indicators measure the negative externality associated to resource extraction (extraction today makes extraction more difficult and expensive tomorrow) using a data-intensive calculation method, which is not easy to replicate. The C-LCC indicator, based on market prices, is easier to calculate and update, provides a measure of resource scarcity in the short and medium run but currently only considers externalities already “internalized” by the economic system. Finally, it allows to reduce the uncertainty associated with the calculation of the C-LCC indicators due to market prices short-term volatility through the application of Monte Carlo analysis.
An alternative version of the C-LCC indicator, restricted to the European Commission’s list of critical raw materials, was developed and applied to batteries for stationary storage. The results are compared with those of Santillán-Saldivar et al. [
30], who are amongst the first to acknowledge the need of an endpoint indicator to measure geopolitical supply risk and to complement the conventional environmental LCA with an indicator of raw material criticality. The authors develop an indicator, called GeoPolEndpoint (based, in turn, on the GeoPolRisk indicator of Gemechu et al. [
22]), to measure the socio-economic damage of the use of mineral resources. The authors test their method on aluminium, cobalt, nickel and copper, which are key-materials to produce Li-Ion batteries. Cobalt and nickel are those that dominate the contribution to socio-economic damages because of their price and supply risks.
3.1. Data
The raw materials considered for the development of the C-LCC indicator are those included in the Mineral Fossil and Renewable Resource Depletion indicator of the International Reference Life Cycle Data System [
27]. Such materials include secondary energy sources (i.e., crude oil or natural gas), various minerals and energy produced from renewable sources (i.e., wind or photovoltaic) but does not include, as highlighted earlier, water use and land use changes, even though their inclusion will be considered in the next versions of the indicator. The full list of raw materials considered, available in the ILCD report [
27], is provided also in the
Supplementary Materials (Section S1), with additional information regarding the sources used.
Since, in some cases, more raw materials than those included in the Mineral fossil and renewable resource depletion indicator are involved in the life cycle of a given product, the list of raw materials can be expanded, like in the case study regarding batteries for stationary storage presented in this study (see
Supplementary Materials Section S2).
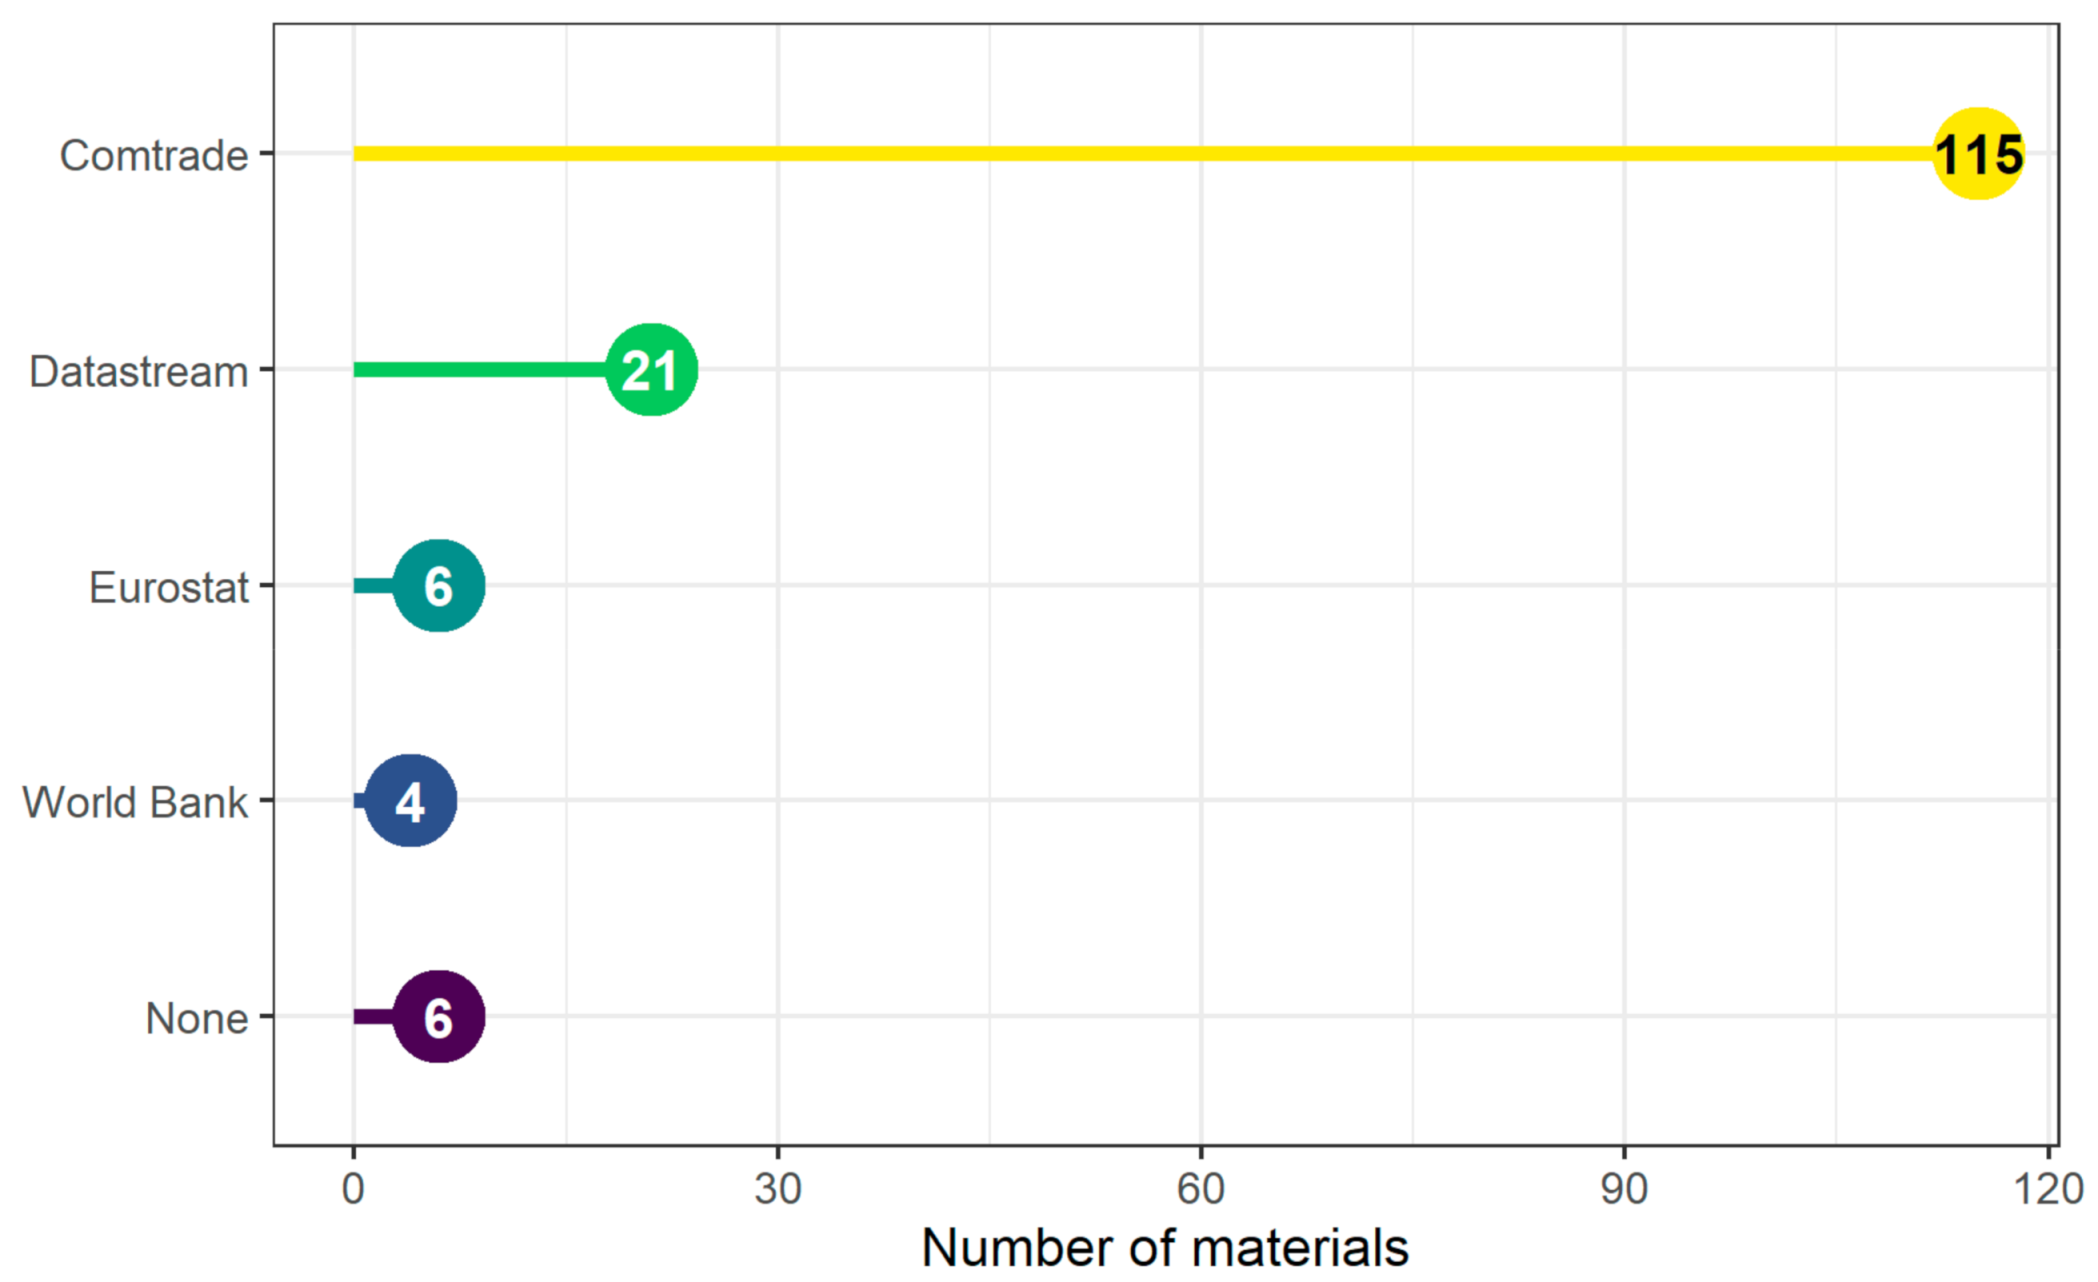
Market price data are from both open access databases (World Bank’s [
31] and Eurostat’s [
32]) and the restricted access Datastream database [
33]. Nonetheless, it was not possible to identify the reference market price for all the raw materials considered, also because some of them are not refined materials but ores. For this reason, the market price of a significant number of materials was approximated with export unit values. Trade data are retrieved from the United Nations’ Comtrade database [
34], which provides detailed trade data, both in volume and in value up to a 6 digit level of detail according to the Harmonized Commodity Description and Coding System (HS) [
35]. Unit values are calculated, for every year and commodity, as the ratio between aggregated export value and aggregated export volume at world level. Exports are considered, and not imports, because reported export values are free on board, and therefore closer to real market prices. Flows smaller than 100 kg or with missing values or volumes are not considered.
In the case of the electric energy produced from renewable sources, it is not possible to find a market price for solar radiation or wind (although raw materials for solar modules and windmill generators are included). Nonetheless, energy from renewable sources, even if characterized by a zero marginal cost, is sold in the same market of energy from non-renewable sources. For this reason, in this study, the cost of electric energy from renewable sources is approximated with the average price of electric energy-net of taxes and levies-for non-household consumption and for users that consume 70–150 GWh/year, the amount used by a factory of significant dimensions [
36]. The choice of using the average European price, however, is acceptable only in the case of the case study illustrated in this paper and it might not be valid in other applications. In this study, the production of cells and batteries is assumed to take place in Italy but we are well aware that a more general approach should be followed when energy use is more geographically dispersed along the life cycle of a product and when renewables will penetrate electricity mixes in most countries in the world.
All prices are expressed in real terms: original values are converted in euros using market exchange rates and then adjusted to 2019 prices with the Eurozone GDP deflator. For six raw materials was not possible to identify a reference market price: noble gases, carbon dioxide in ground and worthless gangue materials.
An open-source version of the C-LCC indicator is also developed, replacing prices from the Datastream database with those found in World Bank database or, in most cases, with export unit values computed from the Comtrade database.
The C-LCC indicator is calculated from average prices of the 2010–2019 period. In some cases, due to data availability, reference prices are calculated on a smaller number of observations. Reference prices used in both the baseline and open source analysis are reported in the
Supplementary Materials, Section S3. Minimum and maximum values recorded in the 1995–2019 period are used in the Monte Carlo uncertainty analysis.
All computations required for the calculation of the C-LCC indicator, including Monte Carlo analysis, are carried out with the open-source software R [
37]. The life cycle assessment from which inventory data are from was performed using the SimaPro 8.3 software.
A ten-year reference period is chosen based on the price dynamics that characterize commodity markets: long-run trends (70 years or more), medium-term cycles (20–70 years) and short-term shocks [
38]. Market prices can be considered as a resource scarcity measure only if it is possible to separate the long-term trend from short-term oscillations which have little to do with resource abundance in Earth’s crust. Short-term shocks, more often, reflect demand or supply shocks like geopolitical crises. Popp et al. [
39] point out that the economic literature has often used long-term market prices (expressed in real terms) as a good measure of resource scarcity. Despite ten years is a period of time that can hardly be considered “long-term” it is chosen as a window for the calculation of reference prices because it is sufficiently long to mitigate the effect, on price levels, of short-term shocks but short enough to allow market operators’ expectations regarding the future availability of a given resource to emerge. Moreover, a too-long time series would not be the best choice to represent the scarcity of natural resources that become of great economic importance only recently, like, for example, many materials used to produce Li-Ion batteries. The underlying hypothesis is that economic agents have an information set that is sufficient to forecast, at least in the medium term, if a given resource can become less abundant due to its progressive extraction or more abundant thanks to technological progress.
Price uncertainty in the short and medium term is accounted for through Monte Carlo analysis.
Figure 1 shows data sources and the number of commodities per source used for the calculation of the C-LCC indicator for the case study.
3.2. Description of the Case Study
The C-LCC indicator is calculated for several batteries for stationary energy storage with the aim to show its potential and its limitations in quantifying the use of natural resources by a product during its life cycle. An uncertainty assessment of the results is carried out through Monte Carlo analysis.
The C-LCC indicator is calculated considering the production phase only, in two versions: per unity of mass (euro/kg) and per capacity (euro/kWh) of the batteries. A third, additional, version of the indicator was calculated, for a subset of 3 batteries, for the entire life cycle (therefore including also the use phase). In this case, the indicator is expressed in terms of released energy (euro/released kWh). In all cases, for the batteries for which data are available, the C-LCC indicator is calculated with and without the end-of-life phase, in which part of the materials used can be recovered and recycled.
The batteries considered in the case study belong to different chemistries and are listed in
Table 1.
The inclusion of Zebra and LMO batteries is for illustrative purposes only, since LMO batteries are no longer widely used and Zebra’s high working temperatures [
40] and the low number of cycles that is able to perform (about 1500) [
41] make a direct comparison with LFP and NMC batteries difficult [
42]. Inventory data for these two types of batteries are from Wernet et al. [
43].
The LCA inventory data containing the raw material flows for the other batteries used for the calculation of the C-LCC indicator are those used in Carvalho et al. [
44], which were defined starting from primary production data provided by a battery manufacturer, secondary data from the Ecoinvent database and the available literature [
45]. Carvalho et al. [
44] performed a LCA of Li-ion batteries (lithium–iron–phosphate (LFP), nickel–manganese–cobalt (NMC) 532, and NMC 622). The functional unit chosen in Carvalho et al. [
44] was equal to 1 kWh of energy released and all battery life impacts were considered according to a cradle-to-grave perspective: the extraction and processing of raw materials, battery production, battery transport, use phase, end of life phase, and possible material recovery. The following midpoint indicator characterization factors were taken from the ILCD 2011 Midpoint impact assessment method: climate change; acidification; eutrophication (terrestrial, freshwater, and marine); and mineral, fossil, and renewable resource depletion. The Ecoinvent cumulative energy demand (CED) method was considered for the assessment of renewable and non-renewable primary energy consumption.
More specifically, data regarding the LFP, NMC532 and NMC622 batteries are mainly primary, while those referring to the generic NMC211 MB and NMC111 Ellingsen batteries are from Majeau-Bettez et al. [
45] and Ellingsen et al. [
46] respectively. The former is also the main reference for building the inventory of the generic LFP MB battery.
4. Results
The following sub-sections illustrate the results of the case study, including a comparison between the C-LCC and the ReCiPe indicators and an additional version of the C-LCC calculated on the basis of the list of the European Union list of critical raw materials.
4.1. C-LCC Cradle to Gate Analysis
Figure 2 shows the values of the C-LCC indicator calculated for the batteries under study, expressed both per unity of mass (euro/kg) and battery capacity (euro/kWh).
In terms of unity of mass, the Zebra and the LMO batteries are those characterized by the smallest values of the C-LCC indicator (even though the latter does not consider the end-of-life, while the former does), while NMC batteries are those with the highest values, even though with substantial differences depending on the data source used (NMC batteries with primary data have higher values than NMC batteries which inventories were defined with values from the literature). LFP batteries lie in the middle. However, if the end-of-life is taken into account (and, with it, the possibility of recovering a significant fraction of materials), the C-LCC indicator of the NMC batteries (primary data) decreases by a great extent, becoming comparable with that of LFP batteries (without end-of-life). The C-LCC indicator decreases, if the end-of-life is accounted for, also in the case of the LFP (primary data) battery, but by a lesser extent.
The picture is somewhat similar looking at the C-LCC indicator calculated per battery capacity. Zebra and LMO batteries are still those characterized by the lowest values of the indicator, the NMC batteries those with the highest values and the LFP have an intermediate value. Also in this case, taking into account the end-of-life allows for a substantial reduction of the C-LCC indicator. The ordering of NMC and LFP batteries which inventories are defined with data from the literature, however, does change if the C-LCC indicator is computed per battery capacity instead than for unity of mass (i.e., the NMC Ellingsen battery becomes the one with the highest value of the indicator).
The NMC batteries are rich in cobalt-a highly valuable material, which demand has been increasing by a great deal in recent years-and therefore those that can benefit the most from the possibility of recovering part of the materials at the end-of-life.
4.2. C-LCC Indicator Calculated for the Entire Life Cycle
The C-LCC indicator is calculated-for the NMC and LFP batteries described using primary data-also considering the use phase (with and without the end-of-life) in a generic use scenario. To perform this exercise, it is assumed that the batteries can perform up to 5000 circles during their lifetime (data provided by the producer). The energy mix considered is the Italian one, updated to 2017, as defined by Gargiulo et al. [
47].
In this case, the results of the analysis are expressed in terms of energy released by the batteries during their life cycle (euro/kWh released). As it can be seen in
Table 2 and in
Figure 3, the LFP battery has a lower value of the C-LCC indicator than the NMC batteries, if the end-of-life is not considered. Conversely, when the end-of-life is considered, the NMC batteries become those with the lower values of the indicator, thanks to the fact that relatively large amounts of raw materials (especially cobalt) can be recovered. It must also be noted that the differences between LFP and NMC batteries decline significantly (around 10% in case the end-of-life is included).
4.3. Open-Data Results
An alternative version of the C-LCC indicator is calculated, replacing market prices from the restricted-access Refinitiv Datastream database [
33] with open access counterparts, namely price data from the World Bank and export unit values calculated from international trade data (Comtrade database [
34]). The results of this exercise, which are very similar to those of the baseline indicator, are available in the
Supplementary Materials (Section S4) alongside the alternative data sources (
Section S5) used for the 21 commodities which baseline price was identified in the Datastream database [
33].
4.4. Uncertainty Assessment with Monte Carlo Analysis
The calculation of the C-LCC indicator is characterized by a high level of uncertainty, being based on market prices (or export unit values), which are volatile by definition. For this reason, a probabilistic uncertainty analysis based on Monte Carlo simulation is carried out, in order to assess the stability of the results. Such assessment is needed also to counterbalance the fact that ten-year averages are used as reference prices for the C-LCC indicator, which can be diverted from their long-run trend by short-term shocks or medium-term cycles.
Since the probability distribution of each price series is unknown (and cannot be estimated with distribution fitting techniques, due to the lack of a sufficient number of observations for several commodities), it is assumed that all price series follow a triangular distribution. This kind of distribution is used, mainly in engineering, when the sample is too small and/or no information are available on the probability distributions of the variables under analysis [
48]. The parameters used to describe the triangular distributions, one for each commodity, are the minimum and maximum values (during the period 1995–2019) and the reference value used in the baseline analysis (average 2010–2019). One hundred thousand random values are generated for each of the commodities, which are used, in turn, to compute as many values of the C-LCC indicator, for each battery and for both the production phase only (per unity of mass and battery capacity) and the production and use phases (scenarios).
Given the high number of simulations, it is possible to use the empirical distribution function to calculate the probability that the C-LCC indicator is lower (higher) than the baseline value and the probability that the indicator defined for a certain type of battery is lower (higher) than the indicator calculated for another battery. In other words, the Monte Carlo analysis is useful to assess the stability of the baseline results and the robustness of the ordering of the alternatives (batteries, in the case study) based on the C-LCC values.
Figure 4 shows the simulation results.
In the case of the indicator calculated for the production phase only, the distribution of the simulation results tends to be more spread around the mode as the value of the indicator increases. This means that the baseline C-LCC indicator calculated for the NMC and, to some extent, the LFP batteries is less robust than the indicator calculated for the LMO and Zebra batteries. This phenomenon is observable for both the indicator calculated per unity of mass and battery capacity and it is due to two factors. The first refers to the different composition of the batteries and the second, strictly related to the first, to price volatility: raw materials used in the production of NMC and LFP batteries are characterized by a higher volatility than those employed in the production of the other types. Cobalt is the commodity which is responsible for the high variability of the indicator calculated for the NMC batteries, while, in the case of LFP batteries energy commodities (natural gas and crude oil) are those that affect variability the most. This is particularly evident when the end-of-life is accounted for: since most cobalt can be recovered, the variability of the C-LCC indicator calculated for the NMC batteries decreases by a great extent.
Also in the case of the C-LCC indicator calculated for both the phases of production and use (see
Figure 5), the variability of the indicator tends to be greater in the case of NMC batteries with respect to the LFP battery, even though such variability decreases significantly if the end-of-life is taken into account and therefore the recovery of highly priced raw materials like cobalt.
Figure 6 shows the probability-for the two versions of the C-LCC indicator-that the indicator is lower than the baseline values. In the case of the C-LCC indicator calculated for the production phase only (values are the same for the indicator calculated per unity of mass and battery capacity), the probability that the indicator falls below the baseline value is lower than 50% for NMC batteries (if the end-of-life is not taken into account), meaning that the baseline values are relatively “optimistic,” at least with respect to the other battery types, which are characterized by probabilities greater than 50%.
In the case of the C-LCC indicator calculated for both the production and use phases, the probabilities are higher than 50% for the LFP battery and the NMC batteries taking into account the end-of-life, meaning that the baseline values of the C-LCC index are relatively pessimistic.
The robustness of the ordering of the batteries based on the value of their C-LCC indicator has also been checked, starting from the simulation results, calculating the probability that the indicator calculated for a given battery, is lower or higher than that calculated for another one. The results, reported in detail in the
Supplementary Materials (Section S6) show that even taking into account price uncertainty, the ordering of the batteries based in the C-LCC indicator is very robust in all cases (production phase only and production and use phases). In other words, it is very unlikely that such ordering changes because of price volatility.
4.5. Comparison with the ReCiPe Mineral and Fossil Resource Depletion Indicators
The ReCiPe indicators Mineral and Fossil fuel depletion [
16] are calculated for every battery included in the case study for the production phase only, expressed both per unity of mass and battery capacity. Afterwards, the ReCiPe indicators are compared to the C-LCC indicator. To overcome the problems related to the fact that ReCiPe and C-LCC indicators are expressed in different measurement units, both indicators are normalized and expressed in a non-dimensional scale that ranges from 0 to 1 (0 corresponds to the lowest value and 1 to the highest).
Since ReCiPe and C-LCC indicators are calculated based on a different set of materials, the comparison is not straightforward. To reduce, to some extent, this problem, two new versions of the C-LCC are computed. The first is based on fossil raw materials only (peat, crude oil, natural gas, lignite and anthracite) and is compared to the ReCiPe Fossil Resource Depletion indicator. The second is based on non-fossil materials and is compared to the ReCiPe Mineral Resource Depletion indicator. In the first case (fossil resources), the commodity considered by the two indicators are the same, while in the second (mineral resources) they are not the same, though a certain overlap is present: 40 out of 96 materials included in the ReCiPe indicators are also present among the materials considered by the C-LCC indicator. A comparison between the commodities considered by the two indicators is provided in the
Supplementary Materials (Section S7).
Figure 7 shows the results of the comparison. The two indicators yield very similar results if they are calculated on the basis of the same set of commodities (fossil ones): the ordering of the batteries is almost the same for the C-LCC indicator (only fossil raw materials) and the ReCiPe Fossil Resource Depletion. The results change significantly when non-fossil raw materials are considered, especially in the case of NMC batteries (considering the end-of-life), LMO N and Zebra. These differences do not surprise since the materials considered by the two indicators are different, for example the C-LCC indicator considers both refined and raw materials such as mineral ore, while-by definition-the ReCiPe Mineral Resource Depletion indicator considers refined materials only. Nonetheless, the differences between the two indicators might arise also from how the two methods “weight” commodities: C-LCC indicators uses market price, while ReCiPe indicators extraction cost. For example, a given commodity could be characterized by a relatively low market price but also by high future extraction cost: this is the case of zinc, which ReCiPe Mineral Resource Depletion characterization factor is about 8.9 euro/kg despite an average (2010–2019) market price of about 2 euro/kg.
4.6. Critical Materials
In 2011, the European Commission identified a list (which was later expanded) of critical materials, essential under a strategic point of view for the European Union [
49]. Critical materials are used to produce a wide array of goods and applications and must be characterized by a concentrated or, potentially, uncertain supply. Examples are: antimony, which is mainly extracted in China (74% of world output) or lithium which is mainly extracted in Chile (44% of world output). Critical materials are usually employed to produce goods and devices with high technological content such as smart phones and personal computers and are also tightly linked to technologies for clean energy generation (i.e., photovoltaic). One of the principles at the basis of the concept of circular economy is the recovery and recycle of critical materials, not only for environmental reasons but also strategic ones. At the end of 2020 the list contained more than 30 materials and was updated already four times since 2011. The methodology used by the European Commission to define the critical materials list is available in Blengini et al. [
50].
Given the importance of critical raw materials to reach the EU’s objectives of sustainable development, an alternative version of the C-LCC indicator, based on such materials only, is developed and calculated for batteries for stationary storage. Since not all critical materials listed by the European Commission are used in the life cycle of the batteries, only a subset of them is used to compute the C-LCC indicator. The full list of critical raw materials as defined by the European Commission and those used to compute the indicator in this case study are available in the
Supplementary Materials (Section S8).
Looking at
Figure 8 it is possible to notice that NMC batteries are characterized by very high values of the C-LCC indicator of critical materials, while LMO and Zebra have very small values (zebra almost zero). This means that the former uses a high amount of critical materials, while the latter a much smaller one. The gap decreases considerably if the end-of-life is considered, since most of the cobalt (which is indeed a critical raw material) can be recovered.
When looking at the share of critical raw materials on the total value of the C-LCC indicator (
Figure 9, production phase only) it is possible to see a strong difference between NMC batteries and the others. In the case of NMC batteries, the share of critical raw materials is always greater than 20% (if the end-of-life is not taken onto account). Such percentages decline sharply if the end-of-life is considered and become comparable with those of LFP batteries, although still significantly higher than those of LMO and Zebra batteries. These results are in line with those of Santillán-Saldivar et al. [
30], who find that, for Li-Ion batteries, nickel and cobalt are the commodities most relevant in terms of socio-economic damages because of their price and supply risks, in absence of recycling.
It must be highlighted the fact that the two batteries characterized by the lowest values of the Raw Materials C-LCC indicator-LMO and Zebra-are also characterized by relatively high values of the ReCiPe Mineral Resource Depletion indicator, meaning that they use large amounts of raw materials which extraction today might jeopardize extraction tomorrow. Nonetheless, low values of the Raw Materials C-LCC indicator mean that these batteries do not use large quantities of materials which the European Commission considers critical. In other words, materials which supply is considered “secure” by the European Union can be characterized by high negative externalities in terms availability in the future at planetary level.
5. Discussion
The C-LCC indicator evaluates the consumption of natural resources starting from the physical amount of resources used during the life cycle (coming from LCA inventories) and the market prices of such resources. Market price is one of three scarcity measures, alongside extraction and user cost, that are usually found in the economic literature. Market price, however, incorporates information on both supply and demand for a particular good and it is generally considered, net of short- and medium-term fluctuations and inflation, as a good measure of current and future availability of a given commodity (at least in the medium-term).
This study also provides a case study, in which the proposed indicator, called Commodity-Life Cycle Costing (C-LCC) is calculated for several types of batteries for stationary storage. Energy Storage is indeed a key element for the transition towards a sustainable and renewable-based, energy system. In the case study, the indicator is calculated considering the production phase only (per unity of mass and battery capacity) and both the production and use phases. NMC batteries, in all cases, are those characterized by the highest values of the indicator because they use large quantities of rare, and therefore expensive, materials such as cobalt. If the end-of-life, and therefore the possibility of recovering some of the materials, is taken into account, the C-LCC indicator calculated for NMC batteries declines and becomes comparable with that of LFP batteries. The uncertainty assessment carried out with Monte Carlo analysis shows a good stability of the results.
An open-source version of the C-LCC indicator has also been calculated and compared to the baseline. The open-source indicator yields the same results of its baseline counterpart even though for some materials (rare earths and metals) the open source market price approximation (export unit values) does not approximate well real market price: this might represent a problem for those products or processes that make great use of such materials.
A comparison with the ReCiPe Mineral and Fossil Resource Depletion Indicators is also carried out. The ordering of the batteries (production phase only), according with the two fossil resource indicators is very similar, while it is significantly different when mineral resources are considered. This means that, if the same set of commodities is considered, the C-LCC and the ReCiPe indicators can yield similar results, even though this aspect should be investigated further.
The C-LCC and ReCiPe indicators can be though as complementary tools, which assess the consequences of resource consumption from different angles. ReCiPe indicators measure the negative externality associated with resource extraction using a data-intensive calculation procedure, while the C-LCC indicator measure resource scarcity through market prices, failing to account for externalities, but incorporating information from both demand and supply side in a relatively simple calculation method, which, through Monte Carlo analysis, can take into account price volatility in the medium-run. In the future, the objective will be to include externalities in the C-LCC indicator, considering land-use changes and water consumption and therefore the economic value associated with changes in ecosystem services provision.
Finally, an additional version of the C-LCC indicator, based on critical raw materials only, was computed for the batteries included in the case study. Also in this case, the NMC batteries are those characterized by the highest values of the indicator, meaning that their production uses a significant amount of critical materials. On the other hand, the critical raw materials indicator is very low for LMO and Zebra batteries. These are important information for policy makers since NMC batteries, those technologically more advanced and which will be extensively used in the future, are also those more exposed to supply risk. For this reason, it is important, under a European point of view, to increase the recycling of critical materials, in a circular economy framework, and develop trade agreement to reduce the supply risk.
6. Conclusions
This study proposes a novel methodology for the calculation of an economic indicator, based on LCC concepts, to be applied in the Life Cycle Assessment framework. Costs are treated like characterization factors, while the classification and characterization phases are carried out like in a conventional LCIA assessment.
The proposed indicator, that focuses on costs related to resource use only, is aimed at quantifying the consumption of natural resources by products during their life cycle. It is based on market prices, which incorporate information on scarcity from both the demand and supply sides, assuming that market agents have access on information regarding current and future availability, current and future demand, potential breakthrough technologies and recycling potential, at least in the medium run.
This economic approach, based on market prices, tackles the problem of impact evaluation of natural resource use from a different angle than most methods currently used in LCA analysis to accomplish this task, like ReCiPe’s mineral and fossil resource depletion indicators. The latter rely on concepts like the surplus cost potential, which imply strong assumptions regarding reserves, current and future extraction costs and technological advance. Being based on market prices only, the C-LCC can be easily calculated and updated, contrary to many other resource scarcity indicators, such as ReCiPe’s, that are based on restricted-access data on reserves or extraction costs, which are not always readily available and not often updated.
The study also provides an alternative version of the C-LCC indicator, based on the list of critical raw materials of the European Commission aimed at including also criticality issues in the LCA framework.
The main limitation of the C-LCC indicator is related to the fact that-being based on market prices–it does not consider negative externalities since market prices are not always adequate to spur a sustainable use of resources. This problem can be addressed in two ways. The first implies correcting market prices in a way that they reflect the social discount rate. This comes from the assumption that resource market prices, net of extraction costs, can be thought as a market rent or the net present value of the expected future revenue from extracting the resource. Such rent, however, should be corrected to take into account that market discount rate are generally significantly higher than social discount rates, as pointed out by Huppertz et al. [
18], since a higher discount rate implies lower prices and therefore an overexploitation of resources. The second solution entails to consider externalities explicitly, if they are not already internalized by market prices, in order to avoid an underestimation of the real impacts. We think that the second option is to be preferred because it does not require assumptions on the relative share of extraction costs on total market price or on future price elasticity of demand. Therefore, we aim at including estimates of externalities related to the extraction and use of natural resources in the calculation of the C-LCC indicator, especially those related to water use and land use changes, which in turn trigger changes in ecosystem service provision.


