
Keeping the Competitive Edge of a Convention and Exhibition Center in MICE Environment: Identification of Event Attributes for Long-Run Success


Abstract
:1. Introduction
2. Study Background
2.1. Impact of the MICE Industry
2.2. MICE Venues and Issues
2.3. MICE Attributes That Influence the Decision-Making Process
2.4. Study Purpose and Research Questions
3. Methodology
3.1. Data Collection and Measurement
3.2. Data Analysis
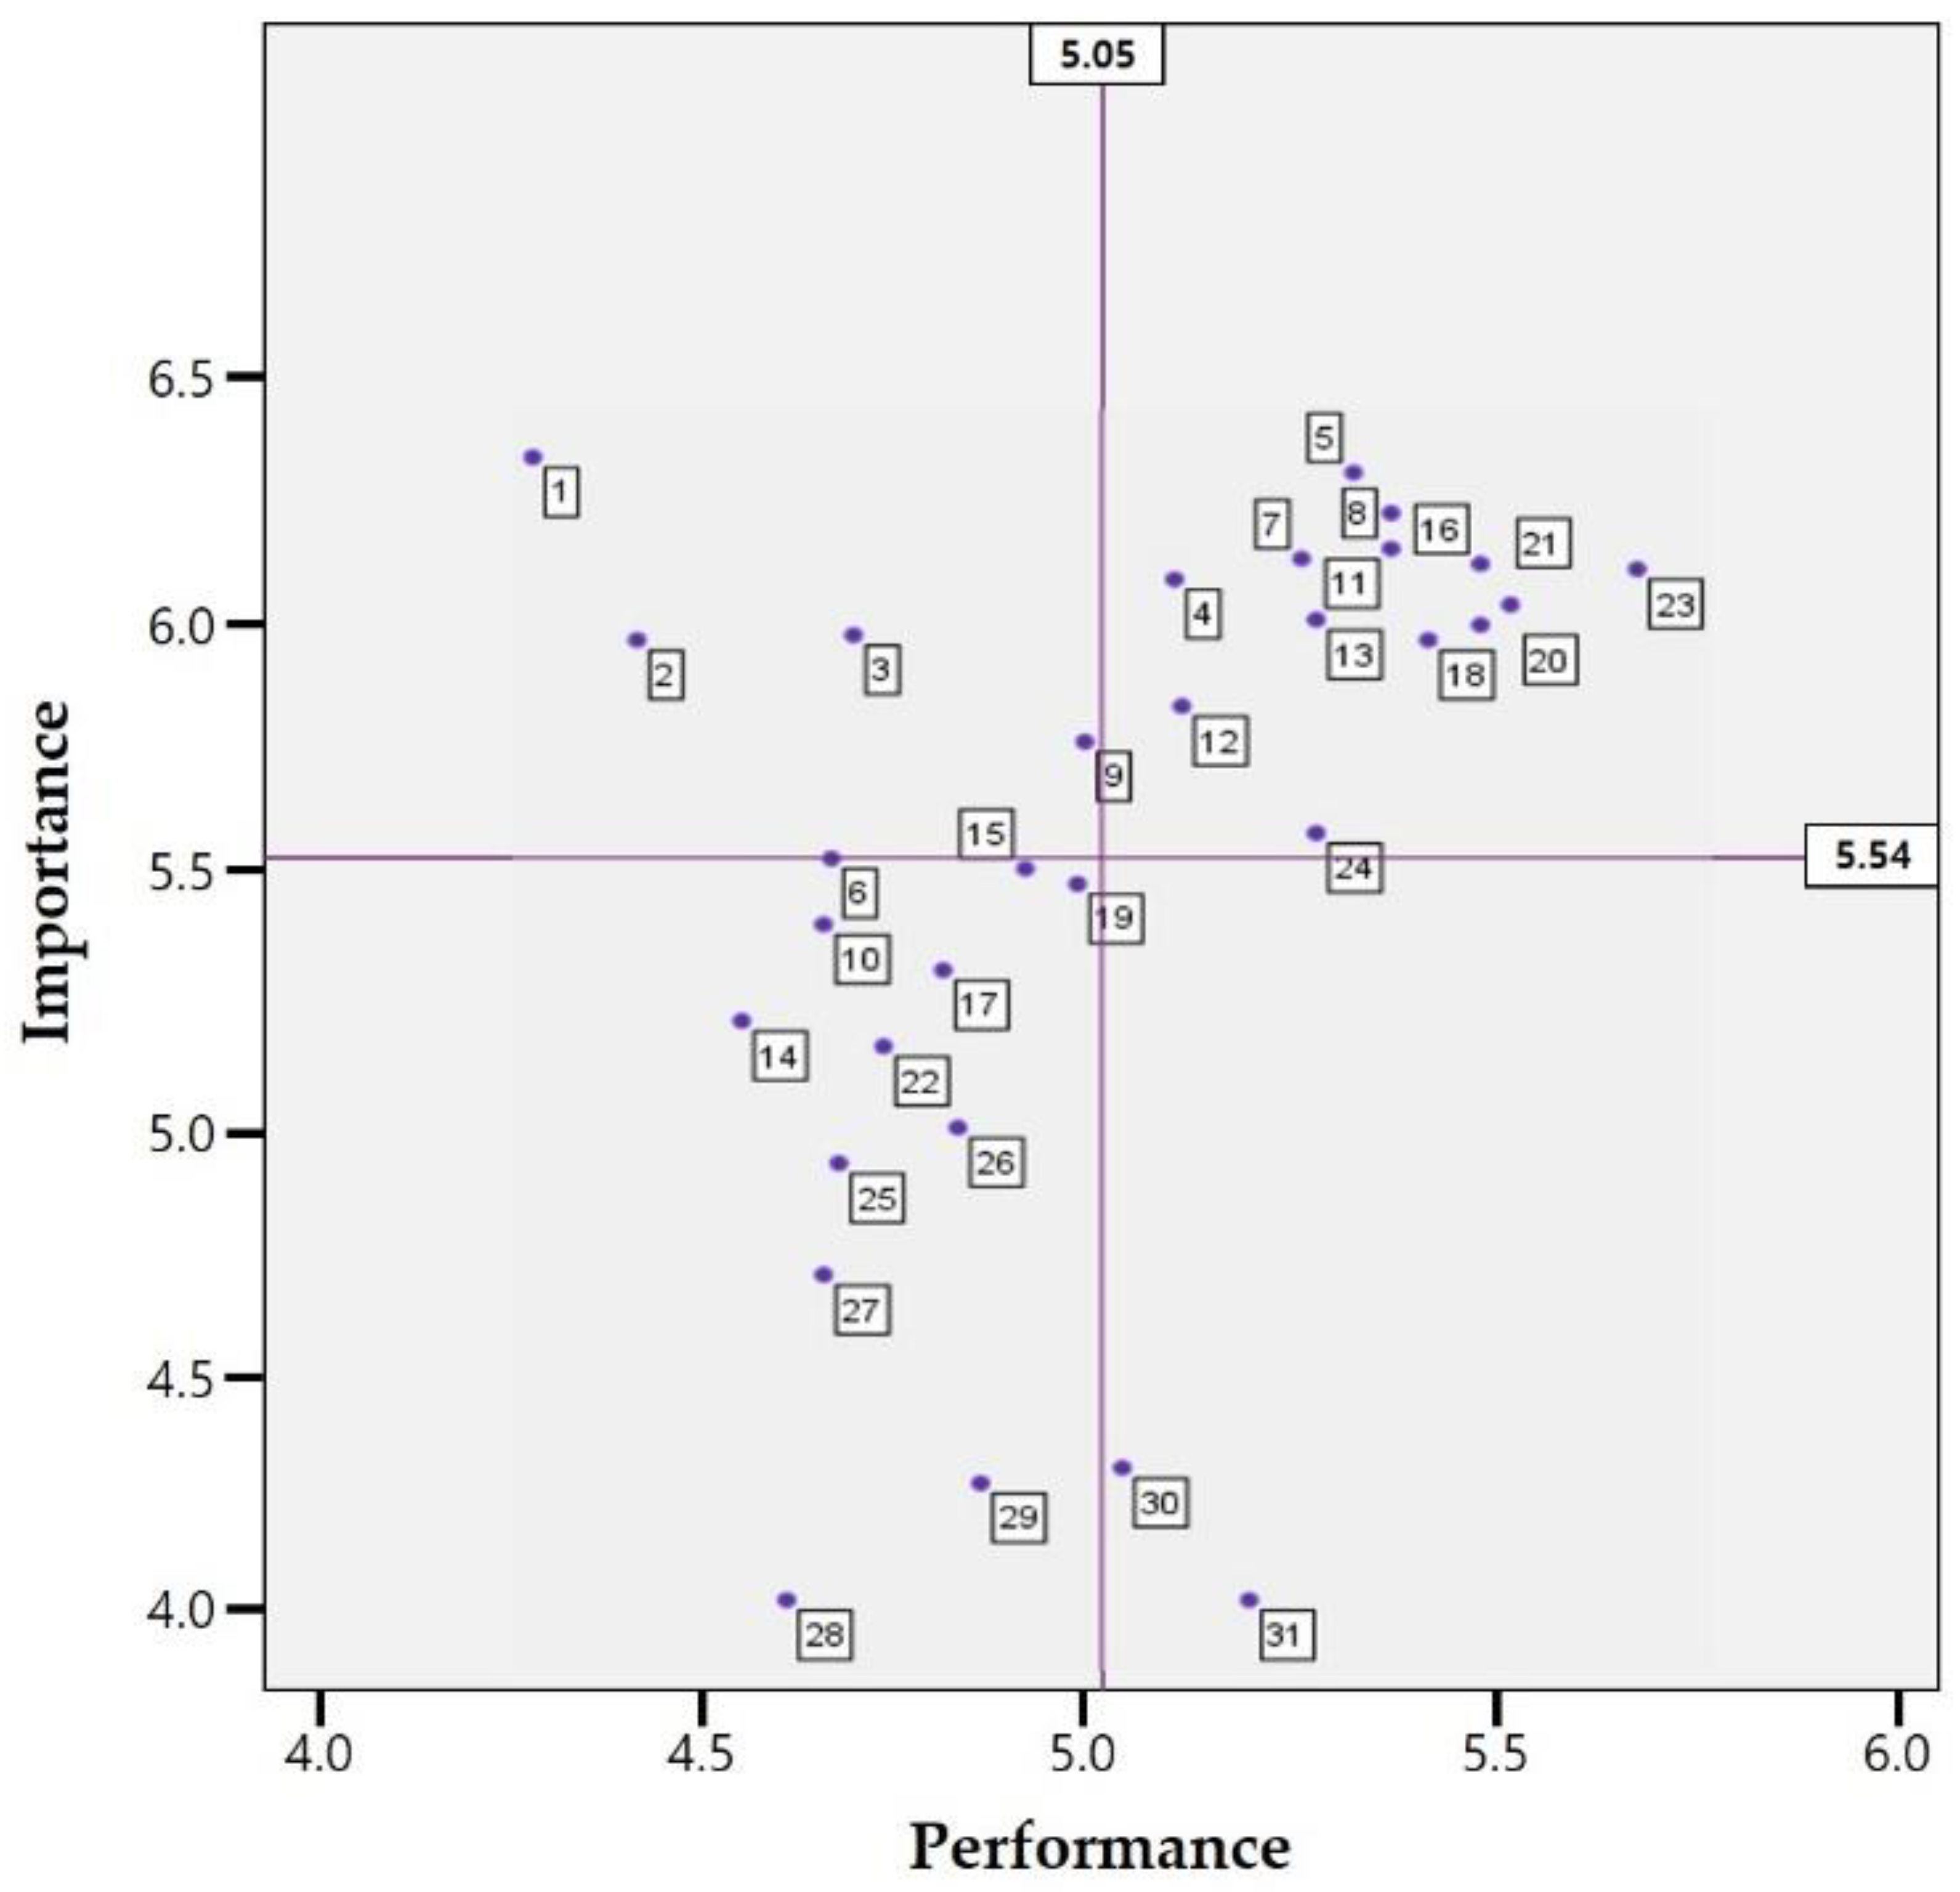
- Quadrant I (high performance/high importance) indicates the attributes that are major strengths and opportunities for gaining or maintaining a competitive advantage. The business strategy is “keep up the good work”;
- Quadrant II (low performance/high importance) indicates a major weakness and that immediate attention for improvement is required for this area. “Concentrate here” is suggested as a management scheme to address data points this quadrant;
- Attributes that appear in Quadrant III (low performance/low importance) can be considered minor weaknesses that do not require additional efforts to resolve. “Low priority” is the managerial directive here; and
- Quadrant IV (high performance/low importance) indicates over-emphasis, which can be considered a minor strength. Consequently, the resources in this quadrant should be deployed where they are needed. The management strategy is “possible overkill”.
4. Findings
4.1. Respondent Profiles
4.2. Results for Research Questions
4.2.1. Highly Valued Attributes as Related to Perceived Importance and Performance
4.2.2. Differences between Overall Importance and Performance
4.2.3. Differences in Importance among Different Types of Events
4.2.4. Differences in Performance among Different Types of Events
4.2.5. Differences in the Levels of Importance and Performance of the Venue Selection Attributes among the Six Different Types of Organizations
5. Discussion
5.1. Theoretical Contributions
5.2. Practical Implications
5.3. Limitations and Future Recommendations
Author Contributions
Funding
Institutional Review Board Statement
Informed Consent Statement
Data Availability Statement
Conflicts of Interest
References
- Alananzeh, O.; Al-Badarneh, M.; Al-Mkhadmeh, A.; Jawabreh, O. Factors influencing MICE tourism stakeholders’ decision making: The case of Aqaba in Jordan. J. Conv. Event Tour. 2019, 20, 24–43. [Google Scholar] [CrossRef]
- Clark, J.D.; McCleary, K.W. Influencing associations’ site-selection process. Cornell Hotel Restaur. Adm. Q. 1995, 36, 5–68. [Google Scholar] [CrossRef]
- Elston, K.; Draper, J. A Review of Meeting Planner Site Selection Criteria Research. J. Conv. Event Tour. 2012, 13, 203–220. [Google Scholar] [CrossRef]
- Fenich, G.G. Towards a conceptual framework for assessing community attractiveness for conventions. J. Conv. Exhib. Manag. 2001, 3, 45–64. [Google Scholar] [CrossRef]
- DiPietro, R.B.; Breiter, D.; Rompf, P.; Godlewska, M. An exploratory study of differences among meeting and exhibition planners in their destination selection criteria. J. Conv. Event Tour. 2008, 9, 258–276. [Google Scholar] [CrossRef] [Green Version]
- Montgomery, R.J.; Strick, S.K. Meetings, Conventions, and Expositions: An Introduction to the Industry; John and Wiley and Sons: Hoboken, NJ, USA, 1994; ISBN 978-0-471-28439-0. [Google Scholar]
- Vogt, C.A.; Roehl, W.S.; Fesenmaier, D.R. Understanding planners’ use of meeting facility information. Hosp. Res. J. 1994, 17, 119–130. [Google Scholar] [CrossRef]
- Wu, A.; Weber, K. Convention center facilities, attributes and services: The delegates’ perspective. Asia Pac. J. Tour. Res. 2005, 10, 399–410. [Google Scholar] [CrossRef]
- UNWTO UNWTO and IFC Partner to Facilitate Green Investments for Tourism’s Sustainable Future. Available online: https://www.unwto.org/news/unwto-and-ifc-partner-to-facilitate-green-investments-for-tourisms-sustainable-future (accessed on 2 April 2021).
- UNWTO. Tourism and the Sustainable Development Goals–Good Practices in the Americas; World Tourism Organization: Madrid, Spain, 2018; ISBN 9789284419685. [Google Scholar]
- UNEP and UNWTO. Making Tourism More Sustainable-A Guide for Policy Makers; 2005 (In English). Available online: https://wedocs.unep.org/bitstream/handle/20.500.11822/8741/-Making%20Tourism%20More%20Sustainable_%20A%20Guide%20for%20Policy%20Makers-2005445.pdf?sequence=3&isAllowed=y (accessed on 26 May 2015).
- Buathong, K.; Lai, P.C. Perceived attributes of event sustainability in the MICE industry in Thailand: A viewpoint from governmental, academic, venue and practitioner. Sustainability 2017, 9, 1151. [Google Scholar] [CrossRef] [Green Version]
- Kim, K.; Ko, D. How to Build a Sustainable MICE Environment Based on Social Identity Theory. Sustainability 2020, 12, 7166. [Google Scholar] [CrossRef]
- International Congress and Convention Association the International Association Meetings Market 2019. Available online: https://www.iccaworld.org/knowledge/article.cfm?artid=701 (accessed on 2 April 2021).
- UFI UFI. World Map of Exhibition Vunues (2017 Edition, Revised December 2018). Available online: https://www.ufi.org/archive-research/ufi-world-map-of-exhibition-venues-2017-edition-revised-december-2018/ (accessed on 7 September 2020).
- Tolkach, D.; King, B. Strengthening Community-Based Tourism in a new resource-based island nation: Why and how? Tour. Manag. 2015, 48, 386–398. [Google Scholar] [CrossRef]
- Joun, H.-J.; Kim, H. Productivity Evaluation of Tourism and Culture for Sustainable Economic Development: Analyzing South Korea’s Metropolitan Regions. Sustainability 2020, 12, 2912. [Google Scholar] [CrossRef] [Green Version]
- Ahn, Y.J.; Kim, I.; Lee, T.J. Exploring visitor brand citizenship behavior: The case of the ‘MICE city Busan’, South Korea. J. Destin. Mark. Manag. 2016, 5, 249–259. [Google Scholar] [CrossRef]
- Allen, J.; O’toole, W.; Harris, R.; McDonnell, I. Festival and Special Event Management, 5th ed.; Wiley& Sons: Hoboken, NJ, USA, 2010. [Google Scholar]
- Davidson, R.; Cope, B. Business Travel: Conferences, Incentive Travel, Exhibitions, Corporate Hospitality and Corporate Travel; Pearson Education: London, UK, 2003; ISBN 0582404444. [Google Scholar]
- Chen, H.C.; Chiou, C.Y.; Yeh, C.Y.; Lai, H.L. A study of the enhancement of service quality and satisfaction by Taiwan MICE service project. Procedia Soc. Behav. Sci. 2012, 40, 382–388. [Google Scholar] [CrossRef] [Green Version]
- Lee, C.-K.; Lee, M.; Yoon, S.-H. Estimating the economic impact of convention and exhibition businesses, using a regional input–output model: A case study of the Daejeon Convention Center in South Korea. Asia Pac. J. Tour. Res. 2013, 18, 330–353. [Google Scholar] [CrossRef]
- Braun, B.M. The economic contribution of conventions: The case of Orlando, Florida. J. Travel Res. 1992, 30, 32–37. [Google Scholar] [CrossRef]
- Kim, S.S.; Chon, K. An economic impact analysis of the Korean exhibition industry. Int. J. Tour. Res. 2009, 11, 311–318. [Google Scholar] [CrossRef]
- Kim, S.S.; Chon, K.; Chung, K.Y. Convention industry in South Korea: An economic impact analysis. Tour. Manag. 2003, 24, 533–541. [Google Scholar] [CrossRef]
- Mistilis, N.; Dwyer, L. Tourism gateways and regional economies: The distributional impacts of MICE. Int. J. Tour. Res. 1999, 1, 441–457. [Google Scholar] [CrossRef]
- Pinho, M.; Marques, J. The bleisure tourism trend and the potential for this business-leisure symbiosis in Porto. J. Conv. Event Tour. 2021, 1–16. [Google Scholar] [CrossRef]
- Kay, A.L.K. China’s convention and exhibition center boom. J. Conv. Event Tour. 2005, 7, 5–22. [Google Scholar] [CrossRef]
- Crouch, G.I.; Del Chiappa, G.; Perdue, R.R. International convention tourism: A choice modelling experiment of host city competition. Tour. Manag. 2019, 71, 530–542. [Google Scholar] [CrossRef]
- Sanders, H.T. Convention mythology. J. Conv. Event Tour. 2005, 6, 99–143. [Google Scholar] [CrossRef]
- Carlsen, J. Issues in dedicated convention center development with a case study of the Perth Convention and Exhibition Center, Western Australia. J. Conv. Event Tour. 2005, 6, 45–61. [Google Scholar] [CrossRef]
- Fenich, G.G. Convention center ownership and management: The case of the United States. In Convention Tourism: International Research and Industry Perspectives; Haworth Hospitality Press: New York, NY, USA, 2002; pp. 139–154. [Google Scholar]
- Jo, D.; Park, H.; Choe, Y.; Kim, D. Destination-selection attributes for international association meetings: A mixed-methods study. J. Destin. Mark. Manag. 2019, 13, 61–72. [Google Scholar] [CrossRef]
- Whitfield, J.; Webber, D.J. Which exhibition attributes create repeat visitation? Int. J. Hosp. Manag. 2011, 30, 439–447. [Google Scholar] [CrossRef]
- Jago, L.K.; Deery, M.; Jago, L.K.; Deery, M. Relationships and Factors Influencing Convention Relationships and Factors Influencing Convention Decision-Making. J. Conv. Exhib. Manag. 2008, 0148. [Google Scholar] [CrossRef]
- Lee, H.; Lee, J. An exploratory study of factors that exhibition organizers look for when selecting convention and exhibition centers selecting convention and exhibition centers. J. Travel Tour. Mark. 2017, 34, 1001–1017. [Google Scholar] [CrossRef]
- Siu, N.Y.; Yim, P.; Wan, K.; Dong, P. The impact of the servicescape on the desire to stay in convention and exhibition centers: The case of Macao. Int. J. Hosp. Manag. 2012, 31, 236–246. [Google Scholar] [CrossRef]
- Weber, K.; Chon, K.-S. Convention Tourism: International Research and Industry Perspectives; Psychology Press: Hove, UK, 2002; ISBN 0789012847. [Google Scholar]
- Fenich, G.G.; Bordelon, B.M. Is there an optimal type of ownership and organizational structure when developing convention and entertainment facilities? J. Conv. Event Tour. 2008, 9, 182–198. [Google Scholar] [CrossRef]
- MalekMohammadi, A.; Mohamed, B. Convention decision-making modeling. Int. J. Trade Econ. Financ. 2010, 1, 54–56. [Google Scholar] [CrossRef] [Green Version]
- Nelson, R.; Rys, S. Convention site selection criteria relevant to secondary convention destinations. J. Conv. Exhib. Manag. 2000, 2, 71–82. [Google Scholar] [CrossRef]
- Oppermann, M.; Chon, K.-S. Convention participation decision-making process. Ann. Tour. Res. 1997, 24, 178–191. [Google Scholar] [CrossRef]
- Zhang, H.Q.; Leung, V.; Qu, H. A refined model of factors affecting convention participation decision-making. Tour. Manag. 2007, 28, 1123–1127. [Google Scholar] [CrossRef]
- Breiter, D.; Milman, A. Attendees’ needs and service priorities in a large convention center: Application of the importance–performance theory. Tour. Manag. 2006, 27, 1364–1370. [Google Scholar] [CrossRef]
- Hultsman, W. From the eyes of an exhibitor: Characteristics that make exhibitions a success for all stakeholders. J. Conv. Exhib. Manag. 2001, 3, 27–44. [Google Scholar] [CrossRef]
- Jin, X.; Bauer, T.; Weber, K. China’s second-tier cities as exhibition destinations. Int. J. Contemp. Hosp. Manag. 2010, 22, 552–571. [Google Scholar] [CrossRef]
- Oberoi, U.; Hales, C. Assessing the quality of the conference hotel service product: Towards an empirically based model. Serv. Ind. J. 1990, 10, 700–721. [Google Scholar] [CrossRef]
- Oppermann, M. Convention destination images: Analysis of association meeting planners’ perceptions. Tour. Manag. 1996, 17, 175–182. [Google Scholar] [CrossRef]
- Renaghan, L.M.; Kay, M.Z. What meeting planners want: The conjoint-analysis approach. Cornell Hotel Restaur. Adm. Q. 1987, 28, 66–76. [Google Scholar] [CrossRef]
- Hinkin, T.R.; Tracey, J.B. The Service Imperative: Factors Driving Meeting Effectiveness: More than any other factor, service drives satisfaction ratings for meeting participants. Cornell Hotel Restaur. Adm. Q. 2003, 44, 17–26. [Google Scholar] [CrossRef] [Green Version]
- Comas, M.; Moscardo, G. Understanding associations and their conference decision-making processes. J. Conv. Exhib. Manag. 2005, 7, 117–138. [Google Scholar] [CrossRef]
- Crouch, G.I.; Brent Ritchie, J.R. Convention site selection research: A review, conceptual model, and propositional framework. J. Conv. Exhib. Manag. 1997, 1, 49–69. [Google Scholar] [CrossRef]
- Go, F.; Zhang, W. Applying importance-performance analysis to Beijing as an international meeting destination. J. Travel Res. 1997, 35, 42–49. [Google Scholar] [CrossRef]
- Draper, J.; Dawson, M.; Casey, E. An exploratory study of the importance of sustainable practices in the meeting and convention site selection process. J. Conv. Exhib. Manag. 2011, 12, 153–178. [Google Scholar] [CrossRef]
- Azzopardi, E.R. Nash A critical evaluation of importance–performance analysis. Tour. Manag. 2013, 35, 222–333. [Google Scholar] [CrossRef]
- Oh, H. Revisiting importance–performance analysis. Tour. Manag. 2001, 22, 617–627. [Google Scholar] [CrossRef]
- Martilla, J.A.; James, J.C. Importance-performance analysis. J. Mark. 1977, 41, 77–79. [Google Scholar] [CrossRef]
- Wu, H.-H.; Shieh, J.-I. The development of a confidence interval-based importance–performance analysis by considering variability in analyzing service quality. Expert Syst. Appl. 2009, 36, 7040–7044. [Google Scholar] [CrossRef]
- Hair, J.; Black, W.C.; Babin, B.J.; Anderson, R.E. Multivariate Data Analysis: A Global Perspective, 7th ed.; Pearson Education Limited: London, UK, 2009. [Google Scholar]
- Robinson, L.S.; Callan, R.J. UK conference delegates’ cognizance of the importance of venue selection attributes. J. Conv. Exhib. Manag. 2005, 7, 77–95. [Google Scholar] [CrossRef]
- UNWTO TOURISM 4 SDGs. Available online: https://www.unwto.org/tourism4sdgs (accessed on 2 April 2021).


| First E-Mail Request | Reminder | ||
|---|---|---|---|
| Distribution | Total e-mail account | 657 (100%) | 666 (100%) |
| Delivered | 567 (86%) | 574 (86%) | |
| Error | 90 (14%) | 92 (14%) | |
| Opened | 334 (51%) | 283 (42%) | |
| Number | % | ||
| Collection | Response | 121 | 18% |
| Usable | 93 | 14% | |
| Invalid | 28 | 4% |
| Importance | Performance | |||
|---|---|---|---|---|
| Number of Items | Cronbach’s Alpha | Number of Items | Cronbach’s Alpha | |
| Venue and facility-related attributes | 17 | 0.914 | 17 | 0.952 |
| Staff and service | 6 | 0.869 | 6 | 0.889 |
| Cost and other general attributes | 8 | 0.882 | 8 | 0.905 |
| Organization Type (No. of Respondents) | Exhibition | Meeting and Conference | Other Event |
|---|---|---|---|
| Professional exhibition organizer (14) | 14 (56%) | 0 (0.0%) | 0 (0.0%) |
| Professional conference organizer (4) | 0 (0.0%) | 4 (7.3%) | 0 (0.0%) |
| Association (20) | 5 (20%) | 12 (21.8%) | 3 (23.1%) |
| Governmental organization (11) | 3 (12%) | 7 (12.7%) | 1 (7.7%) |
| General company (33) | 2 (8%) | 24 (43.6%) | 7 (53.8%) |
| Others (11) | 1 (4%) | 8 (14.5%) | 2 (15.4%) |
| Total (93) | 25 (26.9%) | 55 (59.1%) | 13 (14%) |
| Organization Type | Specification |
|---|---|
| Professional exhibition organizer (14) | A company that specializes in the organizing and managing of exhibitions, trade shows, and similar events |
| Professional conference organizer (4) | A company that specializes in the organizing and managing of congresses, conferences, seminars, and similar events |
| Association (20) | An official group of people who have the same job, aim, or interest |
| Governmental organization (11) | Official government organizations and institutions |
| General company (33) | A company such as manufacturers, retailers, etc. |
| Other (11) (Open-ended) | Educational institution (3), publishing company (2), research institute, political party, advertising agency, broadcasting company, newspaper, language school |
| Variables | Number of Respondents | Percent (%) | |
|---|---|---|---|
| Gender | Male | 60 | 64.5 |
| Female | 33 | 35.5 | |
| Age group | 20–29 years old | 16 | 17.2 |
| 30–39 years old | 48 | 51.6 | |
| 40–49 years old | 17 | 18.3 | |
| 50 or older than 50 | 12 | 12.9 | |
| City working in | Capital area (except Seoul) | 10 | 10.8 |
| Seoul | 40 | 43.0 | |
| Busan or Kyongnam | 37 | 39.8 | |
| Other regions | 6 | 6.5 | |
| Work experience | Less than 1 year | 10 | 10.8 |
| 1–3 years | 26 | 28.0 | |
| 4–7 years | 27 | 29.0 | |
| 8–10 years | 10 | 10.8 | |
| More than 10 years | 20 | 21.5 | |
| Attributes | Level of Importance | Level of Performance | Mean Difference | t-Test | |||
|---|---|---|---|---|---|---|---|
| Mean (I) | Std | Mean (P) | Std | (I)–(P) | t-Value | Sig. (2-Tailed) | |
| Reasonable rent | 6.33 | 0.98 | 4.29 | 1.52 | 2.043 | 11.100 | 0.000 |
| Overall cost | 5.97 | 1.15 | 4.43 | 1.38 | 1.538 | 8.940 | 0.000 |
| Service quality offered by contractors | 5.98 | 1.22 | 4.72 | 1.45 | 1.258 | 7.165 | 0.000 |
| Sound insulation and lighting systems | 6.09 | 0.99 | 5.15 | 1.27 | 0.935 | 6.807 | 0.000 |
| Competence and responsiveness of staff | 6.30 | 1.06 | 5.39 | 1.29 | 0.914 | 6.656 | 0.000 |
| Proximity of the venue to local food service facilities | 5.54 | 1.45 | 4.69 | 1.43 | 0.849 | 4.991 | 0.000 |
| Heating and air-conditioning systems | 6.13 | 0.97 | 5.32 | 1.30 | 0.806 | 5.816 | 0.000 |
| Accessibility and easy use of public transport | 6.22 | 1.06 | 5.44 | 1.26 | 0.774 | 5.692 | 0.000 |
| Wire(less) Internet access | 5.77 | 1.25 | 5.03 | 1.48 | 0.742 | 4.377 | 0.000 |
| Financial and administrative support from local authority and CVB | 5.41 | 1.57 | 4.68 | 1.30 | 0.731 | 3.929 | 0.000 |
| Friendly staff | 6.15 | 1.04 | 5.44 | 1.35 | 0.710 | 4.932 | 0.000 |
| Visibility and accuracy of directional signage | 5.84 | 1.11 | 5.16 | 1.13 | 0.677 | 5.145 | 0.000 |
| Adequacy of the venue’s public space and circulation area | 6.01 | 1.02 | 5.34 | 1.20 | 0.667 | 4.693 | 0.000 |
| Various choices of food on-site | 5.22 | 1.44 | 4.57 | 1.46 | 0.645 | 3.289 | 0.001 |
| State-of-the-art audio-visual equipment | 5.52 | 1.23 | 4.95 | 1.37 | 0.570 | 3.426 | 0.001 |
| Number, size, and quality of meeting room | 6.12 | 1.16 | 5.56 | 1.18 | 0.559 | 4.027 | 0.000 |
| Proximity of the venue to accommodation facilities available | 5.32 | 1.56 | 4.84 | 1.35 | 0.484 | 2.847 | 0.005 |
| Reputation and image of the venue | 5.97 | 1.12 | 5.49 | 1.15 | 0.473 | 3.632 | 0.000 |
| Safety and security | 5.49 | 1.37 | 5.02 | 1.23 | 0.473 | 3.149 | 0.002 |
| Accessibility and availability of parking | 6.00 | 1.02 | 5.56 | 1.18 | 0.441 | 3.435 | 0.001 |
| Size and quality of exhibition facility | 6.04 | 1.20 | 5.60 | 1.16 | 0.441 | 3.138 | 0.002 |
| Quality of catering service | 5.17 | 1.40 | 4.76 | 1.24 | 0.409 | 2.739 | 0.007 |
| Cleanliness and well-maintained facility | 6.11 | 0.98 | 5.77 | 1.04 | 0.333 | 3.312 | 0.001 |
| Overall design and interior of facility | 5.59 | 1.06 | 5.34 | 1.26 | 0.247 | 1.699 | 0.093 |
| Ecofriendly venue | 4.94 | 1.30 | 4.70 | 1.27 | 0.237 | 1.618 | 0.109 |
| Loading dock accessibility | 5.01 | 1.68 | 4.86 | 1.29 | 0.151 | 0.818 | 0.416 |
| Availability of facilities for disabled access | 4.72 | 1.53 | 4.68 | 1.25 | 0.043 | 0.252 | 0.802 |
| Simultaneous interpretation system | 4.08 | 1.75 | 4.63 | 1.23 | −0.559 | −3.012 | 0.003 |
| Language ability of staff | 4.31 | 1.66 | 4.89 | 1.17 | −0.581 | −3.253 | 0.002 |
| Attractions and entertainment opportunities | 4.34 | 1.69 | 5.08 | 1.31 | −0.731 | −4.208 | 0.000 |
| Shopping opportunities and accessibility to shopping area | 4.08 | 1.63 | 5.25 | 1.22 | −1.172 | −7.068 | 0.000 |
| Attributes | Exhibition | Meeting and Conference | Other Event | ANOVA | ||||
|---|---|---|---|---|---|---|---|---|
| Mean | Std. | Mean | Std. | Mean | Std. | F | Sig. | |
| Loading dock accessibility | 6.04 | 1.369 | 4.69 | 1.698 | 4.38 | 1.325 | 7.549 | 0.001 |
| Number, size, and quality of meeting room | 5.52 | 1.584 | 6.44 | 0.788 | 5.92 | 1.115 | 6.214 | 0.003 |
| Shopping opportunities and accessibility to shopping areas | 4.88 | 1.364 | 3.85 | 1.682 | 3.46 | 1.391 | 4.846 | 0.010 |
| Reputation and image of the venue | 6.08 | 1.288 | 6.09 | 0.948 | 5.23 | 1.235 | 3.463 | 0.036 |
| Attributes | Exhibition | Meeting and Conference | Other Event | ANOVA | ||||
|---|---|---|---|---|---|---|---|---|
| Mean | Std. | Mean | Std. | Mean | Std. | F | Sig. | |
| Service quality offered by contractors | 3.84 | 1.573 | 5.13 | 1.277 | 4.69 | 1.251 | 7.713 | 0.001 |
| Overall design and interior of facility | 4.60 | 1.528 | 5.64 | 1.095 | 5.54 | 0.776 | 6.693 | 0.002 |
| Heating and air-conditioning systems | 4.68 | 1.492 | 5.67 | 1.106 | 5.08 | 1.188 | 5.886 | 0.004 |
| Competence and responsiveness of staff | 4.72 | 1.370 | 5.64 | 1.223 | 5.62 | 1.044 | 4.933 | 0.009 |
| Wire(less) internet access | 4.32 | 1.547 | 5.38 | 1.340 | 4.92 | 1.498 | 4.853 | 0.010 |
| Sound insulation and lighting systems | 4.60 | 1.323 | 5.45 | 1.152 | 4.92 | 1.320 | 4.459 | 0.014 |
| Adequacy of the venue’s public space and circulation area | 4.76 | 1.422 | 5.58 | 1.083 | 5.46 | 0.877 | 4.388 | 0.015 |
| Number, size, and quality of meeting rooms | 5.00 | 1.354 | 5.80 | 1.061 | 5.62 | 1.044 | 4.218 | 0.018 |
| State-of-the-art audio-visual equipment | 4.36 | 1.381 | 5.25 | 1.336 | 4.77 | 1.166 | 4.039 | 0.021 |
| Cleanliness and well-maintained facility | 5.36 | 1.350 | 5.98 | 0.913 | 5.69 | 0.630 | 3.247 | 0.043 |
| Accessibility and availability of parking | 5.08 | 1.525 | 5.78 | 0.994 | 5.54 | 0.967 | 3.165 | 0.047 |
| Attributes | Mean | ANOVA | ||||||
|---|---|---|---|---|---|---|---|---|
| Exh. Org. | Conf. Org. | Assoc. | Gov. Org. | General Company | Others | F | Sig. | |
| Number, size, and quality of meeting room | 5.07 | 6.75 | 6.25 | 6.36 | 6.21 | 6.45 | 3.253 | 0.010 |
| Attractions and entertainment opportunities | 5.07 | 4.75 | 4.80 | 4.00 | 3.58 | 5.09 | 3.042 | 0.014 |
| Shopping opportunities and accessibility to shopping areas | 4.86 | 4.50 | 4.40 | 3.91 | 3.39 | 4.55 | 2.383 | 0.045 |
| Attributes | Mean | ANOVA | ||||||
|---|---|---|---|---|---|---|---|---|
| Exh. Org. | Conf. Org. | Assoc. | Gov. Org. | General Company | Others | F | Sig. | |
| Reasonable rent | 3.71 | 2.50 | 3.85 | 4.64 | 4.61 | 5.18 | 3.383 | 0.008 |
| State-of-the-art audio-visual equipment | 4.36 | 4.00 | 4.55 | 5.00 | 5.24 | 5.82 | 2.655 | 0.028 |
| Overall cost | 4.07 | 2.75 | 4.10 | 4.82 | 4.58 | 5.27 | 2.964 | 0.016 |
| Service quality offered by contractors | 3.64 | 3.75 | 5.00 | 4.82 | 4.76 | 5.73 | 3.536 | 0.006 |
| Overall design and interior of facility | 4.64 | 4.75 | 5.25 | 5.00 | 5.64 | 6.09 | 2.541 | 0.034 |
| Heating and air-conditioning systems | 4.64 | 4.00 | 5.15 | 5.18 | 5.79 | 5.73 | 3.083 | 0.013 |
| Accessibility and availability of parking | 4.64 | 4.75 | 5.70 | 6.00 | 5.70 | 5.91 | 2.986 | 0.016 |
| Wire(less) internet access | 4.21 | 3.25 | 5.10 | 4.82 | 5.30 | 6.00 | 3.720 | 0.004 |
| Loading dock accessibility | 4.71 | 4.25 | 4.15 | 4.82 | 5.21 | 5.55 | 2.787 | 0.022 |
Publisher’s Note: MDPI stays neutral with regard to jurisdictional claims in published maps and institutional affiliations. |
© 2021 by the authors. Licensee MDPI, Basel, Switzerland. This article is an open access article distributed under the terms and conditions of the Creative Commons Attribution (CC BY) license (https://creativecommons.org/licenses/by/4.0/).
Share and Cite
An, J.; Kim, H.; Hur, D. Keeping the Competitive Edge of a Convention and Exhibition Center in MICE Environment: Identification of Event Attributes for Long-Run Success. Sustainability 2021, 13, 5030. https://doi.org/10.3390/su13095030
An J, Kim H, Hur D. Keeping the Competitive Edge of a Convention and Exhibition Center in MICE Environment: Identification of Event Attributes for Long-Run Success. Sustainability. 2021; 13(9):5030. https://doi.org/10.3390/su13095030
Chicago/Turabian StyleAn, Jaeyoung, Hany Kim, and Dongkeun Hur. 2021. "Keeping the Competitive Edge of a Convention and Exhibition Center in MICE Environment: Identification of Event Attributes for Long-Run Success" Sustainability 13, no. 9: 5030. https://doi.org/10.3390/su13095030
APA StyleAn, J., Kim, H., & Hur, D. (2021). Keeping the Competitive Edge of a Convention and Exhibition Center in MICE Environment: Identification of Event Attributes for Long-Run Success. Sustainability, 13(9), 5030. https://doi.org/10.3390/su13095030