
Evaluation of Rapid Exit Locations Based on Veer-Off Risk for Landing Aircraft

Abstract
:1. Introduction
2. Background and Literature Review
2.1. Aircraft Accidents
2.2. Excursion Risk Analysis Studies
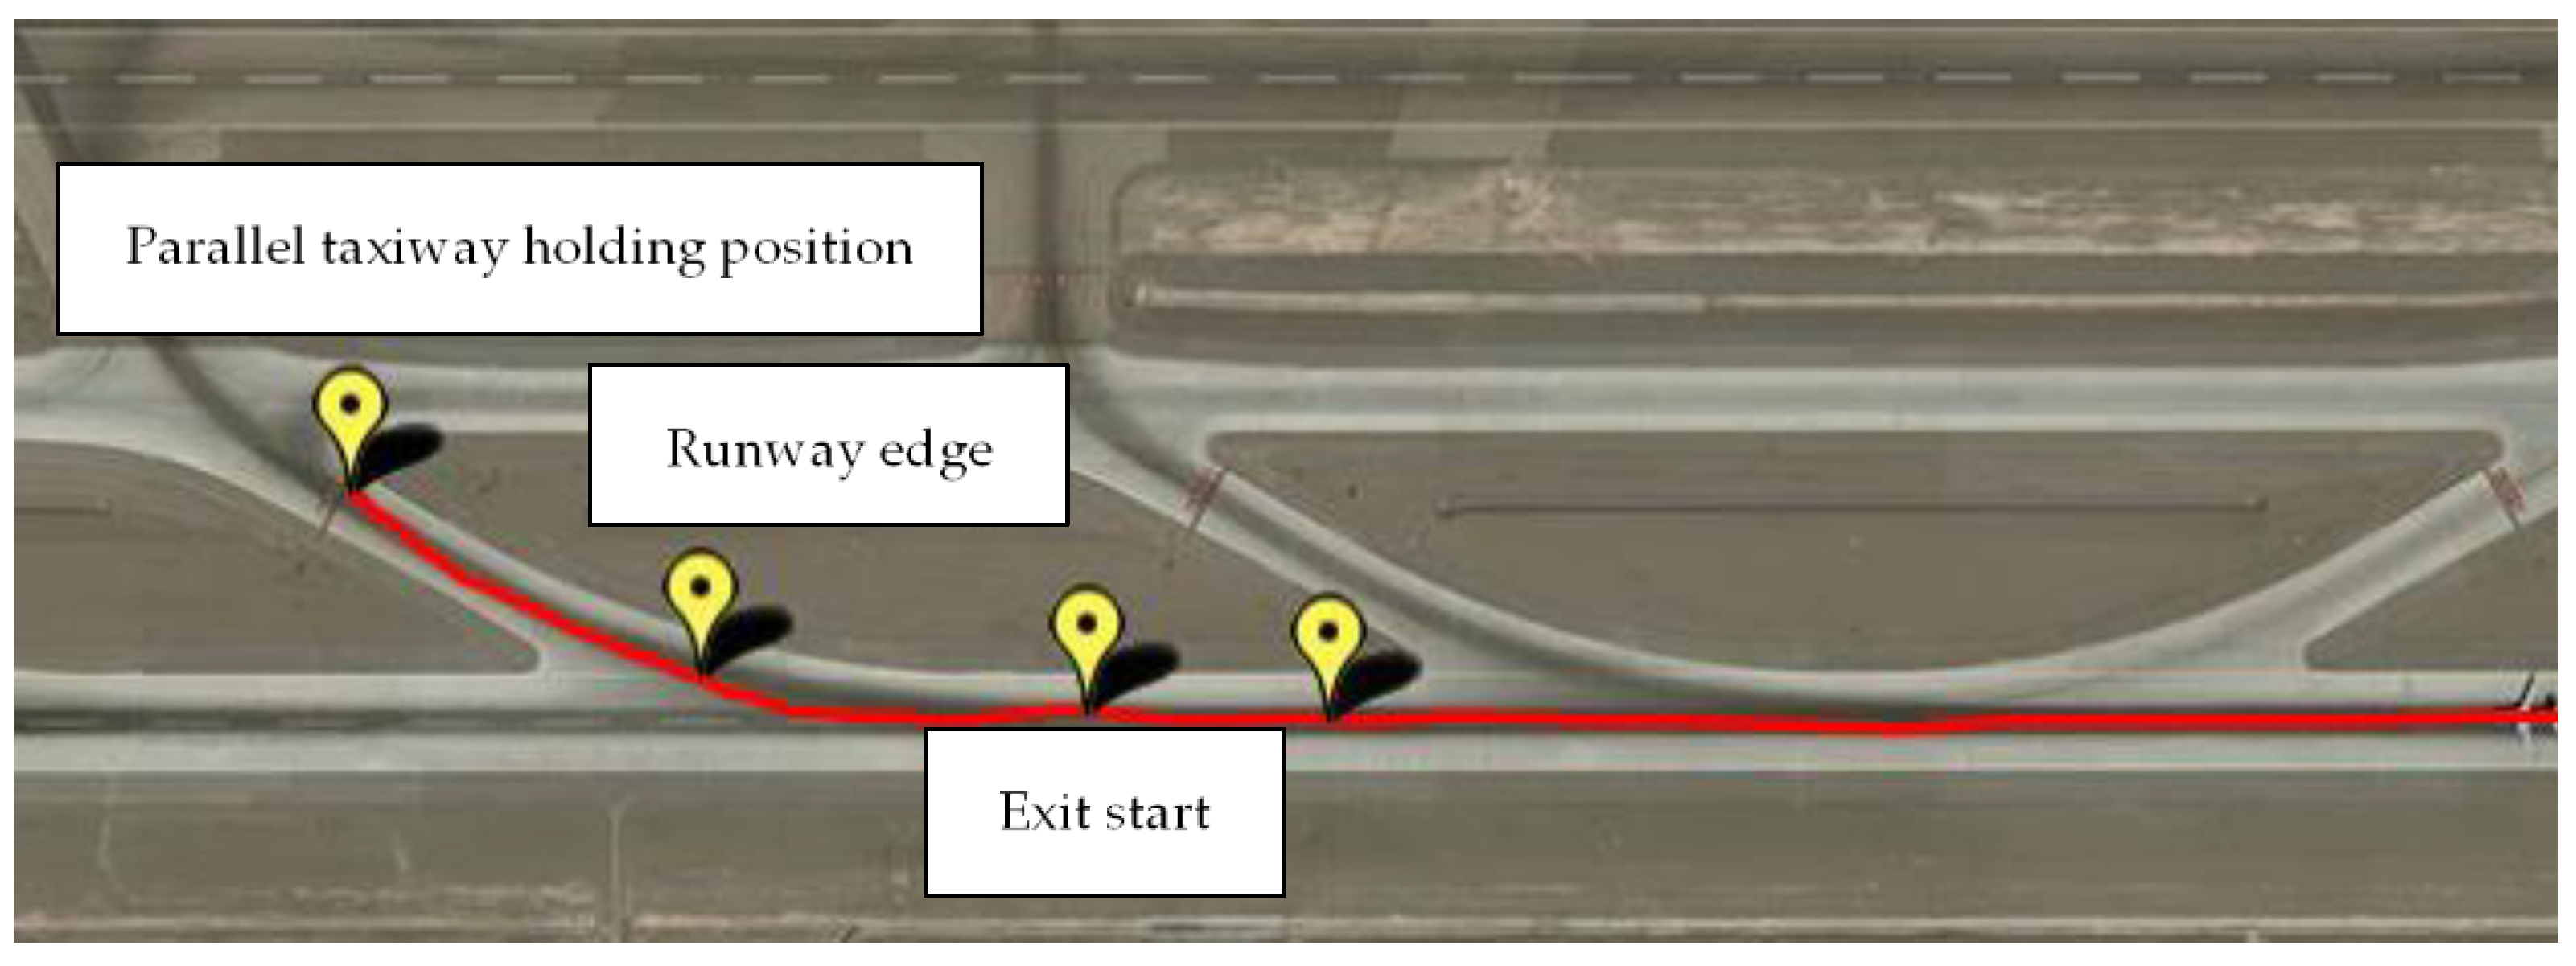
2.3. Rapid Exit Location
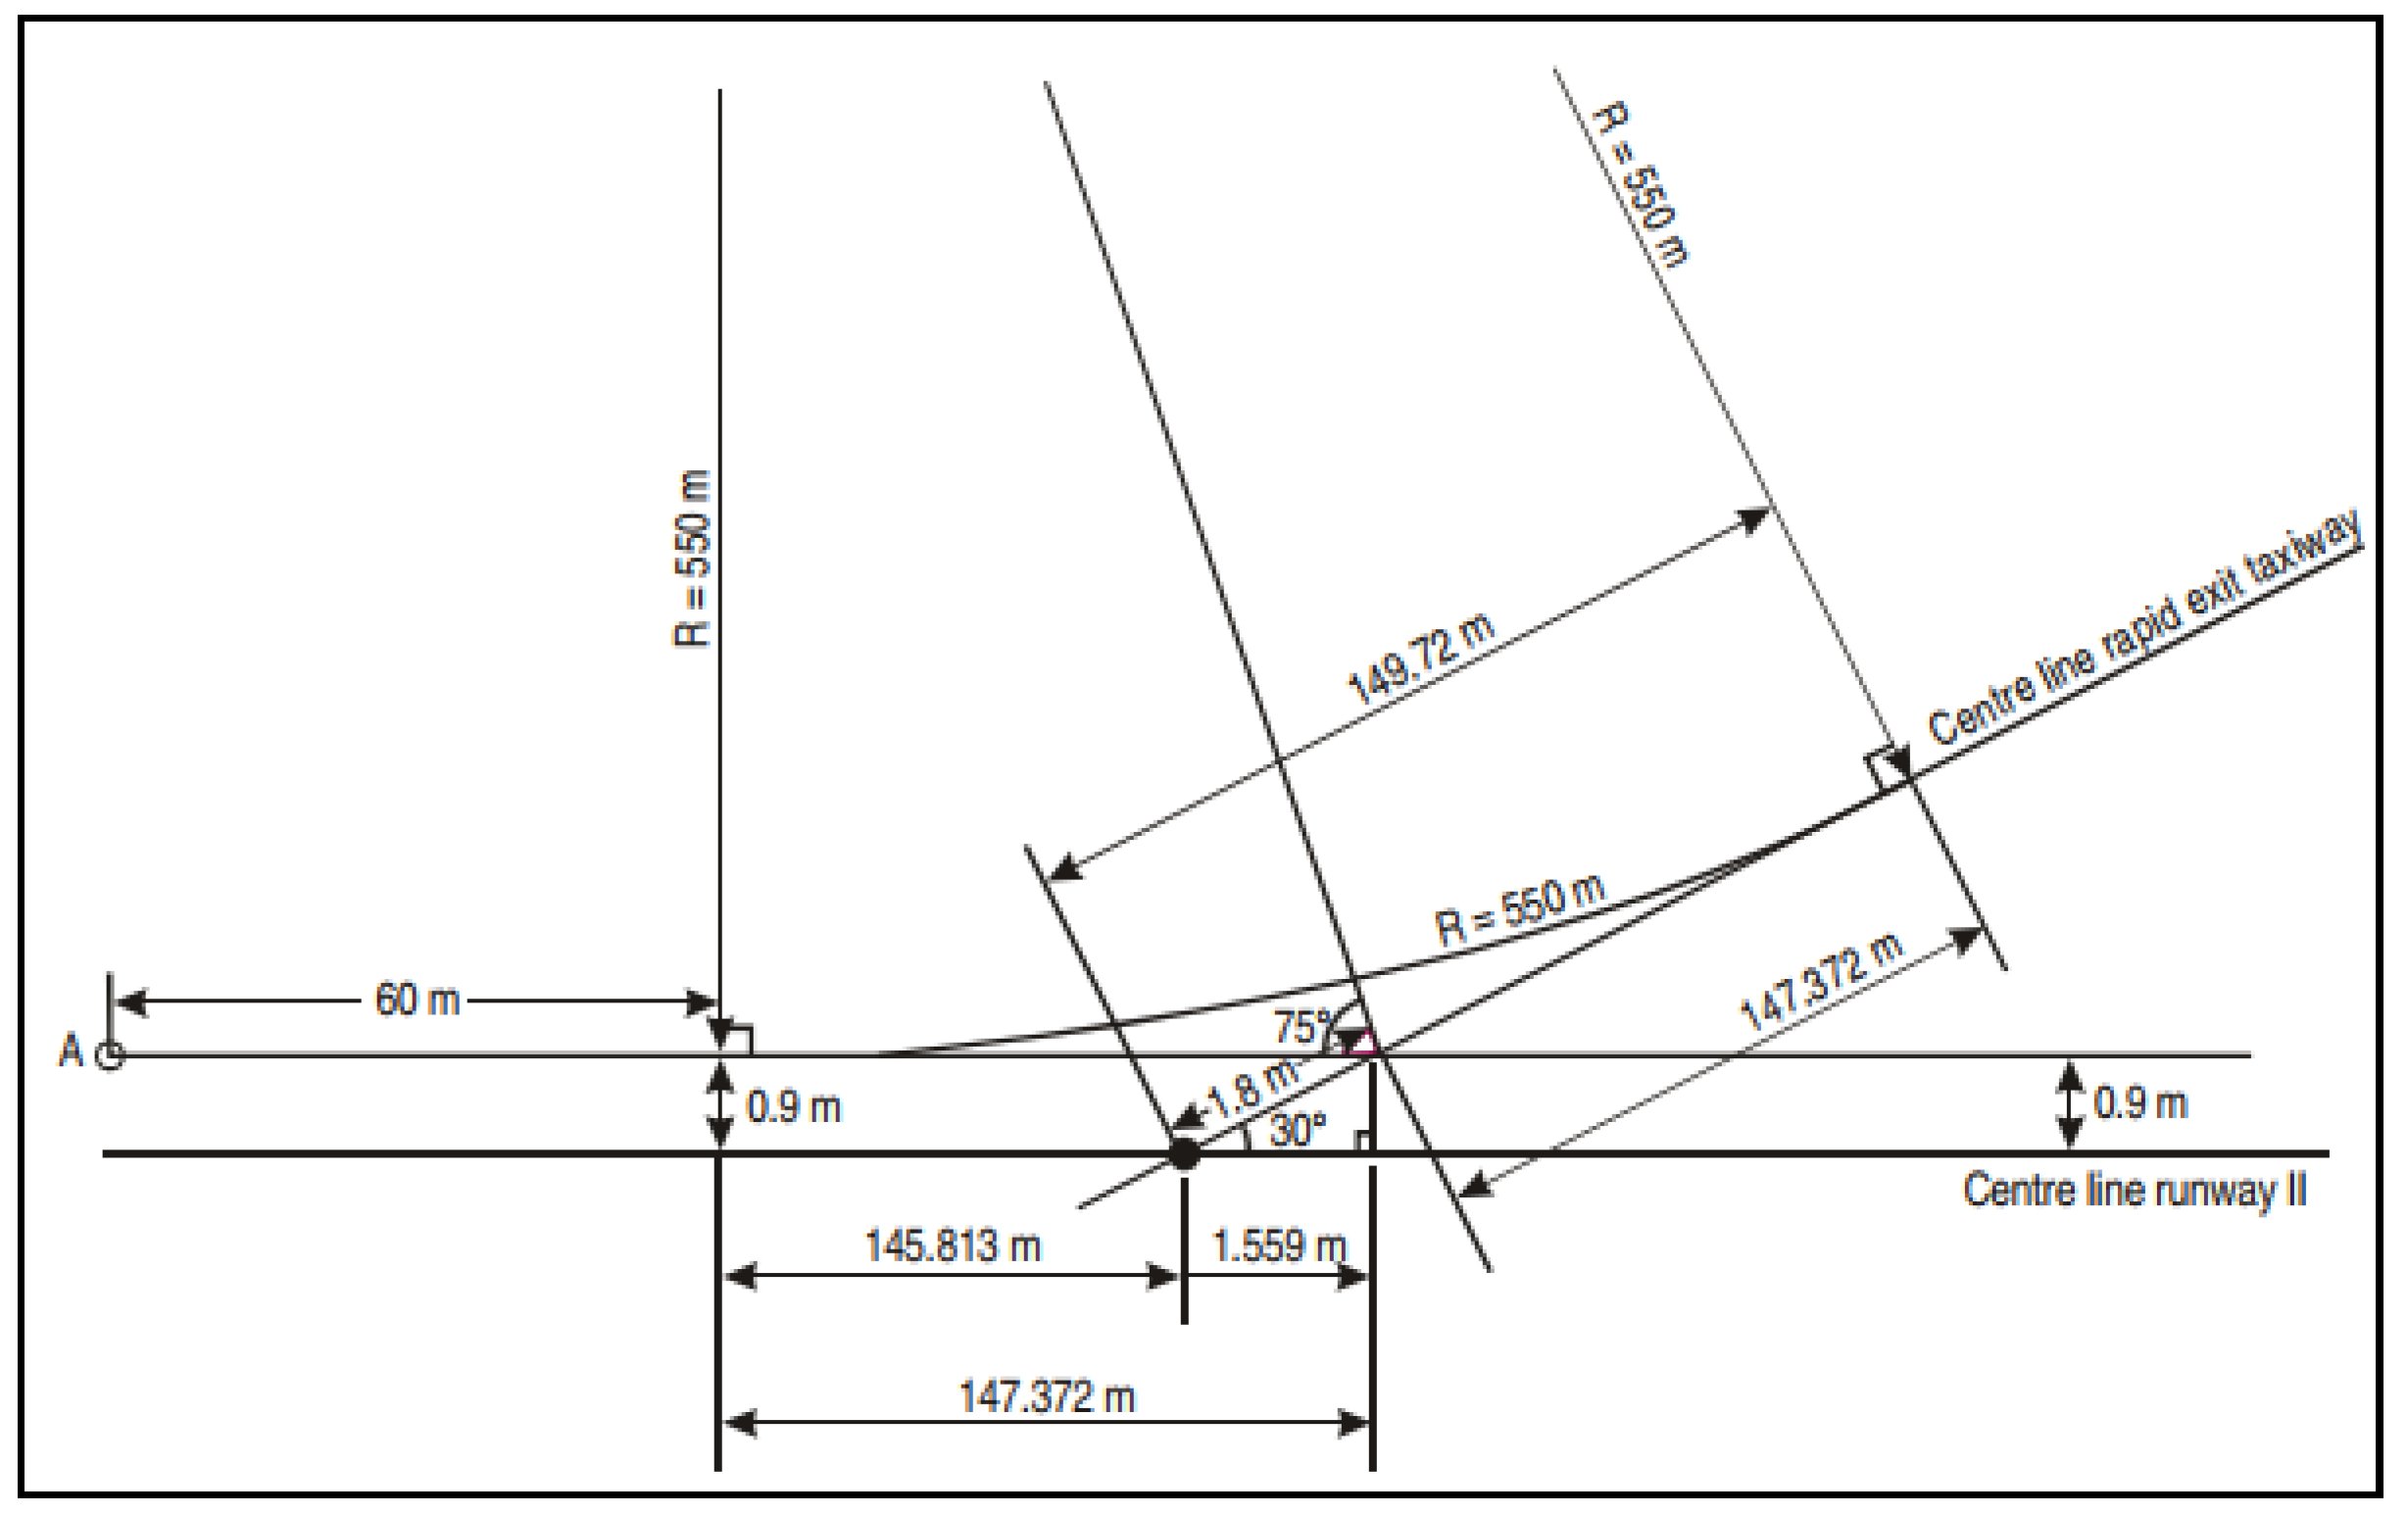
2.4. Rapid Exit Design
2.5. Operational Risk at Rapid Exit Taxiways
3. Methodology
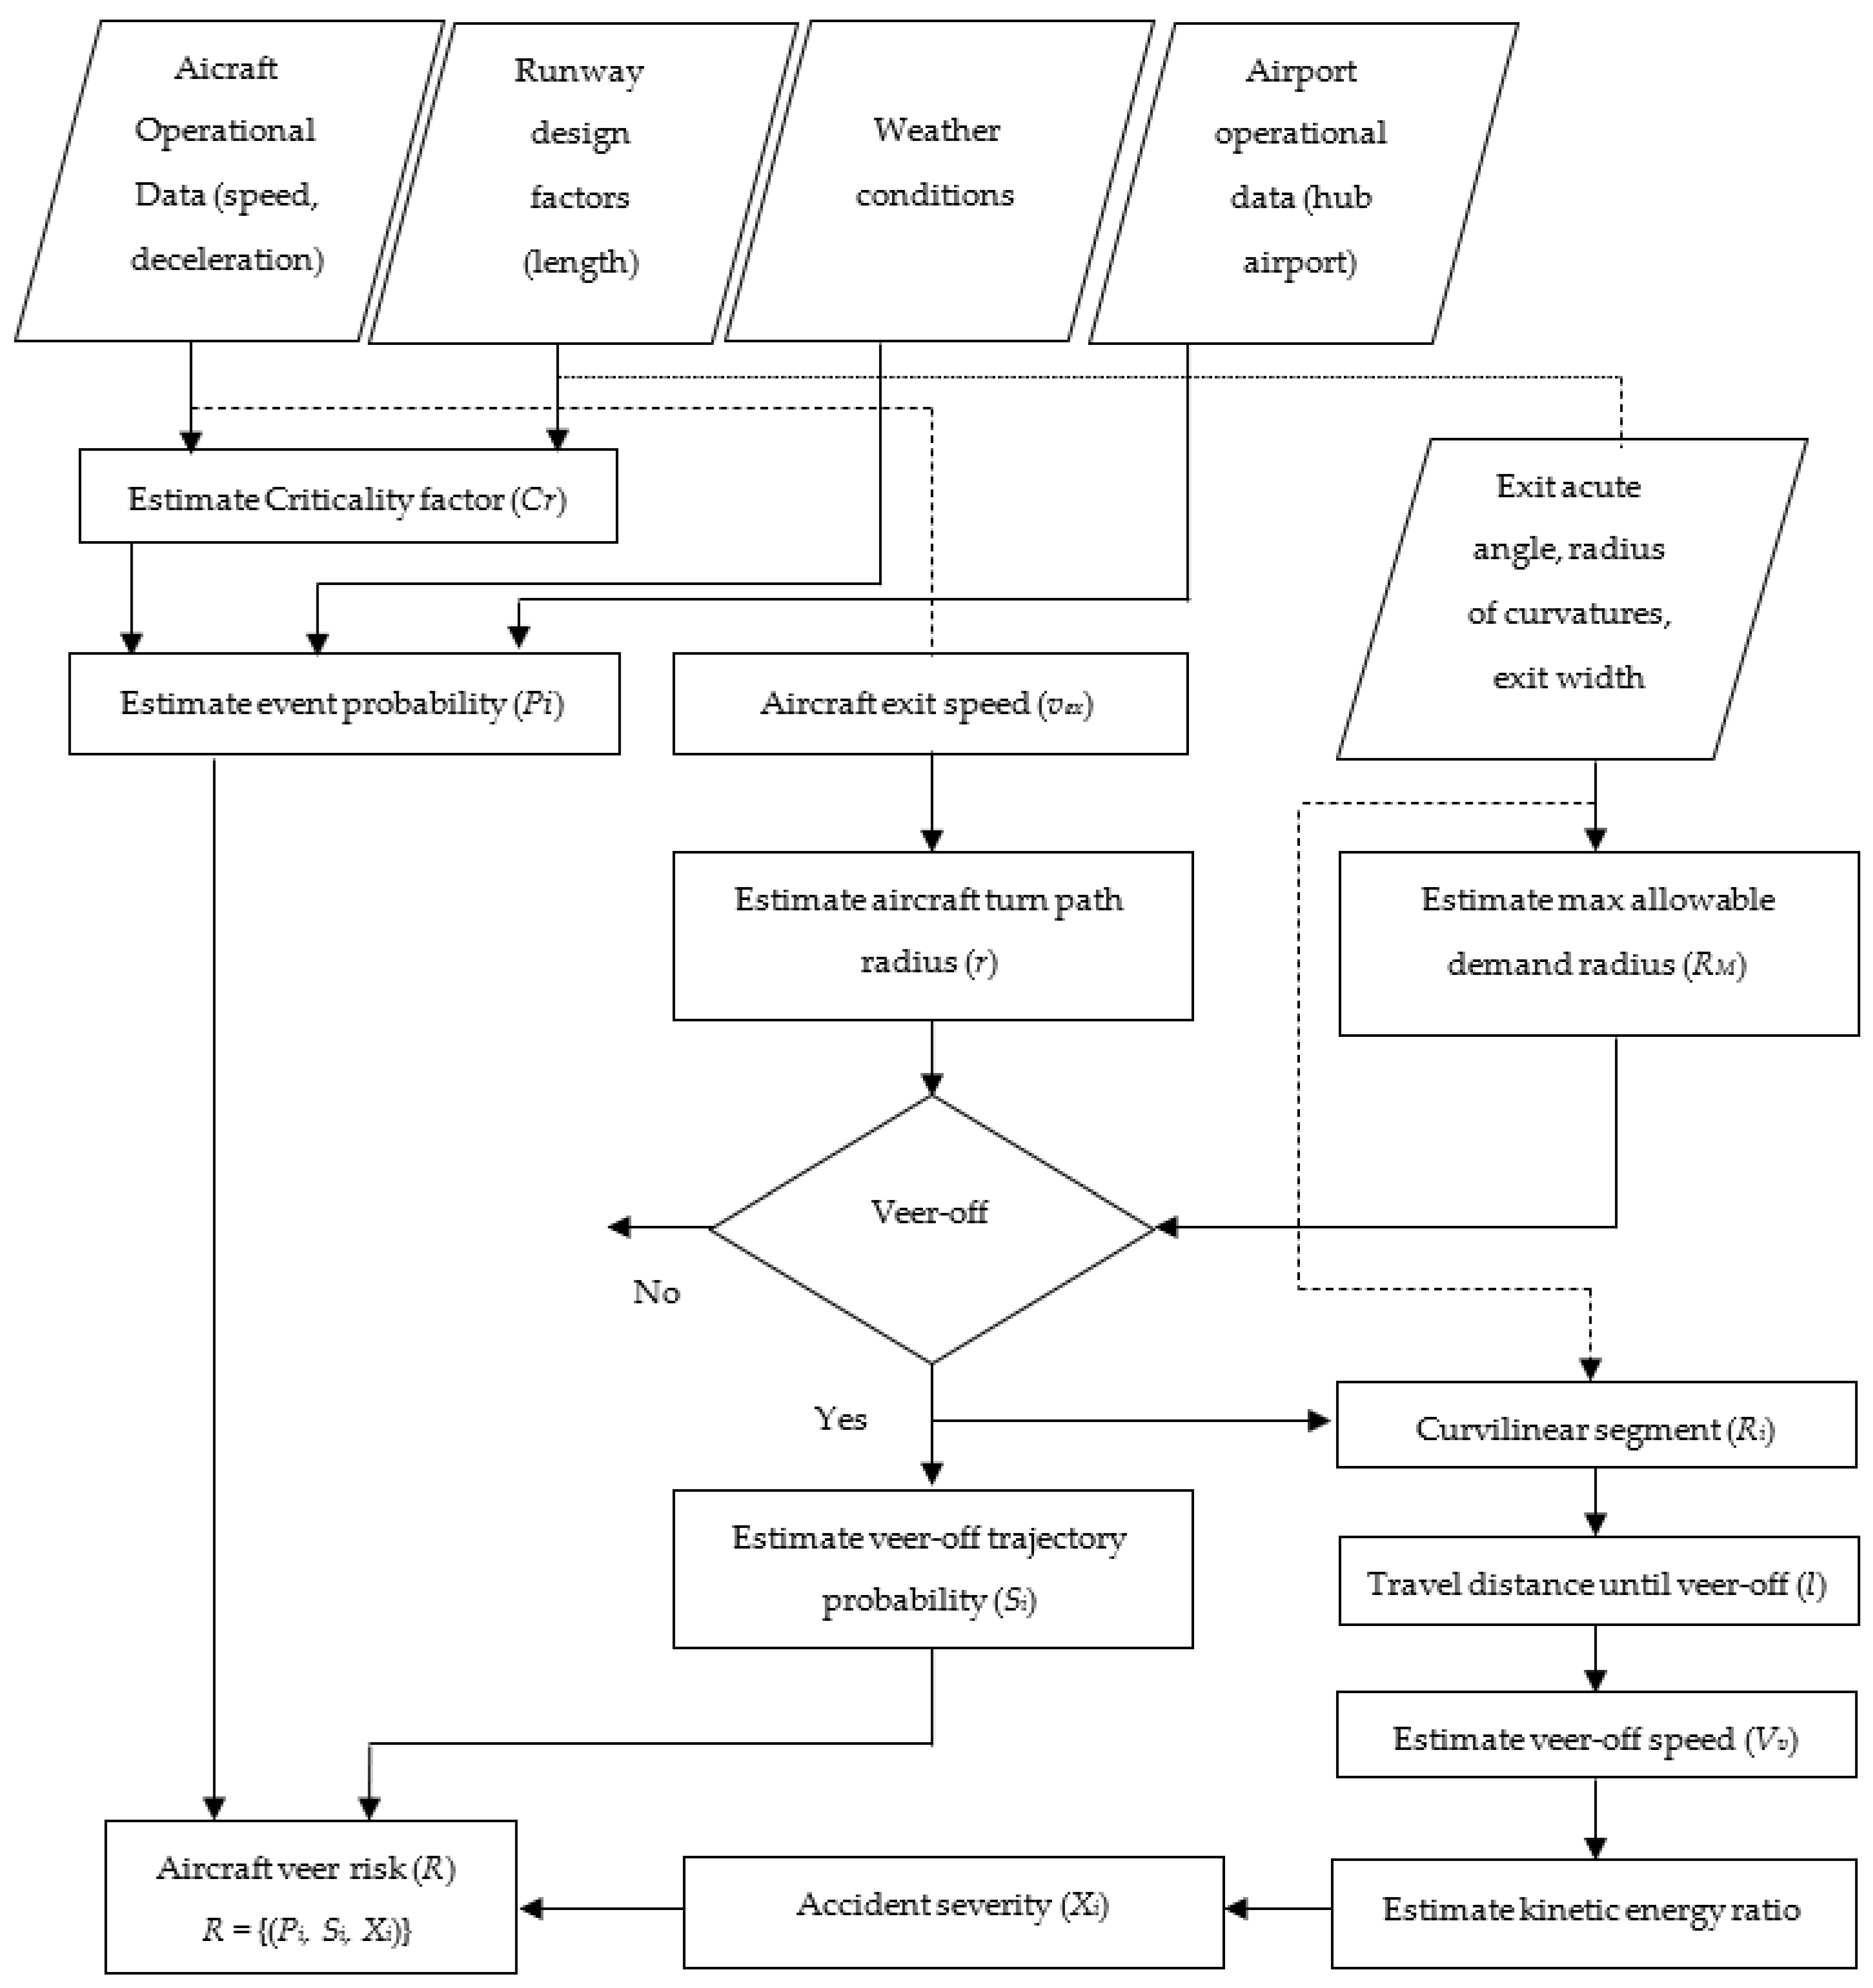
3.1. Evaluation of Veer-Off Risk
3.2. Estimation of Event Probability (Pi)
- Depending on the aircraft touchdown speed and exit location, modified criticality factors can be estimated (Equation (7)).
- Aircraft operational factors and weather factors are inserted to the overrun risk model (Equation (2)) for estimating aircraft probability, which is unable to reach the recommended exit speed at the point of exit.
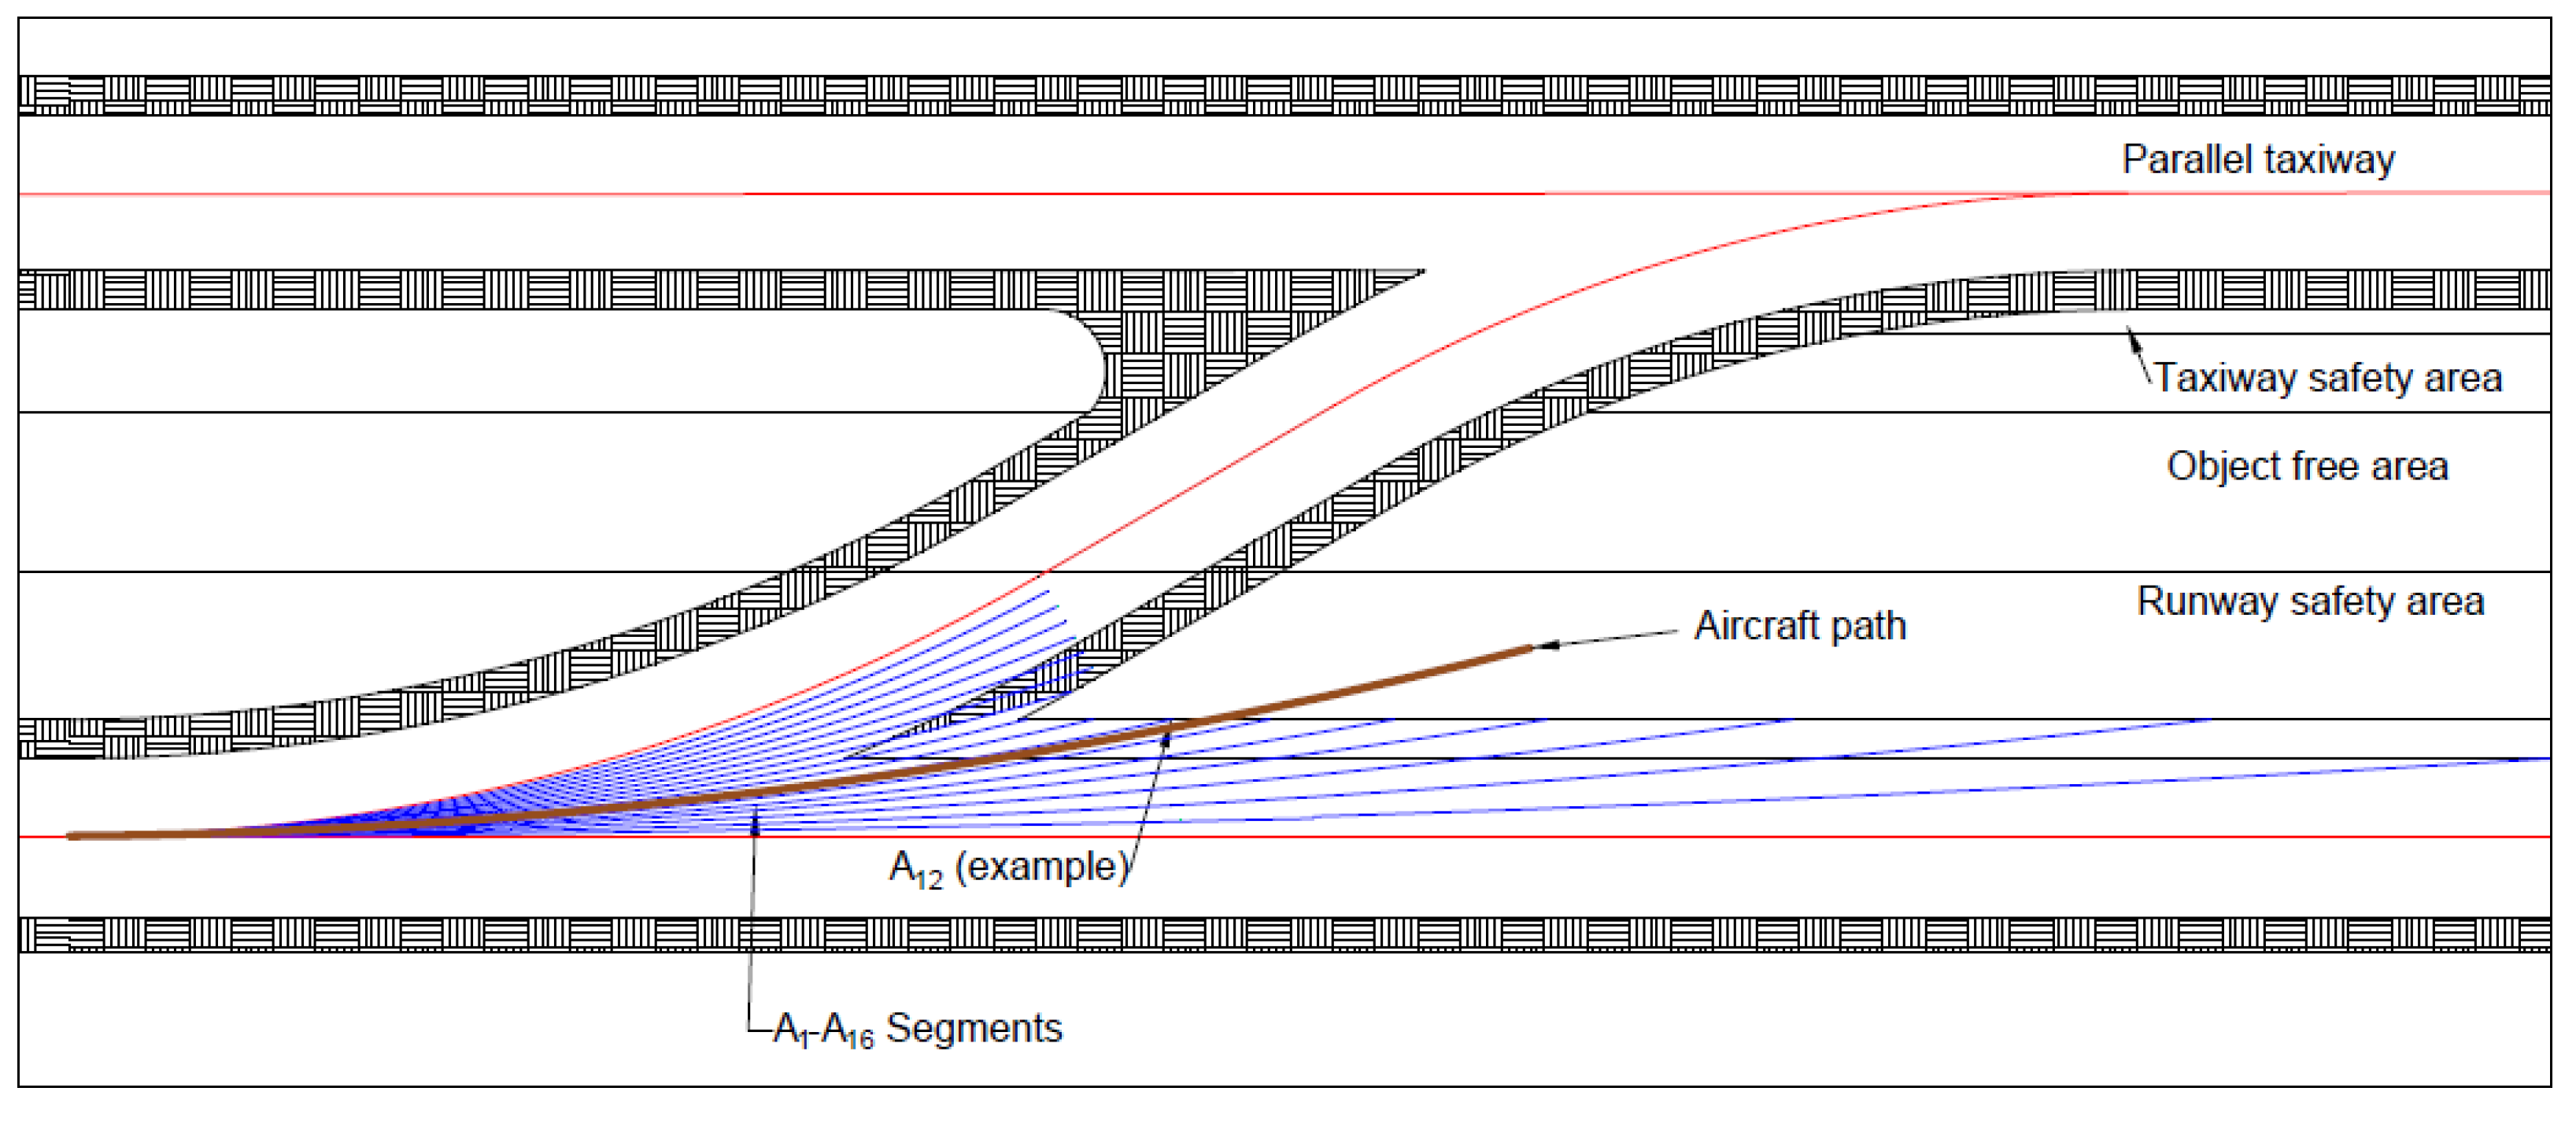
3.3. Veer-Off Trajectory Probability (Si) Estimation
- Due to variations of various operational factors, aircraft speed at the point of exit is different. Even the known touchdown speed (vth) causes different exit speeds due to the effect of deceleration and touchdown location. Aircraft deceleration during the landing roll depends on the pilot’s intention to take a particular exit. Therefore, the speed at the point of exit vex is given by Equation (12),where:vex—Speed at the point of exitvth—Touchdown speedl—Distance between the exit location and touchdown locationa—Deceleration in the landing roll.
- However, even for a known touchdown speed, touchdown location and deceleration may be random variables. Accordingly, at varying decelerations and touchdown locations, vex is also a random variable. Thus, values for deceleration and touchdown locations for a given aircraft approach category can be taken from the following probability density function for normal distribution (Equation (13)).where μ and σ are the mean and standard deviation of landing speed and touchdown location, respectively.
- Random numbers are generated to simulate the different operations by the Monte Carlo simulation technique for the variables such as deceleration (a) and touchdown location (l). The simulation follows Equation (13) normal distribution subject to sample parameters taken from the aircraft landing data at the given airport.
- For different touchdown locations and decelerations, exit speeds can be estimated. Based on these exit speeds, we can estimate the number of turning paths that is beyond the maximum allowable radius: that is, the corresponding trajectory probabilities belong to the veer-off category.
3.4. Estimation of Event Severities (Xi)
4. Analysis
4.1. Illustrative Example
4.2. Results
5. Conclusions
Author Contributions
Funding
Institutional Review Board Statement
Informed Consent Statement
Data Availability Statement
Acknowledgments
Conflicts of Interest
References
- International Airport Review. Available online: https://www.internationalairportreview.com/article/101952/world-airport-traffic-report-preview-aciworld/ (accessed on 22 January 2021).
- Hamzawi, S.G. Lack of airport capacity: Exploration of alternative solutions. Transp. Res. Part. A Policy Pract. 1992, 26, 47–58. Available online: https://www.sciencedirect.com/science/article/abs/pii/0965856492900448?via%3Dihub (accessed on 14 February 2021). [CrossRef]
- Dray, L. An empirical analysis of airport capacity expansion. J. Air Transp. Manag. 2020, 87. [Google Scholar] [CrossRef]
- Horonjeff, R.; McKelvey, F.; Sproule, W.; Young, S. Planning and Design of Airports; Mc Graw Hill, Inc.: New York, NY, USA, 2010. [Google Scholar]
- International Civil Aviation Organization. ICAO-Doc 9157-AN 901-Aerodrome Design Manual Part 2 Taxiways Aprons and Holding Bays. 2005. Available online: https://www.academia.edu/41316519/Doc_9157_Aerodome_design_manual_part_2_taxiway_up_date (accessed on 15 December 2020).
- Clemmer, C.B. Determining the Location of Runway Exits Using Airport Surface Detection Equipment. Master’s Thesis, Embry-Riddle Aeronautical University, Daytona Beach, FL, USA, 2018. Available online: https://commons.erau.edu/cgi/viewcontent.cgi?article=1420&context=edt (accessed on 15 January 2021).
- Hall, J.; Ayres, M.; Shirazi, H.; Speir, R.; Carvalho, R.; David, R. Airport Cooperative Research Program Report 51: Risk Assessment Method to Support Modification of Airfield Separation Standards; Transportation Research Board: Washington, DC, USA, 2011; Available online: http://nap.edu/14501 (accessed on 28 December 2020).
- Hall, J.; Ayres, M.; Wong, D.; Appleyard, A.; Eddowes, M.; Shirazi, H. Airport Cooperative Research Program Report 3: Analysis of Aircraft Overruns and Undershoots for Runway Safety Areas; Transportation Research Board: Washington, DC, USA, 2008; Available online: https://www.icao.int/SAM/Documents/2011/AGAASEROSTUDIES/ACRP_rpt_003.pdf (accessed on 20 December 2020).
- Federal Aviation Administration. Advisory Circular No: 150/5300-13B. 2020. Available online: https://www.faa.gov/documentLibrary/media/Advisory_Circular/draft-150-5300-13B-industry.pdf (accessed on 15 October 2020).
- Boeing Commercial Airplanes. Aviation Safety, Boeing Commercial Airplanes: Statistical Summary of Commercial Jet Airplane Accidents 1959–2016; Boeing Airplane: Chicago, IL, USA, 2018; Available online: https://www.skybrary.aero/bookshelf/books/4239.pdf (accessed on 24 December 2020).
- Skybrary. Accidents and Incidents. 2020. Available online: https://www.skybrary.aero/index.php/Accident_and_Serious_Incident_Reports_RE (accessed on 3 October 2020).
- Kirkland, I.D. The Risk Assessment of Aircraft Runway Overrun Accidents and Incidents. PhD Thesis, Loughborough University, Loughborough, UK, 2001. Available online: https://repository.lboro.ac.uk/articles/The_risk_assessment_of_aircraft_runway_overrun_accidents_and_incidents/9456605 (accessed on 17 November 2020).
- Wong, K.Y. The Modelling of Accident Frequency Using Risk Exposure Data for the Assessment of Airport Safety Areas; Loughborough University: Loughborough, UK, 2007; Available online: https://core.ac.uk/download/pdf/288389973.pdf (accessed on 12 November 2020).
- Van Es, G.W.H.; Tritscheler, K.; Tauss, M. NLR Report-TP-2009-280: Development of a landing Overrun Risk Index; Air Transport Safety Institute: Amsterdam, The Netherlands, 2009; Available online: https://reports.nlr.nl/xmlui/bitstream/handle/10921/235/TP-2009-280.pdf (accessed on 2 January 2021).
- Guerra, L.; Murino, T.; Romano, E. Airport system analysis: A probabilistic risk assessment model. Int. J. Syst. Appl. Eng. Dev. 2008, 2, 52–65. [Google Scholar]
- Ayres, M.; Carvalho, R.; Shirazi, H.; David, R. Airport Cooperative Research Program Report 107: Development of a Runway Veer-Off Location Distribution Risk Assessment and Reporting Template; Transportation Research Board: Washington, DC, USA, 2014; Available online: https://www.nap.edu/download/22411 (accessed on 24 December 2020).
- Jeon, J.; Song, J.; Kim, H.; Song, B. Research on the Advanced Risk Assessment of Runway Safety Areas with Enhanced Algorithm. Int. J. Eng. Sci. Technol. 2016, 5, 67–70. [Google Scholar] [CrossRef]
- Shirazi, H.; Hall, J.; Williams, B.; Moser, S.; Boswel, D.; Hardy, M. Airport Cooperative Research Program Report 168: Runway Protection Zones (RPZ) Risk Assessment Tool Users’ Guide; Transportation Research Board: Washington DC, USA, 2016; Available online: https://www.nap.edu/download/24662 (accessed on 4 January 2021).
- Moretti, L.; Cantisani, G.; Caro, S. Airport Veer-off Risk Assessment: An Italian Case Study. J. Eng. Appl. 2017, 12, 900–912. [Google Scholar]
- Trucco, P.; De Ambroggi, M.; Leva, M.C. Topological risk mapping of runway overruns: A probabilistic approach. Reliab. Eng. Syst. Saf. 2015, 142, 433–443. [Google Scholar] [CrossRef] [Green Version]
- Schoen, M.L.; Preston, O.W.; Summers, L.G.; Nelson, B.A.; VanderLinden, L.; Reynolds, M.C. NASA Contractor Report: 172549: Probabilistic Computer Model of Optimal Runway Turnoffs; Langley Research Center: Hampton, VA, USA, 1985. [Google Scholar]
- Trani, A.A.; Hobeika, A.G.; Sherali, H.D.; Kim, B.J.; Sadam, C.K. Report DOT/FAA/RD-90/32,I: Runway Exit Designs for Capacity Improvement Demonstrations Phase I Algorithm Development; Center for Transportation Research, Virginia Polytechnic Institute and State University: Blacksburg, VA, USA, 1990. Available online: https://ntrs.nasa.gov/archive/nasa/casi.ntrs.nasa.gov/19910007752.pdf (accessed on 17 October 2020).
- Trani, A.A.; Hobeika, A.G.; Kim, B.J.; Nunna, V.; Zhong, C. Report DOT/FAA/RD-920/16,II: Runway Exit Designs for Capacity Improvement Demonstrations Phase II Computer Model Development; Center for Transportation Research, Virginia Polytechnic Institute and State University: Blacksburg, VA, USA, 1992. Available online: https://ntrs.nasa.gov/api/citations/19920011919/downloads/19920011919.pdf (accessed on 21 April 2021).
- Rammohan, K.S.; Mahesh, K.M. Determining the Location of Rapid Exit Taxiways Using Three Segment Method. Int. J. Innov. Res. Sci. Eng. Technol. 2017, 6, 1715–1718. [Google Scholar] [CrossRef]
- Rahim, J. An Analysis of Runway Capacity at International Airport Sultan Aji Sulaiman Balikpapan in East Kalimantan-Indonesia. Int. J. Eng. Sci. 2015, 4, 5–11. Available online: http://www.irjes.com/Papers/vol4-issue5/B450511.pdf (accessed on 25 February 2021).
- Meijers, N.P.; Hansman, R.J. Report No. ICAT-2019-14: Data-Driven Predictive Analytics of Runway Occupancy Time for Improved Capacity at Airports; MIT International Center for Air Transportation, Massachusetts Institute of Technology: Cambridge, MA, USA, 2019. [Google Scholar]
- Zhou, H.; Jiang, X. Research on Taxiway Path Optimization Based on Conflict Detection. PLoS ONE 2015, 10, e0134522. [Google Scholar] [CrossRef] [PubMed] [Green Version]
- Scholz, F. Statistical Extreme Value Analysis of ANC Taxiway Centerline Deviations for 747 Aircraft; The Boeing Company: Chicago, IL, USA, 2003. Available online: https://www.faa.gov/airports/resources/publications/reports/media/JFK_101703.pdf (accessed on 17 July 2020).
- Young, S. Centerline Deviations; Center for Aviation Studies, The OHIO State University: Columbus, OH, USA, 2015; Available online: https://aviation.osu.edu/research/centerline-deviation (accessed on 11 November 2020).
- Federal Aviation Administration. Airport Design Advisory Circular; FAA AC 150/5300-13A; U.S. Department of Transportation, Federal Aviation Administration: Washington, DC, USA, 2014. Available online: https://www.faa.gov/documentLibrary/media/Advisory_Circular/150-5300-13A-chg1-interactive-201612.pdf (accessed on 25 January 2021).
- Galagedera, S.D.B.; Pasindu, H.R.; Adikariwattage, V.V. Analysis of Aircraft Veer-off Probability at High Speed Exits. In Proceedings of the 2019 Moratuwa Engineering Research Conference (MERCon), Moratuwa, Sri Lanka, 3–5 July 2019. [Google Scholar] [CrossRef]
- Air Services. Available online: www.airservicesaustralia.com/wp-content/uploads/Melbourne-Runway-Occupancy-Time.pdf (accessed on 21 December 2020).
- Trani, A.A.; Hinze, N.; Mirmohammadsadeghi, N.; Duffy, K.; Vitagliano, L. Runway Exit Design Interactive Model; Air Transportation Systems Laboratory, Virginia Tech: Blacksburg, VA, USA, 2020. [Google Scholar]


| Date | Aircraft Type | Airport | Accident Type | Severity | Causal Factors |
|---|---|---|---|---|---|
| 29-August-2011 | A340 | Chhatrapati Shivaji International Airport, India | Veered off from the HSE taxiway | Got struck in the adjoining mud | Taxiway surface condition |
| 02-November-2011 | B747 | Changi Airport, Singapore | Veered off when trying to vacate the runway via an HSE | No information | Turn off speed, deceleration, pilot error |
| 21-September-2012 | A319 | Copenhagen Airport, Denmark | Veered off from the paved surface when attempting to turn to the HSE | No information | Turn off speed, pilot error |
| 05-December-2013 | B767 | Madrid Barajas Airport | Move out of the HSE taxiway | Stopped on the grassy area | Tire failure |
| 21-February-2016 | A320 | Birmingham International Airport | Failed to negotiate the taxiway turn | Ran on to the adjoining grass | Turn off speed, wet surface, pilot error |
| 18-July-2016 | STINSON 108 | Haines Airport, Alaska | When turning in to the HSE taxiway, an abrupt turn could not control the airplane | Substantial damage to the left landing gear and collapsed left wheel axle | Wind, ground speed |
| 02-July-2019 | A320 | Mangalore International Airport, India | Aircraft veered off the taxiway when turning into high-speed exit taxiway from the runway | No severe damages | Turn off speed, deceleration, pilot error |
| 21-November-2019 | B737 | Odessa Airport, Ukraine | Traveled off the side of the runway | Aircraft left main landing gear struck on the grass | Mechanical failure of the nose landing gear |
| Turn Path Radius Analysis | Event | Critical Component | Damage | Severity |
|---|---|---|---|---|
| Estimated aircraft demand turning radius (RD) < 775 m | Aircraft travels along the rapid exit taxiway path as the pilot can manage the aircraft travel path | Outer main gear | No | No incident |
| 775 m < Estimated aircraft demand turning radius (RD) | There is a chance that aircraft does not enter into the rapid exit taxiway path. However, due to the aircraft speed and deceleration, the aircraft stops within the paved runway/taxiway surface before entering the unpaved adjacent terrain. | Aircraft nose landing gear | No damage, interfere other operations | Incident |
| A higher chance that the aircraft does not enter into the rapid exit taxiway path. Depending on the turn path, the aircraft might enter into the unpaved adjacent terrain | Aircraft nose landing gear | Aircraft landing gear damage due to high stress at soft terrain | Major |
| Radius of Curvature Rj (m) | Distance from the Point of Exit to the Point of Veer-Off (l) |
|---|---|
| 776–820 | 295 |
| 821–905 | 287 |
| 906–1007 | 274 |
| 1008–1133 | 295 |
| 1134–1292 | 314 |
| 1293–1496 | 342 |
| 1497–1769 | 377 |
| 1770–2151 | 420 |
| 2152–2726 | 489 |
| 2727–3684 | 607 |
| 3685–5594 | 862 |
| Aircraft Type | B747-400 |
|---|---|
| Landing length required at distinct weather conditions for a given airport setting (lo) | 1986 m |
| Recommended exit speed for the exit geometry (vR) | 27 ms−1 |
| Touchdown speed (for the chosen operation) (u) | 68.4 ms−1 |
| Length required to reach to the recommended exit speed (lR) | 1676 m |
| Exit location distance from threshold (la) | 1650 m |
| Modified criticality factor (Crm) | 0.00693 |
| Using overrun risk model (Equation (2)), | |
| Probability that the exit speed (Vex) exceeded the recommended exit speed at the exit location, (Event probability)—Pi | 3.68 × 10⁻⁵ |
| Veer-off trajectory probability (Si) estimation | |
| By Monte Carlo simulation | |
| Touchdown location (using actual data or Monte Carlo simulation) | Estimate |
| Deceleration in the landing roll (using actual data or Monte Carlo simulation) | Estimate |
| Aircraft exit speeds are estimated (Considering the above two simulated values and Equation (12), this is an estimated value) | 40.6 ms−1 |
| Side friction coefficient (Equation (11)) | 0.19 |
| Aircraft demand turning radius RD estimate (Considering the above simulated values and Equation (10), this is an estimated value) | 938 m |
| Using Monte Carlo simulation for random variables for the touchdown location and deceleration, there may be distinct exit speeds and consequent demand radiuses. For location probability estimation, random values are estimated for the exit speed. These distinct exit speeds cause the aircraft to travel different turn path radiuses. These demand turning radiuses against the maximum allowable radius (775 m) are identified and the respective percentage ratio is used as the location probability. | |
| Potential veer-offs are identified when RD > 775 m, Si (Depends on the simulated values and calculations) | 0.18 |
| Severity estimation (Xi) | |
| Deceleration during the turning maneuver (Depends in the simulated values) | 0.5 ms−2 |
| Travel distance in the turning maneuver belonging to the (907–1006) m segment | 274 m |
| Aircraft veer-off speed ѷ (Equation (15)) | 36.2 ms−1 |
| Estimate severity (ѷ2/v2ex) in Equation (16), Xi | 0.79 |
| Aircraft veer-off risk with regard to major consequences (Pi × Si × Xi) | 4.16 × 10⁻⁷ |
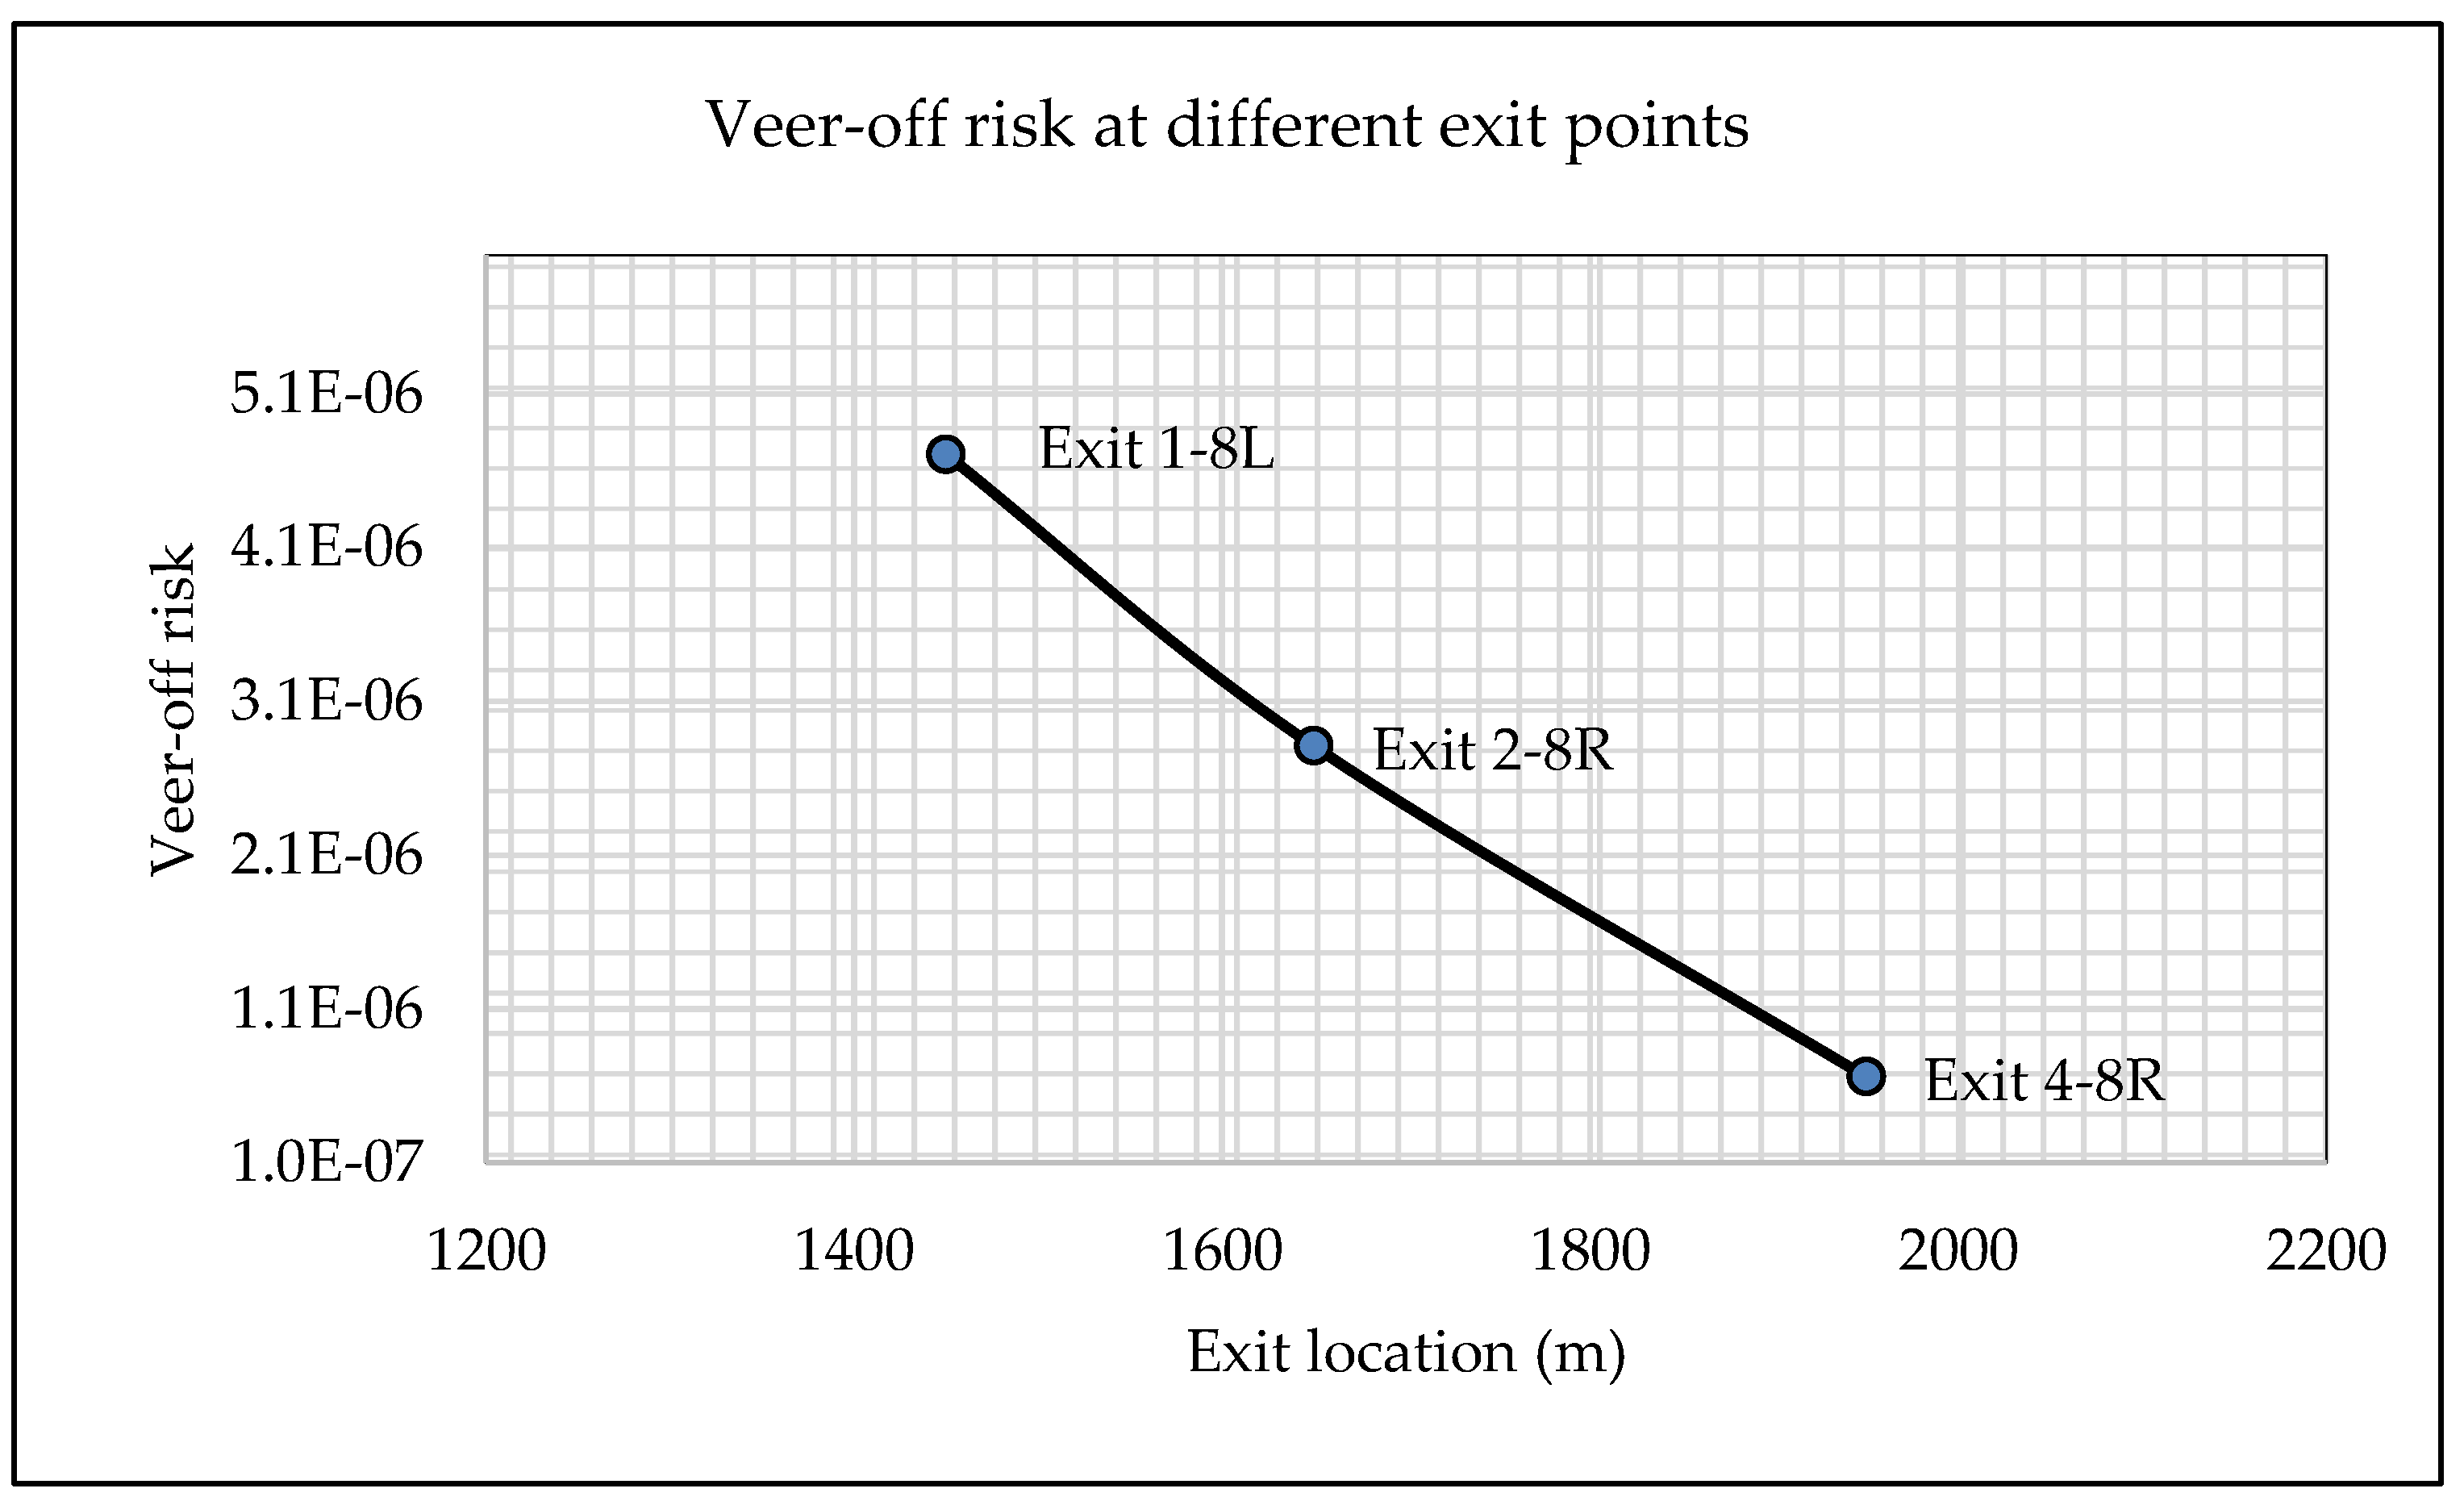
| Exit | Exit 1-8L (Reference) | Exit 2-8R | Exit 4-8R |
|---|---|---|---|
| Runway length | 3202 m | 3202 m | 3202 m |
| Exit location | 1450 m | 1650 m | 1950 m |
| Elevation | 3 m | 3 m | 3 m |
| Ambient temperature | 25–30 °C | 25–30 °C | 25–30 °C |
Publisher’s Note: MDPI stays neutral with regard to jurisdictional claims in published maps and institutional affiliations. |
© 2021 by the authors. Licensee MDPI, Basel, Switzerland. This article is an open access article distributed under the terms and conditions of the Creative Commons Attribution (CC BY) license (https://creativecommons.org/licenses/by/4.0/).
Share and Cite
Galagedera, S.; Adikariwattage, V.; Pasindu, H.R. Evaluation of Rapid Exit Locations Based on Veer-Off Risk for Landing Aircraft. Sustainability 2021, 13, 5134. https://doi.org/10.3390/su13095134
Galagedera S, Adikariwattage V, Pasindu HR. Evaluation of Rapid Exit Locations Based on Veer-Off Risk for Landing Aircraft. Sustainability. 2021; 13(9):5134. https://doi.org/10.3390/su13095134
Chicago/Turabian StyleGalagedera, Sameeraű, Varuna Adikariwattage, and H. R. Pasindu. 2021. "Evaluation of Rapid Exit Locations Based on Veer-Off Risk for Landing Aircraft" Sustainability 13, no. 9: 5134. https://doi.org/10.3390/su13095134
APA StyleGalagedera, S., Adikariwattage, V., & Pasindu, H. R. (2021). Evaluation of Rapid Exit Locations Based on Veer-Off Risk for Landing Aircraft. Sustainability, 13(9), 5134. https://doi.org/10.3390/su13095134