Abstract
Agriculture in West Africa is constrained by several yield-limiting factors, such as poor soil fertility, erratic rainfall distributions and low input systems. Projected changes in climate, thus, pose a threat since crop production is mainly rain-fed. The impact of climate change and its variation on the productivity of cereals in smallholder settings under future production systems in Navrongo, Ghana and Nioro du Rip, Senegal was assessed in this study. Data on management practices obtained from household surveys and projected agricultural development pathways (through stakeholder engagements), soil data, weather data (historical: 1980–2009 and five General Circulation Models; mid-century time slice 2040–2069 for two Representative Concentration Pathways; 4.5 and 8.5) were used for the impact assessment, employing a crop simulation model. Ensemble maize yield changes under the sustainable agricultural development pathway (SDP) were −13 and −16%, while under the unsustainable development pathway (USDP), yield changes were −19 and −20% in Navrongo and Nioro du Rip, respectively. The impact on sorghum and millet were lower than that on maize. Variations in climate change impact among smallholders were high with relative standard deviations (RSD) of between 14% and 60% across the cereals with variability being higher under the USDP, except for millet. Agricultural production systems with higher intensification but with less emphasis on soil conservation (USDP) will be more negatively impacted by climate change compared to relatively sustainable ones (SDP).
1. Introduction
The increasing population of West Africa, which is projected to become three-fold by 2050 over the baseline value in 2010 [1] has implications for food security in the sub region. Currently, food security remains a major structural challenge in the sub region with undernourishment, particularly in the rural areas. One possible solution to this challenge is improving the productivity of the farming systems. Yet, efforts to improve farm productivity is constrained by several factors, such as the sub-optimal use of external inputs, relatively fragile and poor soils, overreliance on rain-fed agriculture, and the fact that the small-scale farmers that dominate the farming systems have diverse practices that handicap the promotion of blanket recommendations. Agricultural production in the sub-region has been reported in several literature as vulnerable to environmental stress factors due to the heavy reliance on natural resources to support livelihoods [2,3,4]. In particular, changes or variability in weather patterns pose a concern. An analysis of long-term weather data (1950–2010) by Owusu et al. [5] in the Volta Basin in West Africa indicated an apparent shift in the rainfall pattern in Ghana toward a longer dry season and the disappearance of short dry spells. Additionally, Sultan et al. [6] reported significant projected increases in temperature across the entire West African sub region by 2050, which could alter not only the climatological hydrology but also crop physiological behaviour. For example, increased temperatures could accelerate crop development, shorten life cycles and also increase crop respiration. These effects would result in a reduction in crop yields. Overall, the projected changes in these weather variables would pose challenges to the livelihoods of farmers. Therefore, there is the need to assess the extent of the impact of the projected climate on crop productivity to provide a basis for the development of appropriate adaptation strategies.
A number of studies on the impact of climate change on crop yields have previously been carried out in the West African region. Notable among them include that by Traore et al. [7], who reported an adverse impact of climate change on maize and millet yields. Other studies projected that by 2050, local agricultural production in West Africa will fall below the per capita of 50 kg [1]. Simulation studies have projected an increase in the West African temperature by 1 °C [8], which would result in an increased frequency of heat and rainfall extremes [9] and a reduced average yield of millet by 10–20%, and sorghum by 5–15%. In monetary terms, this would translate to losses of USD 2.33–4.02 billion for millet and USD 0.73–2.17 billion for sorghum, annually [8]. An earlier literature review [3] also noted that West Africa was experiencing rapid climate change, typified by increasing temperatures and more rampant extreme climate events, which would lead to losses in crop yields. For the Oueme River Basin (ORB) in Benin, which is representative of the middle belt of West Africa, it was indicated that occurrences of drought and crop failure were likely to increase under climate change conditions [10]. A meta-analysis by Roudier et al. [11] indicated that increasing temperatures associated with climate change will likely have the most negative impacts on crop production, even though the temperature effects could be exacerbated by changes in rainfall patterns. It was concluded in the analysis that a rise in temperature beyond 2 °C cannot be counteracted by any positive changes in rainfall amount or distribution [12].
The issue of concern here is that most of these impact assessments are carried out either on current or past agriculture production systems. This approach fails to recognize that future production systems may differ due to technological advances in agriculture, agricultural policy and development pathways, and the fact that the highly diversified smallholder farming systems may adopt varying future agricultural practices. An implication of the diversity among farmers is that climate change and variability effects may not be uniform: some farmers may be severely impacted, based on their choice of crop mix and cropping practice, among others. On the contrary, it is conceivable that some farmers may gain from climate change impacts. With regard to technological change, it is feasible that new crop varieties, such as heat and drought-tolerant varieties may offset adverse climate change impacts [13]. Thus, farmers who adopt these varieties may gain from climate change impacts. To date, very few studies have quantified the variability of the impact among diverse smallholders and the way future farming productivity would be affected by climate change. Given that adaptation strategies have to be implemented at the farm level, a multi-farm assessment is necessary to adequately support agricultural planning and decision-making processes [14].
The aim of this study is to use a crop simulation modelling approach and limited farm surveys to assess the impact of climate change and variability in climate change impact on the yields of maize, sorghum and millet for diverse farm situations in Navrongo, Ghana and Nioro du Rip, Senegal, all in the West sub-region African under future production systems. The future production systems were determined by technology and agricultural policy changes.
2. Materials and Methods
2.1. Study Area
The study locations were Navrongo, Ghana and Nioro du Rip, Senegal, both in the West African sub-region with geographical coordinates of 10.8940° N vs. 1.0921° W and 13.7437° N vs. 15.7733° W, respectively. The two locations fall within the Sudan savannah agroecology that is characterized by a unimodal rainfall pattern. The soils are generally coarsely textured and low in soil organic carbon, with the Navrongo soils being shallower than those in Nioro du Rip. The farming systems in both locations are characterized by cereal–legume systems with livestock playing an important role. The main cereals cultivated are sorghum, millet and maize, while farmers also produce cowpea, peanut and other legumes. Agriculture in this region is predominantly rain-fed with limited use of external inputs, resulting in the continuous mining of nutrients coupled with erratic rainfall patterns that make farming a risky venture.
2.2. Model Description
The crop model used for this study was the CERES-Maize, CERES-Millet and CERES-Sorghum modules of the Decision Support System for Agro-technology Transfer (DSSAT) [15]. The model is process-based and mechanistic, running on a daily time step. It utilizes data on weather (daily minimum and maximum temperature, rainfall and solar radiation), soil parameters (profile level), crop management practices and crop genetic information to simulate soil processes, crop growth and yield. The model simulates soil–water dynamics using routines developed by Ritchie [16], soil organic carbon dynamics as described by Porter et al. [17] and nutrient balance. Potential crop growth is influenced by photosynthetic capacity, capture of solar radiation, plant development based on thermal time units and photoperiod sensitivity, while actual growth is limited by soil water and nutrient stresses [18,19]. More details on the model description can be found in MacCarthy et al. [20].
Prior to this current study, the modules of the three crops studied were calibrated in previous studies. The maize (Zea mays L.) variety simulated for Ghana is “Obatanpa” which is an open-pollinated tropically adapted intermediate maturing cultivar developed by Ghana’s Crop Research Institute (CRI) in collaboration with the International Institute of Tropical Agriculture (IITA), Ibadan, Nigeria, the International Maize and Wheat Improvement Centre (CIMMYT), Mexico and the Sasakawa Global 2000 [21]. In the case of Senegal, the TZEEY-SRBC5 (released by the National Agriculture Research Systems of Senegal in collaboration with the International Institute for Tropical Agriculture (IITA)) [22] was the selected variety. The CERES maize model was earlier recalibrated and evaluated for these varieties [14]. The sorghum variety ICSV III was registered for use in Ghana in 1998, based on research by the CGIAR Centres and the national research systems [23]. The pearl millet variety used is the CIVT, which is an improved variety developed by ICRISAT together with the national systems in the semi-arid regions of West Africa [24]. The sorghum (Sorghum bicolor (L.) Moench)) and pearl millet (Pennisetum glaucum (L.) R. Br.) modules were calibrated by [25] and [2]. The genetic coefficients of the calibrated varieties of sorghum and millet were, thus, available for use in this current study.
Data on crop management practices were obtained from a farm survey conducted in 2012 and 2007 at Navrongo and Nioro du Rip, respectively. The farm survey involved 87 and 169 farmers who cultivated maize and sorghum, respectively, in Navrongo, while in Nioro du Rip, the survey involved 98 and 222 farmers who cultivated maize and millet, respectively. Data collected included time of planting or planting window, amount and time of inorganic fertiliser application, quantity of manure applied and grain yield. A subset of fifteen (15) sorghum and thirteen (13) millet farms with complete set of information was then used to evaluate the performance of the model in simulating the observed yields. Sowing time varied from May to June in Navrongo and from June to July in Nioro du Rip. The soil profile information used for the simulation was derived from a soil map of the study area for Nioro du Rip, [26] while those for the Navrongo site were from published literature [14,27]. Phenology (anthesis and maturity) data from the literature and the previous maize yield simulation by Freduah et al. [14] also guided the parametrisation of the CERES crop modules (Appendix A Table A1 and Table A2).
2.3. Climate Data
Historical climate data for Ghana over the period from 1980 to 2009 were obtained from the Ghana Meteorological Agency for Navrongo. In the case of Nioro du Rip, Senegal, data were obtained from AGRHYMET, Niamey, Niger. The weather variables used in the model were the daily minimum and maximum temperature, rainfall and solar radiation. The historical data were used to project future climate scenarios based on the AgMIP protocol [28]. For this, five General Circulation Models (GCMs) were selected from 29 GCMs which adequately captured the main features of the West African climate in terms of seasonal variability. The selection of the GCMs was based on a scatterplot of the average seasonal temperature vs. the seasonal rainfall for the locations, which was used to identify the cluster of GCMs that fall into each of the two Representative Concentration Pathways (RCPs), namely RCP4.5 and 8.5, using the AgMIP protocols described by Rosenzwieg et al. [28] and Ruane and McDermid [29]. For each of the 2 RCPs, the five GCMs corresponded to five categories: hot/wet, hot/dry, cool/wet, cool/dry and middle (Table 1). It is worth noting that the GCMs selected for the RCPs for a given scenario were not always the same (Table 1). Apart from temperature and rainfall, atmospheric CO2 concentration was another factor considered in the yield simulation. The baseline CO2 concentration of 390 ppm (corresponding to 2010 levels) was used for the historical climate, while 499 ppm and 571 ppm were used for future climate scenarios of RCPs 4.5 and 8.5, respectively, to correspond with AgMIP protocols [28].

Table 1.
List of General Circulation Models (GCM) used in the study for the 2 sites.
2.4. Assessing the Impact of Agricultural Policy on Crop Yields in Future Production Systems
Given that the current and future government policies in the agriculture sector will influence crop productivity irrespective of climate change, the concept of Representative Agricultural Pathways [30] was applied in this study. Two RAPs were assumed; (i) an agricultural system with sustainable low growth characterized by high sustainability and associated environmental performance and policies (SDP), and (ii) an agricultural system characterized by unsustainable high growth (USDP). To quantify the policy effects, a multi-stage stakeholder (scientists, farmers, and policy makers) engagement was carried out to identify biophysical elements that would change in the future for each RAP, and the magnitude and direction of the changes were documented. The identified biophysical elements (Table 2) were incorporated into the crop model to assess the impacts of the two management pathways (SDP and USDP) on crop yield.

Table 2.
Biophysical elements identified to change under agricultural development trajectories and the magnitudes of change under the sustainable (SDP) and the unsustainable (USDP) pathways.
The main drivers of the biophysical component considered under the SDP RAP were fertiliser application, use of improved crop genotypes (Table A1 and Table A2), improved crop management and soil health (Table 2). The simulated enhanced SDP involved the application of an additional fertilizer (average of 30 kg N ha−1) above the current farmer application rates for maize in both study sites (Navrongo and Nioro du Rip). The amounts of fertiliser applied per farm were varied according to the observations of the surveys (Figure A1), and planting density was maintained at 4 plants m−2. For sorghum and millet, the farmer survey indicated that no fertiliser was applied; hence, the simulated enhanced management involved the application of 10 kg N ha−1 across farms, and the plant population was maintained at the survey values of 4 and 2 plants m−2 for sorghum and millet, respectively.
For the USDP RAP, an average of 45 kg N ha−1 was applied to maize at both sites (Navrongo and Nioro du Rip). As with SDP RAP, the amounts of fertiliser applied per farm varied based on amounts applied in the survey (Figure A1). For the SDP simulated enhanced management, the plant population was increased from 4 to 5.5 plants m−2. For sorghum and millet, the survey indicated that no fertiliser was applied by farmers. Therefore, the simulated enhanced management applied 15 kg N ha−1 across farms and the plant population increased from 4 and 2 plants m−2 to 5.5 and 3 plants m−2 for sorghum and millet, respectively. Furthermore, interactions of the multi-stage stakeholders indicated, that soil health would deteriorate under the USDP RAP. To capture this effect, the topsoil depth was reduced by 5 cm to account for surface erosion due to unsustainable practices. The cultivar modifications made to the various improved crops are indicated in Table A1 and Table A2.
2.5. Simulation of the Impact of Climate and Agricultural Policy on Crop Yields
To assess the impact of the projected climate change on the yields and the variability of the impact among farms, the AgMIP protocol for integrated assessment was followed. This approach involves the simultaneous use of information from multiple farms, multiple climate scenarios and multiple soil data to simulate yields for the various farms and climates. In addition, the information derived from the RAPs was superimposed to capture the policy effects. The assessment therefore involved three (3) sets of simulations. First, the survey data were used to set up the model to simulate crop yields for current management practices by farmers under historical climate data (1980–2009). This showed how the crop yields for each of the farms (e.g., 87 farms for maize) would have varied if the current farmer practices were operated over the historical 30-year climate conditions. Secondly, data from the farm surveys were adjusted to capture the RAP effects identified by the multi-stakeholders for the SDP and USDP (Table 2). The adjusted management conditions were then implemented in the model and the modified model was used to simulate yields over the 30-year historical period. This set of simulation runs is referred to as future production systems (without climate change). Thirdly, the RAP-modified model was used to simulate the impact of projected climate change on grain yield for the near-term using projected climate (2040–2069) data, derived from the five (5) GCMs and for the two (2) RCPs (4.5 and 8.5). The simulations for the SDP were carried out using RCP 4.5, while those for the USDP, RCP 8.5 was used, as SDP is associated with a lower emission pathway (RCP 4.5) while USDP is associated with a higher emission scenario (RCP 8.5). Planting windows were specified from May 1 to June 30 for Navrongo and from June 19 to July 31 for Nioro du Rip. Simulated planting was within 2 weeks intervals in Navrongo and weekly intervals in Nioro du Rip. For each simulation run, sowing was allowed when 25 mm of rainfall was cumulated over 3 rainfall events within the defined sowing window per farm (Figure A2). Fertiliser was applied in two splits (10 and 32 days after emergence). Soil data used for the simulations for both sites are the same as those for the evaluation (Supplementary Materials Table S1).
In summary, taking the case of maize in Navrongo, the first set of simulations involved the 30 years average yield simulated for each of the 87 farms based on management indicated in the farmer survey, referred to as . The second set simulated the 30 years average maize yield for each of the 87 farms based on the RAPs-mediated management under the historical climate, referred to here as , (i.e., historical climate data + RAPs), where v represents the type of RAPs. The overall change in crop yield under both farmers’ current situations and the RAPs-impacted yields was described as , derived as follows:
Thereafter, the grand mean (GPRAP) of change in grain yield across farms per RAP (SDP and USDP) was estimated in Equation (2), as follows:
where N is the number of farms.
To capture the effect of the farm diversity response to climate change, maize yields were simulated using the RAPs-modified model for 30 years on each farm under future climate (2040–2069) and RCPs. The yield for each farm was averaged over the 30 years and called (). The latter showed the interactive effect of GCMs x RCPs/RAPs.
The overall impact of climate change and RAPs on yield per farm () where i is farm number, j is the climate scenario and k is RCP/RAP (for the Navrongo maize example, i = 87, j = 5, k = 2). This was estimated in Equation (3) as follows:
The impact of climate change per farm was then ensembled across the 5 GCMs per RAP to obtain and the grand ensemble mean change in grain yield across farms (GMik) was estimated as follows:
The coefficient of variation (CV) was used to estimate the variability in grain yield among farms for each crop under current (survey-based management) and future production systems (RAPs-based management) for the current (historical) climate as well as future projected climate (2049–2069). The CV was estimated as follows:
The relative standard deviation (RSD) was used to estimate the variability in climate change impact among farms. It is an indicator of the dispersion of values around the mean and defined in Equation (6) as follows:
2.6. Sensitivity of Grain Yield to Weather Parameters
The sensitivity of grain yield to weather parameters (temperature, rainfall, CO2) were assessed for the two study locations. The sensitivity of grain yield to each parameter was assessed using 30 years of historical weather data. The temperature was varied from −2, 0, +2, +4, +6, +8 °C. For rainfall, the changes of 0.25, 0.5, 0.75, 1, 1.25, 1.5, 1.75 and 2 were considered, and for CO2 effect, the considered changes were 450, 540, 630 and 720 ppm.
2.7. Model Evaluation
The performance of the model in predicting grain yield were assessed using a set of statistics, namely, the Root Mean Square Error (RMSE), the Relative Root Mean Square Error (RRMSE) and the Coefficient of Model Efficiency.
The RMSE is defined in Equation (7) as follows:
The lower the RMSE, the better the model performance. The minimum value of zero implies a perfect model performance. The Relative Root Mean Square Error (RRMSE) is defined as follows:
The RRMSE values ranges between 0% and 100%. Values close to 0 are preferred.
The Model Efficiency (E1) was determined as follows:
A Model Efficiency of 1 denotes a perfect agreement between the observed and simulated data, while E1 = 0 signifies poor agreement between the observed and simulated data [31].
3. Results
3.1. Model Performance
The CERES-Sorghum and CERES-Millet models adequately reproduced the phenology (anthesis and maturity) and grain yields of millet and sorghum measured from farmer fields. Anthesis was predicted with RRMSE of 10% and 13%, while duration to physiological maturity was reproduced with RRMSE of 16% and 14% for sorghum and millet, respectively. The statistics of the evaluation of the model’s performance in reproducing grain yield are presented in Figure 1. The low RMSE suggests a generally satisfactory performance of the CERES models in reproducing grain yields from farmers’ fields. For the millet cultivar at Nioro du Rip, the model slightly overestimated grain yields. The RRMSE showed that the yields of both crops were satisfactorily reproduced by the CERES-Millet and CERES-Sorghum models with RRMSE values of less than 30%. The coefficient of model efficiency (EF) was 0.77 and 0.81 for sorghum and millet, respectively, which further indicated that the model adequately captured crop yields (Figure 1).
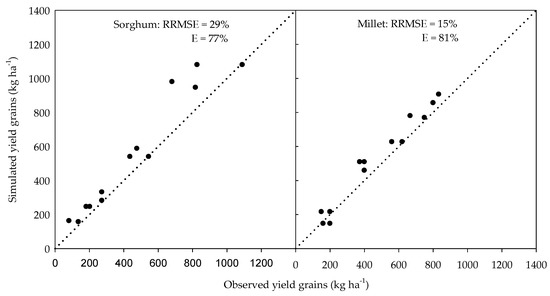
Figure 1.
Performance of the CERES-Sorghum and CERES-Millet models in simulating grain yields of sorghum and millet in smallholder systems in Navrongo, Ghana (in 2012) and Nioro du Rip, Senegal (in 2007) respectively.
3.2. Projected Changes in Temperature and Rainfall
All GCMs for each RCP agreed on the direction of change in temperature for the time slice of 2049–2069. The ensemble changes in projected temperatures for the Navrongo site were 1.50 and 2.12 °C with CVs of 22% and 21% for RCP 4.5 and RCP 8.5, respectively, while those for Nioro du Rip, Senegal were 1.44 °C and 1.88 °C with CVs of 22% and 28% under RCP 4.5 and RCP 8.5, respectively. Temperature changes under RCP 8.5 were higher than those projected for RCP 4.5 at both sites (Figure 2). Changes in the projected total rainfall varied both in magnitude and direction among the GCMs/RCPs at both study locations. For the Navrongo site in Ghana, ensemble changes in projected rainfall amount were +2.8 and +4.6% for the RCP 4.5 and RCP 8.5, respectively. For the Nioro du Rip site, the ensemble change in the rainfall amount was −11.6% for the two RCPs. Projected ensemble changes in rainfall events for the five climate scenarios were −2.6% for each of the RCPs in Navrongo with CVs of 150% and 250% (for RCP 4.5 and RCP 8.5, respectively), whereas at Nioro du Rip, the projected ensemble changes in rainfall events were −8.6% and −16.2% with CVs of 157% and 127% under RCP 4.5 and RCP 8.5, respectively.
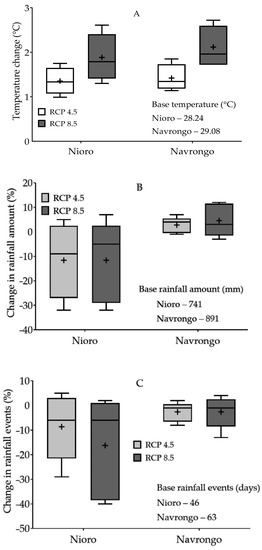
Figure 2.
Summary of average temperature (A), rainfall amounts (B) and events (C) of the five GCMs used per each of the two RCPs (4.5 and 8.5) for Navrongo, Ghana and Nioro du Rip, Senegal. Each box and whiskers plot represents the spread of five GCMs. The black crosses in the boxes represent mean values of the parameters.
3.3. Simulated Grain Yield of Cereals under Current and Future Management Practices
The distribution of the simulated average ensemble yields of the cereals (maize, sorghum and millet) for the current (historical) climate and current-SDP and USDP-mediated management practices are illustrated in Figure 3. Simulated yields under the SDP and USDP were generally higher than the farmer survey-based management with yield distributions shifting towards higher grain yields. Simulated average maize yields under the current historical climate and current farmer-based production systems were 1212 and 934 kg ha−1 for Navrongo and Nioro du Rip, respectively. The inclusion of improved RAPs-management practices, for example, modest increases in fertiliser application and planting densities, among others, resulted in increased maize yields, reaching 2421 and 2165 kg ha−1 representing yield increases of 115% and 187% at Navrongo and Nioro du Rip, respectively for the SDP pathway. Under the USDP pathway where fertiliser applications were higher, ensemble average maize yields of 2683 and 2484 kg ha−1 were simulated, representing average yield increases of 144% and 261% for Navrongo and Nioro du Rip, respectively.
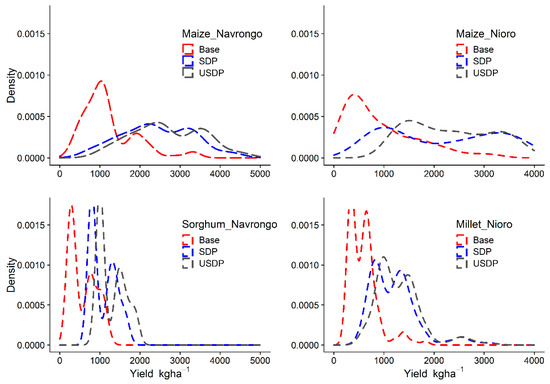
Figure 3.
Simulated distribution of average yields of maize (Navrongo and Nioro du Rip), sorghum and millet among farms under baseline management practices and projected management practices at two locations in West Africa. Millet and maize were simulated for Nioro du Rip, Senegal, while maize and sorghum were simulated for Navrongo Ghana. The distributions are 30-year averaged simulated yields (Base) and an ensemble of five GCMs for the SDP and USDP simulations. USDP is unsustainable development practices while SDP in characterised as sustainable development practices.
The variability in the simulated yields among farms under current production systems was much higher (78%) compared to those obtained under simulated future RAPs-mediated production systems (36% and 33% in Navrongo, 51% and 38% in Nioro du Rip for the SDP and USDP pathways, respectively). The response to improved management practices and cultivar also varied among farms. In Navrongo, the variations were similar under the two development pathways (31% and 34% for SDP and USDP, respectively) while those of the Nioro du Rip site were 66% and 55% for the SDP and USDP pathways, respectively.
The simulated average yield of sorghum under the current production system was 572 kg ha−1. For the future RAPs-mediated production system, simulated yields increased to 1075 and 1285kg ha−1 under SDP and USDP, respectively, in response to improved management practices and improved cultivar. These resulted in yield increases of 124% and 174% under SDP and USDP, respectively. The higher yield increase under the USDP is due to the higher fertiliser application as well as the high plant population associated with this scenario (Table 2). As with maize, variability in the yields of sorghum among farms reduced from 56% to 29% and 25% (SDP and USDP, respectively). The variability in the response to management practices was similar for the two development pathways (56% and 55% for SDP and USDP respectively).
Simulated average yield of millet was 585 kg ha−1 under the current farmer-based production system and current historical climate. This increased to 1210 and 1305 kg ha−1 when RAPs effects for SDP and USDP, respectively, were simulated. This translated into ensemble average yield increases of 114% and 135% for SDP and USDP, respectively. The variation in the response to the improved practices under SDP and USDP were 16% and 25%, respectively. The variations in the changes in ensemble simulated yields reduced from 50% under the current practices to 40% and 36% under SDP and USDP, respectively.
3.4. Impact of Future Climate Change on Grain Yield and Variation among Smallholder Farms
Figure 4 illustrates the simulated ensemble yield distribution of maize, sorghum and millet under both the current (historical) and future climate for the two RAPs (SDP and USDP) conditions. The spread of ensemble yield distributions for the SDP and USDP were generally similar for all crops. However, the simulated yields under the current climate were noticeably always higher than those under the future climate, especially for Navrongo, irrespective of the RAPs scenario.
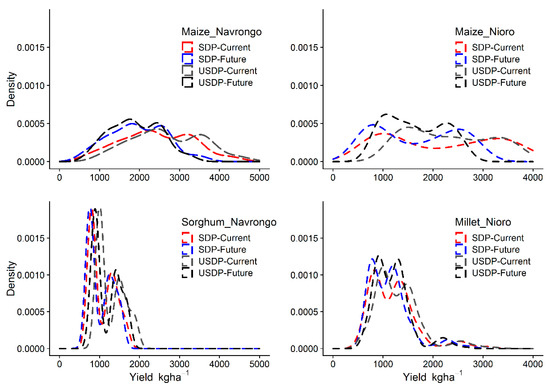
Figure 4.
Distribution of simulated grain yield of maize, sorghum and millet among farms in Navrongo, Ghana and Nioro du Rip, Senegal under current (1980–2009) and future (2040–2069) climates under future production systems (SDP and USDP). SDP is sustainable development practices while USDP is unsustainable development practices.
Simulated ensemble average maize yield among farms under future climate in Navrongo were 1954 and 1899 kg ha−1 for the SDP and USDP, respectively. In Nioro du Rip, ensemble average yields were 1659 and 1639 kg ha−1 for the SDP and USDP, respectively. These indicate a general reduction in maize grain yields across the two sites. Maize yields declined by 13% and 19% at Navrongo and 16% and 20% at Nioro du Rip under SDP and USDP, respectively. Yield reductions were higher under the USDP than the SDP at both sites, probably due to soil degradation by erosion and higher projected temperatures in RCP 8.5. This effect was included in the USDP-mediated scenario. A simulated reduction in yield in Nioro du Rip were also higher than those obtained for Navrongo. The ensemble yield reductions varied among farms (Figure 5) with an RSD of 14% and 17% in Navrongo and 32% and 36% in Nioro du Rip under the SDP and USDP, respectively.
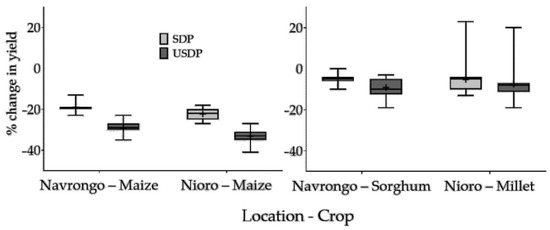
Figure 5.
Simulated variation in climate change impact on the yields of maize and sorghum in Navrongo, Ghana and the yield of maize and millet in Nioro du Rip, Senegal among farms. Each box-whisker plot covers five GCMs.
The simulated ensemble average yields of sorghum under the future climate were 1028 and 1173 kg ha−1 for the SDP and the USDP, respectively. These translated into an average negative impact (−4% and −9% under SDP and USDP, respectively) of climate change on sorghum yields under both RAPs. As with maize, the yield reduction was higher under the USDP than under the SDP. The impacts of climate change among sorghum farms varied considerably with RSD, of 38% and 42% for the SDP and the USDP, respectively, which were much higher than those obtained for maize at both sites. Thus, the variability in sorghum yields among the farms was lower under SDP than the USDP.
Simulated average millet yields under the future climate were 1131 and 1137 kg ha−1 for SDP and USDP, respectively. As with maize and sorghum, simulated yields under the future climate were always lower than those for the current climate (used as the reference datum). The average change in the yield of millet under future production systems (SDP and USDP) at Nioro du Rip were −5% and −10% for the SDP and USDP, respectively. Thus, the yield decline was higher under USDP by two units. The variability in the climate change impact among millet farms was moderately high, with an RSD of 60% and 36% under SDP and USDP, respectively. As with maize, simulated millet grain yields were higher under USDP than under SDP.
The factors contributing to the variation in the climate change impact among farms are shown on Figure 6. The relative importance of the three factors analysed (soil, amount of fertiliser and planting window) varied among crops and between sites. The magnitude of the contributions from the three factors to the variation in the climate change impact among farms were higher for Nioro du Rip than for Navrongo. For sorghum and millet, fertiliser did not contribute to yield variations among farms, as similar quantities were applied by all farms. The magnitude of impact for the planting window at Nioro du Rip was more than three-folds of that obtained in Navrongo for maize, irrespective of the RAPs.
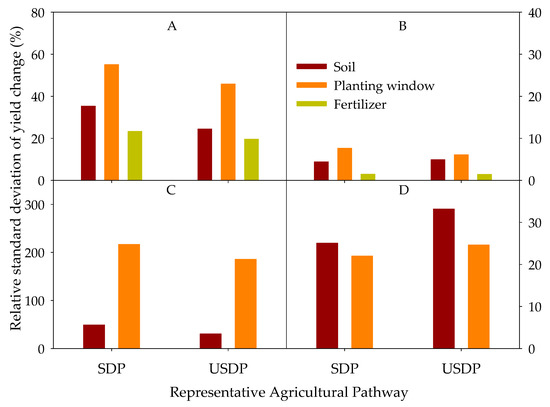
Figure 6.
The relative contribution of crop and soil management to the variation in climate change impact on maize, sorghum and pearl millet among smallholder farmers in Navrongo, Ghana and Nioro du Rip, Senegal. (A–D) are maize in Nioro du Rip, maize in Navrongo, pearl millet in Nioro du Rip and sorghum in Navrongo, respectively.
3.5. Impact of Climate Change on Duration to Flowering and Maturity
The impact of climate change resulted in the decline in the durations that plants took to flower and to mature in all crops (Figure 7). The magnitude of decline was generally higher for the USDP than the SDP. Additionally, the declines were higher for the crops at the Navrongo site than for those at Nioro du Rip. The decline in duration was also higher for the maturity than for the flowering alone, an indication that the duration of the reproductive stage also declined.
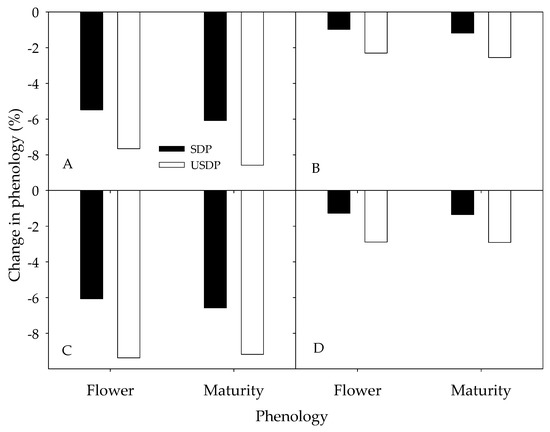
Figure 7.
Ensemble impact of climate change on phenology (flowering and maturity) on (A) maize at Navrongo (B) maize at Nioro du Rip (C) sorghum at Navrongo and (D) millet at Nioro du Rip.
3.6. Sensitivity of Grain Yield to Temperature, Rainfall and CO2 Concentration
The sensitivity of the grain yield of the crops to changes in temperature, rainfall and CO2 are presented in Figure 8, Figure 9 and Figure 10. The sensitivities generally varied annually, irrespective of the RAPs. Increasing temperatures resulted in a decline in grain yields, and this was more prominent for maize than sorghum or millet at both sites with a higher magnitude of losses. However, the variability in the sensitivity of grain yield to temperature was higher for sorghum and millet compared to maize. Grain yields of the cereals were also sensitive to varying total rainfall amounts, annually (Figure 9). Generally, grain yields declined under increasing rainfall amounts beyond the base rainfall amount. The variability in the sensitivities were generally higher across the three crops and management scenarios when rainfall amounts reduced below the base total rainfall. For the maize in Nioro du Rip, the magnitude of the yield decline was generally higher than that of Navrongo. On the other hand, the magnitude for grain yield reduction was higher for sorghum in Navrongo than for pearl millet in Nioro du Rip. The magnitude of sensitivity of the grain yield to CO2 was generally much smaller than those for temperature and total rainfall amount. Cereals may not show significant positive responses to CO2, but the differences in grain yield sensitivity to CO2 between SDP and USDP were obvious (Figure 10). For maize in Nioro du Rip, the sensitivity under SDP increased marginally, while that under USDP declined.
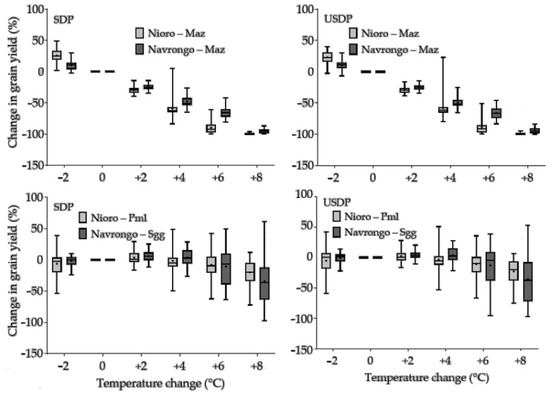
Figure 8.
Sensitivity of grain yield of cereals to varying temperature at two sites (Navrongo and Nioro du Rip). The box and whiskers plots represent variation in sensitivity annually over 30 years. ‘Maz’ is maize, ‘Sgg’ is sorghum, ‘Pml’ is pearl millet, and SDP and USDP are sustainable and unsustainable pathways, respectively.
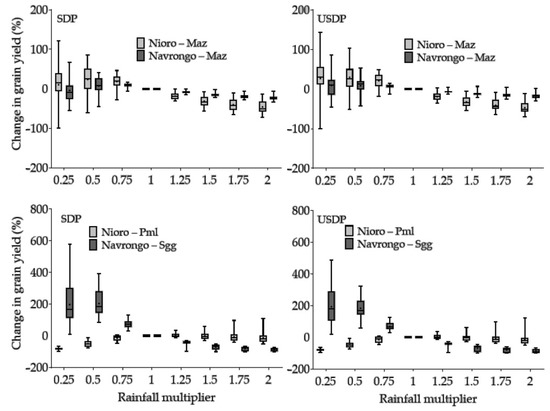
Figure 9.
Sensitivity of grain yield of cereals to varying rainfall amounts at two sites (Navrongo and Nioro du Rip). The box and whiskers plots represent variation in sensitivity annually over 30 years. ‘Maz’ is maize, ‘Sgg’ is sorghum, ‘Pml’ is pearl millet, and SDP and USDP are sustainable and unsustainable pathways, respectively.
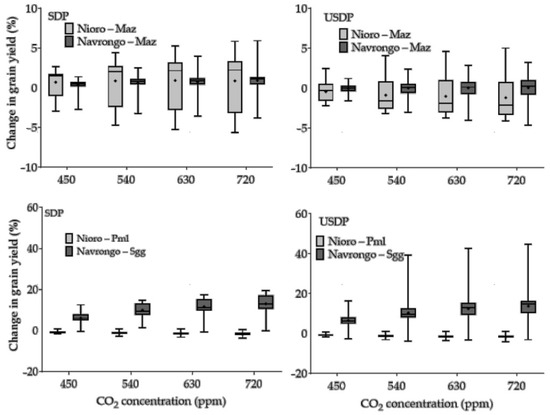
Figure 10.
Sensitivity of grain yield of cereals to varying CO2 concentrations at two sites (Navrongo and Nioro du Rip). The box and whiskers plots represent variation in sensitivity annually over 30 years. ‘Maz’ is maize, ‘Sgg’ is sorghum, ‘Pml’ is pearl millet, and SDP and USDP are sustainable and unsustainable pathways, respectively.
4. Discussion
4.1. Projected Changes in Temperature and Rainfall
The projected increases in temperatures by the selected GCMs are in agreement with those reported by Adiku et al. [2] and Sultan et al. [6] for the sub region. Changes in the projected total rainfall varied both in magnitude and direction among the GCMs/RCPs for both study locations. The inconsistencies in the direction of change in projected rainfall amounts by GCMs used in this study have been reported by other studies [2,9,32] for rainfall in West Africa.
4.2. Sensitivity of Cereal Yields to Temperature, Rainfall and CO2 Concentration
The marginal response of maize to CO2 fertilisation is in conformity with those reported by other studies in Sub-Saharan Africa (SSA). The simulated response of maize yields to increasing rainfall was also similar for both sites with the grain yield increase progressively declining with an increasing amount of rainfall (Figure 8), a phenomenon that can probably be attributed to increase leaching of nitrogen under high rainfall. Changes in the weather parameters also have the potential to influence mineralisation of organic matter, thereby influencing nutrient availability. The impact of flooding on crop yields has not been simulated in this study but can become a major factor in climate change studies. The differences in sensitivity of the crops to temperature can be explained by the differences in the temperature threshold as noted by Tsusaka and Otsuka [33] in their analysis of the effect of temperature and rainfall on the yields of cereals in SSA, reporting on the differences in the sensitivity of crops to these weather parameters.
4.3. Cereals Yields under Improved Management Scenarios
The percentage yield increases simulated are within the yield responses reported for fertiliser trials that are conducted with the recommended management practices. In an on-station 4-year trial in a similar environment in northern Ghana, Naab et al. [34] reported an average maize yield increase of about 314% when 60 kg ha−1 N fertiliser was applied. A study by Akponikpè et al. [24] also reported a yield increase of 104% for millet when 40 kg N ha−1 was applied in a two-year experiment in Niger. In a recent yield simulation study by Adam et al. [35], it was reported that yield increases of sorghum in response to improved management practices in Koutiala (Mali) and Navrongo could be attributed more to improved management practices and that focussing on intensification in these (sub-optimised) systems is currently more important than climate change impacts. Generally, the yield changes in maize, in response to management and genotype modification, were higher in Nioro du Rip than in Navrongo, even though the cultivar of maize used in Nioro du Rip had much shorter maturity duration and, hence, had lower yield potential. The length of the growing period in Nioro du Rip is also generally short, thereby limiting farmers to short and extra short maturity duration maize varieties. Additionally, the soil in Nioro du Rip is deeper and therefore has higher water storage capacity, while those in Navrongo are shallow and more prone to the leaching of nutrients. Therefore, it appears that the soil water and nutrient stress associated with shallow soils may have limited the response of crops to management practices in Navrongo.
4.4. Climate Change Impact on Crop Yields
In general, the simulated yield loss in Nioro du Rip was higher than in Navrongo. For instance, the yield loss under SDP in Nioro du Rip was three units higher than those simulated for Navrongo under a similar management scenario (SDP), even though ensemble temperature changes were lower in Nioro du Rip. This can be explained partly by the drastic reduction in the rainfall amount and events in Nioro du Rip where the length of the growing season was already much shorter than at Navrongo. The shorter maturity duration varieties used in Nioro du Rip compared to the intermediate variety used in Navrongo may also contribute to the higher yield loss in Nioro du Rip. A comparison of the historical and projected rainfall patterns show an extension of rainfall distribution in Navrongo into drier months in the historical data. Thus, late planting in the historical climate which encountered drought at the reproductive stage now benefited from the extension of rainfall into the drier months under the projected climate enabling the reproduction stages to coincide with high rainfall periods, ensuring better crop growth.
The short length of the growing season at Nioro du Rip compared to Navrongo may explain the fluctuations in yields as observed in this study, as farmers who plant late in Nioro du Rip are likely to obtain low yields in some years. Additionally, the projected decline in rainfall amounts and events are also more severe in Nioro du Rip, thereby contributing to higher uncertainty in yields among farms. Ensemble yield reductions were generally higher under USDP than under SDP. Thus, investments into crop production are likely to yield lower benefits under USDP than under SDP, in spite of the relatively higher yield increases. The more intensified smallholder systems become, the higher the impact of climate change [9,36]. The positive yield gains expected from CO2 fertilisation were generally offset by the higher temperature effect on plant growth, hence resulting in low grain yields. According to Chemura et al. [37], the agroclimatic suitability of maize and sorghum are projected to decline in Ghana due to climate change by 2050. They reported that the optimally suitable land area (51,323 km2) for maize production will decline by 14% under RCP 8.5. Similarly, for sorghum, the optimally suitable land area (66,731 km2) is projected to decline by 13% in the same time frame under the same climate scenario. Given that the population in West Africa is projected to increase by about three-fold by 2050 [1], any decline in both the optimally suitable production area and productivity poses a further threat to food security, hence requires investments in appropriate adaptation measures to offset grain yield reductions.
As with the baseline climate, the variation in grain yields under SDP was lower than that in USDP. Higher yield variability is undesirable because this denotes yield uncertainty. The better soil condition under the SDP that ensured better water and nutrient retention within the season could account for this observation. It could also be due to lower planting density coupled with lower use of fertiliser. A number of studies have attributed higher variability in yield to increased fertiliser use [19,38]. Variability in yields among farms due to climate change were similar to those under the baseline climate.
Out of the three crops simulated, maize was the most vulnerable at both study sites under the projected climate change, irrespective of the type of management scenario. This result confirms those of Faye et al. [9] and Akumaga et al. [32] who reported that millet and sorghum were less sensitive to climate change impact than maize. Policymakers’ attention needs to be drawn to this observation to inform their decision making, particularly regarding the choice of crops to promote for climate change adaptation and mitigation. Until recently, the production of maize in the semi-arid regions of West Africa has been rare. There is, however, increasing adoption of maize to the detriment of the other small grains (sorghum and millet), which hitherto were dominant in this region. These efforts have been spurred further by the advances in breeding efforts of both the CGIAR Centres and the National research systems, which resulted in the breeding of shorter maturity duration maize varieties as well as other varieties that are tolerant to stresses, such as drought, striga and nutrient deficiency.
4.5. Variation in Climate Change Impact among Smallholder Farms
This study is very unique in that it assesses the variation in climate change impact among smallholders with diverse crop management practices. Normally, a single (or few) crop management practice(s) is/are used to represent smallholder systems and a lumped single value of climate change impact is produced, a phenomenon that poses challenges for targeting adaptation planning processes which have to be implemented at the farm level. Variations in climate change impact are normally limited to the inter-annual variations, which Sultan et al. [6] reported to be on the rise in West Africa. Again, Adam et al. [35], indicated in their study that the variation in inter-annual yields was less important than the variation in yields among diverse smallholder farms in two locations in West Africa. In an earlier study, Freduah et al. [14] assessed the variability in the sensitivity of smallholder farmers to climate change and illustrated a wide variation in impact among maize farmers. This study builds on that by first developing future agricultural development (RAPs) trajectories through stakeholder engagements prior to assessing climate change impact. The two factors that contributed to the variation in climate change impact among farms are the planting date or window and the type of soil on which crops were cultivated. Given that limited access to input credit and availability of labour for cultural practices [7] have been indicated as some of the reasons for late planting, policies must aim at addressing these so as to reduce the number of farms that are planted late. Since these farms are typically characterized with lower yields in these environment [7,39], such policy interventions will ensure higher grain yield. Another reason for late planting is due to the delayed onset of rain and false start of the season, which poses challenges for farmers. To our knowledge, this study is the first to take this approach and help in envisaging potential impacts and variations in climate change impact among smallholder farmers under the two representative agricultural pathways: sustainable development practices (SDP) and unsustainable development practices (USDP) co-developed with stakeholders.
5. Conclusions
This study provides a quantification of the climate change impact on yields of cereals (maize, sorghum and millet) in two semi-arid communities in Ghana (Navrongo) and Senegal (Nioro du Rip), as well as the diversity in the magnitude of climate change among smallholder farmers under two future production systems scenarios. The nature of future production systems will influence the magnitude of the climate change impact among smallholder farmers in West Africa. Agricultural production systems with higher intensification (including the use of higher fertiliser amount) but with less emphasis on soil conservation (USDP) will be more negatively impacted by climate change than those that are relatively sustainable (SDP). Out of the three cereals studied, maize was the most vulnerable. Thus, current policies promoting maize cultivation in the semi-arid regions of West Africa need to consider its relative vulnerability to climate change compared to the smaller grains (sorghum and pearl millet). Climate change impacts are generally varied widely among farms irrespective of future management scenarios. Variation in planting time was the main factor contributing to the diversity of climate change impact among farms, followed by the type of soil on which the crops were cultivated. The interaction between the planting date and climate change impact provides opportunity for agricultural scientists, as well as policy and decision makers, to develop appropriate adaptation packages that target the diversity in the smallholder landscape.
Supplementary Materials
The following are available online at https://www.mdpi.com/article/10.3390/su13095191/s1, Table S1: Soil parameters used in simulations for Nioro, Senegal and Navrongo, Ghana.
Author Contributions
Conceptualization, D.S.M., M.A., M.L., P.S.T. and S.G.K.A.; methodology, D.S.M., M.A., B.S.F., M.L., P.S.T. and S.G.K.A.; validation, D.S.M., B.S.F., B.Y.F.-M. and P.A.Y.A.; formal analysis, D.S.M., M.A., B.Y.F.-M., P.A.Y.A., and S.G.K.A.; investigation, D.S.M., B.S.F., B.Y.F.-M., P.A.Y.A., M.L. and S.G.K.A.; resources, D.S.M., and P.S.T.; data curation, D.S.M., B.S.F., B.Y.F.-M., P.A.Y.A., M.L.; writing—original draft preparation, D.S.M.; writing—review and editing, D.S.M., M.A., B.S.F., B.Y.F.-M., P.A.Y.A., M.L., P.S.T. and S.G.K.A.; visualization, D.S.M. and B.S.F.; supervision, D.S.M. and M.A.; project administration, D.S.M.; funding acquisition, D.S.M., M.A., P.S.T. All authors have read and agreed to the published version of the manuscript.
Funding
This research was funded by the United Kingdom UKaid of the Department for International Development (DFID), grant number GB-1-202108.
Institutional Review Board Statement
Not applicable.
Informed Consent Statement
Not applicable.
Data Availability Statement
The data presented in this study are available on request from the corresponding author. The data is not yet publicly available due to efforts at publishing it in a data journal.
Acknowledgments
The authors acknowledge the research support provided by AgMIP and Columbia University and the sub-grant provided to CIWARA for this study.
Conflicts of Interest
The authors declare no conflict of interest.
Appendix A

Table A1.
Genetic coefficients of maize varieties used in the study and their corresponding improved varieties for each site.
Table A1.
Genetic coefficients of maize varieties used in the study and their corresponding improved varieties for each site.
| Genetic Coefficient | Definition | Maize Nioro du Rip | Maize Navrongo | ||
|---|---|---|---|---|---|
| TZEEY-SRBC5 | TZEEY-SRBC5-1 | Obatanpa | Obatanpa_1 | ||
| P1 | Thermal time from seedling emergence to the end of the juvenile phase | 250 | 200 | 280 | 224 |
| P5 | Thermal time from silking to physiological maturity | 720 | 770 | 837 | 893 |
| G2 | Maximum possible number of kernels per plant | 850 | 1020 | 540 | 648 |
| G3 | Kernel filling rate (mg/day) | 8 | 8 | 7.5 | 7.5 |
| PHINT | Phylochron interval; thermal time (degree days) between successive leaf tip appearances | 55 | 55 | 40 | 40 |

Table A2.
Genetic coefficients of sorghum and millet varieties used in the study and their corresponding improved varieties used in simulation of future production systems for each site.
Table A2.
Genetic coefficients of sorghum and millet varieties used in the study and their corresponding improved varieties used in simulation of future production systems for each site.
| Genetic Coefficient | Definition | Millet | Sorghum | ||
|---|---|---|---|---|---|
| CIVT | CIVT-1 | ICSV_III | ICSV_III-2 | ||
| P1 | Thermal time from seedling emergence to the end of the juvenile phase (degree days) | 491 | 392.8 | 470 | 423 |
| P2O | Critical photoperiod (hours) | 12.4 | 12.4 | 12.6 | 12.6 |
| P2R | Photoperiod sensitivity (degree days) | 142 | 142 | 0.01 | 0.01 |
| P5 | Thermal time grain filling to physiological maturity | 300 | 398.2 | 620 | 661.5 |
| G1 | Scaler for relative leaf size | 1 | 1 | 21 | 21 |
| G4 | Scaler for partitioning of assimilates to the panicle (head) | 0.7 | 0.77 | ||
| PHINT | Phylochron interval (degree days) | 65 | 65 | 65 | 65 |
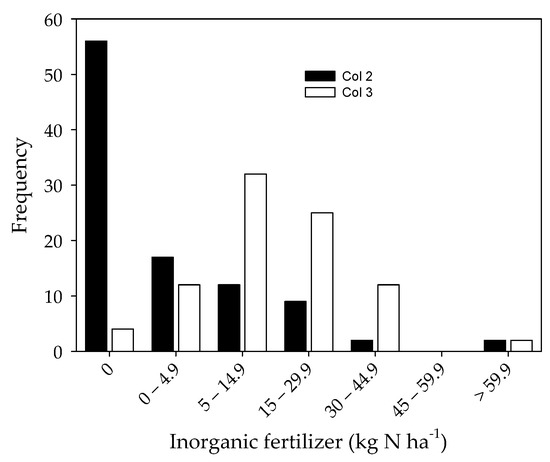
Figure A1.
Distribution of fertiliser used for maize in the agronomic survey of smallholders in Navrongo, Ghana (2012) and Nioro du Rip, Senegal (2007).
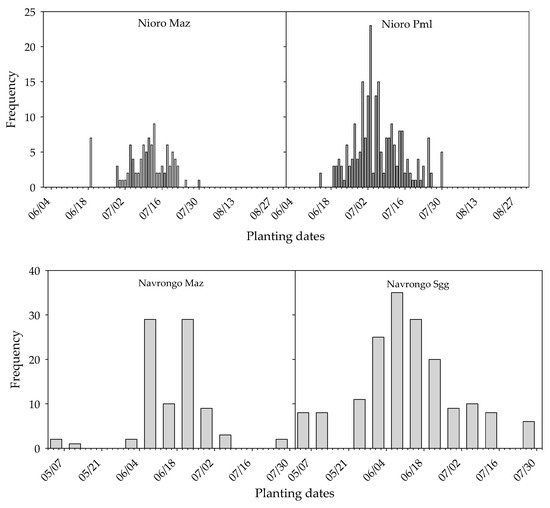
Figure A2.
Distribution of planting dates in agronomic survey data of smallholders in Navrongo, Ghana (2012) and Nioro du Rip, Senegal (2007). Maz, Pml, Sgg are maize, pearl millet and sorghum respectively.
References
- Defrance, D.; Sultan, B.; Castets, M.; Famien, A.M.; Baron, C. Impact of climate change in West Africa on cereal production per capita in 2050. Sustainability 2020, 12, 7585. [Google Scholar] [CrossRef]
- Adiku, S.G.K.; MacCarthy, D.S.; Hathie, I.; Diancoumba, M.; Freduah, B.S.; Amikuzuno, J.; Traore, P.S.; Traore, S.; Koomson, E.; Agali, A.; et al. Climate change impacts on west african agriculture: An integrated regional assessment (CIWARA). The Agricultural Model Intercomparison and Improvement Project (AgMIP) Integrated Crop and Econmic Assessments, Part 2. In Handboo of Climate Change and Agroecosystems, ICP Series on Climate Change Impacts, Adaptation and Mitigation; Rosenzweig, C., Hillel, D., Eds.; Imperial College Press: London, UK, 2015; pp. 25–73. [Google Scholar]
- Sultan, B.; Gaetani, M. Agriculture in West Africa in the twenty-first century: Climate change and impacts scenarios, and potential for adaptation. Front. Plant Sci. 2016, 7, 1262. [Google Scholar] [CrossRef]
- Sorgho, R.; Quiñonez, C.A.M.; Louis, V.R.; Winkler, V.; Dambach, P.; Sauerborn, R.; Horstick, O. Climate change policies in 16 west african countries: A systematic review of adaptation with a focus on agriculture, food security, and nutrition. Int. J. Env. Res. Public Health 2020, 17, 8897. [Google Scholar] [CrossRef]
- Owusu, K.; Waylen, P.; Qiu, Y. Changing rainfall inputs in the Volta basin: Implications for water sharing in Ghana. GeoJournal 2008, 71, 201–210. [Google Scholar] [CrossRef]
- Sultan, B.; Guan, K.; Kouressy, M.; Biasutti, M.; Piani, C.; Hammer, G.; McLean, G.; Lobell, D.B. Robust features of future climate change impacts on sorghum yields in West Africa. Env. Res. Lett. 2014, 9, 104006. [Google Scholar] [CrossRef]
- Traore, B.; Corbeels, M.; Van Wijk, M.T.; Rufino, M.C.; Giller, K.E. Effects of climate variability and climate change on crop production in southern Mali. Eur. J. Agron. 2013, 49, 115–125. [Google Scholar] [CrossRef]
- Sultan, B.; Defrance, D.; Iizumi, T. Evidence of crop production losses in West Africa due to historical global warming in two crop models. Sci. Rep. 2019, 9, 1–15. [Google Scholar]
- Faye, B.; Webber, H.; Naab, J.B.; MacCarthy, D.S.; Adam, M.; Ewert, F.; Lamers, J.P.; Schleussner, C.-F.; Ruane, A.; Gessner, U. Impacts of 1.5 versus 2.0 C on cereal yields in the West African Sudan Savanna. Env. Res. Lett. 2018, 13, 034014. [Google Scholar] [CrossRef]
- Sonneveld, B.; Keyzer, M.; Adegbola, P.; Pande, S. The impact of climate change on crop production in west Africa: An assessment for the oueme river basin in Benin. Water Resour. Res. 2012, 26, 553–579. [Google Scholar] [CrossRef]
- Roudier, P.; Sultan, B.; Quirion, P.; Berg, A. The impact of future climate change on West African crop yields: What does the recent literature say? Glob. Environ. Chang. 2011, 21, 1073–1083. [Google Scholar] [CrossRef]
- Sultan, B.; Roudier, P.; Quirion, P.; Alhassane, A.; Muller, B.; Dingkuhn, M.; Ciais, P.; Guimberteau, M.; Traore, S.; Baron, C. Assessing climate change impacts on sorghum and millet yields in the Sudanian and Sahelian savannas of West Africa. Environ. Res. Lett. 2013, 8, 014040. [Google Scholar] [CrossRef]
- Singh, P.; Nedumaran, S.; Ntare, B.; Boote, K.J.; Singh, N.P.; Srinivas, K.; Bantilan, M. Potential benefits of drought and heat tolerance in groundnut for adaptation to climate change in India and West Africa. Mitig. Adapt. Strateg. Glob. Chang. 2014, 19, 509–529. [Google Scholar] [CrossRef]
- Freduah, B.S.; MacCarthy, D.S.; Adam, M.; Ly, M.; Ruane, A.C.; Timpong-Jones, E.C.; Traore, P.S.; Boote, K.J.; Porter, C.; Adiku, S.G. Sensitivity of maize yield in smallholder systems to climate scenarios in semi-arid regions of West Africa: Accounting for variability in farm management practices. Agronomy 2019, 9, 639. [Google Scholar] [CrossRef]
- Jones, J.W.; Hoogenboom, G.; Porter, C.H.; Boote, K.J.; Batchelor, W.D.; Hunt, L.; Wilkens, P.W.; Singh, U.; Gijsman, A.J.; Ritchie, J.T. The DSSAT cropping system model. Eur. J. Agron. 2003, 18, 235–265. [Google Scholar] [CrossRef]
- Ritchie, J.T. Soil water balance and plant water stress. In Understanding Options for Agricultural Production; Springer: Dordrecht, The Netherlands, 1998; pp. 41–54. [Google Scholar]
- Porter, C.H.; Jones, J.W.; Adiku, S.; Gijsman, A.J.; Gargiulo, O.; Naab, J. Modeling organic carbon and carbon-mediated soil processes in DSSAT v4. 5. Oper. Res. 2010, 10, 247–278. [Google Scholar]
- Soler, C.M.T.; Sentelhas, P.C.; Hoogenboom, G. Application of the CSM-CERES-Maize model for planting date evaluation and yield forecasting for maize grown off-season in a subtropical environment. Eur. J. Agron. 2007, 27, 165–177. [Google Scholar] [CrossRef]
- MacCarthy, D.S.; Adiku, S.G.; Freduah, B.S.; Gbefo, F. Using CERES-Maize and ENSO as decision support tools to evaluate climate-sensitive farm management practices for maize production in the northern regions of Ghana. Front. Plant Sci. 2017, 8, 31. [Google Scholar] [CrossRef]
- MacCarthy, D.S.; Kihara, J.; Masikati, P.; Adiku, S.G. Decision support tools for site-specific fertilizer recommendations and agricultural planning in selected countries in sub-Sahara Africa. Nutr. Cycl. Agroecosyst. 2018, 110, 343–359. [Google Scholar] [CrossRef]
- Badu-Apraku, B.; Twumasi-Afriyie, S.; Sallah, P.; Haag, W. Registration of’Obatanpa GH’maize. Crop Sci. 2006, 46, 1393. [Google Scholar] [CrossRef]
- Badu-Apraku, B.; Menkir, A.; Fakorede, M.; Ajala, S.; Ellis-Jones, J. Building Partnerships and Encouraging Innovation for Sustainable Maize Production: The West and Central Africa Collaborative Maize Research Network, Achievements and Impact; International Institute of Tropical Agriculture: Ibadan, Nigeria, 2012. [Google Scholar]
- Murty, D.; Nwasike, C.; Atokple, I. Registration ofICSV 111’Sorghum Cultivar. Crop Sci. 1998, 38, 1716–1717. [Google Scholar] [CrossRef]
- Akponikpè, P.I.; Gérard, B.; Michels, K.; Bielders, C. Use of the APSIM model in long term simulation to support decision making regarding nitrogen management for pearl millet in the Sahel. Eur. J. Agron. 2010, 32, 144–154. [Google Scholar] [CrossRef]
- MacCarthy, D.S.; Vlek, P.L.; Bationo, A.; Tabo, R.; Fosu, M. Modeling nutrient and water productivity of sorghum in smallholder farming systems in a semi-arid region of Ghana. Field Crop. Res. 2010, 118, 251–258. [Google Scholar] [CrossRef]
- Batjes, N.H. Harmonized soil profile data for applications at global and continental scales: Updates to the WISE database. Soil Use Manag. 2009, 25, 124–127. [Google Scholar] [CrossRef]
- MacCarthy, D.S.; Sommer, R.; Vlek, P.L. Modeling the impacts of contrasting nutrient and residue management practices on grain yield of sorghum (Sorghum bicolor (L.) Moench) in a semi-arid region of Ghana using APSIM. Field Crop. Res. 2009, 113, 105–115. [Google Scholar] [CrossRef]
- Rosenzweig, C.; Jones, J.W.; Hatfield, J.L.; Ruane, A.C.; Boote, K.J.; Thorburn, P.; Antle, J.M.; Nelson, G.C.; Porter, C.; Janssen, S. The agricultural model intercomparison and improvement project (AgMIP): Protocols and pilot studies. Agric. For. Meteorol. 2013, 170, 166–182. [Google Scholar] [CrossRef]
- Ruane, A.C.; McDermid, S.P. Selection of a representative subset of global climate models that captures the profile of regional changes for integrated climate impacts assessment. Earth Perspect. 2017, 4, 1–20. [Google Scholar] [CrossRef]
- Valdivia, R.O.; Antle, J.M.; Rosenzweig, C.; Ruane, A.C.; Vervoort, J.; Ashfaq, M.; Hathie, I.; Tui, S.H.-K.; Mulwa, R.; Nhemachena, C.; et al. Representative Agricultural Pathways and Scenarios for Regional Integrated Assessment of Climate Change Impacts, Vulnerability, and Adaptation; Imperial College Press: London, UK, 2015; Volume 3, pp. 101–156. [Google Scholar]
- Legates, D.R.; McCabe Jr, G. Evaluating the use of “goodness-of-fit” measures in hydrologic and hydroclimatic model validation. Water Resour. Res. 1999, 35, 233–241. [Google Scholar] [CrossRef]
- Akumaga, U.; Tarhule, A.; Piani, C.; Traore, B.; Yusuf, A.A. Utilizing process-based modeling to assess the impact of climate change on crop yields and adaptation options in the Niger River Basin, West Africa. Agronomy 2018, 8, 11. [Google Scholar] [CrossRef]
- Tsusaka, T.W.; Otsuka, K. The changes in the effects of temperature and rainfall on cereal crop yields in Sub-Saharan Africa: A country level panel data study, 1989 to 2004. Environ. Econ. 2013, 4, 70–80. [Google Scholar]
- Naab, J.; Mahama, G.; Koo, J.; Jones, J.; Boote, K. Nitrogen and phosphorus fertilization with crop residue retention enhances crop productivity, soil organic carbon, and total soil nitrogen concentrations in sandy-loam soils in Ghana. Nutr. Cycl. Agroecosyst. 2015, 102, 33–43. [Google Scholar] [CrossRef]
- Adam, M.; MacCarthy, D.S.; Traoré, P.C.S.; Nenkam, A.; Freduah, B.S.; Ly, M.; Adiku, S.G. Which is more important to sorghum production systems in the Sudano-Sahelian zone of West Africa: Climate change or improved management practices? Agric. Syst. 2020, 185, 102920. [Google Scholar] [CrossRef]
- Falconnier, G.N.; Corbeels, M.; Boote, K.J.; Affholder, F.; Adam, M.; MacCarthy, D.S.; Ruane, A.C.; Nendel, C.; Whitbread, A.M.; Justes, É. Modelling climate change impacts on maize yields under low nitrogen input conditions in sub-Saharan Africa. Glob. Chang. Biol. 2020, 26, 5942–5964. [Google Scholar] [CrossRef] [PubMed]
- Chemura, A.; Schauberger, B.; Gornott, C. Impacts of climate change on agro-climatic suitability of major food crops in Ghana. PLoS ONE 2020, 15, e0229881. [Google Scholar] [CrossRef]
- Hou, P.-F.; Chang, Y.-T.; Lai, J.-M.; Chou, K.-L.; Tai, S.-F.; Tseng, K.-C.; Chow, C.-N.; Jeng, S.-L.; Huang, H.-J.; Chang, W.-C. Long-Term effects of fertilizers with regional climate variability on yield trends of sweet corn. Sustainability 2020, 12, 3528. [Google Scholar] [CrossRef]
- Kamara, A.Y.; Ekeleme, F.; Chikoye, D.; Omoigui, L.O. Planting date and cultivar effects on grain yield in dryland corn production. Agron. J. 2009, 101, 91–98. [Google Scholar] [CrossRef]
Publisher’s Note: MDPI stays neutral with regard to jurisdictional claims in published maps and institutional affiliations. |
© 2021 by the authors. Licensee MDPI, Basel, Switzerland. This article is an open access article distributed under the terms and conditions of the Creative Commons Attribution (CC BY) license (https://creativecommons.org/licenses/by/4.0/).