Abstract
The Mediterranean freshwater resources, mostly represented by groundwater, are under increasing pressure due to natural and anthropogenic factors. In this study, we investigated possible negative effects of climate change and land-use practices on water quality and availability from five springs in the karstic catchments in southern Croatia. The investigated springs are used in the regional public water supply system. Firstly, we employed hydrogeochemical field and laboratory analyses to detect possible traces of anthropogenic activity originating from specific land use. Additionally, we performed hydrological and climate modeling to detect changes in the air temperature, precipitation, and runoff. In particular, we used three regional climate models (Aladin, RegCM3, and Promes). The results estimated an increase in the mean annual air temperature, changes in the precipitation patterns, and reductions in runoff in the study area. Hydrochemical analyses showed standard ion concentrations for karst groundwaters, elevated sulfates due to evaporite deposits in the hinterland, surprisingly low nitrate levels which disproved expected agricultural pollution, and high microbiological activity. Significant water losses are expected in the near future which require immediate attention in order to develop adaptation strategies that focus on sustainable utilization and resilience of freshwater resources. This paper was based on the Interreg Central Europe PROLINE-CE project research in the South Dalmatia.
Keywords:
hydrogeology; karst; land use; climate change; hydrogeochemistry; hydrological modeling; Dalmatia 1. Introduction
Sustainable management of fresh water resources is one of the key environmental challenges of the 21st century. Degradation of its quality or unsustainable management of its quantity can cause environmental and social issues, leading to great consequences. Water quality is affected by various natural and/or anthropogenic factors, and their relative influence changes depending on the scale of observation and the investigated time span [1]. Among anthropogenic factors, land-use practices and changes are often the main drivers of the degradation of water quality [2]. Land use describes the function and processes that take place on the land, while land-use change describes the processes by which natural land is transformed by human activity [3]. The last two centuries have been characterized by rapid industrialization and global population growth that intensified negative land-use change and unsustainable practices, such as: (i) the expansion of artificial surfaces and agricultural areas on the account of forest and wetland areas, (ii) poor waste management, and (iii) unmonitored use of plant protection products. Unsustainable and improper land practices could be reflected in: (i) the degradation of water quality and availability, (ii) changes in the spring yield, (iii) reduction of infiltration, (iv) more frequent and intensive flood waves, (v) variations of local climate, and (vi) an increase in pollution, nutrient, and sediment load in groundwater and surface water. In practice, it is difficult to quantify a single effect, but rather an overall assessment of environmental impacts induced by land-use changes or improper practices could be derived. Song et al. [4] estimated that 60% of all land-use changes are associated with direct human activities, and the other 40% with indirect drivers such as climate change. Global warming, as the most harmful environmental manifestation of climate change, could significantly contribute to the deterioration of the quality and availability of fresh water resources in certain areas. Since the impacts of climate change differ among various regions and types of environment, there is a need for a detailed analysis of meteorological parameters (e.g., air temperature and precipitation) from point data or gridded datasets to determine climate change or variability on the local scale. Sustainable management of fresh water resources relies on hydrological modeling and accurate forecast, which requires a long time series of meteorological data measured over a dense monitoring network [5].
The Mediterranean region is characterized by geographical, geological, biological, and cultural diversity; however, the region has undergone a significant landscape transformation in the last decades. Depopulation and abandonment of inland and mountainous areas, primarily due to socio-economic reasons, resulted in the urban sprawl and concentration of population along the coasts. This led to unattended land cover overgrown with foliage and poses a serious fire hazard. In 1995, coastal areas of the Mediterranean had three times more urban agglomeration (>10,000 persons) than in 1950 [6]. In many areas, the development and expansion of the essential urban infrastructure (i.e., sewage systems, landfills, and water supply systems) did not correspond to the tempo of the population growth and seasonal demands, adding up to the high inherent vulnerability of groundwater resources in the Mediterranean region, especially in karstic areas. Furthermore, the Mediterranean region is one of the hotspots of climate change [7]. Several authors reported that the increasing trends in air temperature in the Mediterranean region were higher than the global values [8,9,10,11]. These trends, coupled with a gradual decrease in precipitation and an increase in spatial and temporal variability could have a negative influence on the water balance [12,13]. Rađa et al. [14] estimated that 20% of the Mediterranean population lives under permanent water stress. In certain areas, this condition is aggravated by a high seasonal increase in fresh water demand due to intensive summer tourism. Land-use changes could also add to climate change. Millán [15] described the link between land-use changes in coastal and mountain areas of the Mediterranean and shifts in weather patterns, i.e., movement of summer storms further inland, resulting in increased frequency and intensity of floods in Central Europe. At the same time, he evidenced the surge of drought areas in the Mediterranean region.
Groundwater resources in Croatia are generally characterized by good quality and sufficient quantity [16]. However, they are under increasing pressure due to climate change, improper land-use practices on a catchment scale, high seasonal demand, unsustainable utilization, and user conflicts. Almost half of the Croatian territory is in karstic terrain and karst aquifers represent an important drinking water resource. As their permeability stems from dissolution of carbonate rocks, intricate crack and fissure networks are formed that enable fast infiltration and transport of water and associated contaminants [17]. Groundwater residence time, i.e., the amount of time a water molecule takes from recharge to discharge in the aquifer, affects the availability of pollutants and depends greatly on the retardation mechanisms such as ion exchange, complexation, adsorption, and acid-base reactions, just to name a few. Since karst areas are more prone to environmental impact problems, the need for water protection through an integrated management approach is especially pronounced [18,19,20]. Among land-use practices, agricultural activities generate the most significant negative changes in water quality and availability, as the excessive application of fertilizers creates a surplus of nitrates, phosphates, chemical residues, and insoluble mineral particles which become infiltrated into the groundwater, surface water, and soil (Figure 1). A global trend of fertilizer consumption increase over the years has changed the nutrient composition of runoff and leachate resulting in groundwater, surface water, and soil quality deterioration [21,22,23].

Figure 1.
Conceptual diagram of pressures on water quality in respect to climate change and land-use impact.
The diagram in Figure 1 shows the various stresses that impact water resources. In the coming years, adverse climate change influence will only continue to grow and more severe floods, heat waves, and consequential water losses are to be expected. Land misuse through extensive clear cut of the forested areas which obstruct evapotranspiration, urban impervious surfaces that hinder water infiltration, pesticide and fertilizer overuse, and industrial leachate discharge have a detrimental effect on the quality of water. Additionally, the lack of sanitary protection zone implementation on any jurisdictional level poses a grave issue for the proper resource preservation. Therefore, it is essential to adjust to the changing climate by lessening the harmful anthropogenic effect and adapting a more sustainable approach.
This study aims to provide a hydrogeological and hydrological characterization of the regional karstic groundwater resources in southern Croatia, and to assess the impacts of climate change and land-use practices on its quality and quantity. To detect the pollution originating from various types of land use (e.g., agricultural, urban), we conducted hydrogeochemical analyses and in situ measurements on groundwater samples from five springs in southern Croatia. Therefore, it is necessary to demonstrate how the hydrochemical parameters could be used as indicators of catchment processes [24]. Furthermore, we employed hydrological modeling to determine the impacts of imminent climate change on water resource quantities. The investigations were carried out within the scope of the PROLINE-CE project, funded by the transnational cooperation program Interreg Central Europe.
2. Study Area
2.1. Geographical Setting
The study area is located in the south of Croatia, in the region of Dalmatia (Figure 2). It is a relatively narrow belt on the eastern shore of the Adriatic Sea, characterized by a well-indented coastline and 79 islands parallel or subparallel to the coast.
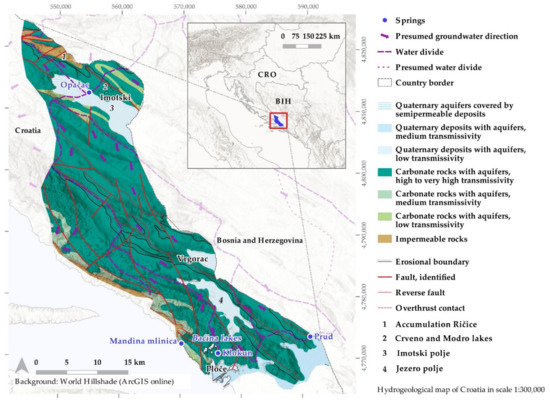
Figure 2.
Hydrogeological map of the study area with geographic setting.
The study area was divided into two parts: (i) Imotski polje in the northern part, and (ii) Prud, Klokun, and Mandina mlinica spring catchments in the southern part (Figure 2). Imotski polje was singled out as an individual area due to the characteristics of karst polje, i.e., a closed limestone depression (plateau), usually with springs on one side of the polje and ponors (steep-sided swallow-holes) on the other side [19]. Prud, Klokun, and Mandina mlinica were clustered together due to their proximity and the overlapping catchment areas. The climate in the northern part is characterized by the transition between the Mediterranean and sub-Mediterranean climate, with cold, humid winters, and very dry, warm summers. The climate in the southern part is the Mediterranean climate with mild, humid winters, and hot, dry summers. Mean annual air temperature in the period from 1961 to 1990 was 12.2 °C and 12.7 °C, and mean annual precipitation was 1402 mm and 1424 mm in Imotski polje and catchments of Prud, Klokun, and Mandina mlinica, respectively. The vegetation cover is the typical Mediterranean, with dominant holm oak, Aleppo pine, Dalmatian black pine, maquis shrubs, and garrigue [25,26].
2.2. Hydrogeological and Hydrological Settings
The region of the study area belongs to the geotectonic unit of External Dinarides, which are a part of the Dinaric mountain system [27]. Mesozoic carbonate rocks that are characterized by very deep and irregular karstification prevail. As a result of the dissolution of carbonate rock mass by water, specific karst morphological forms, such as karrens, dolines, caves, pits, and ponors are formed. The study area is characterized by an extremely complex geological setting that results in its heterogeneous hydrogeological setting. Permeable deposits are primarily represented by Cretaceous limestones and dolomites in which karst aquifers were formed. Impermeable flysch deposits, located along the coast and to the north of Imotski polje, represent the regional hydrogeological barrier and play a significant role in which they prevent major groundwater outflows to the sea, and divert groundwater flow in a general direction of NW-SE towards the southern part of the study area [18] (Figure 2).
Imotski polje is dominantly made of Cretaceous limestones. The infiltration of meteoric water is quick due to the high porosity/permeability of the formations as a result of the intense rock fracturing and the superimposed karstification. Quaternary alluvial deposits (sand, gravel, loam mixed with terra rossa and humus) up to 100 m thick, represent a low permeability lateral barrier to the groundwater flow (Figure 2). The largest and most significant spring in Imotski polje is Opačac, which is formed at the contact between the permeable carbonate formations and the impermeable Quaternary cover. It is the main spring feeding the Vrljika River, which is the main recipient in the area. The mean annual discharge measured at Opačac from 1989 to 2001 was 6.62 m3/s [28]. The spring is utilized for the water supply of Imotski and the surrounding hinterland (approximately 15,000 inhabitants) and the abstraction rates are up to 0.2 m3/s [29]. The major part of the Opačac catchment is located in the neighboring Bosnia and Herzegovina. Significant changes in the hydrological regime of Imotski polje were induced by the construction of the accumulation Ričice. Despite the water regulation infrastructure, a large part of Imotski polje is still susceptible to periodical flooding. Along its northwestern edge, the world-renowned karst hydrogeological phenomena of Crveno and Modro lakes are located. These lakes, hosted in deep pits, testify to the complex processes that shape the karstic environment and represent the outstanding site of natural heritage, which is under evaluation for obtaining the status of UNESCO Global Geopark.
Prud, Klokun, and Mandina mlinica are the most important springs of the southern part of the study area. These springs have a vast recharge area that extends deeply into the neighboring Bosnia and Herzegovina and it is mostly made of karstified carbonate rocks. The area is characterized by numerous karst features such as estavelles, ponors, poljes, and sinking rivers. Unlike in the Imotski polje, the surface hydrographic network is poor and is usually associated with rivers in karst poljes. The only exception is Baćina lakes, a morphological depression where seven lakes occur with a total surface area of 1.38 km2. Baćina lakes are important from the aspect of flood mitigation, as they receive excess flood waters from the Jezero polje to the north and discharge them into the sea near Ploče to the south through two hydrotechnical tunnels.
Prud is located in the easternmost boundary of the study area. It is a spring of the river Norin, a right tributary of Neretva, the largest river in the region. The minimum and maximum discharge of Prud ranges from 2.5 m3/s to 20 m3/s [30,31]. Abstraction rates for public water supply at Prud are up to 0.382 m3/s [29], and the water is distributed to the cities of Metković and Opuzen, and through the submarine pipeline to the islands of Korčula, Mljet, Lastovo, and to the Pelješac peninsula. Occasionally, Prud exhibits increased chloride concentrations as a result of the hydraulic contact and mixing with the Neretva River, in which the seawater intrusion is very pronounced due to natural and anthropogenic factors (e.g., hydropower plants). Additionally, the construction of irrigation canals has increased the vulnerability to seawater intrusion even further [31,32].
Klokun is located in the southern part of the study area. Its average discharge in the period from 1999 to 2013 was 1.4 m3/s, and the minimum was 0.13 m3/s [31]. Abstraction rates for the public water supply of Ploče city and Gradac municipality are up to 0.170 m3/s [29]. Klokun is not susceptible to seawater intrusions due to its distance from the sea, but it is prone to turbidity during heavy rain.
Mandina mlinica is a cluster of coastal springs situated along the Žrnovnica bay and several vruljas (submarine karst springs) that are visible only during high discharge. The majority of springs are brackish due to the contact with seawater. The spring with the lowest chlorinity was utilized in the past for the public water supply of Gradac municipality, however, it was discontinued due to salinization issues in the summer months and the introduction of Klokun into the water supply system. In the summer of 2015, the spring was put to use to fill the water carrier ships that were used to supply the Hvar Island due to the water shortage. The total discharge from the Mandina mlinica springs ranges from 0.5 to 4 m3/s, and they are prone to increased turbidity during heavy rain. Tracer test has shown a direct connection of the discharged water in the Žrnovnica bay with waters from the Jezero polje [33]. In this study, we investigated two springs from the site, i.e., Mandina mlinica spring (MMS) and Mandina mlinica abstraction site (MMA).
2.3. Land Use and Practices
The study area is dominantly covered by forest and seminatural areas, i.e., broad-leaved forest, transitional woodland-shrub, sclerophyllous vegetation, and natural grassland (Figure 3). Agricultural areas, with arable land, permanent crops, and pastures are mostly concentrated in karst poljes, characterized by fertile soils, gentle relief, and water availability. Despite the high irrigation potential, Croatia is amongst the lowest-irrigated countries in the EU, as less than 1% of agricultural land and less than 10% of irrigable land is irrigated [34]. In the study area, irrigation is usually performed by rudimentary canals from the rivers in karst poljes. Artificial areas (i.e., urban areas) do not cover a significant portion of the land. The majority of the population is located in the cities of Imotski, Vrgorac, Ploče, and Metković. A smaller percentage lives in the scattered rural or coastal environment. Regarding industry and transport, the most significant infrastructure is the state highway that passes through the entire study area, the port of Ploče, and several smaller quarries. Wetland areas are represented by Prološko blato in Imotski polje, and inland marshes in the southern part of the study area. These areas are important from the aspect of flood mitigation, as they can retain floodwaters. Regarding the legal protection of water resources, Opačac and Prud springs are protected by the drinking water protection zones (DWPZ in further text). In Croatia, DWPZs for fractures and karstified aquifers are divided into four zones: (i) zone of strict protection regime and surveillance, (ii) zone of strict limitation and surveillance, (iii) zone of limitation and surveillance, and (iv) zone of limitation. Each zone has its characteristic limitations on permitted activities and practices, which are defined by the Croatian Republic’s Ordinance on the conditions for the establishment of sanitary protection zones.
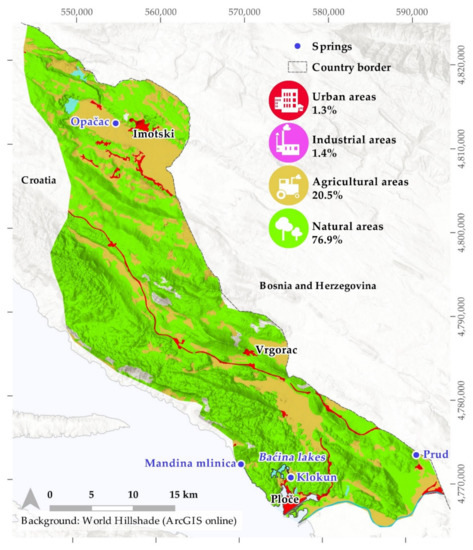
Figure 3.
Land use in the study area [36].
In Imotski polje, the dominant agricultural crop is grape for wine production, followed by various fruits and vegetables. Wine cultivars do not require extensive irrigation and are very resistant to floods. In Croatia, vineyards constitute only 3.6% of the arable land, and approximately 32% of the total pesticide use is related to their production [35]. In particular, inorganic copper or sulfur-based fungicides are most commonly used. Furthermore, grape production is considered very intensive from the aspect of fertilizer consumption. Romić et al. [35] reported that the annual consumption of fertilizers in Croatia related to grape production was the second-highest, just after corn production, which is the dominant crop in Croatia. The most commonly used fertilizers are nitrogen-based, followed by potassium and phosphorous-based fertilizers.
In the southern part of the study area, in the catchments of Prud, Klokun, and Mandina mlinica, fruit production is dominant, followed by olive groves and grapes, which also cover a significant portion of agricultural land. The hot spot of the fruit production is Jezero polje to the north of Baćina lakes and Klokun spring, which is characterized by intensive production of strawberries, grapes, and citrus fruits. Animal husbandry constitutes a significant proportion of agricultural activity, and the dominant livestock is represented by cattle, cows, sheep, and goats. Due to the scattered production, grazing is not intensive.
In the recent decades, significant land-use changes did not occur in the study area, except for the increase in natural forest succession due to depopulation and abandonment of previously arable land. A minor change was evidenced in the reduction of wetland areas in Imotski polje due to the expansion of agricultural areas. Input data source is the European Environment Agency & Copernicus LAND Service Corine Land Cover [36].
2.4. Identification of Risks for Water Resources
From the aspect of sustainable use of water resources and their protection, several risks and conflicts have been identified. Agricultural practices in the study area can be considered conventional and unsustainable, with little or no consideration for over-use of plant protection products (e.g., pesticides, herbicides) or fertilizers, over-tilling, and planting of monocultures. Furthermore, despite the structural flood defense measures, karst poljes are still exposed to periodical flooding, causing deterioration of both surface water and groundwater quality due to transport of hazardous chemicals, enhanced erosion, and turbidity, as well as social and economic consequences. From the urban aspect, the high pressure is exacerbated by the insufficient extent of the sewage network. In Imotski polje, only Imotski and just south of the city are connected to the sewage system, while most of the population (approximately 80%) relies on septic pits resulting in the potential transport of contaminants and pathogens through a highly fractured karst network. Furthermore, the existing system is outdated, resulting in leaks and possible contamination of soil or groundwater. The system collects both domestic wastewater and meteoric water, and outflows occur during heavy rains. Collected wastewater is purified in a treatment facility before being discharged to surface water recipients.
Similar issues are present in the southern part of the study area, and the only wastewater treatment facility was constructed in Vrgorac. Coastal settlements and cities (e.g., Ploče), discharge wastewater into the sea, with minor or without treatment. The most significant waste disposal sites are Kozjačić in Imotski, Ajdanovac in Vrgorac, and Lovornik in Ploče, and these sites lack the proper barrier liner systems, gas venting, and leachate collection systems. Furthermore, there are numerous speleological objects (caves, pits, swallow holes) in the study area where the waste is illegally dumped. These sites have a high potential for pollution of soil, groundwater, and surface water, as waste is disposed of in barren karst terrain [37].
Despite the current abundance of water resources, climate change projections for Croatia and the whole Mediterranean region indicate an increase in air temperature, changes in precipitation regimes, increase in evapotranspiration, and intensification of floods and droughts in the near future (e.g., [5,9,12,13,38,39,40,41]), which could have a negative effect on the water availability in the study area. This problem is aggravated by the extreme losses in the water supply system, which are high above the national average of 42%, i.e., up to 80% in the water supply of Imotski, and up to 70% in Prud and Klokun water supply systems [29].
3. Materials and Methods
3.1. Hydrogeochemical Investigations
As carbonate aquifers belong to the most abundant groundwater sources, their solubility contributes significantly to the higher mineral content of water. In addition to the high chemical weathering rates, the heterogeneous nature of karst and its dependability on hydrological conditions could be reflected in its hydrochemical footprint. To understand the climate change impact on water resources, it is important to study the natural geochemical conditions which occur in the aquifer [42]. The main cations in groundwater originate dominantly from the chemical weathering of rocks, whereas the anions may derive from non-lithologic sources such as agricultural runoff, wastewater, and sewage seepage [43]. Piper [44] used a trilinear diagram for water classification with two separate ternary plots representing cations and anions. The plots are projected into a diamond field used to represent the water’s composition with respect to both ionic groups, illustrating the dominant hydrochemical facies. Furthermore, the major ion content of spring water may indicate water residence time since groundwater is derived from infiltrated precipitation and thus, poor in dissolved mineral content. However, the water-rock interaction during a period of time enriches the groundwater in major ion concentrations [45].
Periodical monthly hydrogeochemical field and laboratory investigations of the springs analyzed in this study were conducted from August 2019 to September 2020. Field investigation included in situ monitoring of pH, temperature, and electrical conductivity (EC) by WTW multi-parameter probe. Furthermore, alkalinity, i.e., the concentration of bicarbonate ions, was determined by volumetric titration with 1.6N H2SO4 to pH 4.5. Spring water samples were collected in 200 mL polyethylene bottles that prevent evaporation and were kept at the temperature closest to the temperature of the spring during the sampling procedure. Laboratory investigations were performed in the hydrochemical laboratory of the Department of Hydrogeology and Engineering Geology at the Croatian Geological Survey. Principal ion composition (HCO3−, Cl−, SO42−, Ca2+; Mg2+; Na+; K+; NO3−) was analyzed by ion chromatography on DIONEX ICS-6000 DP (Thermo Fischer Scientific Inc., Waltham, Massachusetts, USA) from spring water samples of Opačac, Klokun, Prud, and Mandina mlinica spring and abstraction site. This method is best suited for non-metal ion analysis in aqueous solutions [46]. Moreover, three major springs from the study area (Opačac, Klokun, and Prud) are used for the local water supply and are under the surveillance of the water utilities. The authors of this paper obtained microbiological data which included total organic carbon (TOC), aerobic, total and fecal coliform, streptococci, Escherichia coli, and inorganic nitrate content. The microbiological analysis was conducted in the laboratory of the Croatian Institute for Public Health.
3.2. Hydrological and Climate Modeling
Hydrological modeling in the study area was conducted based on the size and the water balance elements of the analyzed catchments. We employed the empirical expressions by Turc [47] and Langbein [48], which are most commonly used in the Croatian karst [49] to estimate the runoff based on the spatial distribution of the mean annual precipitation and air temperature.
Turc’s formula expresses runoff deficit (D) as a function of precipitation (P) and a temperature factor (L):
where D is the runoff deficit as a function of precipitation P and a temperature factor L, given as:
where T represents the increasing air temperature.
L = 300 + 25 × T + 0.05 × T3
The Langbein formula (1962) is based on a unique relationship between precipitation–temperature factor ratio (P/K) and runoff–temperature factor ratio (Q/K), i.e., it uses precipitation and air temperature as the key attributes when estimating surface runoff. Air temperature (T) is incorporated through a temperature factor (K), which increases exponentially as air temperature increases. Langbein’s expression states:
K = 100.0278T + 0.886
The spatial distribution of the analyzed parameters was facilitated by Geographical information systems, in a similar way as it was done in the work of Horvat and Rubinić [50]. The empirical models were calibrated by the hydrological observations in the period from 1961 to 2011. As a referent station, the climatological station Opuzen was used due to having a long time series of historical measurements. The spatial distribution of the mean annual air temperature and precipitation from 1961 to 1990, in a form of a 1000 m resolution raster, was prepared by the Croatian Meteorological and Hydrological Service (DHMZ). The inflow in the analyzed catchments, i.e., the precipitation that infiltrated the karst catchment, was determined by the same empirical expressions and was based on the spatial distribution of the mean annual precipitation and air temperature, as well as the size of the catchment. The validation of the empirical model was based on the comparison of the modeling results and the measured data. Based on the historical meteorological and climatological observations, the synthetic series of data for the period from 2012 to 2050 were generated. By combining the data on the mean annual air temperature and annual precipitation, generated by regional climate models (RCMs), with estimated catchment runoff and effective precipitation, synthetic series of runoff in the analyzed catchments were generated.
Climate change, i.e., the mean annual air temperature, precipitation, and mean annual runoff, up to 2050, have been projected using regional climate models (RCMs), namely, Aladin [51], RegCM3 [52], and Promes [53]. The RCMs were forced by the observed concentration of greenhouse gases from 1951 to 2000, and from 2001 onwards, the IPCC A1B scenario was applied [54]. The initial and boundary conditions for each RCM were obtained from different global climate models (GCMs): (i) Aladin was forced by the Arpege GCM, (ii) RegCM3 by the ECHAM5 GCM, and (iii) Promes by the HadCM3Q GCM.
Furthermore, we have used the E-OBS gridded datasets [55] to determine the change of climate indicators that could have a significant impact on the availability of freshwater resources. In particular, we observed the changes in consecutive dry days (CDD), consecutive wet days (CWD), and the maximum annual 1-day precipitation (Rx1D) in the period from 2021 to 2050 and from 2071 to 2100 versus the period from 1971 to 2000. In the scope of the project PROLINE-CE, the climate predictions of these indicators were obtained and downscaled to the study area by an ensemble of high-resolution EURO-CORDEX regional climate models.
4. Results and Discussion
4.1. Hydrochemical Analysis of the Study Area
The minimum, average, and maximum values of ion concentration, pH, and electrical conductivity (EC) are shown in Table 1.

Table 1.
The minimum, average, and maximum values of the physico-chemical parameters, obtained from August 2019 to September 2020. The abbreviation MMS stands for Mandina mlinica spring, whereas MMA stands for Mandina mlinica abstraction site.
The average values of the major ions were used to construct a Piper diagram (Figure 4). At Opačac, Prud, and Klokun springs, the distribution of major ions is characteristic for limestone-dominant aquifers, with Ca2+ as the most abundant cation, followed by Mg2+, Na+, and K+. Mandina mlinica spring site is abundant in Na+ and Cl- due to sea proximity; Mg2+ and K+ are elevated for the same reason, whereas Mandina mlinica abstraction site shows typical chemistry for karst groundwaters. The observed values of pH ranged from 7.28 to 8.14, and they were within the standard range of the freshwater (i.e., from 6.5 to 8.5). Values of electrical conductivity (EC) at Prud, Klokun, and MMA were elevated but well within the drinking water threshold (<2500 µS/cm) [56], as a result of marine influence due to their position close to the coast. At MMS, even the minimum values of EC and Cl− evidenced total mixing of spring water with the seawater. Contrary values observed at the two adjacent springs at MMS and MMA demonstrated the heterogeneity of karst systems in terms of preferential flows and differences in freshwater/seawater interface. Furthermore, the dissolution of sulfate-rich minerals (i.e., gypsum, anhydrite) from evaporite deposits could also be reflected in the elevated concentration of sulfates (SO42−) and subsequently, EC. Evaporite deposits are common in the central and southern Adriatic basins, and Bosnia and Herzegovina [57]. As the majority of Prud’s catchment is located in the neighboring country, evaporite deposits in the underground were the most likely cause of increased sulfate concentration. Additionally, the anthropogenic activity (industry, agriculture, domestic wastewater) could also add up to the high concentration of SO42−. Sulfates are abundant in seawater at 2.712 g/L in 35 Practical salinity units (PSU) [58], therefore, a marine origin is also plausible. Perry et al. [59] have given a strong argument for using the SO42−/Cl− ration as a seawater mixing indicator. The average value for seawater is 10.3. Adhering to that, the results confirm the authors’ assumption regarding seawater mixing in Prud and Klokun (Table 1).
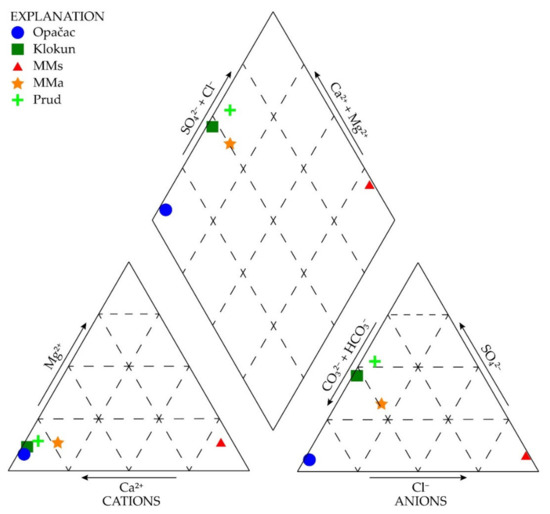
Figure 4.
Piper diagram of groundwater samples from the study area. The abbreviation MMS stands for Mandina mlinica spring, whereas MMA stands for Mandina mlinica abstraction site.
Relatively high bicarbonate (HCO3−) concentrations confirmed that the groundwater flow occurs in a carbonate aquifer. Nitrate concentrations were generally low, i.e., up to 5.35 mg/L at all analyzed springs, and they did not exceed the standard drinking water threshold (50 mg/L) [56]. Although there are many possible sources of nitrate in the groundwater, the majority of them are linked to human activities. However, intensive agriculture and husbandry in the study area were not reflected in high nitrate concentrations in the groundwater. The most probable causes of a low concentration of NO3− were: (i) high discharges at Opačac, Prud, and Klokun (i.e., on average, 4.6, 5.7, and 1.4 m3/s) resulting in a high dilution of nitrates; (ii) preferential and piston groundwater flow paths through a highly fractured and karstified underground, and (iii) complex groundwater recharge and mixing patterns in the overlying catchments. The reliable interpretation is constrained by the lack of data on nitrate concentrations from surface waters and soil. In particular, rivers in karst poljes are the main recipients and receive a surplus of nitrogen that is not taken up by plants, and a high concentration of nitrates is expected, particularly during several spraying seasons throughout the year. This was supported by low values of potassium at all analyzed locations except in MMS, where high values of K− originated from the seawater. A similar study was conducted in China [60] where the authors confirmed karst hydrogeochemical parameters such as pH, conductivity, HCO3−, Ca2+, SO42−, and Mg2+ as good indicators of various land use and other environmental changes.
The Piper diagram describes the dominant hydrochemical facies of the investigated springs (Figure 4). Opačac, Klokun, Prud, and MMA belong to the calcium type, i.e., Ca-HCO3 and mixed Ca-HCO3 and Ca-Mg-Cl facies. MMS belongs to the Na-Cl type due to its coastal location. Since the study area consists of carbonate deposits, i.e., limestone and dolomite, they add a significant amount of Ca2+ and Mg2+ to the water.
The bacteria, total organic carbon, and inorganic nitrogen content are shown in Table 2.
Table 2.
Microbiological data, TOC, and inorganic nitrogen values for three springs within the study area sampled in 2019; n = number of bacterial colonies.
Assessing the given microbiological data, what immediately stands to attention is the high aerobic bacteria content (6000 units/mL) at Prud. Total coliforms follow suit with 1800 units in 100 mL, as well as fecal bacteria. This reflects the poor purification capacity of karst aquifers due to the thin or non-existent overlying soil and, generally, the absence of fine-grained materials in the aquifer (i.e., clay, sand) [61]. Total organic carbon values and inorganic nitrogen content show a slight correspondence with bacterial colonies, especially for Opačac and Prud springs. Pronounced fractions of fecal bacteria are derived from animal manure coupled with higher values of inorganic nitrogen building a connection with agricultural runoff (fertilizers) [62]. Groundwater pollution generated by intense nitrogen fertilization is a common issue in numerous agricultural communities [62,63,64].
In general, the water is of good quality, with slightly elevated sulfates most likely on account of evaporite deposits from the neighboring Bosnia and Herzegovina. The microbiological data is high, but the water is being chlorinated prior to distribution to end-users and thus properly managed. Even though the study supposed that the continual monthly hydrochemical monitoring over a period of hydrological year is sufficient, the obtained results showed otherwise. The limitations of the hydrochemical study were the sparse data set and lack of continued daily monitoring, therefore, a more intricate groundwater monitoring network is needed for a conclusive study, over a longer period of time [64].
4.2. Assessment of Climate Change Impacts
Hydrological modeling and assessment of climate change impacts on water resources were performed for Imotski polje and the catchments of Prud, Klokun, and Mandina, respectively. The measured data on mean annual air temperature and precipitation from 1961 to 2012, as well as the data on the spatial distribution of the runoff, and their generated values for the period until 2050, were used in the analyses. Statistics of the mean annual air temperature and the values generated by Aladin, RegCM3, and Promes are shown in Table 3.
Table 3.
Statistics of the mean annual air temperature (minimum, average, and maximum) in the study area during 30-year reference periods: (i) from 1961 to 1990 (measured data), (ii) from 1991 to 2020 (partly measured and partly generated data), and (iii) from 2021 to 2050 (generated data).
In comparison to the 30-year reference period (from 1961 to 1990), all models evidenced an increase in the average values of mean annual air temperature until 2050. In Imotski polje, Promes evidenced the highest increase in the average value of mean annual air temperature, up to 1.4 °C, followed by Aladin with 0.5 °C, and RegCM3 evidenced a negligible increase of 0.1 °C. Slightly lower values were observed in the catchments of Prud, Klokun, and Mandina mlinica, where increases of 0.9 °C, 0.6 °C, and 0.1 °C were indicated by Promes, Aladin, and RegCM3, respectively. In both parts of the study area, the maximum values of the mean annual air temperature tend to increase more significantly until 2050. For Imotski polje, Promes showed the highest increase, up to 2 °C, followed by Aladin with 1.3 °C, and RegCM3 with 0.5 °C. In the catchments of Prud, Klokun, and Mandina mlinica, slightly lower increases of 1.4 °C, 1.3 °C, and 0.8 °C were evidenced by the models. Regarding the minimum values of the mean annual air temperature, mixed results were obtained, whereas RegCM3 evidenced a decrease of −0.4 °C in both parts of the study area, while Promes and Aladin showed a slight increase.
The linear regressions evidenced increasing trends of 2.3 °C/100 years by Promes, followed by Aladin with 0.9 °C/100 years, for Imotski polje. Similar results were obtained for Prud, Klokun, and Mandina mlinica catchments, where Promes evidenced an increase of 1.4 °C/100 years, and Aladin 1 °C/100 years. In both parts of the study area, RegCM3 provided a negligible increase in the mean annual air temperature until 2050. Due to the long tradition of using RegCM3 in Croatia for climate predictions, the models often display conservative projections, small warm biases in air temperature, and general overestimation of precipitation [9]. Furthermore, the increasing trends in the mean annual air temperature obtained by Promes and Aladin fit well into regional studies and attest to the hypothesis of faster warming trends in the Mediterranean region. In particular, Branković et al. [9] described warming rates in the Adriatic region and showed an increase in the mean annual air temperature of 0.07–0.22 °C/decade for the period from 1951 to 2010, and 0.29–0.71 °C/decade for the period from 1981 to 2010. Furthermore, they projected the most significant increase for the summer and autumn periods, with an increase of up to 5.5 °C until 2100. Similarly, a higher intensity of warming during the warmer parts of the year (i.e., spring and summer) was evidenced by Bonacci et al. [5]. Moreover, the observed results are in accordance with Berkeley Earth [11], grid-based datasets of global air temperature. They described the current mean rate of air temperature change of 2.94 ± 0.26, 3.54 ± 0.33, and 3.35 ± 0.40 °C/100 years for Europe, Croatia, and Split, respectively.
Statistics of the mean annual precipitation and the values generated by Aladin, RegCM3, and Promes are shown in Table 4.
Table 4.
Statistics of the mean annual precipitation (minimum, average, and maximum) in the study area during 30-year reference periods: (i) from 1961 to 1990 (measured data), (ii) from 1991 to 2020 (partly measured and partly generated data), and (iii) from 2021 to 2050 (generated data).
All models pointed out the stable or slightly decreasing trends in precipitation until 2050. In particular, Aladin evidenced a decrease of approximately 57 mm/100 years, RegCM3 of 61 mm/100 years, and Promes by 129 mm/100 years in Imotski polje. Furthermore, a more significant decrease in the maximum values of the mean annual precipitation was evidenced by all models, i.e., by approximately 100–250 mm (Table 4). Promes indicated the most significant decrease, while Aladin and RegCM3 showed similar predictions. Conversely, the minimum values of the mean annual precipitation are expected to increase by 200–250 mm until 2050. A nearly identical situation was observed in the catchments of Prud, Klokun, and Mandina mlinica, where models indicated slightly decreasing trends in precipitation of 57 mm/100 years (Aladin), 62 mm/100 years (RegCM3), and 131 mm/100 years (Promes). Additionally, the behavior of the minimum and maximum values of the mean annual precipitation is similar to the one observed in Imotski polje. These results are in accordance with most climate models for the Mediterranean region which predict a gradual decrease in precipitation and an increase in variability. However, these model-based changes in precipitation are usually characterized by high uncertainty [5,9,12].
Based on the available data on the mean annual air temperature and precipitation, and their spatial distribution in the period from 1961 to 1990, the mean annual runoff for the same 30-year reference periods were calculated by Turc and Langbein empirical expressions. Table 5 shows the statistics (minimum, average, maximum) of the time series of the calculated mean annual runoff in the period from 1961 to 1990.
Table 5.
Statistics (minimum, average, maximum) of the historical time series of the calculated mean annual runoff in the period from 1961 to 1990, according to Turc and Langbein method, and their averaged value.
Generated time series of the mean annual runoff in the periods from 1991 to 2020, and from 2021 to 2050 according to Aladin, RegCM3, and Promes are shown in Table 6.
Table 6.
Generated time series and the statistics (minimum, average, maximum) of the mean annual runoff in Imotski polje and Prud, Klokun, and Mandina mlinica catchments.
Furthermore, the time series of the historical and generated values of the mean annual runoff in Imotski polje and catchments of Prud, Klokun, and Mandina mlinica are shown in Figure 5.
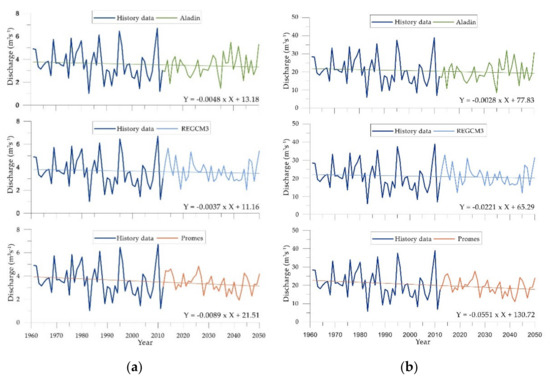
Figure 5.
The time series of the mean annual runoff in the period from 1961 to 2050 in (a) Imotski polje and (b) Prud, Klokun, Mandina mlinica catchments, and the equations of the linear regression (trends).
The results evidenced that the average values of the mean annual runoff in Imotski polje will decrease until 2050. In particular, Aladin and RegCM3 evidenced a decrease of 10% and 8%, respectively, while Promes indicated a 15% decrease when compared to historical runoff (from 1961 to 1990, Table 4 and Table 5). The maximum values of the mean annual runoff showed a more significant decrease, namely by 10%, 8%, and 22% according to Aladin, RegCM3, and Promes, respectively. All three models indicated an extreme increase of the minimum mean annual runoff, namely by 44%, 100%, and 88%. In the catchments of Prud, Klokun, and Mandina mlinica, all three models evidenced an almost identical decrease in the average values of the mean annual runoff as in Imotski polje. Projected changes in the maximum values of the mean annual runoff are similar to those projected for Imotski polje, with a foreseen decrease up to 10%, 12%, and 22%. Regarding the minimum values of the mean annual runoff, the same increase as in Imotski polje was evidenced by all three models.
Furthermore, from 1971 to 2000, E-OBS datasets evidenced 34 to 40 CDD in Imotski polje and catchments of Prud, Klokun, and Mandina mlinica. EURO-CORDEX RCMs predicted an increase in CDD by 3 to 8 days from 2021 to 2050, for the 75th percentile under RCP4.5 and RCP8.5 scenarios. In the period from 2071 to 2100, CDD is expected to increase by 8 to 13 days in coastal parts of the study area, and by 3 to 8 days in the hinterlands, where the continental effect of the climate is more pronounced. This increase in CDD could be reflected in the prolonged droughts, especially during the warmer season (i.e., spring and summer) when the hydrological minimum occurs, posing a threat to agricultural production, which is characterized by a low percentage of irrigated areas and a relatively high percentage of production that requires irrigation (e.g., fruits). Regarding the CWD, which is far greater in mountainous regions, E-OBS indicated 9 to 11 CWD in the period from 1971 to 2000 in the study area. Models showed a mixed-signal for the period from 2021 to 2050, i.e., for the 25th percentile, both scenarios predicted a decrease by 1 to 4 days, while stable trends were provided for the 50th and 75th percentile. The same result was projected for the period from 2071 to 2100. Furthermore, the median value (50th percentile) under RCP8.5 predicted reductions in CWD mostly across Italy and Balkan countries, which could have a significant impact on the duration and intensity of the flood waves in the study area. Concerning Rx1D, climate models indicated a clear increasing signal on a short time horizon (2021–2050), and according to the median value, the maximum annual daily rainfall could increase from 5 to 15 mm. The same result was obtained for the 75th percentile. On a long time horizon (2071 to 2100), the most significant increases in Rx1D were detected for the 75th percentile, from 15 to 25 mm in lowland parts of the study area, and 25 to 35 mm in mountainous areas.
Since the pressure on water resources will continue to grow, owing to adverse climate change effects (prolonged drought, consequently, greater seawater intrusion), observation and extended analyses of the endangered water resources is an obligation.
5. Conclusions
Climate models pointed out an increase in the mean annual air temperature, changes in the precipitation patterns, and the reductions in runoff in the study area. Coupled with changes in CDD, CWD, and Rx1D, a significant negative effect could be induced on the environment and its processes. Despite the current abundance of water resources and the low ratio of utilization of available resources for public water supply, climate models pointed out the possibility of significant losses of water resources in the near future. Additionally, this problem is aggravated by the high uncertainty and lack of knowledge regarding the groundwater reserves in karst aquifers. This shortcoming could be partly solved by establishing a groundwater level monitoring network, which is practically non-existent in Dalmatia. The available data on groundwater levels would greatly contribute to the determination of the aquifer’s response to hydrological extremes (e.g., floods or droughts), over-abstraction for potable or irrigation purposes, as well as its recharge processes. Currently, agricultural demand for fresh water is not exhibiting high pressure on water resources, but the existing spatial plans foresee a construction of a large irrigation system in Imotski polje and Jezero polje, hence the production could shift to cultures that require more extensive irrigation (e.g., fruits). Additionally, conservational use of water resources in the future should focus on increasing the efficiency of existing irrigation (e.g., sprinkler or drip systems), prevention of illegal connections to water supply systems, promotion of cultures that require little or no irrigation (e.g., vineyards), reduction of extreme losses in the water supply systems, and fostering alternative sources of water (e.g., rainwater harvesting).
Since the study area belongs to the rich agricultural zone of South Dalmatia, the authors of this paper expected a definite hydrochemical trace of the intense production. Hydrochemical data presented in this study are insufficient to quantify the land-use impact on water quality. Agriculture is the dominant activity of the region and many bad practices were observed throughout the PROLINE-CE project implementation ranging from excessive use of pesticides, application of restricted pesticides acquired from the neighboring Bosnia and Herzegovina, bad soil remediation after erosion and flood events (e.g., prescribed burning), and improvised irrigation. Poor land-use management greatly amplifies the pressure upon the environment, i.e., the water resources and ecosystems are its most endangered component. Furthermore, the nature of the karstic aquifer should also be kept in mind, i.e., its low retention and low purification capacity, rapid infiltration from surface to groundwater, and generally swift underground flow that makes it vulnerable to pollution with a widespread reach [61]. Additionally, climate change will affect the frequency and intensity of weather extremes, i.e., floods and droughts. Current flood mitigation infrastructure cannot cope with the intensity of high periodical flood waves, especially in the karst poljes. A combination of structural (i.e., new retention area) and holistic approaches should be fostered to provide a balance between the further development of the area and adequate flood mitigation. A holistic approach to flood mitigation includes prevention of construction in flood-prone areas, preservation of natural flood retention land (e.g., pasture, wetland, and forest), improvement of hydrological and meteorological forecasting, and promotion of green, permeable infiltration surfaces in the urban environment.
All of the above mentioned should raise consciousness to sustainable agriculture and improved water resource management as it affects us directly. Results of this study could be used by decision-makers, planners, water suppliers, and other major water users (i.e., agronomists, forest industry, energy production) to improve the sustainable utilization of groundwater resources and to increase the resilience of local communities and natural ecosystems in an uncertain climatic future. The authors of this study suggest continued water quality monitoring in the agricultural areas to anticipate adverse effects linked to anthropogenic and climate change impact. Awareness-raising events should also be a key-measure in order to encourage more environmentally conscious actions. Decision-makers ought to speed up the implementation of drinking water protection zones that will restrict agricultural activity in the immediate vicinity of a spring used for water supply, as well as foster more green approaches (e.g., organic farming).
Author Contributions
Writing of original draft, conceptualization, M.P.; Investigation, formal analysis, writing—review and editing, I.B. (Ivona Baniček); Data curation, formal analysis, methodology, software, J.R.; Supervision, validation, writing—review and editing, J.L.R.; Project administration, funding acquisition, data curation, I.B. (Ivana Boljat); Resources, software, data curation, visualization, A.S.; Data curation, resources, M.F.; Writing—review and editing, supervision, resources, J.T. All authors have read and agreed to the published version of the manuscript.
Funding
This research was supported by the Croatian Geological Survey, Department of Hydrogeology and Engineering Geology, and by the Interreg Central Europe project PROLINE-CE. The hydrological modelling has been supported by the University of Rijeka under the project Uniri-tehnic-18-298.
Institutional Review Board Statement
Not applicable.
Informed Consent Statement
Not applicable.
Data Availability Statement
The climate data used within this study are the property of the Croatian Meteorological and Hydrological Service (DHMZ). Terms of use, data availability, and contact can be found at: https://klima.hr/razno/katalog_i_cjenikDHMZ.pdf (accessed on 15 April 2019). Climate data used for EURO-CORDEX regional climate models is available at: https://www.ecad.eu/download/ensembles/download.php (accessed on 15 April 2019).
Acknowledgments
Climate data used in this study was provided by the courtesy of the Croatian Meteorological and Hydrological Service. Furthermore, microbiological data was provided by the Croatian Waters. Climate data from the EURO-CORDEX regional climate models were provided by the project PROLINE-CE. We wish to thank all of the above-mentioned parties. Furthermore, the authors would like to express their gratitude to Marco Pola for his scientific advice and guidance.
Conflicts of Interest
The authors declare no conflict of interest. The funders had no role in the design of the study; in the collection, analyses, or interpretation of data; in the writing of the manuscript, or in the decision to publish the results.
References
- Kronvang, B.; Wendland, F.; Kovar, K.; Fraters, D. Land Use and Water Quality. Water 2020, 12, 2412. [Google Scholar] [CrossRef]
- Giri, S.; Qiu, Z. Understanding the relationship of land uses and water quality in Twenty First Century: A review. J. Environ. Manag. 2016, 173, 41–48. [Google Scholar] [CrossRef] [PubMed]
- Chapagain, P.S.; Rai, M.K.; Paudel, B. Land Use Land Cover Change and its Pathways in Sidin VDC, Panchthar District, Nepal. Geogr. J. Nepal 2018, 11, 77–94. [Google Scholar] [CrossRef]
- Song, X.-P.; Hansen, M.C.; Stehman, S.V.; Potapov, P.V.; Tyukavina, A.; Vermote, E.F.; Townshend, J.R. Global land change from 1982 to 2016. Nat. Cell Biol. 2018, 560, 639–643. [Google Scholar] [CrossRef]
- Bonacci, O.; Patekar, M.; Pola, M.; Roje-Bonacci, T. Analyses of Climate Variations at Four Meteorological Stations on Remote Islands in the Croatian Part of the Adriatic Sea. Atmosphere 2020, 11, 1044. [Google Scholar] [CrossRef]
- Rigoni, A. Erosion of the Mediterranean Coastline: Implications for Tourism. Report of the Committee on Economic Affairs and Development. 2003. Available online: http://assembly.coe.int/nw/xml/XRef/X2H-Xref-ViewHTML.asp?FileID=10340&lang=EN (accessed on 9 February 2021).
- Ahlonsou, E.; Ding, Y.; Schimel, D. The Climate System: An Overview. In Climate Change 2001: The Scientific Basis; Cambridge University Press: Cambridge, UK, 2001; pp. 85–98. [Google Scholar]
- Le Treut, H.; Cubasch, U.; Allen, M. Historical Overview of Climate Change. In Climate Change 2007: The Physical Science Basis. Contribution of Working Group I to the Fourth Assessment Report of the Intergovernmental Panel on Climate Change; Cambridge University Press: Cambridge, UK; New York, NY, USA, 2005; pp. 94–127. [Google Scholar]
- Branković, Č.; Güttler, I.; Gajić-Čapka, M. Evaluating climate change at the Croatian Adriatic from observations and regional climate models’ simulations. Clim. Dyn. 2013, 41, 2353–2373. [Google Scholar] [CrossRef]
- Hartmann, D.L.; Klein Tank, A.M.G.; Rusticucci, M.; Alexander, L.V.; Brönnimann, Y.; Charabi, F.J.; Dentener, E.J. Observations: Atmosphere and Surface. In Climate Change 2013 the Physical Science Basis: Working Group I Contribution to the Fifth Assessment Report of the Intergovernmental Panel on Climate Change; Cambridge University Press: Cambridge, UK, 2013; Volume 9781107057, pp. 159–254. ISBN 9781107415324. [Google Scholar]
- The Berkeley Earth Surface Temperature Study. Available online: http://berkeleyearth.org/ (accessed on 10 August 2020).
- Aguilera, H.; Murillo, J.M. The effect of possible climate change on natural groundwater recharge based on a simple model: A study of four karstic aquifers in SE Spain. Environ. Earth Sci. 2008, 57, 963–974. [Google Scholar] [CrossRef]
- Touhami, I.; Chirino, E.; Andreu, J.; Sanchez-Montahud, J.-R.; Moutahir, H.; Bellot, J. Assessment of climate change impacts on soil water balance and aquifer recharge in a semiarid region in south east Spain. J. Hydrol. 2015, 527, 619–629. [Google Scholar] [CrossRef]
- Rađa, B.; Bonacci, O.; Rađa, T.; Šantić, M. The water and biology on a small Karstic island: The Island of Brač (Croatia) as one example. Environ. Earth Sci. 2020, 79, 1–17. [Google Scholar] [CrossRef]
- Millán, M.M. Extreme hydrometeorological events and climate change predictions in Europe. J. Hydrol. 2014, 518, 206–224. [Google Scholar] [CrossRef]
- Terzić, J. Hydrogeology of Adriatic karstic islands. Ph.D. Thesis, University of Zagreb, Zagreb, Croatia, 2006. [Google Scholar]
- White, W.B. Contaminant Transport in Karst Aquifers: Systematics and Mechanisms; Metzler, J.B., Ed.; Springer: New York, NY, USA, 2017; pp. 55–81. [Google Scholar]
- Slišković, I.; Kapelj, J.; Kapelj, S. Hydrogeological Conditions and the Necessity for Sanitary Protection of the Norinska River—Prud Spring, Metković, Croatia. Geol. Croat. 1998, 51, 91–103. [Google Scholar]
- Ford, D.; Williams, P. Human Impacts and Environmental Rehabilitation; Wiley: Hoboken, NJ, USA, 2013; pp. 471–504. [Google Scholar]
- Kačaroğlu, F. Review of Groundwater Pollution and Protection in Karst Areas. Water Air Soil Pollut. 1999, 113, 337–356. [Google Scholar] [CrossRef]
- Viets, F.G.; Lunin, J. The environmental impact of fertilizers. CRC Crit. Rev. Environ. Control. 1975, 5, 423–453. [Google Scholar] [CrossRef]
- Uri, N.D. The Use of Fertilizer and its Environmental Consequences. Energy Environ. 1997, 8, 191–205. [Google Scholar] [CrossRef]
- Khan, M.; Mobin, M.; Abbas, Z.; Alamri, S. Fertilizers and Their Contaminants in Soils, Surface and Groundwater. In Encyclopedia of the Anthropocene; Elsevier BV: Amsterdam, The Netherlands, 2018; Volume 5, pp. 225–240. [Google Scholar]
- Ponnou-Delaffon, V.; Probst, A.; Payre-Suc, V.; Granouillac, F.; Ferrant, S.; Perrin, A.-S.; Probst, J.-L. Long and short-term trends of stream hydrochemistry and high frequency surveys as indicators of the influence of climate change, agricultural practices and internal processes (Aurade agricultural catchment, SW France). Ecol. Indic. 2020, 110, 105894. [Google Scholar] [CrossRef]
- Kottek, M.; Grieser, J.; Beck, C.; Rudolf, B.; Rubel, F. World Map of the Köppen-Geiger climate classification updated. Meteorol. Z. 2006, 15, 259–263. [Google Scholar] [CrossRef]
- Tadić, M.P. Gridded Croatian climatology for 1961–1990. Theor. Appl. Clim. 2010, 102, 87–103. [Google Scholar] [CrossRef]
- Vlahović, I.; Tišljar, J.; Velić, I.; Matičec, D. Evolution of the Adriatic Carbonate Platform: Palaeogeography, main events and depositional dynamics. Palaeogeogr. Palaeoclim. Palaeoecol. 2005, 220, 333–360. [Google Scholar] [CrossRef]
- Bonacci, O.; Roje-Bonacci, T. Water losses from the Ričice reservoir built in the Dinaric karst. Eng. Geol. 2008, 99, 121–127. [Google Scholar] [CrossRef]
- Plišić, I.; Jakelić, Z.; Čelan, Z.; Marinović, G.; Fuštar, A.; Barun, T. Water Supply Plan for the Split-Dalmatia County 2008, un-published. Split. 2008, p. 306. Available online: https://www.dalmacija.hr/Portals/0/docs/Skupstina/2011/24/12a.%20vodplanst.pdf (accessed on 15 May 2020).
- Slišković, I. Water in Karst Catchments of Neretva and Cetina Rivers; Croatian Geological Survey: Zagreb, Croatia, 2014; p. 171. [Google Scholar]
- Terzić, J.; Reberski, J.L.; Frangen, T.; Rubinić, J. Hydrogeological Investigation of the Baćina Lakes; Croatian Geological Survey: Zagreb, Croatia, 2015; p. 207. [Google Scholar]
- Romić, D.; Zovko, M.; Romić, M.; Ondrašek, G.; Salopek, Z. Quality aspects of the surface water used for irrigation in the Neretva Delta (Croatia). J. Water Land Dev. 2008, 12, 59–70. [Google Scholar] [CrossRef]
- Biondić, B.; Rubinić, J.; Meaški, H.; Kapelj, S.; Tepeš, P. Status Assessment of Groundwater Risks in Karstic Area of Croatia; Final Report; Faculty of Geotechnical Engineering of the University of Zagreb: Varaždin, Croatia, 2009; p. 385. Available online: https://www.voda.hr/sites/default/files/dokumenti/ocjena_stanja_i_rizika_podzemnih_voda_na_krskom_podrucju_u_rh_varazdin_2009.pdf (accessed on 20 September 2020).
- Common Agricultural Policy (2014) by the European Council. Available online: https://www.consilium.europa.eu/en/policies/cap-reform/ (accessed on 3 December 2020).
- Romić, M.; Matijević, L.; Bakić, H.; Romić, D. Copper Accumulation in Vineyard Soils: Distribution, Fractionation and Bioavailability Assessment. In Environmental Risk Assessment of Soil Contamination; IntechOpen: London, UK, 2014; Chapter 28. [Google Scholar] [CrossRef]
- European Environment Agency & Copernicus Land Service Corine Land Cover. Available online: https://land.copernicus.eu/pan-european/corine-land-cover/clc2018 (accessed on 26 November 2019).
- Ministry of Economy and Sustainable Development; Institute for Environmental Protection and Nature Environment Pollution Registry. Available online: http://roo.azo.hr/ (accessed on 20 June 2020).
- Alpert, P.; Ben-Gai, T.; Baharad, A.; Benjamini, Y.; Yekutieli, D.; Colacino, M.; Diodato, L.; Ramis, C.; Homar, V.; Romero, R. Evidence for Increase of Extreme Daily Rainfall in the Mediterranean in Spite of Decrease in Total Values. Geophys. Res. Lett. 2002, 31, 1–4. [Google Scholar]
- Bonacci, O. Analysis of mean annual air temperature series in Croatia. Građevinar 2010, 62, 781–791. [Google Scholar]
- Bonacci, O. Increase of Mean Annual Surface Air Temperature in the Western Balkans during Last 30 Years. Vodoprivreda 2012, 40, 75–89. [Google Scholar]
- Terzić, J.; Reberski, J.L.; Rubinić, J. Groundwater Protection and Climate Change Predictions of a Complex Dinaric Karst Catchment. A Case Study of the Bokanjac-Poličnik Area, Croatia. Eng. Geol. Soc. Territ. 2015, 1, 95–98. [Google Scholar] [CrossRef]
- Appelo, C.A.J.; Postma, D. Geochemistry, Groundwater and Pollution; Balkema, A.A., Ed.; CRC Press: Leiden, The Netherlands, 2005. [Google Scholar]
- Khadka, K.; Rijal, M.L. Hydrogeochemical assessment of spring water resources around Melamchi, Central Nepal. Water Pr. Technol. 2020, 15, 748–758. [Google Scholar] [CrossRef]
- Piper, A.M. A graphic procedure in the geochemical interpretation of water-analyses. Trans. Am. Geophys. Union 1944, 25, 914–928. [Google Scholar] [CrossRef]
- Stroj, A.; Briški, M.; Oštrić, M. Study of Groundwater Flow Properties in a Karst System by Coupled Analysis of Diverse Environmental Tracers and Discharge Dynamics. Water 2020, 12, 2442. [Google Scholar] [CrossRef]
- Worden, R. Analytical Methods. Geochemical Analysis (Including X-ray). Encycl. Geol. 2005, 54–76. [Google Scholar] [CrossRef]
- Turc, L. The soil water balance, relationship between precipitation, evaporation and flow. Third hydraulic days in Algiers, Algier. Ann. Agron. 1954, 5, 491–595. [Google Scholar]
- Langbein, W.B. The Water Supply of Arid Valleys in Intermountain Regions in Relation to Climate. IAHS Bull. 1962, 7, 34–39. [Google Scholar]
- Karleuša, B.; Rubinić, J.; Radišić, M.; Krvavica, N. Analysis of Climate Change Impact on Water Supply in Northern Istria (Croatia). Teh. Vjesn. Tech. Gaz. 2018, 25, 366–374. [Google Scholar] [CrossRef]
- Horvat, B.; Rubinic, J. Annual runoff estimation—An example of karstic aquifers in the transboundary region of Croatia and Slovenia. Hydrol. Sci. J. 2006, 51, 314–324. [Google Scholar] [CrossRef]
- Bubnová, R.; Hello, G.; Benard, P.; Geleyn, J.-F. Integration of the Fully Elastic Equations Cast in the Hydrostatic Pressure Terrain-Following Coordinate in the Framework of the ARPEGE/Aladin NWP System. Mon. Weather Rev. 1995, 123, 515–535. [Google Scholar] [CrossRef]
- Pal, J.S.; Giorgi, F.; Bi, X.; Elguindi, N.; Solmon, F.; Gao, X.; Rauscher, S.A.; Francisco, R.; Zakey, A.; Winter, J.; et al. Regional Climate Modeling for the Developing World: The ICTP RegCM3 and RegCNET. Bull. Am. Meteorol. Soc. 2007, 88, 1395–1410. [Google Scholar] [CrossRef]
- Castro, M.; Fernandez, C.; Gaertner, M.A. Description of a Meso-Scale Atmospheric Numerical Model. Math. Clim. Environ. 1993, 230, 253. [Google Scholar]
- Intergovernmental Panel on Climate Change Emissions Scenarios. 2000. Available online: https://www.ipcc.ch/site/assets/uploads/2018/03/sres-en.pdf (accessed on 15 February 2021).
- Haylock, M.R.; Hofstra, N.; Tank, A.M.G.K.; Klok, E.J.; Jones, P.D.; New, M. A European daily high-resolution gridded data set of surface temperature and precipitation for 1950–2006. J. Geophys. Res. Space Phys. 2008, 113, 113. [Google Scholar] [CrossRef]
- Ordinance on the Health Safety of Drinking Water, Official Gazette of the Republic of Croatia, OG47/2008. Available online: https://narodne-novine.nn.hr/clanci/sluzbeni/2008_04_47_1593.html (accessed on 15 January 2021).
- Scisciani, V.; Esestime, P. The Triassic Evaporites in the Evolution of the Adriatic Basin. In Permo-Triassic Salt Provinces of Europe, North Africa and the Atlantic Margins; Elsevier BV: Amsterdam, The Netherlands, 2017; pp. 499–516. [Google Scholar]
- Brimblecombe, P. The Global Sulfur Cycle, 2nd ed.; Elsevier Ltd.: Amsterdam, The Netherlands, 2013; Volume 10, ISBN 9780080983004. [Google Scholar]
- Perry, E.; Velazques-Oliman, G.; Marin, L. The Hydrogeochemistry of the Karst Aquifer System of the Northern Yucatan Peninsula, Mexico. Int. Geol. Rev. 2002, 44, 191–221. [Google Scholar] [CrossRef]
- Zhao, M.; Zeng, C.; Liu, Z.; Wang, S. Effect of different land use/land cover on karst hydrogeochemistry: A paired catchment study of Chenqi and Dengzhanhe, Puding, Guizhou, SW China. J. Hydrol. 2010, 388, 121–130. [Google Scholar] [CrossRef]
- Selak, A.; Boljat, I.; Reberski, J.L.; Terzić, J.; Curk, B.Č. Impact of Land Use on Karst Water Resources—A Case Study of the Kupa (Kolpa) Transboundary River Catchment. Water 2020, 12, 3226. [Google Scholar] [CrossRef]
- Nogueira, G.; Nakamura, C.V.; Tognim, M.C.; Abreu Filho, B.A.; Dias Filho, B.P.; Prado Dias Filho, B. Microbiological Quality of Drinking Water of Urban and Rural Communities, Brazil Qualidade Microbiológica de Água Potável de Comunidades Urbanas e Rurais, Paraná. Rev. Saúde Pública 2003, 37, 232–236. [Google Scholar] [CrossRef]
- Asseng, S.; Ewert, F.; Martre, P.; Rötter, R.P.; Lobell, D.B.; Cammarano, D.; Kimball, B.A.; Ottman, M.J.; Wall, G.W.; White, J.W.; et al. Rising Temperatures Reduce Global Wheat Production. Nat. Clim. Change 2015, 5, 143–147. [Google Scholar] [CrossRef]
- Nikolaidis, N.P.; Bouraoi, F.; Bidoglio, G. Hydrologic and geochemical modeling of a karstic Mediterranean watershed. J. Hydrol. 2013, 477, 129–138. [Google Scholar] [CrossRef]


Publisher’s Note: MDPI stays neutral with regard to jurisdictional claims in published maps and institutional affiliations. |
© 2021 by the authors. Licensee MDPI, Basel, Switzerland. This article is an open access article distributed under the terms and conditions of the Creative Commons Attribution (CC BY) license (https://creativecommons.org/licenses/by/4.0/).