Article

Effect of Depreciation Method for Long-Term Tangible Assets on Sustainable Management: From a Nuclear Power Generation Cost Perspective under the Nuclear Phase-Out Policy

1
Department of Business and Technology Management, Korea Advanced Institute of Science and Technology, 291 Daehak-ro, Yuseong-gu, Daejeon 34141, Korea
2
Department of Business Administration, Pai Chai University, 155-40 Baejae-ro, Seo-Gu, Daejeon 35345, Korea
*
Author to whom correspondence should be addressed.
Sustainability 2021, 13(9), 5270; https://doi.org/10.3390/su13095270
Submission received: 26 March 2021 / Revised: 28 April 2021 / Accepted: 3 May 2021 / Published: 8 May 2021

Abstract

:
The Korean Government has been implementing a nuclear phase-out policy since 2017. Nuclear power plants accounted for 30.0% of the total power generation in 2016; this figure fell to 25.9% at the end of 2019, and the average Capacity Factor (CF) of a nuclear power plant approximately dropped from 89.1% to 69.2%. The nuclear phase-out policy presents severe consequences for the sustainable management of the nuclear power industry. Accordingly, the purpose of this study is to analyze the effect of a decrease in the nuclear capacity factor under the nuclear phase-out policy on the depreciation cost per unit using the Straight-Line Method (SLM) and Decelerated Depreciation Method (DDM) and to provide recommendations from a sustainable management perspective. The results show that the decrease in CF of nuclear power plants has a negative impact on sustainable development of the nuclear power industry. DDM is more beneficial than the SLM during this initial stage of depreciation under the nuclear phase-out policy. In addition, in the early stages of projects or immediately after attracting large-scale investments, DDM can offer more positive signs for stockholders by calculating a smaller net loss or a higher net profit.

1. Introduction

In 2016, Korea was among the world’s top five largest nuclear power producers, along with the United States, France, China, and Russia, and nuclear power has been a key source of its power [1]. As of the end of 2016, Korea currently operates 25 nuclear power plants with a power generation capacity of 23,116 MW, accounting for about 22% of total power generation capacity [2,3]. The amount of power generated by nuclear power plants amounted to 161,995 Gwh, or about 30% of the total power generation [3].
The Korean Government introduced a nuclear phase-out policy in 2017. According to the “8th Basic Plan on Electricity Supply and Demand” in South Korea, the Government will reduce dependency on nuclear power and coal and focus on increasing the proportion of renewable energy and Liquefied Natural Gas (LNG) [4,5].
In 2016, before the implementation of the nuclear phase-out policy, nuclear power plants in Korea had a power generation capacity of 21.8%. This fell to 18.5% at the end of 2019 [2,3]. Nuclear power accounted for 30.0% of the total power generated in 2016, but only 25.9% at the end of 2019. The Capacity Factor (CF), which expresses a percentage of the actual electrical energy generation amount to the annual maximum possible electrical energy generation amount of a year, was approximately 89.1% from 2000 to 2016, and dropped to 69.2% from 2017 to 2019 [2,3,6].
Moreover, under the “9th Basic Plan on Electricity Supply and Demand”, the current nuclear generating capacity of 23.3 GW will be lowered to 19.4 GW by 2034 by scrapping new construction projects and prohibiting the durable period extension of old reactors [7,8].
The nuclear phase-out policy presents severe consequences for the sustainable management of the nuclear power industry. The decrease in nuclear power generation leads to a higher unit cost of power generation. Companies have to raise the unit sales price to maintain profit margins, but price adjustment is difficult in Korea as the company responsible for operating nuclear power plants is a public corporation.
Depreciation cost has a strong influence on cost calculation of nuclear power generation. Depreciation cost is important for several reasons. First, it is not affected by per unit costs such as direct material costs and direct labor costs [9,10,11,12]. It falls under manufacturing indirect cost, which means a change in the production amount will cause a change in the unit cost [9,10,11,12]. Second, depreciation cost changes according to the method of calculation as it is derived systematically instead of relying on actual expenses [9,10,11,12]. Third, it accounts for a higher proportion of cost with increasing purchasing costs of tangible assets, which are subject to depreciation [13,14,15].
Nuclear power plants require high levels of security, automation, and robustness to ensure protection from radiation. As such, more investment is needed compared to other types of power plants, which results in a higher depreciation cost [13,14,15].
As such, determining the method of depreciation has a strong influence on cost calculation in the case of nuclear power plants and other facilities involving high construction costs.
This study first analyzes the effect of depreciation costs of long-term tangible assets, such as nuclear power plants, on the cost of power generation in predesigned scenarios under the nuclear phase-out policy. Second, it reviews a new method, the Decelerated Depreciation Method (DDM), proposed by Kim et al. in addition to the straight-line depreciation method, which is currently being used as a depreciation method for nuclear power plants. Lastly, it compares the effects of the straight-line depreciation method and DDM while taking into account the impact of the nuclear phase-out policy on sustainable management.
The purpose of this study is to present results that benefit society and the economy by analyzing the effect of the depreciation method for long-term tangible assets, including nuclear power plants, on the cost of power generation under the nuclear phase-out policy.

2. Materials and Methods

2.1. Construction Costs of Nuclear Power Plants

This study compares the depreciation cost of Advanced Power Reactor (APR) 1400, a third-generation nuclear power plant developed independently by Korea and constructed after Sinwolseong Unit 2. Key improvements are an increase in power generation from 1000 to 1400 MW and an extended durable period from 40 to 60 years based on enhanced safety criteria [16,17].
Table 1 shows the construction cost of Singori Units 3 and 4. In Korea, two nuclear power plant units are installed on the same site due to the limited availability of sites and to save construction costs. As such, constructing a single unit on its own is more expensive than the cost of one unit when constructing two units at the same site. The method of constructing two units reduces administrative costs, capital costs, and supporting costs for surrounding areas, out of indirect costs, which account for about 39% of total construction costs [16,18]. As a result, the cost of constructing one unit under this method will be about 16.1% cheaper than that of constructing a single unit on its own [18]. The estimated future construction cost of one APR 1400 unit is around USD 3.2 billion, as predicted at the end of 2012 [16].
The construction costs in Table 2 were published at the end of 2012 [16]. To obtain the 2020 construction cost, this study applied the inflation rate specified in “Regulations on Radioactive Waste Management Costs and Spent Nuclear Fuel Management Charges” [19,20,21,22]. The estimated construction cost is as follows.

2.2. Depreciation Method of Nuclear Power Plants

Depreciation is not an assessment of the value of assets, but a process of systematically allocating the cost of an asset over its durable period [23,24,25,26].
Depreciation cost has a significant influence on the unit cost of nuclear power generation as it is a cost element of the manufacturing indirect cost. The two common depreciation methods used for nuclear power plant facilities are the straight-line depreciation method and units of production method, with the former being more widespread for long-term tangible assets such as nuclear power plants [27]. This study analyzes the existing straight-line depreciation method against DDM, a method of depreciation proposed by Kim et al. [25].

2.2.1. Straight-Line Method (SLM)

The straight-line depreciation method (SLM) is used to calculate the depreciation of long-term tangible assets [23,24,25,26]. Residual value is deducted from the purchasing cost, and a certain amount is depreciated during each period [23,24,25,26]. This method is suitable when the economic benefit, that is, productivity, is exhibited consistently over time [23,24,25,26]. It is expressed as Equation (1) [25].
D C i , t S L M = ( T D C i R V i ) N
where D C i , t S L M = depreciation cost of the straight-line method of tangible assets i at year t, T D C i = the total depreciation cost of tangible assets i, R V i = the residual value of tangible assets i, and N = durable period (unit: year).

2.2.2. Decelerated Depreciation Method (DDM)

Kim et al. proposed using DDM over the SLM for nuclear power plants based on the following [25].
First, there is a difference in response to profit and cost. As examined earlier, nuclear power plants produce products of a certain amount and value using fixed input resources during their active period of operation—that is, products obtained using tangible assets are of a constant value. If product value is constant, profit should be constant as well. However, the unit sales price generally increases under positive inflation. While there is no change in the value of 1 kw produced by nuclear power plants, the sales price increased by 47.1% from 2001 to 2019. If there is an increase in profit, the depreciation cost should naturally increase in proportion to profit. According to Kim et al., the current straight-line method fails to reflect this trend [25].
Second, there is a difference in terms of value of time. Depreciation cost is calculated based on the value at the current point of acquisition of tangible assets. If the existing straight-line method is applied to nuclear power plants, depreciation cost is calculated to be the same throughout the durable period [25]. It is logical for depreciation to be constant if the products remain consistent in amount and value during the durable period [25]. However, given that nuclear power plants have a service life of 60 years, the value of tangible assets is difficult to allocate rationally over the 60-year period. For instance, if the current depreciation cost is 1 KRW, the depreciation in 60 years is also 1 KRW, which results in severe value distortion. A more appropriate method is to allocate depreciation over 60 years by taking into account time value—that is, the discount rate [25]. If the depreciation cost is calculated rationally, it should increase steadily over time.
As such, the method of depreciation proposed in this study obtains higher depreciation cost over time when assuming positive inflation.
Depreciation methods discussed for lease-related assets include the annuity method and sinking-fund method [28,29,30]. The annuity method views depreciation as an investment due to the acquisition of tangible assets and calculates depreciation based on the recovery of invested capital and rate of return [28,30]. The sinking-fund method calculates depreciation for an amount set aside as a fund; the total of the principal and interest becomes the total depreciation cost [29].
According to the above studies [28,29,30], the annuity method or sinking-fund method can be used to calculate depreciation for tangible assets. Both methods calculate higher depreciation over time, making them distinct from general methods mentioned in the Statement of Korean Accounting Standard No. 1016 “Tangible Assets.” While the annuity method and sinking-fund method view depreciation as the process of recovering invested capital, general methods of depreciation define it as a distribution of costs. Since the former two methods take into account income from interest and the sinking fund, they involve more complicated calculations than the SLM, which only considers depreciation cost and accumulated depreciation.
Thus far, this study has reviewed general theories and past research on the characteristics of nuclear power facilities and depreciation methods that reflect such characteristics. Based on this, DDM, as proposed by Kim et al. [25], is proposed as a method of calculating depreciation cost for tangible assets related to nuclear power facilities.
The residual value of nuclear power facilities is zero (0). The reason for the residual value being 0 is that nuclear power plants have no residual value due to residual radioactivity. In fact, additional costs are incurred in decommissioning, and funds for decommissioning accumulate by law [22].
Since nuclear power plants remain consistent in production amount and value during their durable periods, the depreciation cost, with a residual value of 0 without considering value of time, can be calculated using Equation (2).
T D C i = D C i , 1 + D C i , 2 + D C i , 2 + D C i , N
where T D C i = the total depreciation cost of tangible assets i, D C i = the depreciation cost of tangible assets i, and N = useful life (durable period) (unit: year).
In Equation (2),   D C i , 1 means the first-year depreciation cost and the depreciation cost of each year is always the same.
However, if the value of time is considered, Equation (3) is used for the present value to be applied at the point of calculation.
T D C i = D C i , 1 + D C i , 2 ( 1 + d r ) + D C i , 3 ( 1 + d r ) 2 + D C i , n ( 1 + d r ) n 1
where d r = the deceleration rate (discount rate) and n = the applicable year of depreciation.
When Equation (3) is applied, the depreciation cost of D C i , n can be expressed as Equation (4).
D C i , n = T D C i n = 1 N ( 1 + d r ) n 1
By applying Equation (4), the depreciation cost in each year is as shown in Equation (5).
D C i , t D D M = D C i , n × ( 1 + d r ) t t 0
where D C i , t D D M = the depreciation cost of DDM for tangible assets i at t year and t 0 = the beginning year of depreciation.
Finally, the depreciation cost of DDM can be expressed as Equation (6) [25].
D C i , t D D M = T D C i × ( 1 + d r ) t t 0 n = 1 N ( 1 + d r ) n 1

2.3. Capacity Factor (CF) of Nuclear Power Plants

The capacity factor (CF) of a nuclear power plant, which expresses a percentage of the actual electrical energy generation amount to the annual maximum possible electrical energy generation amount of a year, is an indicator of the efficiency of operations and rate of utilization of facilities [6]. Table 3 gives the CF of nuclear power plants from 2011 to 2019 [6].
In Korea, the CF of nuclear power plants was 89.02% from 2001 to 2016, which is the period before the announcement of the nuclear phase-out policy [6]. The average CF fell to 69.23% from 2017 to 2019 after the policy was adopted [6]. This study performed a scenario analysis by classifying the CF of nuclear power plants into minimum, maximum, and average. Scenario 1 was set as having a CF of 70% following the implementation of the nuclear phase-out policy, while Scenario 3 was set as having a CF of 90% before the policy. Scenario 2 was set as having a CF of 80%, which falls between the other two scenarios. The amounts of power generation under the different scenarios are shown in Table 4.

2.4. Unit Sales Price of Electricity

The unit sales price of electricity from 2011 to 2019 is shown in Table 5 [31]. The unit sales price increased from 0.03965 USD/kWh in 2011 to 0.05831 USD/kWh in 2019. The average year-on-year increase was about 2.7%. As such, this study set the average annual increase in sales price as 2.7% for the analysis of depreciation of nuclear power plants.

2.5. Input Data and Analysis Method for Scenario Analysis

The materials, methods, and references to be used in the analysis are presented in Table 6. To use the data in Table 6, this study first calculated the depreciation costs under the SLM and DDM, followed by the depreciation cost per unit for the given scenarios. Finally, it analyzed the ratio of depreciation cost to the future expected sales price. The purpose of this study is to analyze the effect of the decrease in CF of nuclear under the nuclear phase-out policy on the depreciation cost per unit and to provide recommendations from a sustainable management perspective.

3. Results

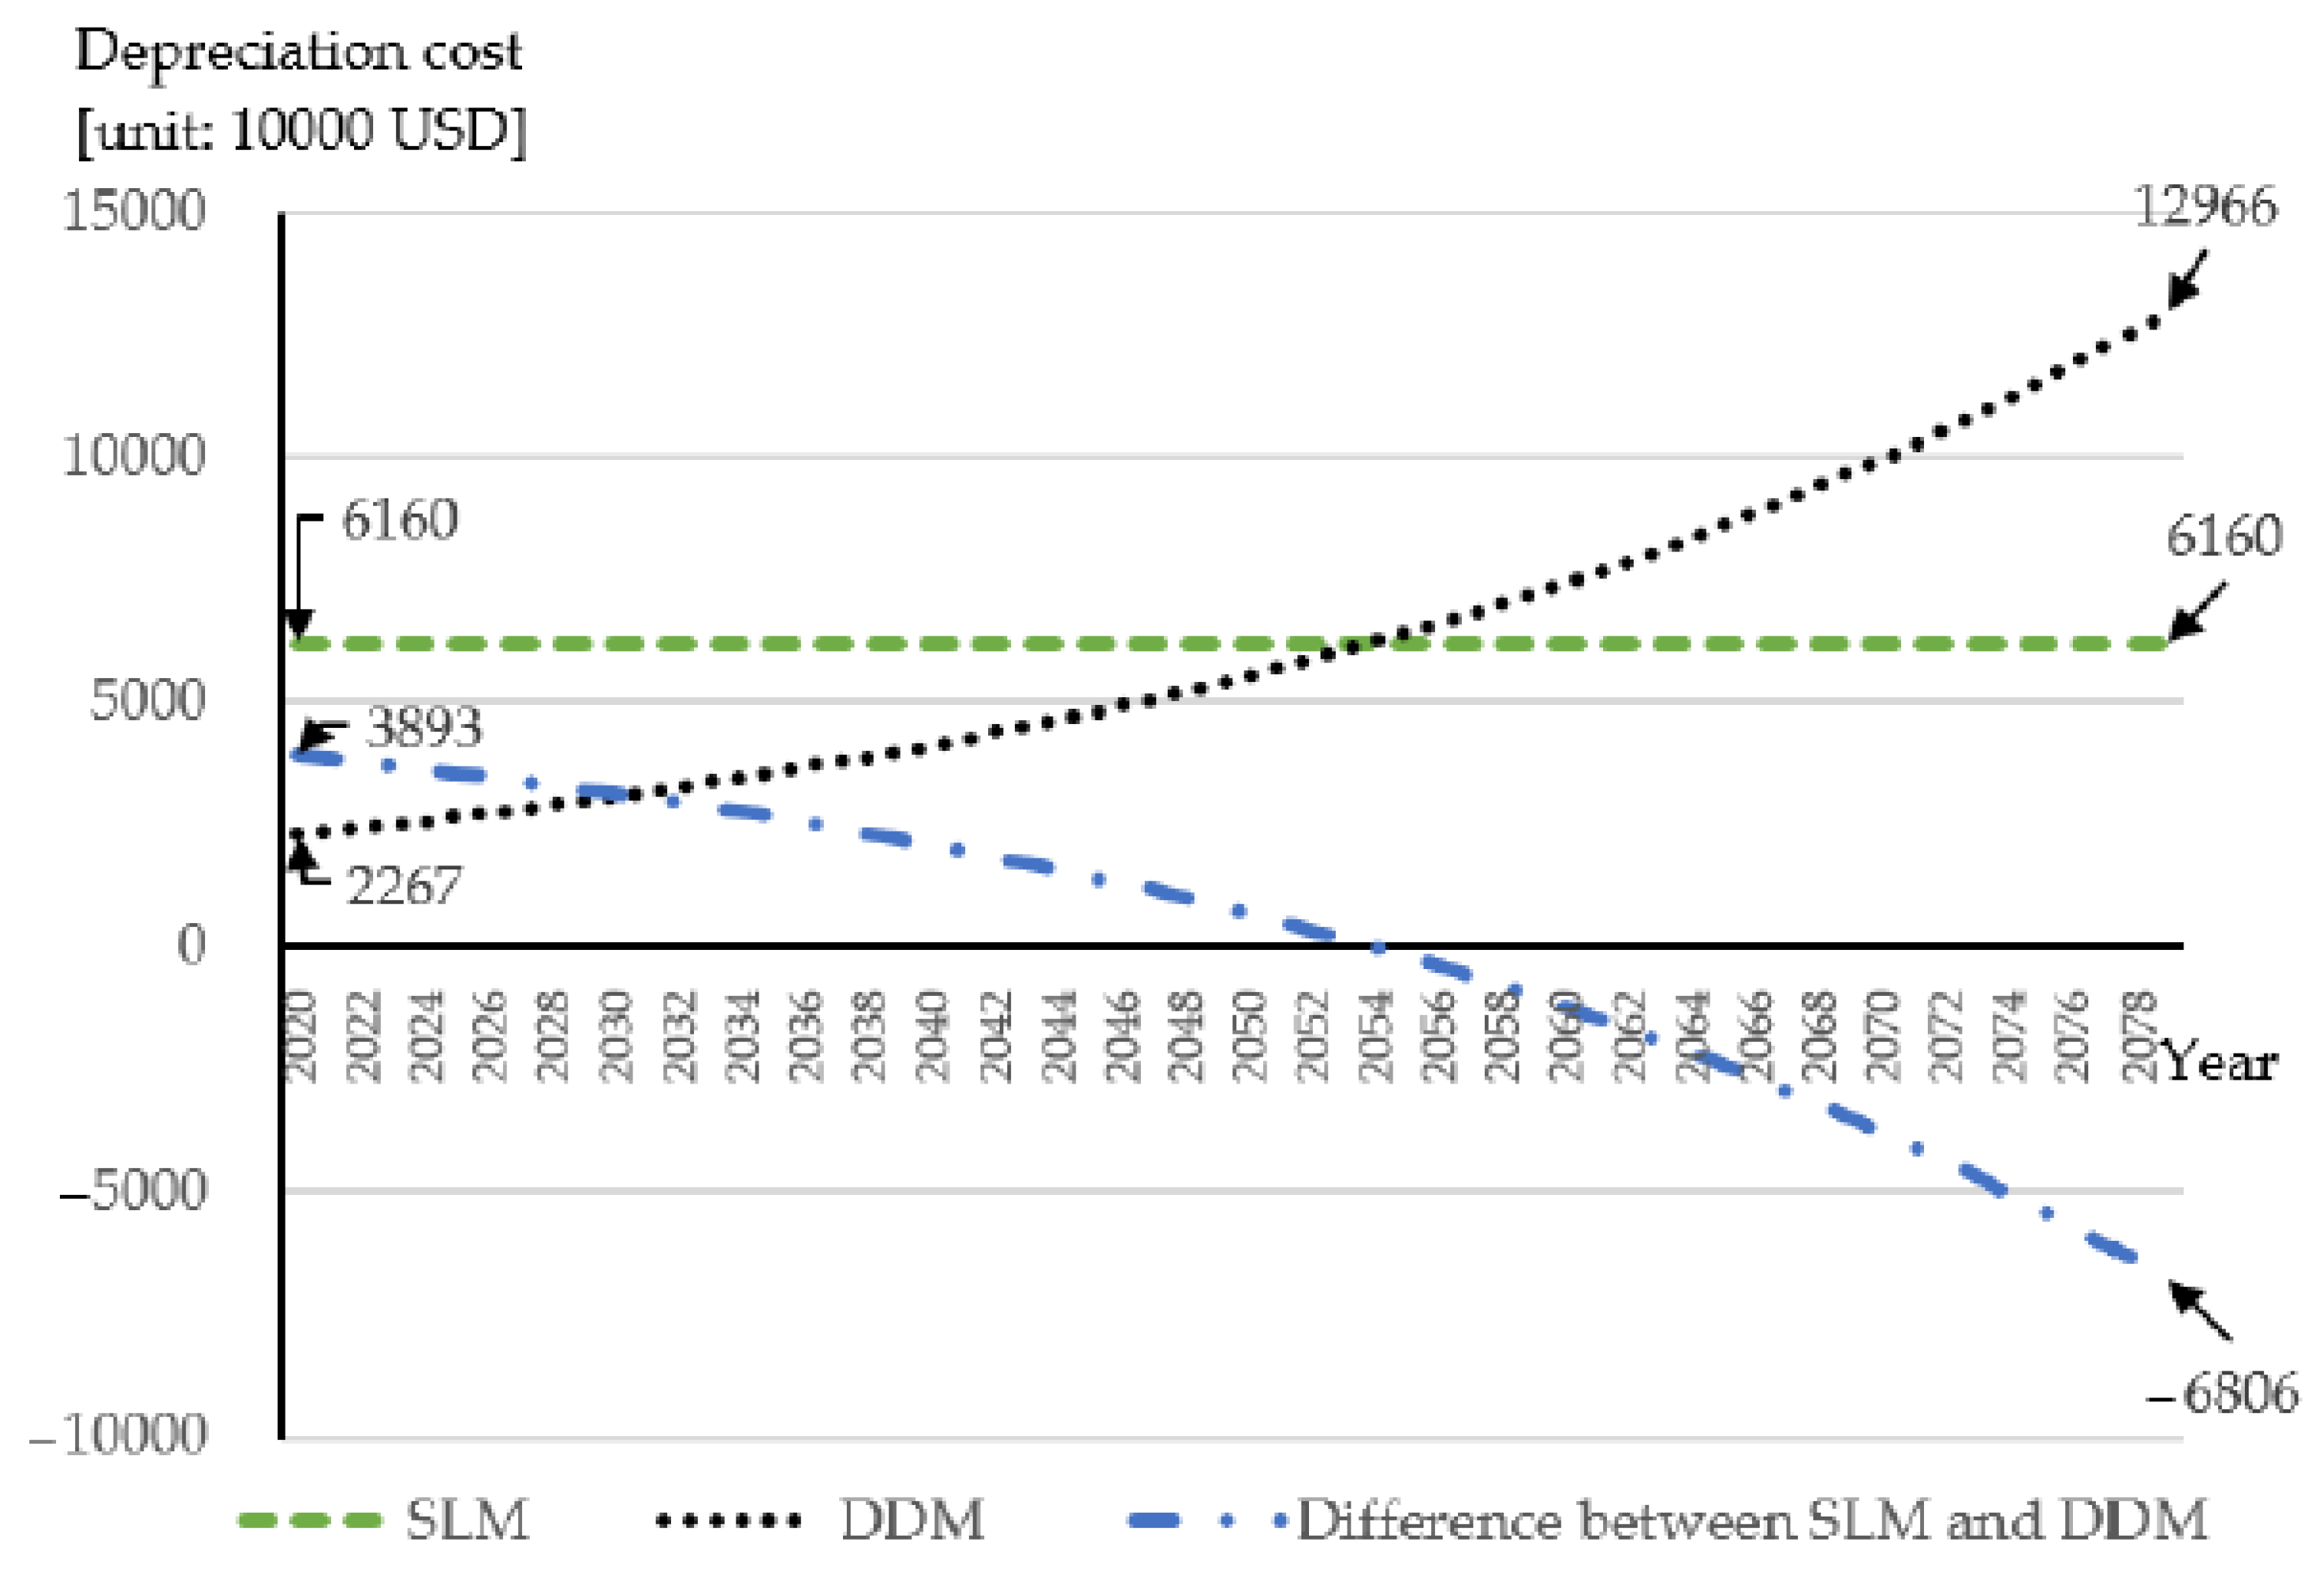
3.1. Results of Depreciation Cost Analysis

The results of the depreciation cost analysis under the SLM and DDM are presented in Figure 1. Since the depreciation cost incurred every year is a fixed amount, it remains constant regardless of CF.
The annual depreciation cost of SLM was calculated as USD 61.6 million and it remained constant during the operation of nuclear power plants. When using DDM, it was USD 22.67 million in the initial stage and increased by 4.72 times to USD 129.66 million in the last year.
The SLM achieved a USD 38.93 million higher depreciation in the initial stage, while DDM had a USD 68.06 million higher depreciation in the last year. The depreciation calculated by DDM surpasses that of the SLM in the 35th year during the 60-year period.
While SLM maintains a fixed depreciation cost during the active period, DDM is a type of accelerated depreciation method, under which the depreciation cost increases annually by 3%.
The SLM calculates a higher cost than DDM in the initial stage but a lower cost in the last stage. If sales are assumed to be the same during the initial durable period, the use of DDM increases company profits by USD 38.93 million. In about 35 years, DDM produces a higher depreciation, whereas SLM reports a higher profit.
If the sales price is set as the sum of cost and profit (profit being 30% of cost), DDM can have a lower sales price than SLM during the early business phase. This indicates that DDM as a method of depreciation for nuclear power plants under the nuclear phase-out policy offers companies greater flexibility in determining sales prices and also has a more positive effect on sustainable management. This result demonstrates the effect of the depreciation method of long-term tangible assets, which require large-scale investments, on actual sales price.
Figure 2 shows the calculation of depreciation cost per unit for the given CF using the SLM and DDM. The depreciation cost per unit assumes the form of a downward-sloping exponential function.
In the case of 50% CF, the depreciation costs per unit were calculated as 0.01 USD/kwh for the SLM, 0.0037 USD/kwh for the DDM, and the difference between the two methods was 0.0063 USD/Kwh. As such, the difference resulting from the choice of depreciation method has a greater influence on unit cost when the CF is low.

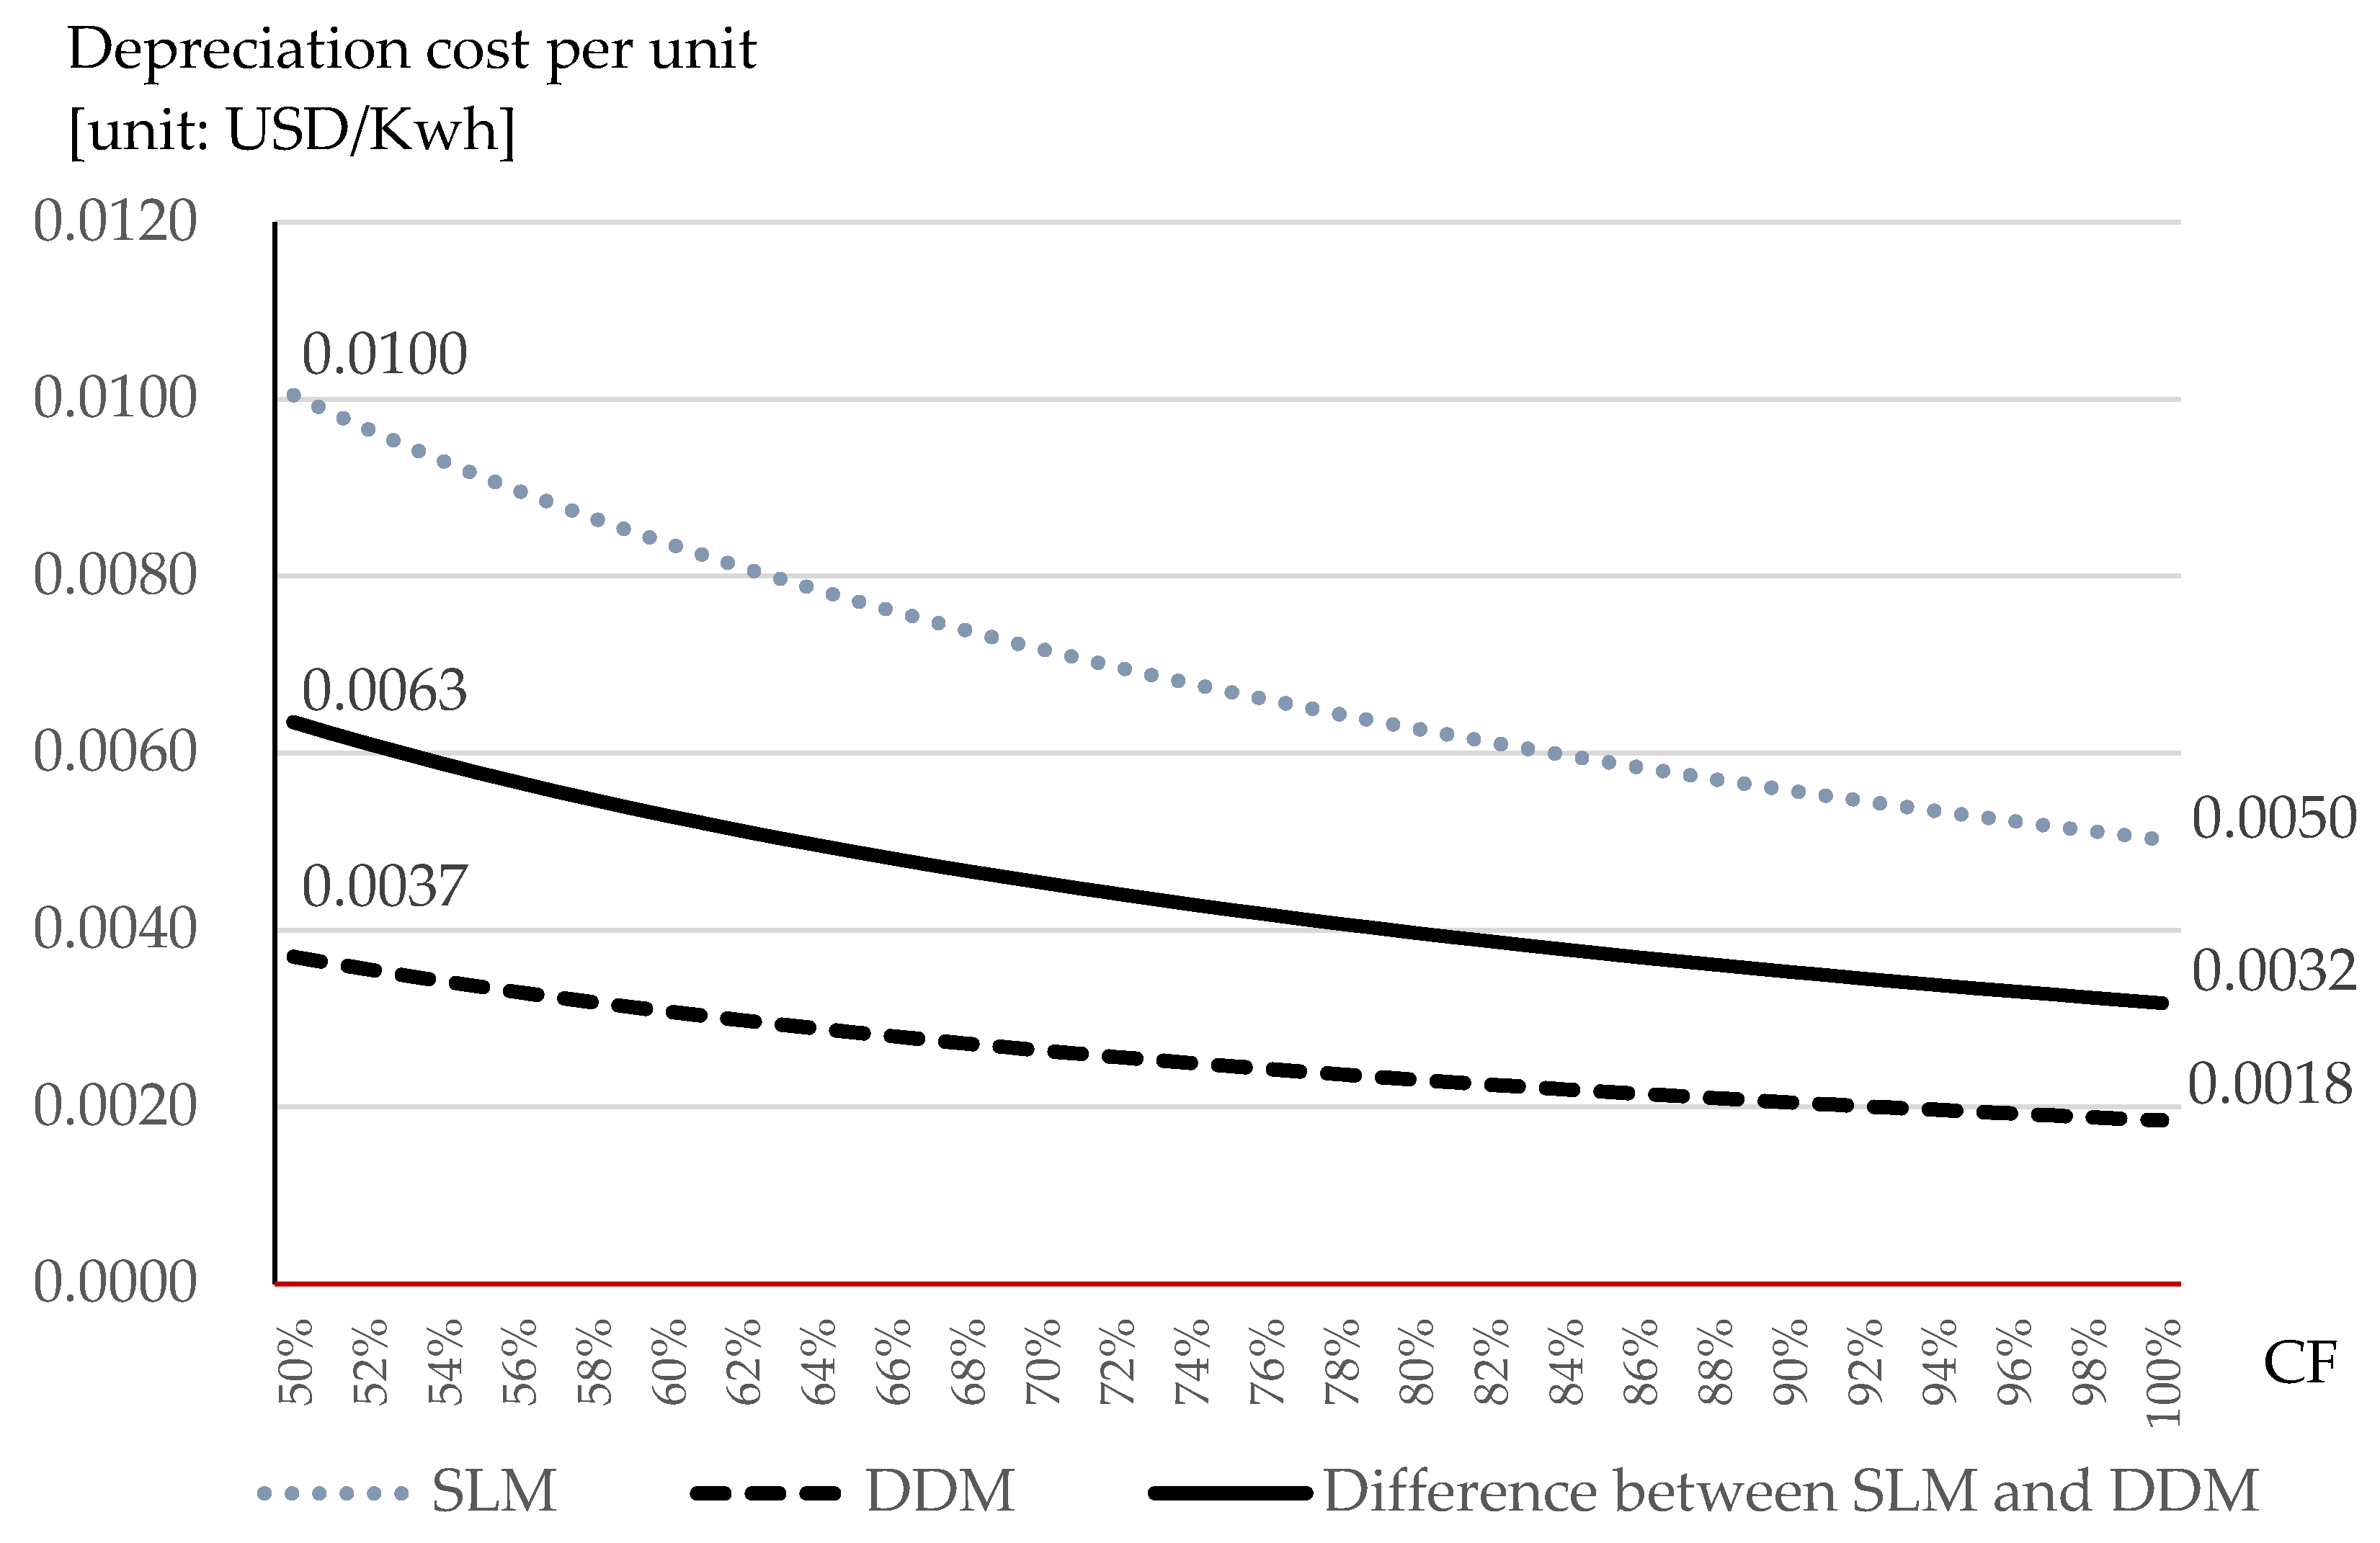
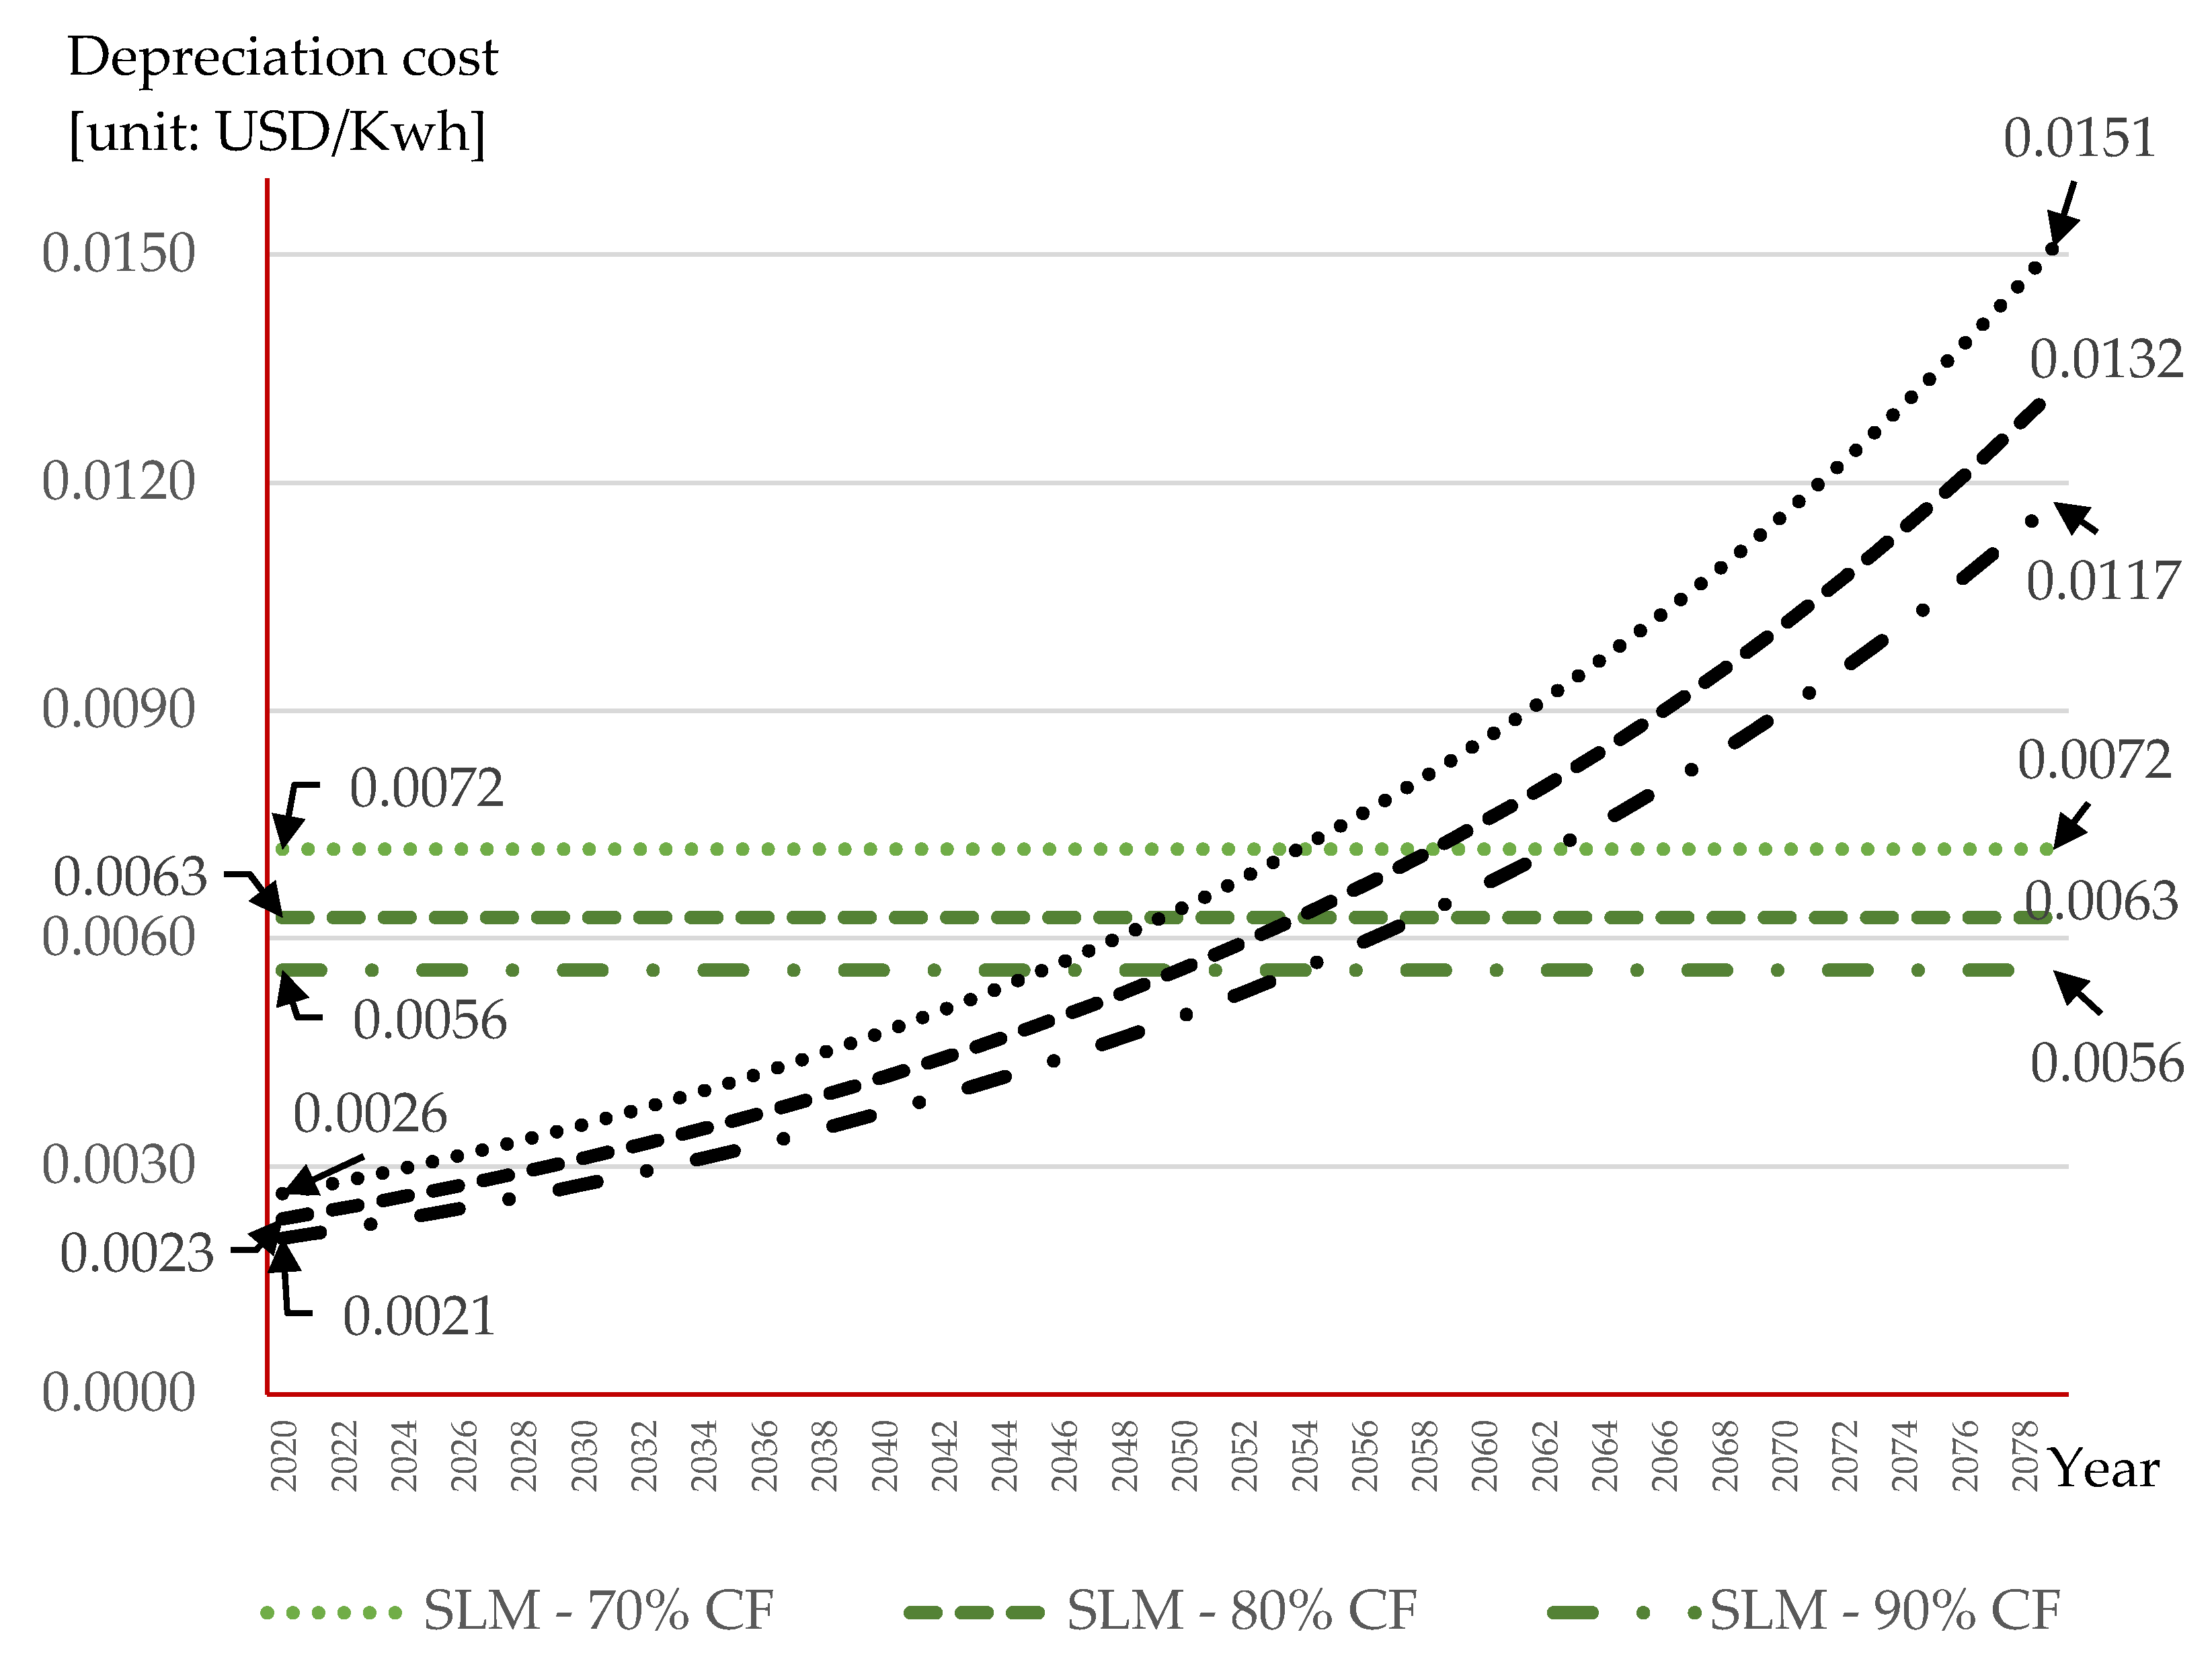
3.2. Results of Analysis of Depreciation Cost Per Unit for Given Scenarios

Figure 3 shows the calculation of depreciation cost per unit for the given scenarios using the SLM and DDM.
Both SLM and DDM have a high depreciation cost per unit under a low CF. In addition, the depreciation cost per unit of SLM remains the same over time, but that of DDM shows a gradual increase.
In particular, DDM exhibits a greater rate of increase as it is an upward-sloping exponential function, which gives a high depreciation cost per unit under a low CF. For this reason, the difference in depreciation cost per unit between scenarios grows larger as time passes.
In the case of SLM, the depreciation values in the first and last years were calculated as 0.0072 USD/kwh for 70% CF, 0.0063 for 80% CF, and 0.0056 for 90% CF. When the CF dropped from 90% to 80%, from 80% to 70%, and from 90% to 70%, the depreciation cost per unit increased by 0.0007, 0.0009, and 0.0016 USD/kwh, respectively.
In the case of DDM, the depreciation costs for the first year were 0.0026 USD/Kwh for 70% CF, 0.0023 USD/Kwh for 80% CF, and 0.0021 USD/Kwh for 90% CF. The last year was calculated as 0.0151 USD/kwh for 70% CF, 0.0132 USD/kwh for 80% CF, and 0.0117 USD/kwh for 90% CF. When the CF dropped from 90% to 80%, from 80% to 70%, and from 90% to 70%, the depreciation costs per unit for first year increased by 0.0002, 0.0003 and 0.0005 USD/kwh, respectively. In addition, the depreciation costs per unit for the last year increased by 0.0015, 0.0019, and 0.0034 USD/kwh, respectively, when the CF dropped from 90% to 80%, from 80% to 70%, and from 90% to 70%.
Accordingly, the decrease in CF of nuclear power plants thus has a negative impact on sustainable development of the nuclear power industry.
Figure 4 shows the difference between the depreciation cost per unit of the given SLM and DDM scenarios.
The difference in depreciation cost between the two methods is more prominent under a low CF.
The differences between the two methods were 0.0045 USD/Kwh for 70% CF, 0.004 USD/Kwh for 80% CF, and 0.0035 USD/Kwh for 90% CF in the first year, with the SLM giving higher values. In the last year, the differences were 0.0079 USD/Kwh for 70% CF, 0.0069 USD/Kwh for 80% CF, and 0.0062 USD/Kwh for 90% CF, with DDM giving higher values.
The differences in depreciation cost relative to sales price in the first year were 7.61%, 6.66%, and 5.92%, respectively, when the CF dropped from 90% to 80%, from 80% to 70%, and from 90% to 70%. In addition, in the last year, the differences in depreciation cost relative to sales price were 2.76%, 2.42%, and 2.15%, respectively,
The differences can be seen as highly significant considering that the sales price per 1 Kwh of nuclear power generation was 0.0596 USD/Kwh in 2020. As such, DDM is more beneficial for companies during this initial stage of depreciation under the nuclear phase-out policy.

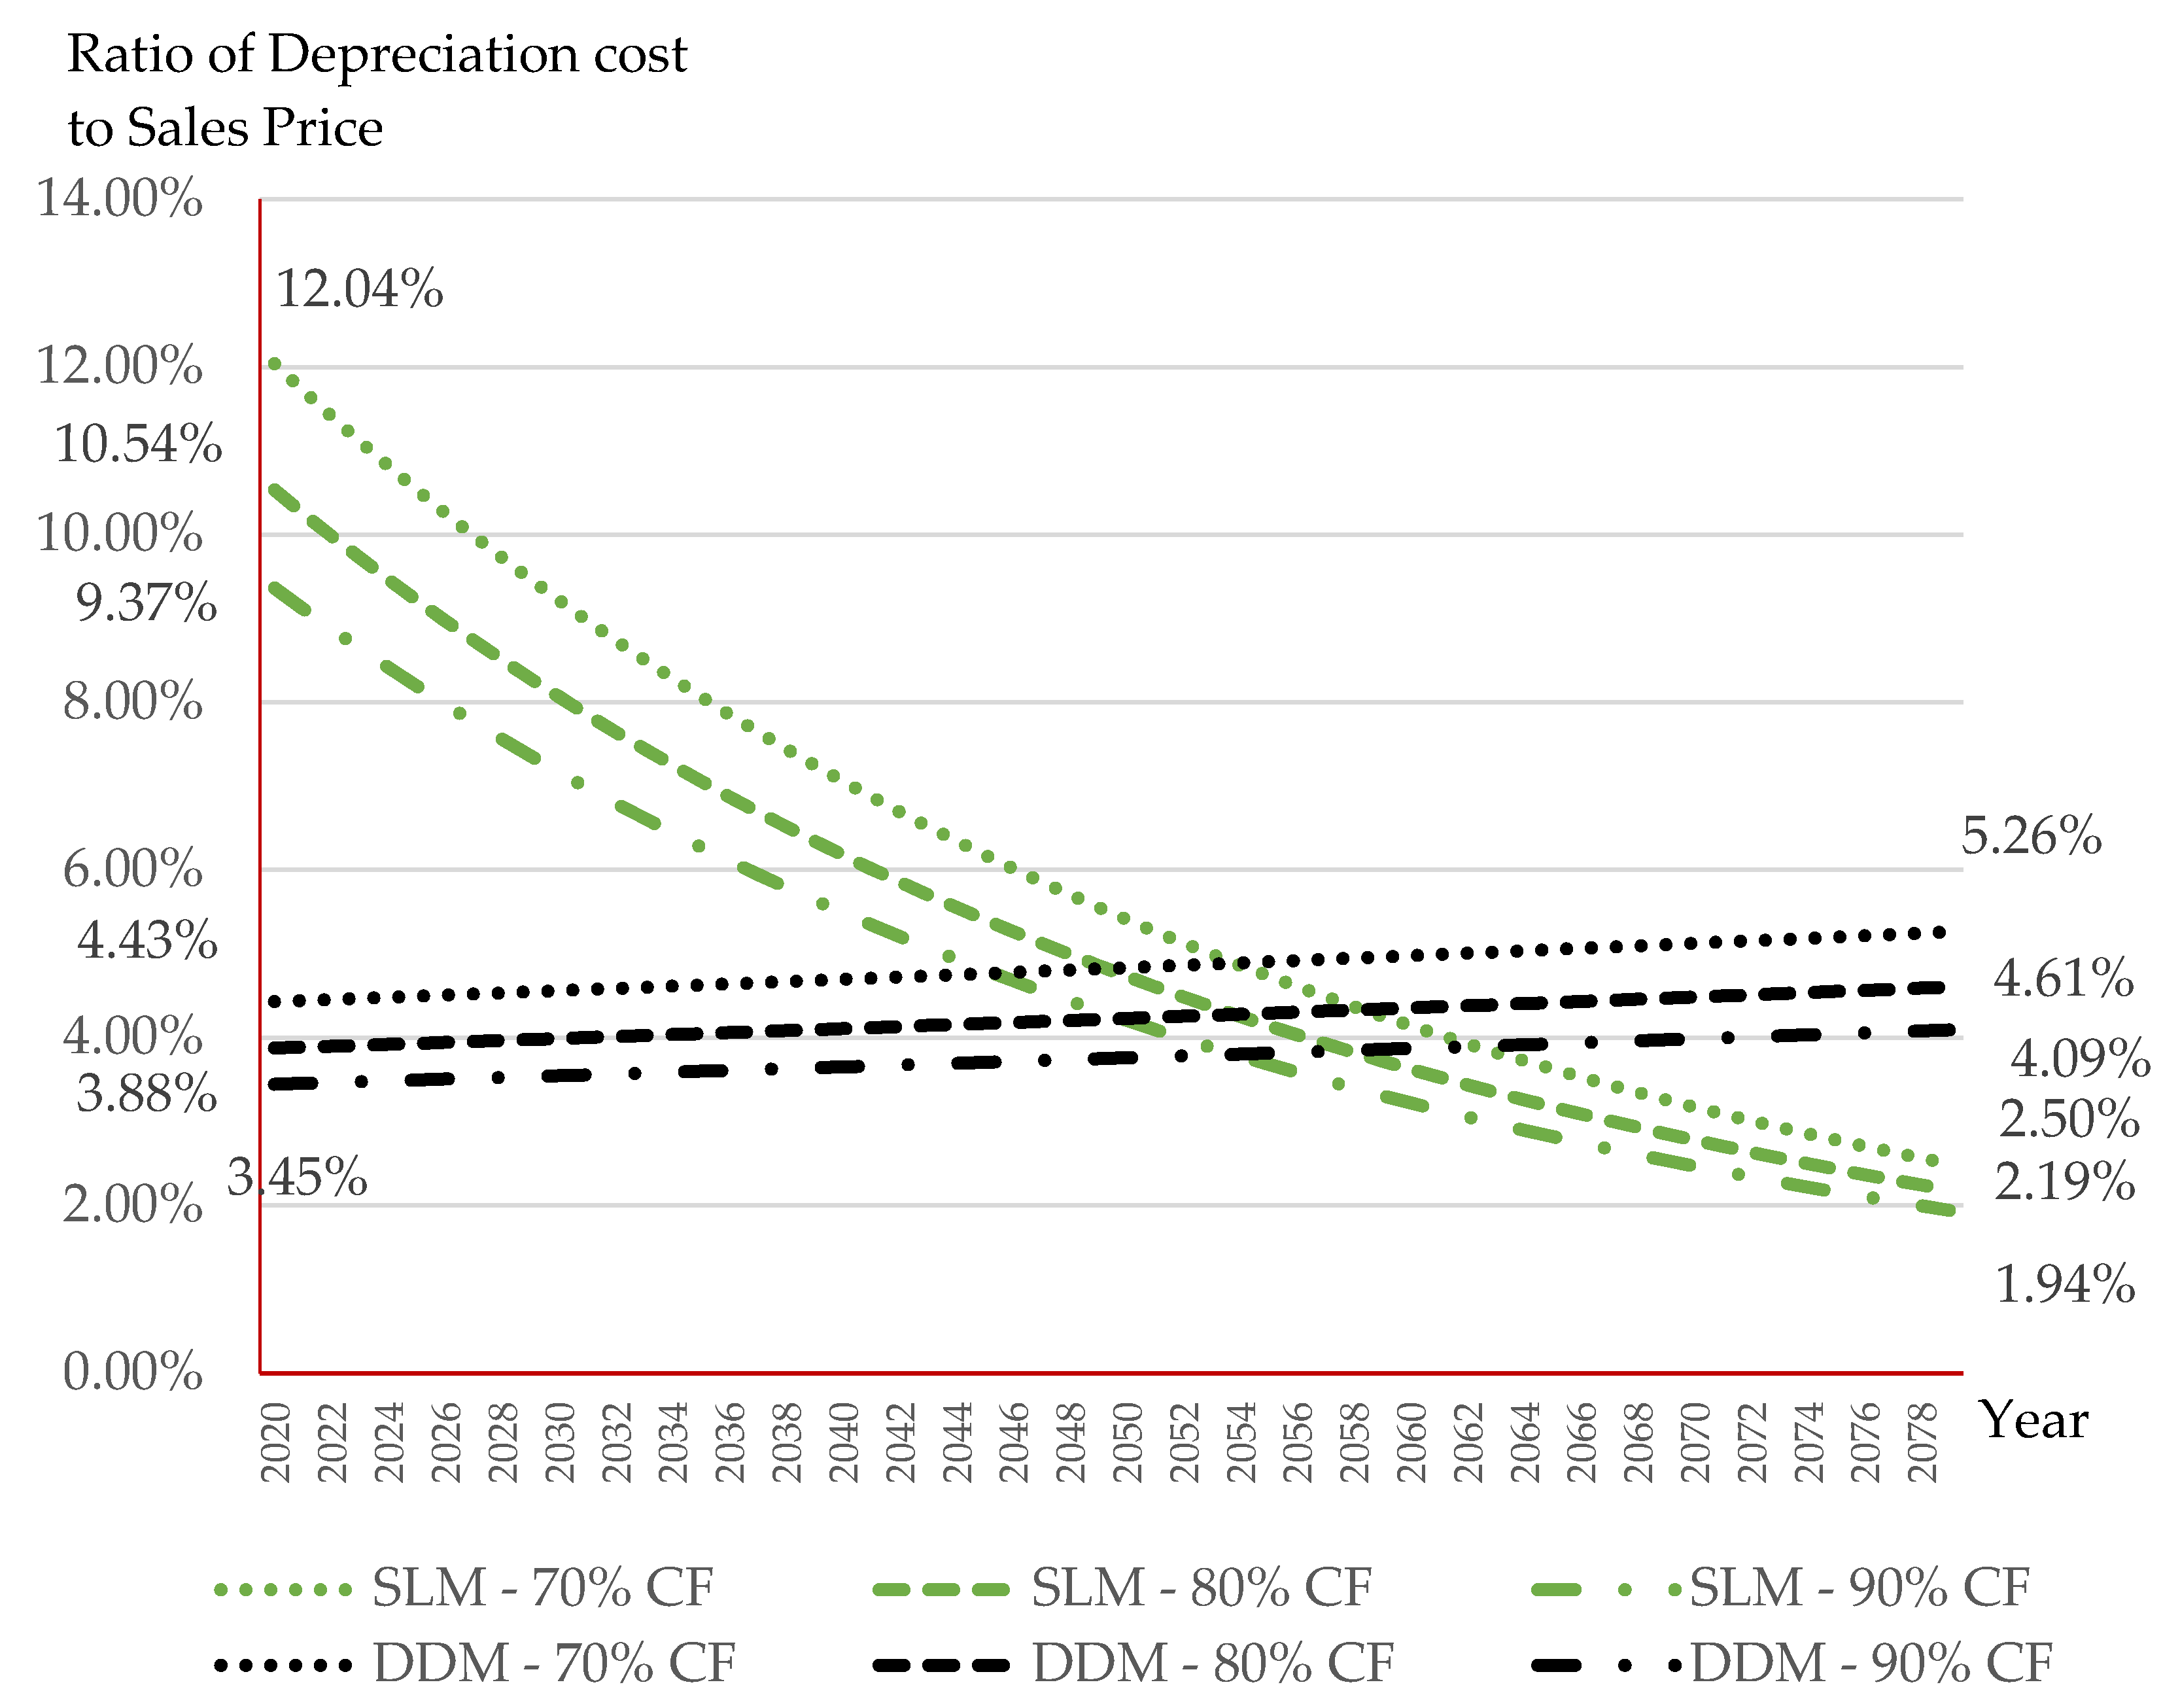
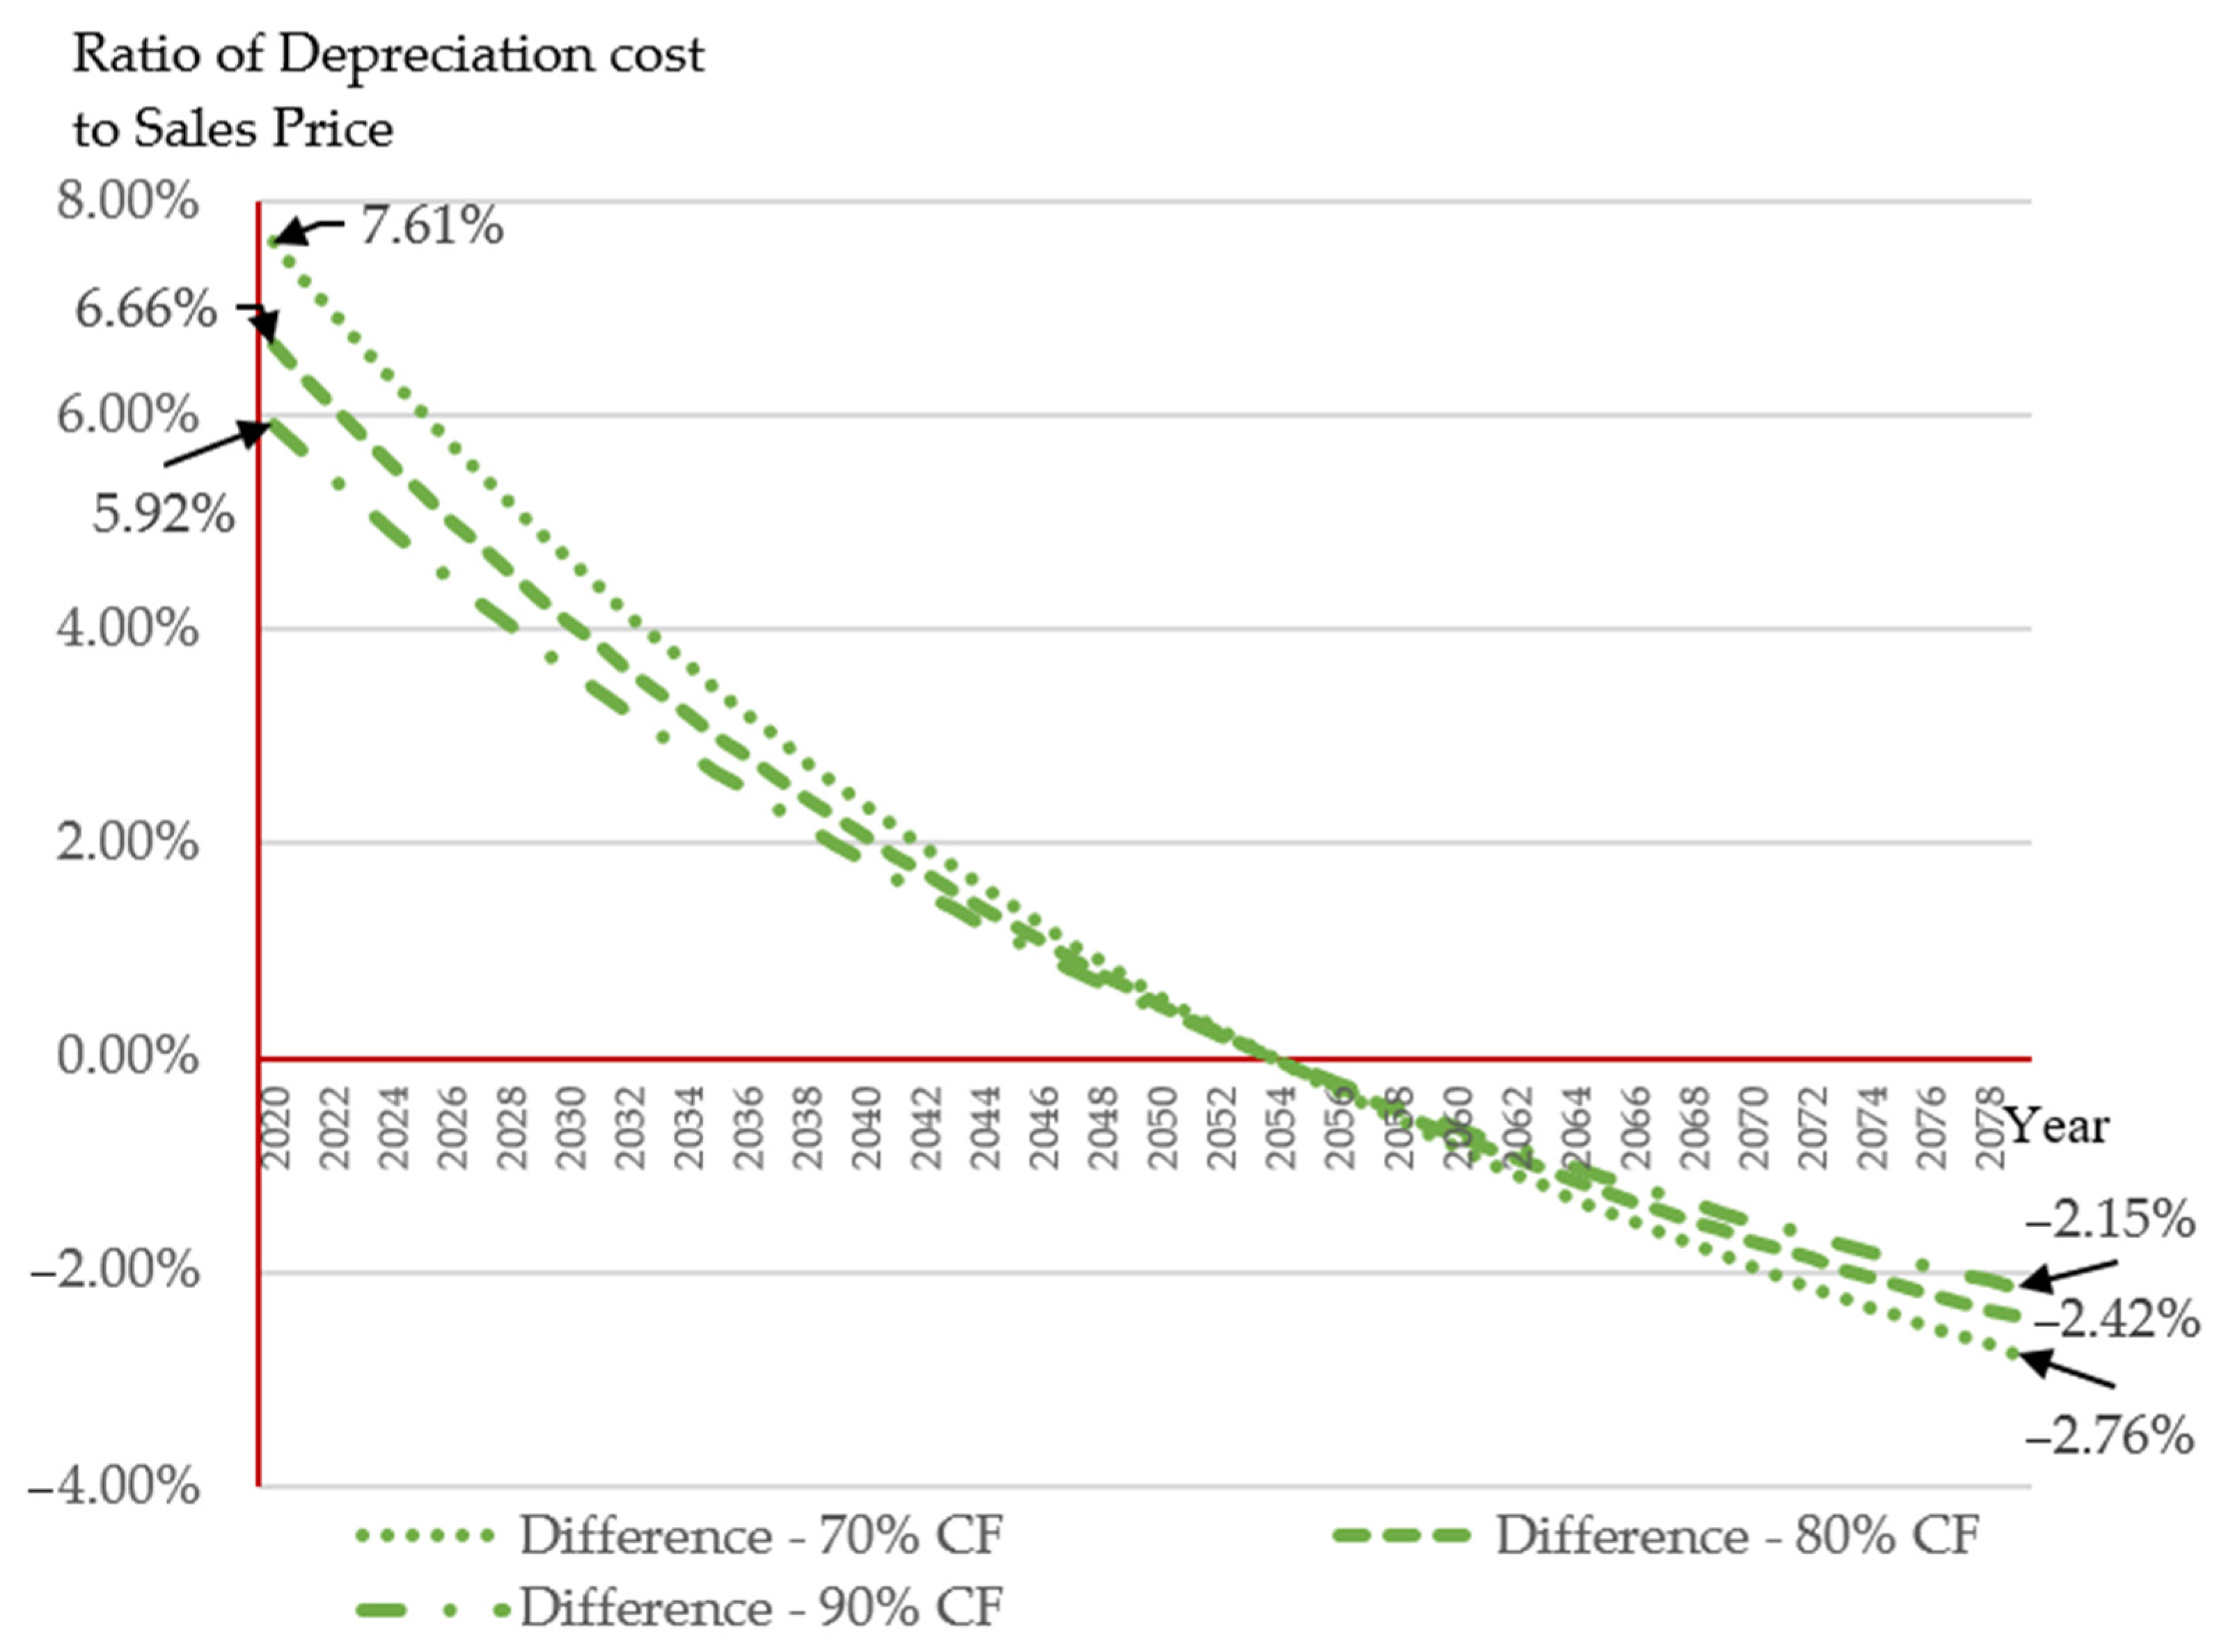
3.3. Results of Analysis of Ratio of Depreciation Cost to Sales Price

Figure 5 calculates the ratio of depreciation cost relative to sales price for the given scenarios under the SLM and DDM.
In the case of SLM, the depreciation costs as a percentage of sales price in the first year were 12.04% for 70% CF, 10.54% for 80% CF, and 9.37% for 90% CF. When CF decreased from 90% to 80%, 80% to 70%, and 90% to 70%, the net profit relative to sales price fell by 1.17%, 1.21%, and 2.68%, respectively.
The ratios in the last year were 1.94% for 90% CF, 2.19% for 80% CF, and 2.50% for 70% CF, as the depreciation cost under the SLM remains constant during the operation of nuclear power plants even as sales price increases. In the case of the SLM, the difference in the ratio of depreciation cost to sales price among the given scenarios was larger in the initial stage and decreased over time.
In the case of DDM. The depreciation costs as a percentage of sales price in the first year were 4.43% for 70% CF, 3.88% for 80% CF, and 3.45% for 90% CF. When CF of nuclear decreased from 90% to 80%, 80% to 70%, and 90% to 70%, the net profits relative to sales price fell by 0.43%, 0.55% and 0.98%, respectively.
The ratios in the last year were 4.09% for 90% CF, 4.61% for 80% CF, and 5.26% for 70% CF. In the DDM, the ratio of depreciation cost to sales price remains relatively constant during the operation of nuclear power plants. This is because both depreciation cost and sales price increase by 3% and 2.7% year-on-year, respectively.
Assuming positive inflation, that is, a continuous increase in sales price over time, the proportion of depreciation cost relative to sales price is high for SLM in the initial phase and gradually decreases as time passes. If products are of a constant value, DDM is seen as a more rational method as the proportion of depreciation cost relative to sales price remains fairly steady over time.
Figure 6 shows the ratio of the difference between the SLM and the DDM depreciation cost relative to sales price by the scenarios.
There were noticeable differences of 7.61% for 70% CF, 6.66% for 80% CF, and 5.92% for 90% CF between the two methods during this period. Due to depreciation taking up a small proportion under the SLM in the initial stage of depreciation, companies experience a lower risk of having to raise sales price to maintain net income in the early stage of projects or after attracting large-scale investments.
In the case of the DDM, the small variation in the proportion of depreciation relative to sales price makes it a more rational method of depreciation than the SLM, given that a certain level of usage is maintained during the operation of nuclear power plants.
Based on the above, DDM is a more rational method of depreciation than SLM for nuclear power plants. Moreover, in the early stage of projects or immediately after attracting large-scale investments, DDM can calculate a smaller net loss or a higher net profit.

4. Conclusions and Implications

Currently, Korea is pushing to phase-out nuclear power. The nuclear phase-out policy presents severe consequences for the sustainable management of the nuclear power industry. The decrease in nuclear power generation leads to a higher unit cost of power generation. Companies have to raise the unit sales price to maintain profit margins, but price adjustment is difficult in Korea as the company responsible for operating nuclear power plants is a public corporation.
Against this backdrop, depreciation cost has a strong influence on cost calculation of nuclear power generation. The reasons why depreciation methods are important in calculating the nuclear power generation cost are as follows.
First, it is not affected by per unit costs such as direct material costs and direct labor costs. It falls under manufacturing indirect cost, which means a change in the production amount will cause a change in unit cost. Second, depreciation cost changes according to the method of calculation as it is derived systematically instead of relying on actual expenses. Third, it accounts for a higher proportion of cost with increasing purchasing cost of tangible assets, which are subject to depreciation.
Therefore, this study first analyzes the effect of depreciation cost of long-term tangible assets such as nuclear power plants on the cost of power generation in predesigned scenarios under the nuclear phase-out policy. Second, it reviews the new method of DDM proposed by Kim et al. [25] in addition to the SLM, which is currently being used as a depreciation method for nuclear power plants. Lastly, it compares the effects of the SLM and DDM while taking into account the impact of the nuclear phase-out policy on sustainable management.
The conclusions are as follows.
First, the depreciation cost per unit assumes the form of a downward-sloping exponential function according to the increasing CF. As such, the results present that the annual depreciation cost has a greater influence on unit cost when the CF is low.
Second, the decrease in CF of nuclear power plants according to the nuclear phase-out policy thus has a negative impact on sustainable development and management of the nuclear power industry. As such, DDM is more beneficial for companies during this initial stage of depreciation under the nuclear phase-out policy.
Third, in the early stage of projects or immediately after attracting large-scale investments, DDM can have a lower sales price than SLM. Moreover, DDM can offer more positive signs for stockholders by calculating a smaller net loss or a higher net profit. Accordingly, the DDM as a method of depreciation for nuclear power plants under the nuclear phase-out policy offers companies greater flexibility in determining sales price, and also has a more positive effect on sustainable management.
This study examined the calculation of unit cost of power generation, an issue that affects all users of electricity, and analyzed the effect of change in depreciation cost on net profit of companies for different scenarios in relation to the nuclear phase-out policy. The significance of this study lies in presenting outcomes that benefit society and economy based on an analysis of the effect of government policy on sustainable management.
The limitations of this study are as follows. First, all calculations were made while assuming positive inflation. However, this assumption may not be valid for the entire 60-year period. Second, DDM is not acknowledged under current accounting standards. Continued discussions on DDM are expected to open up the possibility of applying more rational methods of depreciation in real-world calculations.
In addition, more meaningful results may be obtained if Net Present Value (NPV) of the cash-flows analysis is conducted in relation to the findings of this study as a further study.

Author Contributions

The main theme of this paper was developed by S.B. and was coordinated by S.P., S.B. wrote the manuscript and S.P. prepared the submission process and materials of this paper. S.P. commented on the methodology and edited the results and conclusions. All authors have read and agreed to the published version of the manuscript.

Funding

This work was supported by the research grant of Pai Chai University in 2019, and the authors express their sincere gratitude for supporting this important work.

Institutional Review Board Statement

Not applicable.

Informed Consent Statement

Not applicable.

Data Availability Statement

Publicly available datasets were analyzed in this study. The URL of data can be found in Reference.

Acknowledgments

The authors highly appreciate the anonymous reviewers of this article for their helpful comments and suggestions, and the editors for their hard work.

Conflicts of Interest

The authors declare no conflict of interest.

References

  1. MOTIE. Nuclear Power Generation 2016; Ministry of Trade, Industry and Energy: Sejong, Korea, 2016; pp. 706–747.
  2. Nuclear Power Plant Status. Available online: https://npp.khnp.co.kr/index.khnp?menuCd=DOM_000000102002001001 (accessed on 31 December 2019).
  3. Power Generation Capacity of Nuclear Power Plants. Available online: https://npp.khnp.co.kr/idex.khnp?menuCd=DOM_000000102002001002 (accessed on 31 December 2019).
  4. MOTIE. 8th Basic Plan for Electricity Supply and Demand; No. 2017-611; Ministry of Trade, Industry and Energy: Sejong, Korea, 2017; pp. 1–41.
  5. Nam, H. Impact of nuclear phase-out policy and energy balance in 2029 based on the 8th Basic Plan for long-term electricity supply and demand in South Korea. Renew. Sustain. Energy Rev. 2020, 122, 109723. [Google Scholar] [CrossRef]
  6. Capacity Factor of Nuclear Power Plants. Available online: https://npp.khnp.co.kr/index.khnp?menuCd=DOM_000000102002003000 (accessed on 31 December 2019).
  7. Kim, K.S. Changes in risk perception of Seoul National University students in nuclear power under opposing government policy. Sustainability 2018, 10, 2350. [Google Scholar] [CrossRef] [Green Version]
  8. MOTIE. 9th Basic Plan for Electricity Supply and Demand; No. 2020-741; Ministry of Trade, Industry and Energy: Sejong, Korea, 2020; pp. 1–47.
  9. Kang, S.J. The Theory of Cost Estimation; Dunam Press: Seoul, Korea, 2010; pp. 25–33, 341–345. [Google Scholar]
  10. Garrison, R.H.; Noreen, E.W.; Brewer, P.C. Managerial Accounting, 13th ed.; McGraw-Hill: New York, NY, USA, 2010; pp. 36–53. [Google Scholar]
  11. Mowen, M.M.; Hansen, D.R.; Heitger, D.L. Cornerstones of Managerial Accounting, 5th ed.; Cengage Learning: Boston, MA, USA, 2014; pp. 28–92. [Google Scholar]
  12. Baek, T.Y. Management Accounting, 7th ed.; Shinyoungsa Press: Paju, Korea, 2021; pp. 41–58. [Google Scholar]
  13. Kim, S.; Ko, W.; Bang, S. Analysis of unit process cost for an engineering-scale pyroprocess facility using a process costing method in Korea. Energies 2015, 8, 8775–8797. [Google Scholar] [CrossRef] [Green Version]
  14. Bang, S.; Chung, Y.; Chun, D.; Kwon, C.; Hong, S. Cost estimation and efficiency analysis of Korean CANDU spent fuel disposal alternatives in consideration of future price volatility. Sci. Technol. Nuclear Install. 2016, 2016. [Google Scholar] [CrossRef]
  15. Kim, S.; Jang, H.; Gao, R.; Kim, C.; Chung, Y.; Bang, S. Break-Even Point Analysis of Sodium-Cooled Fast Reactor Capital Investment Cost Comparing the Direct Disposal Option and Pyro-Sodium-Cooled Fast Reactor Nuclear Fuel Cycle Option in Korea. Sustainability 2017, 9, 1518. [Google Scholar] [CrossRef] [Green Version]
  16. NABO. Issues and Problems of Nuclear Power Generation Costs; National Assembly Budget Office: Seoul, Korea, 2014; pp. 32–33, 36–38.
  17. KHNP. Nuclear Power Generation 2016; Korea Hydro & Nuclear Power Co. LTD.: Gyeongju, Korea, 2016; pp. 164–179. [Google Scholar]
  18. KAERI. An Economic Feasibility Study on the Introduction Scenarios of Sodium-Cooled Fast Reactor; KAERI/CM-2007/2014; Korea Atomic Energy Research Institute: Daejeon, Korea, 2014; p. 46. [Google Scholar]
  19. MOTIE. Regulations for Calculating Radioactive Waste Management Costs and Spent Fuel Management Charges; No. 2013-63; Ministry of Trade, Industry and Energy: Sejong, Korea, 2013; p. 5.
  20. MOTIE. Regulations for Calculating Radioactive Waste Management Costs and Spent Fuel Management Charges; No. 2015-132; Ministry of Trade, Industry and Energy: Sejong, Korea, 2015; p. 3.
  21. MOTIE. Regulations for Calculating Radioactive Waste Management Costs and Spent Fuel Management Charges; No. 2017-195; Ministry of Trade, Industry and Energy: Sejong, Korea, 2017; p. 5.
  22. MOTIE. Regulations for Calculating Radioactive Waste Management Costs and Spent Fuel Management Charges; No. 2019-217; Ministry of Trade, Industry and Energy: Sejong, Korea, 2019; p. 6.
  23. Weygandt, J.J.; Kieso, D.E.; Kimmel, P.D. Accounting Principles, 8th ed.; Wiley: Danvers, CO, USA, 2008; pp. 422–441. [Google Scholar]
  24. Kieso, D.E.; Weygandt, J.J.; Warfield, T.D. Intermediate Accounting: IFRS Edition, 2nd ed.; Wiley: Danvers, CO, USA, 2014; pp. 494–503. [Google Scholar]
  25. Kim, S.; Ko, W.; Youn, S.; Gao, R.; Chung, Y.; Bang, S. Advanced depreciation cost analysis for a commercial pyroprocess facility in Korea. Nuclear Eng. Technol. 2016, 48, 733–743. [Google Scholar] [CrossRef] [Green Version]
  26. Lee, H.I.; Choi, K.; Baek, W.S.; Choi, Y.S. Accounting Principles, 10th ed.; Shinyoungsa Press: Paju, Korea, 2021; pp. 447–456. [Google Scholar]
  27. KHNP. Audit Report 2019; Korea Hydro & Nuclear Power Co. LTD: Gyeongju, Korea, 2020; pp. 80–81. [Google Scholar]
  28. Moonitz, M.; Brown, E.C. The annuity method of estimating depreciation. Account. Rev. 1939, 14, 424–429. Available online: http://www.jstor.org/stable/239369 (accessed on 31 December 2020).
  29. Reynolds, I.N. Selecting the proper depreciation method. Account. Rev. 1961, 36, 239–248. Available online: https://www.jstor.org/stable/243227 (accessed on 31 December 2020).
  30. Zeff, S. The IASB and FASB stumble over the annuity method of depreciation. Account. Eur. 2014, 11, 55–57. [Google Scholar] [CrossRef]
  31. Electricity Sales Price. Available online: http://epsis.kpx.or.kr/epsisnew/selectEkmaUpsBftChart.do?menuId=040701 (accessed on 31 December 2019).
Figure 1. The depreciation cost analysis results of the SLM and DDM.
Sustainability 13 05270 g001
Figure 2. The depreciation cost per unit of the SLM and DDM for the given CF.
Sustainability 13 05270 g002
Figure 3. The depreciation cost per unit for the given scenarios using the SLM and DDM.
Sustainability 13 05270 g003
Figure 4. The difference between the depreciation cost per unit of the given SLM and DDM scenarios.
Sustainability 13 05270 g004
Figure 5. The ratio of depreciation cost relative to sales price for the given scenarios under the SLM and DDM.
Sustainability 13 05270 g005
Figure 6. The ratio of the difference between the SLM and the DDM depreciation cost relative to sales price by the scenarios.
Sustainability 13 05270 g006
Table 1. The construction cost of Singori Units 3 and 4.
CategoryCapacity (MW)Construction Cost (Million USD)Durable Period (Year)
Two UnitsOne Unit
APR 140014006481324160
Price base: The end of 2012, exchange rate: 1 USD = 1000 KRW (Korean Won).
Table 2. The estimated construction costs of nuclear power plant.
YearInflation Rate (%)Estimated Construction Cost (Million USD)
2012-3241
20132.9303336
20142.9303433
20151.4003481
20161.4003530
20171.2103573
20181.2103616
20191.1003656
20201.1003696
Exchange rate: 1 USD = 1000 KRW.
Table 3. The capacity factor of nuclear power plants was 89.02% from 2001 to 2019.
CategoryYearCapacity Factor (%)Average (%)
Before the policy200193.289.02
200292.7
200394.2
200491.4
200595.5
200692.3
200790.3
200893.4
200991.7
201091.2
201190.7
201282.3
2013 *75.5
201485.0
201585.3
201679.7
After the policy201771.269.23
201865.9
201970.6
* In 2013, due to the forgery of the Quality Verification Document (QVD), the nuclear power plants had been shut down for long-term inspection.
Table 4. The amounts of power generation under the different scenarios.
ScenarioAssumptionCFPower Generation (kW)
1Continuation-nuclear phase-out policy708,584,800,000
2Compromise809,811,200,000
3Discontinuation-nuclear phase-out policy9011,037,600,000
Table 5. The unit sales price of electricity from 2011 to 2019.
YearSales Price Per Unit
(USD/kWh)
Year-on-Year Increase RateAverage Increase Rate
20010.03965 0.027
(2.7%)
20020.03955−0.002
20030.043120.090
20040.03952−0.083
20050.03910−0.011
20060.03813−0.025
20070.039400.033
20080.03902−0.010
20090.03556−0.089
20100.039610.114
20110.03912−0.012
20120.039520.010
20130.03903−0.013
20140.054700.401
20150.062690.146
20160.067910.083
20170.06068−0.106
20180.062100.023
20190.05831−0.061
Table 6. Input data and analysis method.
CategoryInput Data and Analysis MethodReferences
Construction cost3696 (million USD)2020 year
Durable period60 years
Depreciation methodStraight-line method
Decelerated Depreciation Method
Scenarios of CF70%After the policy
80%Compromise (Average)
90%Before the policy
Sales price increase rate0.027 (2.7%)Average increase rate
Exchange rate1 USD = 1000 KRW
Publisher’s Note: MDPI stays neutral with regard to jurisdictional claims in published maps and institutional affiliations.

