Article

The Effect of Water Rights Trading Policy on Water Resource Utilization Efficiency: Evidence from a Quasi-Natural Experiment in China

Northwest Institute of Historical Environment and Socio-Economic Development, Shaanxi Normal University, Xi’an 710119, China
*
Author to whom correspondence should be addressed.
Sustainability 2021, 13(9), 5281; https://doi.org/10.3390/su13095281
Submission received: 30 March 2021 / Revised: 28 April 2021 / Accepted: 5 May 2021 / Published: 9 May 2021
(This article belongs to the Section Resources and Sustainable Utilization)

Abstract

:
Water shortage has become a serious problem in the world, and low water efficiency is the key to industrial and agricultural production and sustainable economic development. Based on the data of 30 provinces (municipalities) in China from 2010 to 2017, this study builds a DEA model based on the hybrid network structure of water systems to measure water resource utilization efficiency and uses a difference-in-differences (DID) model to examine the effects of the water rights trading policy on water resource utilization efficiency. We find that the water rights trading policy can significantly promote the total water efficiency of the water resources system and the initial water use efficiency, and after a series of robustness tests, the result is still valid. Further analysis indicates that the policy effect changes with the adjustment of the industrial and agricultural water use structure. Moreover, the dynamic impact of water rights trading policy on water resource utilization efficiency is still significant. This study provides macroscopic evidence for evaluating the effects of China’s water rights trading policy and offers new ideas and experiences for improving China’s water resource utilization efficiency.

1. Introduction

Water shortage has become a serious problem in the world, and inefficient water use is the key restriction to industrial and agricultural production and sustainable economic development [1,2,3]. In response to the current problem of low water efficiency, governments around the world have successively issued a series of water resources management policies [4,5,6,7]. Since 2000, the Chinese government has introduced a number of policies to achieve the reasonable utilization and effective allocation of water resources [8,9,10,11]. In 2014, China implemented the water rights trading policy (The water rights trading policy implemented in 2014 includes registration of water use right confirmation, water right transaction and circulation, and water right system construction. The pilot areas are required to control the total amount of water resources, confirm the right to each household, and give priority to water conservation. The system of water right confirmation, trading and supervision should be initially established to form various water rights trading modes among river basins, upstream and downstream of river basins, regions, industries, and water users.), which aimed to explore and progressively build a system of water rights and water conservation priorities, and provided a scientific guide for water conservation and water management [11]. In this context, studying the impact of the water rights trading policy on water resource utilization efficiency in China is crucial to promoting sustainable water resource development and alleviating water shortages.
Some literature has investigated that many factors have significant impacts on water resource utilization efficiency [11,12,13,14,15,16]. For example, Zhao et al., (2017) find that the direct and indirect effects of domestic water consumption, degree of opening up, and industrial structure are the primary significant influencing factors of the overall efficiency of water resources in China [15]. Ma et al., (2016) show that industrial structure, government interference, and water resource endowment have a negative effect on water utilization efficiency, but the price of water resources is insignificant [14].
Other literature has examined the consequences of water rights. First of all, initial water rights allocation is the premise of water rights trading, which is of great significance to the establishment of a water market, the formation of a water-saving system, and the alleviation of the contradiction between supply and demand of water resources [17,18,19]. Therefore, a large number of studies are devoted to the construction of an effective model to achieve the optimal allocation of initial water rights. For example, Yu et al., (2017) built the MIKE HYDRO model [20] and Garrick et al., (2013) built the transaction cost analysis model to investigate the initial water rights allocation and put forward the optimal water rights allocation method [21], so as to promote the effective allocation of water resources between basins and improve the utilization efficiency of water resources. Furthermore, water rights and their trading markets are effective mechanisms to address the pressure of water shortage [22]. At the same time, water rights can mitigate the threat of climate change to agricultural production [23] and reduce agricultural production risks. Moreover, rational distribution of water rights is conducive to coping with the pressure of uneven distribution of water resources, so that farmers who need more water can obtain sufficient water consumption to ensure effective irrigation of land and thus improve agricultural income [24,25]. Finally, water rights can promote the progress of agricultural water-saving irrigation technology. Under the dual pressure of industrial water crowding and limited agricultural water rights allocation, farmers will take the initiative to improve water-saving irrigation technology, thus increasing irrigation efficiency and reducing irrigation water consumption [11].
To sum up, existing studies have focused on water resource utilization efficiency from different aspects, but there is still a lack of research on the impact of water rights trading policy on water resource utilization efficiency. Based on this, we will comprehensively evaluate the impact and mechanism of water rights trading policy on water resource utilization efficiency. In 2011, the Chinese government introduced the most stringent water resource management system and, in 2014, introduced a water rights trading policy. In 2020, the National 14th Five-Year Plan further pointed out that it is necessary to improve the optimal allocation of water resources, implement national water-saving actions, establish a rigid restraint system for water resources, and improve the level of intensive and safe use of water resources. Under the background of the country’s implementation of water-saving strategies and the implementation of natural resource market-oriented reforms, this study measures water resource utilization efficiency in stages and departments and studies the impact of water rights trading policy on water resource utilization efficiency in various regions in China, regional differences, and their mechanisms, which is of great significance to the further promotion of market-oriented reform of water rights trading in all provinces and regions in China.
This study makes three contributions to the literature. First, our study confirms that water rights trading policy can promote water resource utilization efficiency, which extends existing studies on the determinants of water resource utilization efficiency. The current literature on government policies on water resource utilization efficiency often focuses on the degree of government intervention, and few studies have focused on the impact of water rights trading policies. Second, this study expands the impact mechanism of water rights trading policy on water resource utilization efficiency, from adjusting the structure of industrial and agricultural water use, and then improving the regional water resource utilization efficiency, which helps to supplement the existing literature on the impact mechanism analysis of water resource utilization efficiency. Third, the DID method is used to deal with the estimation bias in previous studies and to identify the “net effect” of water rights trading policy on water resource utilization efficiency. There are strong endogenous problems with the impact of water rights trading policy on water resource utilization efficiency [11]. This research adopts “water rights pilot areas” as a quasi-natural experiment to construct the DID between the provinces (municipalities) and the time level, which better alleviates the endogeneity problems and provides new ideas for relevant research.
The remainder of the paper proceeds as follows. Section 2 is for materials and methods. Section 3 is the results and discussion section. Section 4 presents the conclusions and policy suggestions.

2. Materials and Methods

2.1. Water Resource Utilization Efficiency Measurement

2.1.1. Measurement Methods

We use the network DEA model to measure water resource utilization efficiency in China. Specifically, based on the improved two-stage and two-sector hybrid network structure, this study divides the water resources system into an industrial sector and a domestic sector. Due to the availability and reliability of the data, this research only analyzes the efficiency assessments of the two water use sectors (industrial sector and domestic sector). Taking into account the undesired output, the water resources system is divided into the initial water use stage and the sewage treatment stage. In this system, specific inputs/outputs are dedicated to a certain subsector of the water resource system. Shared inputs/outputs are allocated to various sectors of the water resource system with an unclear distribution. In contrast to shared inputs/outputs, public inputs/outputs are distributed across socio-economic systems, which are not confined to the water resource system and cannot identify the specific proportion in the water resource system.
The specific process is as follows. In the first stage of the water resources operation system, that is, the initial water use stage, industrial water and domestic water are used as specific inputs for the industrial and domestic sectors, respectively. Fixed asset investment is used as a public input, pipeline length is used as a shared input, and industrial sewage and domestic sewage is used as a specific undesired output of the industrial and domestic sectors, and the gross regional product and the disposable income of residents are used as public output. In the second stage of the water resources operation system, the sewage treatment stage, the domestic sewage and industrial sewage produced in the first stage are used as specific inputs for the industrial and domestic sectors at this stage, and the sewage treatment operation cost is used as the shared input for this stage. The two-stage steps of the system are linked by the amount of sewage discharge. In addition, the single-stage and single-department efficiency in the system can be calculated by the input-oriented and output-oriented CCR model. However, the efficiency value of each decision-making unit should be standardized and calculated by weight scaling and scaling to avoid the input–output mismatch between departments when multi-departments operate together.
According to the above analysis, the construction model is as follows:
s t e p   1 :   ξ * = M I N ξ
s t e p   2 :   e * = M A X e
s t e p   3 : e f f = ξ * e *
s t e p   1 :   s . t . { j = 1 n w j ( φ j t x i j K ) ξ x i 0 K j = 1 n w j ( φ j max x l j S ) ξ x l 0 S j = 1 n w j x q j C ξ x q 0 C j = 1 n w j ν min y r j C y r 0 C j = 1 n w j ( φ j t z p j ) ξ z p 0 ν min = min { 1 ,   φ j min } w j 0
s t e p   2 :   s . t . { j = 1 n β j ( η j max x m j S ) x m 0 S j = 1 n β j ( μ j t z p j ) = z p 0 j = 1 n β j ( μ j t y u j S ) e y u 0 t η max = max { φ j t ,   μ j t } β j 0
where Equation (1) is the objective function of water efficiency in the first stage, ξ * represents the water efficiency of the first stage. Equation (2) is the objective function of the wastewater treatment efficiency in the second stage, e represents the wastewater treatment efficiency in the second stage. Equation (3) is the overall efficiency of the entire water resources system. In the constraints, x represents input, y represents expected output, z represents undesired output, xK represents specific input, xS represents shared input, xC represents public input, yK represents specific output, yS represents common output, and yC represents public output. φ refers to the scaling weight of the specific indicators of water efficiency in the first stage, which is determined by the water consumption of the two sub-sectors in the first stage. μ refers to the scaling weight of the specific indicators of wastewater treatment efficiency in the second stage, which is determined by the wastewater discharge volume in the second stage. In the standardization process, according to the worst-case assumption, the two-stage shared input indicators select the maximum parameter value and the shared output and the specific output take the minimum so that all decision-making units are compared under the same production frontier. This study uses the above-mentioned method to measure the efficiency of water resource utilization at the provincial level in China from 2010 to 2017.

2.1.2. Input and Output Variables Selection

Water efficiency in the first stage of the industrial sector: industrial water for specific inputs, pipeline length for shared inputs, fixed asset investment for public inputs, GDP for the public expected output, the disposable income of residents, and industrial sewage for undesired output.
Pollution treatment in the second stage of the industrial sector: industrial wastewater for specific inputs, annual wastewater treatment costs for shared inputs, and expected output of industrial wastewater.
Water efficiency in the first stage of the living sector: domestic water for specific inputs, pipeline length for shared inputs, fixed asset investment for public inputs, and GDP for public expected output, the disposable income of residents, and domestic sewage for undesired output.
Pollution treatment in the second stage of the living sector: industrial sewage for specific inputs, annual sewage treatment costs for shared inputs, and expected output of domestic wastewater.

2.2. Water Rights Trading Policy and Water Resource Utilization Efficiency

2.2.1. Sample and Data

The research objects of this article are 30 provinces (municipalities) in China from 2010 to 2017. Since the data of Tibet, Macao, Hong Kong, and Taiwan are not available, those provinces are excluded. In order to analyze the impact of water rights trading policy on water resource utilization efficiency and its mechanism, the basic data of this article comes from the 2011–2018 China Statistical Yearbook and China Water Resources Bulletin.

2.2.2. Variable Selection

(1)
Explained variable: water resource utilization efficiency
This paper selects the total water efficiency of the water resources system, the initial water use efficiency, and the wastewater treatment efficiency to measure the water resource utilization efficiency.
(2)
Explanatory variable: water rights trading policy
Water rights trading policy is the explanatory variable of this study. If the province (municipality) i belongs to the pilot area in year t, the value is 1; otherwise, the value is 0. Specifically, the Ministry of Water Resources issued the “Notice of the Ministry of Water Resources on the Implementation of Water Rights Pilot Work” in 2014, proposing to launch water rights pilot projects in seven provinces, including Ningxia, Jiangxi, Hubei, Inner Mongolia, Henan, Gansu, and Guangdong. Based on this, we selected the seven pilot provinces (municipalities) as the experimental group and the remaining provinces (municipalities) as the control group.
(3)
Control variables
Based on previous research [26], in the regression analysis, this paper controls other variables that affect water resources utilization efficiency, including economic development level, industrial structure, water resources endowment, water pollution degree, industrial water use, agricultural water use, ecological water use, technological progress, time, and province (municipalities) fixed effects. Table 1 shows the description of all variables in the regression model and their descriptive statistics.

2.2.3. Econometric Model

This research takes the implementation of water rights trading policy as a quasi-natural experiment and uses the DID method to identify the impact of water rights trading policy on water resource utilization efficiency. We set the pilot policy-implementing areas to the “experimental group”, and others to the “control group”, so as to effectively compare the “net effects” of the areas in different groupings affected by policy at different periods. Therefore, the DID method compares the difference in water use efficiency between pilot and non-pilot areas before and after the policy is implemented. We build the following econometric model:
W U E i t = β 0 + β 1 T r e a t i t + β 2 X i t + μ i + λ t + ε i t
where i represents a province (municipality) and t indicates a year. The dependent variable is water resource utilization efficiency (WUEit). This study selects total water efficiency (TE), initial water use efficiency (ISE), and wastewater treatment efficiency (WTE) to measure the comprehensive water utilization efficiency. The main explanatory variable is water rights trading policy, which is a dummy variable and equals 1 if a province (municipality) is located in the pilot areas of water rights trading policy; otherwise, it equals 0. Xit represents the control variables at the provincial (municipality) level, including the level of economic development, industrial structure, water resources endowment, water pollution, industrial water use, agricultural water use, ecological water use, and technical level. μ i represents the time fixed effect. λ t represents the province fixed effect. ε i t   is the random perturbation term. In Formula (6), the coefficient of interest in this paper is β 1 . If the estimated value of β 1 is greater than 0, it means that compared with non-pilot areas, the policy promotes water resources utilization efficiency in the pilot areas.

3. Results and Discussion

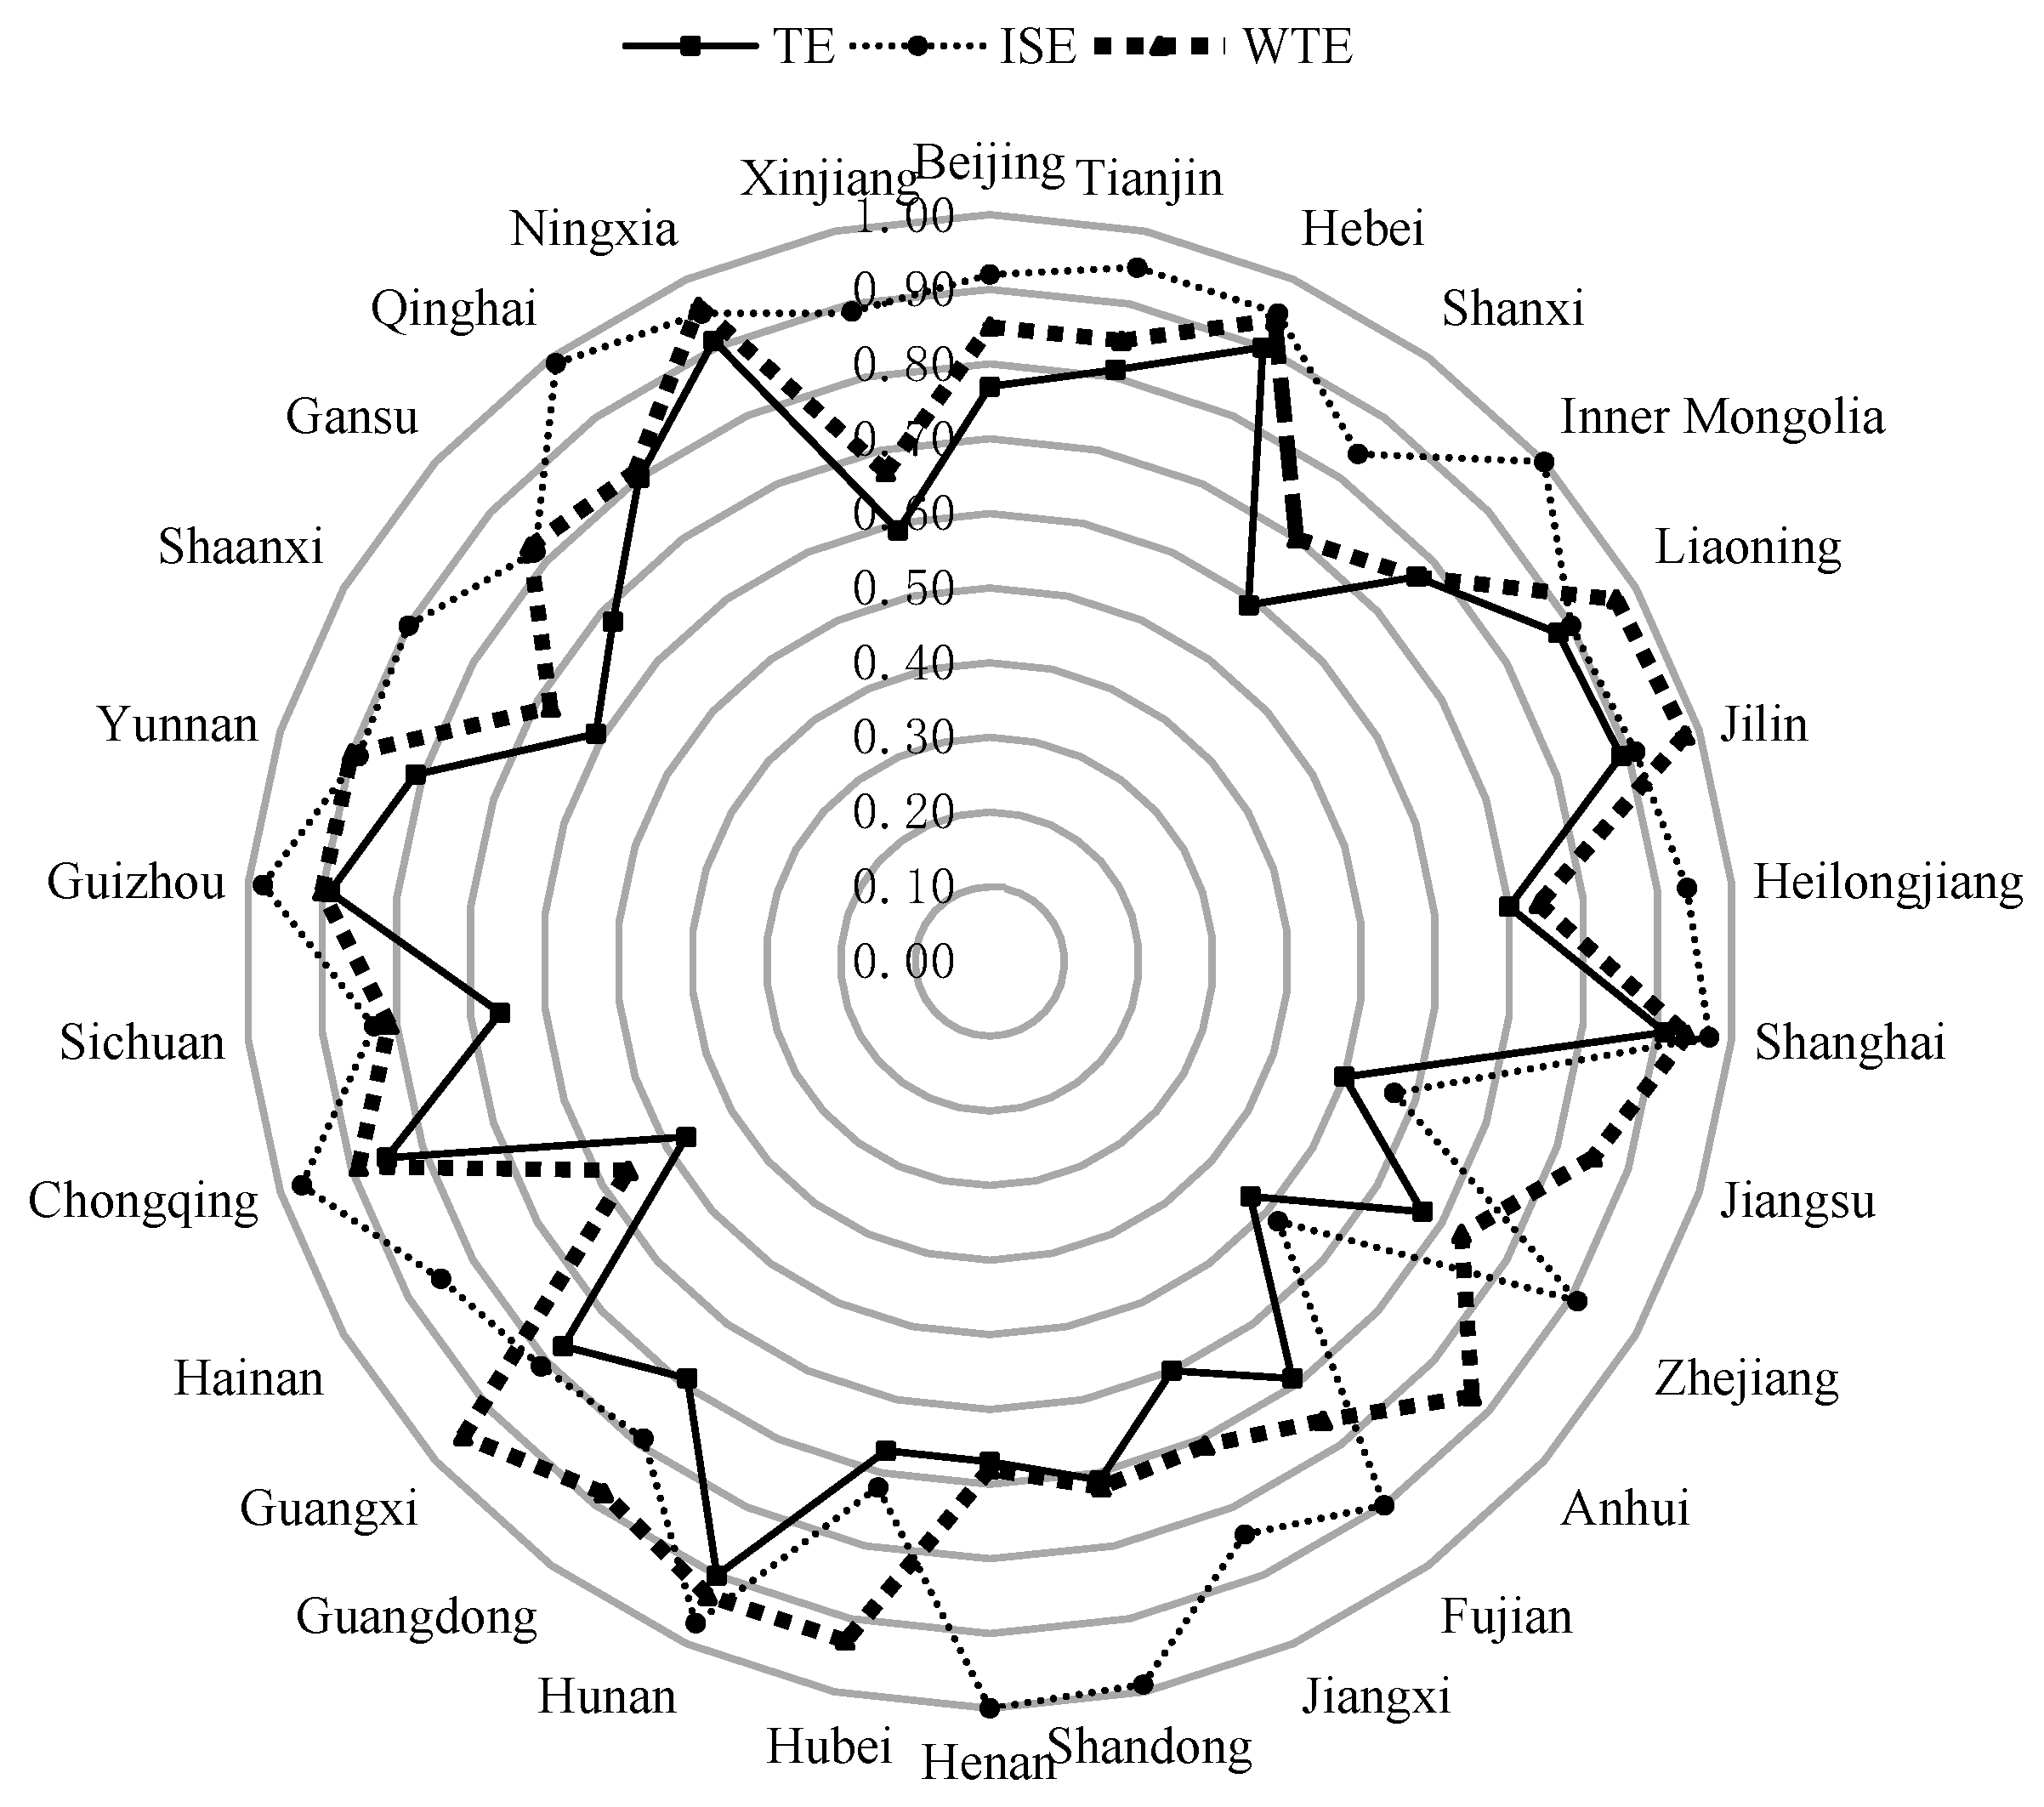
3.1. Estimate Results for Water Resource Utilization Efficiency

Based on the hybrid network DEA model, we calculate the stage efficiency and total efficiency of the water resources system in 30 provinces from 2010 to 2017. Table 2 shows the mean value and ranking of the water resource utilization efficiency of each province from 2010 to 2017. The average total water use efficiency of the national water resources system is 0.73, which belongs to the inefficiency category and very few provinces realize the simultaneous effects of both initial water use and wastewater treatment. This means that the efficiency of the national water resources system still has a large space for improvement, and it is necessary to design reasonable water resource management and water environment policies. The water resources system operation process is divided into the initial water and sewage treatment phase. We find that the initial water use efficiency is higher than the wastewater treatment efficiency, which shows that on the whole, water resources in our country is still in the stage of “treatment after pollution”, and in the water resources management system for the prevention and control of water pollution of policy enforcement, there is still a large room for improvement. Although China introduced the “Water Pollution Law of the People‘s Republic of China” in 2008 and implemented the most stringent water resources management system in 2012, the policy implementation is still doubtful. This result further confirms the findings of Bian et al., (2014) and Zhou et al., (2018) [27,28].
Specifically, the average total efficiency of the water resources system in Northeast China is the highest, followed by the highest in the western region, indicating that the increase of national efficiency is mainly contributed by the two regions. On the contrary, the total efficiency of the water resources system in the eastern and central regions is generally low. In fact, the National Development and Reform Commission and the Ministry of Water Resources have carried out pilot projects on comprehensive prevention and control of soil and water loss in black soil areas in Northeast China, increasing investment in governance equipment by 10 billion RMB, conducting research, and obtaining major technical breakthroughs in water resources analysis and management, hydrological monitoring, and other aspects so as to adjust the corresponding policies and regulations, and greatly improve the water quality in Northeast China [29]. As a key area of environmental protection in the “Three River Sources”, the western region has a significant impact on China’s ecological environment and is also an important resource and energy strategic base in China [9]. Vigorously reducing industrial wastewater discharge is the top priority to improve the ecological level. The eastern region has superior water resource endowment, high water consumption, and sewage discharge, which proves that the sewage treatment efficiency hinders the improvement of water efficiency in the eastern region, indicating that the eastern region may not fully consider water environmental pollution in the process of using advanced technology to promote economic development in the future, resulting in the decline of the overall efficiency of the eastern region’s water resources system [30]. Since the central government launched the rise strategy of the central region in 2006, the central region has begun to undertake large-scale industrial transfer from the eastern region, and the regional GDP has grown rapidly. However, the extensive economic growth has further increased the pressure on the environment, and the sewage discharge per unit of water consumption will also continue to grow [31]. Therefore, the water use efficiency of the central region during this period is low.
Figure 1 shows the consistency of the three types of water resource utilization efficiency in each province from 2010 to 2017. It can be seen from Figure 1 that the change trends of the three types of water resource utilization efficiency in Shanghai and Ningxia are basically consistent [32,33]. The main reason is that Shanghai is located in the eastern region of China. The advantage of water resource endowment makes its total water resources and water consumption higher. The technical level of Shanghai makes its initial water use efficiency higher. At the same time, its rapid economic development makes pollution emissions higher, leading to its wastewater treatment efficiency ranking slightly lagging behind in Ningxia, located in the western region of China, and its water pollution is facing a shortage. Secondly, Ningxia carried out the registration of water resources use rights in 2014 and carried out a series of trading policy reforms of water rights according to the indicators of total regional water use control, which is helpful to improve the utilization efficiency of water resources [34,35]. In Figure 1, we also find that the three types of water resource utilization efficiencies in Inner Mongolia and Henan are the lowest, which is supplemented by its explanation. This is because Inner Mongolia and Henan are located in the central region of China. Literature shows that the initial water use efficiency in the central region of China has the most potential, but because of its extensive sewage discharge system, the sewage treatment efficiency ranks behind [36,37]. This shows that Inner Mongolia and Henan continue to improve the ability to integrate and optimize resources, accelerate industrial upgrading and coordinated development, improve wastewater treatment efficiency, and have the ability to prevent and control pollution. We must attach great importance to the economic value and ecological environment function of water resources and strengthen the consciousness of “three red lines” in water resources management. It is necessary to strictly implement the “pollution red line”, strengthen the pollution supervision of major rivers and lakes, strictly control the total discharge of water ecological function areas, and realize all-round monitoring, adhere to the water protection system of source prevention and control, middle-end control, and terminal treatment, so as to realize the comprehensive control and treatment of industrial wastewater, agricultural wastewater, and urban and rural domestic wastewater. It can be seen that for Shanxi, Jiangxi, Hainan, Sichuan, Shaanxi, Gansu, and Xinjiang, due to the low ranking of initial water use efficiency and sewage treatment rate, it is urgent to improve both water efficiency to improve the efficiency of the water resource system.
Table 3 presents the mean value of water resource use efficiency in the pilot areas and non-pilot areas during 2010–2017, and intuitively analyzes the time trend change of water resource use efficiency through the comparison before and after the implementation of the policy. For the total efficiency of the water resource system, the mean efficiency of the water resource system in the pilot area was lower than that in the non-pilot area before the implementation of the policy and higher than that in the non-pilot area after the implementation of the policy. At the same time, the total efficiency of the water resources system in the pilot area was lower than the national average level before the implementation of the policy and higher than the national average level after the implementation of the policy. The variation trend of the primary water use efficiency is consistent with the total efficiency of the water resources system, while the wastewater treatment efficiency presents different trends. The wastewater treatment efficiency in pilot areas was lower than the average level of the non-pilot areas and the whole country before and after the implementation of the policy. The implementation of the water rights trading policy helps to improve the total efficiency and initial water use efficiency of water resources but has little effect on the efficiency of wastewater treatment efficiency. This conclusion has a high degree of consistency in the literature. In this revision, we read the literature and policy implications and its persuasive explanation. Water rights trading policy has been used by many countries to formulate water resources management policies and distribution models [38]. Delorit et al., (2019) studied the water rights policy model and pointed out that Chile’s water trade in 1981 can produce Pareto efficiency and promote this water resource management model in many developing countries [22]. Therefore, the water rights trading policy promulgated by the state in 2014 provides a scientific guide for “water rights confirmation” and “water saving and water control”, and has a great role in promoting the optimal allocation of water resources, establishing a rigid constraint system of water resources, and improving the level of intensive and safe use of water resources [39]. The water rights trading policy improves the utilization efficiency of water resources by adjusting the water structure of industry and agriculture [16]. In the pilot area, the water rights trading policy was implemented in Ningxia water rights registration work, Jiangxi rural collective economic organizations carried out the construction of ponds and reservoirs, Hubei province issued rural collective water rights registration, the implementation of cross-regional water rights trading took place in Inner Mongolia, the implementation of river basin water rights trading in Henan, the implementation of water use associations in Gansu, the implementation of provincial water rights trading platform in Guangdong. The implementation of the water rights trading policy in the pilot area can promote the efficiency of water resource utilization by adjusting the structure of industrial and agricultural water, technical level, and water price but the water rights trading policy has not been realized.

3.2. Empirical Analysis and Results

3.2.1. Main Results

DID is used to analyze the impact of water right trading policy on water resource utilization efficiency. Table 4 reveals the main conclusions of this study. Columns (1)–(2) of Table 4 examine the impact of water rights trading policy on the total water use efficiency and initial water use efficiency of the water resources system. The regression results show that the estimator Treat is positive and significant at the 1% level, which indicates that after controlling the other variables, the water rights trading policy improves the overall efficiency of the water resource system in the region by 8.2 percentage points, and improves the initial water use efficiency by 9.0 percentage points compared with the non-water rights trading pilot area. It is because the prerequisite of a water rights trading system is that water rights have been reasonably allocated, the areas with water rights trading activities indicate that their water rights or water volume indicators have been well allocated, which realizes the clarification of the amount of water available to water users. Therefore, water volume indicators have a strong restraint on the behavior of water users and force to improve water resource utilization efficiency [40,41]. Also, the water rights transaction link is to make water rights a resource with market value, and a market price mechanism is used to force water rights holders with low water efficiency to consider the opportunity cost of water use, and actively transfer idle water rights to water users with large marginal benefits. New or potential water users have the opportunity to obtain the required water resources, thereby improving the overall water use efficiency [42,43]. Column (3) proves the impact of water rights trading policy on wastewater treatment efficiency, and the coefficient of the estimated Treat is positive and not significant, indicating that the water rights trading policy has no significant impact on wastewater treatment efficiency. The reasons are as follows. China’s water rights trading policy is still doubtful about the intensity of sewage control, which indicates that China’s water resource utilization is still in the stage of “pollution first, treatment later”.
From the results of control variables, the regional economic level has a significant positive impact on water resource utilization efficiency. Namely, the more developed the regional economic level is, the higher the water resource utilization efficiency is. This is because the higher the per capita GDP of a region, the higher the degree of industrial agglomeration, the more conducive to the development of local production equipment, water-saving technology, and carding facilities, thus contributing to the improvement of water resource utilization efficiency. The degree of water pollution has a significant negative effect on water resource utilization efficiency. In other words, the higher the degree of water pollution, the lower the water resource utilization efficiency. The reason lies in that the degree of water pollution is to some extent manifested by the government’s water environment control. The higher the COD emissions, the lower the government’s water environment control, which leads to the decrease of water resource utilization efficiency. The ratio of industrial water use has a significant negative impact on the total efficiency of the water resources system and has a significant negative impact on the wastewater treatment efficiency, but has no significant impact on the primary water use efficiency. This is due to the large amount of pollutants discharged from industrial water and the large proportion of industrial water, which leads to excessive sewage discharge, thus reducing the total efficiency of the water resources system and the efficiency of wastewater treatment.

3.2.2. Robustness Check

(1)
Parallel trend test
Since this paper uses the DID to evaluate the impact of water rights trading policy on water resource utilization efficiency, a prerequisite for the effectiveness of the DID is that if there is no external impact from the water rights trading policy, then the control group is parallel to the development trend of the water resource utilization efficiency of the experimental group. To this end, this paper conducts the following parallel trend test.
Based on previous literature, we drew a comparison chart between the control group and the experimental group to illustrate the changes before and after the implementation of the policy. As can be seen from Figure 2, firstly, the total efficiency of the water resource system in the regions that implemented the water rights trading policy and those that did not implement the water rights trading policy remained basically parallel before 2014, that is, similar development trends. Second, in 2014 and the years after 2014, the regions that implemented water rights trading policy showed a greater increase in the total efficiency of water resources systems than those that did not implement water rights trading policy.
(2)
Common trend test
In order to further verify whether the hypothetical conditions of parallel trends are true, we construct a time trend variable (Trend) to capture the linear time trends between the pilot areas and non-pilot areas and assign Trend values to 1, 2, 3, and 4 in 2010, 2011, 2012, and 2013, respectively. If there is no systematic difference between the time trends of pilot areas and non-pilot areas between 2010 and 2013, Treat should have statistically insignificant coefficients. The regression results in Table 5 show that the coefficient Trend is not significant, indicating that there is no systematic difference in the temporal trend between the pilot and non-pilot areas, that is, there is no violation of the parallel trend hypothesis of DID method.

3.2.3. Mechanism Analysis

The empirical study above shows that the water rights trading policy has a significant positive impact on water resource utilization efficiency. It is natural that we should further consider the mechanism through which the water rights trading policy has an impact. This part will discuss the impact of the mechanism of water rights trading policy on water resource utilization efficiency from the perspective of industrial and agricultural water use structure, in which industrial and agricultural water use structure is measured by the ratio of industrial added value to agricultural water use increase. To this end, we build the following measurement model:
W U E i t = β 0 + β 1 T r e a t i t × I n d A g r i t + β 2 T r e a t i t + β 3 I n d A g r i t + β 4 X i t + μ i + λ t + ε i t
Table 6 reports the differential effect of industrial and agricultural water use structure on water resource utilization efficiency of water rights trading policy. The study found that the first column (1)–(2) Treat×IndAgr coefficient is significant at the 10% level and is positive, that the water rights trading policy on the water use efficiency of promoting effect changes with the water structure changes of workers and peasants, the regional industrial added value of water is higher than the added value of agricultural water, the water rights trading policy is able to promote the efficiency of water resource utilization. Studies have shown that water displacement for industry and agriculture can relieve the pressure of water resources and promote the win-win situation between industrial water and agricultural water [11].

3.2.4. Dynamic Effects

In order to investigate the dynamic influence of the water rights trading policy on water resource utilization efficiency, the influence of water rights policy was decomposed into each year to observe the changing trend of water resource utilization efficiency. Regression results are shown in Table 7. The coefficient of TreatYear1 represents the impact of policies on water resource utilization efficiency in the first year after the water rights trading policy, and so on. Results showed that the water rights trading policy in the first year after the policy implementation began to increase water use efficiency. In the third year, water resource utilization efficiency and the utilization efficiency of water resources for the first time still increased significantly, and are significant at the 1% level, which means that the dynamic effects of the water rights trading policy on water use efficiency of are still significant.

4. Conclusions

Based on the data of 30 provinces (municipalities) in China from 2010 to 2017, this study builds a DEA model based on the hybrid network structure of water systems to measure water resource utilization efficiency and uses a DID model to examine the effects of water rights trading policy on water resource utilization efficiency. We find that water rights trading policy can significantly promote the overall efficiency of the water resource system and the initial water use efficiency, and after a series of robustness tests, the result is still valid. Further analysis indicates that the policy effect changes with the adjustment of the industrial and agricultural water use structure. Moreover, the dynamic impact of water rights trading policy on water resource utilization efficiency is still significant.
This paper provides scientific and reasonable evidence to solve the contradiction between water shortage and industrial and agricultural water use effectively and provides beneficial inspiration and reference for improving the utilization efficiency of water resources. First, this paper shows that the water rights trading policy can significantly promote the improvement of water resource utilization efficiency, which provides a reference for China’s water rights utilization policy to deal with the severe water crisis, and fully affirms the implementation and development of the water rights trading policy. Therefore, China should further extend these experiences to more regions and expand the implementation scope of the water rights trading policy. Second, the water rights trading policy can improve the utilization efficiency of water resources by changing the structure of water use for industry and agriculture. Therefore, each region should speed up the process of water replacement for industry and agriculture according to the actual local situation, so as to give full play to the promoting effect of water right policy on the utilization efficiency of water resources.

Author Contributions

Conceptualization, S.C.; Y.C. and J.L.; methodology, S.C. and J.L.; software, S.C.; validation, S.C.; Y.C. and J.L.; formal analysis, S.C. and J.L.; resources, Y.C.; data curation, J.L.; writing—original draft preparation, Y.C. and J.L.; writing—review and editing, S.C.; visualization, S.C.; supervision, S.C.; project administration, S.C.; funding acquisition, S.C. All authors have read and agreed to the published version of the manuscript.

Funding

This research was funded by the Fundamental Research Funds for the Central Universities, GK202103117, GK202103118; Shaanxi Federation of Humanities and Social Sciences Circles Research Program, grant number 2020Z005, 20FN-49; Soft Science Research Program in Shaanxi Province, grant numbers 2021KRM156, 2021KRM086.

Institutional Review Board Statement

Not applicable.

Informed Consent Statement

Not applicable.

Data Availability Statement

Data are not publicly available.

Conflicts of Interest

The authors declare no conflict of interest.

References

  1. Gerbens-Leenes, P.W.; Nonhebel, S. Critical Water Requirements for Food, Methodology and Policy Consequences for Food Se-curity. Food Policy 2004, 29, 547–564. [Google Scholar] [CrossRef]
  2. Hanjra, M.A.; Qureshi, M.E. Global water crisis and future food security in an era of climate change. Food Policy 2010, 35, 365–377. [Google Scholar] [CrossRef]
  3. Xue, J.; Guan, H.; Huo, Z.; Wang, F.; Huang, G.; Boll, J. Water Saving Practices Enhance Regional Efficiency of Water Consumption and Water Produc-tivity in an Arid Agricultural Area with Shallow Groundwater. Agric. Water Manag. 2017, 194, 78–89. [Google Scholar] [CrossRef]
  4. Kampas, A.; Petsakos, A.; Rozakis, S. Price Induced Irrigation Water Saving: Unraveling Conflicts and Synergies Between Eu-ropean Agricultural and Water Policies for a Greek Water District. Agric. Syst. 2012, 113, 28–38. [Google Scholar] [CrossRef]
  5. Wheeler, S.; Loch, A.; Zuo, A.; Bjornlund, H. Reviewing the adoption and impact of water markets in the Murray–Darling Basin, Australia. J. Hydrol. 2014, 518, 28–41. [Google Scholar] [CrossRef]
  6. Zanjanian, H.; Abdolabadi, H.; Niksokhan, M.H.; Sarang, A. Influential third party on water right conflict: A Game Theory approach to achieve the desired equilibrium (case study: Ilam dam, Iran). J. Environ. Manag. 2018, 214, 283–294. [Google Scholar] [CrossRef]
  7. Karunananthan, M. Can the human right to water disrupt neoliberal water policies in the era of corporate policy-making? Geoforum 2019, 98, 244–253. [Google Scholar] [CrossRef]
  8. Wang, H.; Xie, J.; Li, H. Water pricing with household surveys: A study of acceptability and willingness to pay in Chongqing, China. China Econ. Rev. 2010, 21, 136–149. [Google Scholar] [CrossRef]
  9. Tang, J.; Folmer, H.; Xue, J. Technical and allocative efficiency of irrigation water use in the Guanzhong Plain, China. Food Policy 2015, 50, 43–52. [Google Scholar] [CrossRef]
  10. Mu, L.; Wang, C.; Xue, B.; Wang, H.; Li, S. Assessing theImpact of Water Price Reform on Farmer’ Willingness to Pay for Agricultural Water in Northwest China. J. Clean. Prod. 2019, 234, 1072–1081. [Google Scholar]
  11. Fang, L.; Zhang, L. Does the Trading of Water Rights Encourage Technology Improvement and Agricultural Water Conserva-tion? Agric. Water Manag. 2020, 233, 106097. [Google Scholar] [CrossRef]
  12. Sun, C.; Zhao, L.; Zou, W.; Zheng, D. Water resource utilization efficiency and spatial spillover effects in China. J. Geogr. Sci. 2014, 24, 771–788. [Google Scholar] [CrossRef] [Green Version]
  13. Wang, Y.; Bian, Y.; Xu, H. Water use efficiency and related pollutants’ abatement costs of regional industrial systems in China: A slacks-based measure approach. J. Clean. Prod. 2015, 101, 301–310. [Google Scholar] [CrossRef]
  14. Ma, H.; Shi, C.; Chou, N.-T. China’s Water Utilization Efficiency: An Analysis with Environmental Considerations. Sustainability 2016, 8, 516. [Google Scholar] [CrossRef] [Green Version]
  15. Zhao, L.; Sun, C.; Liu, F. Interprovincial two-stage water resource utilization efficiency under environmental constraint and spatial spillover effects in China. J. Clean. Prod. 2017, 164, 715–725. [Google Scholar] [CrossRef]
  16. Liu, K.-D.; Yang, G.-L.; Yang, D.-G. Investigating industrial water-use efficiency in mainland China: An improved SBM-DEA model. J. Environ. Manag. 2020, 270, 110859. [Google Scholar] [CrossRef] [PubMed]
  17. Goetz, R.U.; Martínez, Y.M.; Xabadia, À. Efficiency and acceptance of new water allocation rules—The case of an agricultural water users association. Sci. Total Environ. 2017, 601–602, 614–625. [Google Scholar] [CrossRef] [PubMed] [Green Version]
  18. Xu, Z.; Yao, L.; Zhang, Q.; Dowaki, K.; Long, Y. Inequality of water allocation and policy response considering virtual water trade: A case study of Lanzhou city, China. J. Clean. Prod. 2020, 269, 122326. [Google Scholar] [CrossRef]
  19. Xu, Y.; Zhu, X.; Wen, X.; Herrera-Viedma, E. Fuzzy best-worst method and its application in initial water rights allocation. Appl. Soft Comput. 2021, 101, 107007. [Google Scholar] [CrossRef]
  20. Yu, Y.; Yu, R.; Chen, X.; Yu, G.; Gan, M.; Disse, M. Agricultural water allocation strategies along the oasis of Tarim River in Northwest China. Agric. Water Manag. 2017, 187, 24–36. [Google Scholar] [CrossRef]
  21. Garrick, D.; Whitten, S.M.; Coggan, A. Understanding the evolution and performance of water markets and allocation policy: A transaction costs analysis framework. Ecol. Econ. 2013, 88, 195–205. [Google Scholar] [CrossRef]
  22. Delorit, J.D.; Parker, D.P.; Block, P.J. An agro-economic approach to framing perennial farm-scale water resources demand management for water rights markets. Agric. Water Manag. 2019, 218, 68–81. [Google Scholar] [CrossRef]
  23. Bigelow, D.P.; Zhang, H. Supplemental irrigation water rights and climate change adaptation. Ecol. Econ. 2018, 154, 156–167. [Google Scholar] [CrossRef]
  24. Wang, Y. A simulation of water markets with transaction costs. Agric. Water Manag. 2012, 103, 54–61. [Google Scholar] [CrossRef]
  25. Bekchanov, M.; Bhaduri, A.; Ringler, C. Potential gains from water rights trading in the Aral Sea Basin. Agric. Water Manag. 2015, 152, 41–56. [Google Scholar] [CrossRef]
  26. Chen, Y.; Yin, G.; Liu, K. Regional differences in the industrial water use efficiency of China: The spatial spillover effect and relevant factors. Resour. Conserv. Recycl. 2021, 167, 105239. [Google Scholar] [CrossRef]
  27. Bian, Y.; Yan, S.; Xu, H. Efficiency Evaluation for Regional Urban Water Use and Wastewater Decontamination Systems in China: ADEA Approach. J. Resourc. Conserv. Recycl. 2014, 83, 15–23. [Google Scholar] [CrossRef]
  28. Zhou, X.; Luo, R.; Yao, L.; Cao, S.; Wang, S.; Lev, B. Assessing Integrated Water Used and Wasterwater Treatment Systems in China: A Mixed Network Structure Two-Stage SBM-DEA Model. J. Clear. Prod. 2018, 185, 533–546. [Google Scholar] [CrossRef]
  29. Wang, G.; Chen, J.; Wu, F.; Li, Z. An integrated analysis of agricultural water-use efficiency: A case study in the Heihe River Basin in Northwest China. Phys. Chem. Earth Parts A/B/C 2015, 89–90, 3–9. [Google Scholar] [CrossRef]
  30. Xia, P.; Wu, J.; Ji, X.; Xi, P. A DEA-based empirical analysis for dynamic performance of China’s regional coke production chain. Sci. Total Environ. 2020, 717, 136890. [Google Scholar] [CrossRef]
  31. Li, N.; Yang, H.; Wang, L. Optimization of Industry Structure Based on Water Environmental Carrying Capacity under Un-certainty of the Huai River Basin within Shandong Province, China. J. Clean. Prod. 2016, 112, 4594–4604. [Google Scholar] [CrossRef]
  32. Li, P.; Qian, H. Water Resources Research to Supporta Sustainable China. Int. J. Water Resourc. Dev. 2018, 34, 327–336. [Google Scholar] [CrossRef] [Green Version]
  33. Zhou, Z.; Wu, H.; Song, P. Measuring the resource and environmental efficiency of industrial water consumption in China: A non-radial directional distance function. J. Clean. Prod. 2019, 240, 118169. [Google Scholar] [CrossRef]
  34. Hu, J.L.; Wang, S.C.; Yeh, F.Y. Total-Factor Water Efficiency of Regions in China. J. Resourc. Policy 2006, 31, 217–230. [Google Scholar] [CrossRef]
  35. Zhao, H.; Qu, S.; Liu, Y.; Guo, S.; Zhao, H.; Chiu, A.C.; Liang, S.; Zou, J.-P.; Xu, M. Virtual water scarcity risk in China. Resour. Conserv. Recycl. 2020, 160, 104886. [Google Scholar] [CrossRef]
  36. Deng, G.; Li, L.; Song, Y. Provincial water use efficiency measurement and factor analysis in China: Based on SBM-DEA model. Ecol. Indic. 2016, 69, 12–18. [Google Scholar] [CrossRef]
  37. Geng, Q.; Ren, Q.; Nolan, R.H.; Wu, P.; Yu, Q. Assessing China’s agricultural water use efficiency in a green-blue water perspective: A study based on data envelopment analysis. Ecol. Indic. 2019, 96, 329–335. [Google Scholar] [CrossRef]
  38. Alcon, F.; Tapsuwan, S.; Brouwer, R.; de Miguel, M.D. Adoption of irrigation water policies to guarantee water supply: A choice experiment. Environ. Sci. Policy 2014, 44, 226–236. [Google Scholar] [CrossRef]
  39. Huang, Q.; Wang, J.; Li, Y. Do water saving technologies save water? Empirical evidence from North China. J. Environ. Econ. Manag. 2017, 82, 1–16. [Google Scholar] [CrossRef]
  40. Sekhon, H.S.; Singh, G.; Sharma, P.; Bains, T.S. Water Use Efficiency under Stress Environments. In Climate Change and Management of Cool Season Grain Legume Crops; Yadav, S.S., Redden, R., Eds.; Springer: Berlin/Heidelberg, Germany, 2010; pp. 207–227. [Google Scholar]
  41. Zhou, D.; Zhang, Z.; Shi, M. Where is the future for a growing metropolis in North China under water resource constraints? Sustain. Sci. 2014, 10, 113–122. [Google Scholar] [CrossRef]
  42. Grafton, R.Q.; Squires, D.; Fox, K.J. Private Property and Economic Efficiency: A Study of a Common-Pool Resource. J. Law Econ. 2000, 43, 679–713. [Google Scholar] [CrossRef]
  43. Krasnozhon, L.O. Property Rights and Farm Efficiency: Evidence from Ukraine. Econ. Chang. Restruct. 2011, 44, 279–295. [Google Scholar] [CrossRef]
Figure 1. Average value of water resources efficiency in various regions from 2010 to 2017.
Sustainability 13 05281 g001
Figure 2. Parallel trend check chart.
Sustainability 13 05281 g002
Table 1. Variable definition and descriptive statistics.
VariableDefinitionsMeanSDMinMax
Dependent variables
TETotal efficiency of water resources system in each province0.7320.1780.2411.000
ISEInitial water use efficiency of each province0.8870.1630.2951.000
WTEWastewater treatment efficiency by province (including non-expected output)0.8280.1400.3801.000
Independent variable
TreatProvince i is a water policy pilot area in year t and takes the value 1; otherwise, it is 0
Control variables
LnPerGDPNatural logarithm of per capita GDP of each province10.6330.4859.30311.768
IndustryStructureRatio of primary industry and secondary industry in each province0.2360.1750.0121.607
PerWaterPer capita water resources in each province0.2160.2510.0071.607
LnCODNatural logarithm of COD emission in each province3.8100.8161.7495.290
IndusWaterRateProportion of total industrial water use in each province0.1730.4100.0033.988
AgriWaterRateThe proportion of the total amount of water occupied by agricultural water in each province0.8262.2210.00418.120
EcoloWaterRateProportion of total water occupied by ecological water in each province0.0290.0670.0000.423
LnFinanceExpoNatural value of science and technology expenditure of each province8.1010.6256.0699.618
Table 2. The mean value of water resource utilization efficiency of each province from 2010 to 2017.
ProvinceTotal Water Use EfficiencyRankInitial Water Use EfficiencyRankWastewater Treatment EfficiencyRank
Beijing0.77 120.92 130.85 14
Tianjin0.81 90.95 90.85 14
Hebei0.90 30.95 90.94 5
Shanxi0.59 260.84 220.70 26
Inner Mongolia0.77 121.00 10.77 20
Liaoning0.88 70.90 160.97 2
Jilin0.89 50.91 140.98 1
Heilongjiang0.70 160.94 120.74 22
Shanghai0.91 10.97 60.94 5
Jiangsu0.50 280.57 290.85 14
Zhejiang0.67 200.91 140.73 23
Anhui0.47 290.52 300.87 13
Fujian0.69 170.90 160.76 21
Jiangxi0.60 250.84 220.71 25
Shandong0.71 150.99 30.72 24
Henan0.67 201.00 10.68 27
Hubei0.67 200.72 280.93 7
Hunan0.90 30.97 60.93 7
Guangdong0.69 170.79 270.88 12
Guangxi0.77 120.81 260.95 4
Hainan0.47 290.85 210.56 30
Chongqing0.85 80.97 60.89 11
Sichuan0.66 230.83 240.81 18
Guizhou0.89 50.98 50.90 9
Yunnan0.81 90.89 190.90 9
Shaanxi0.61 240.90 160.68 27
Gansu0.68 190.82 250.83 17
Qinghai0.80 110.99 30.81 18
Ningxia0.91 10.95 90.96 3
Xinjiang0.59 260.89 190.67 29
East0.71 0.88 0.81
Central0.65 0.82 0.80
West0.76 0.91 0.83
NorthEast0.82 0.92 0.90
China0.73 0.88 0.83
Table 3. The mean value of water resource use efficiency in pilot and non-pilot areas during 2010–2017.
Before Policy ImplementationAfter Policy Implementation
2010201120122013Mean2014201520162017Mean
Total water use efficiency Pilot area0.740.750.710.690.720.700.690.700.710.70
Non-pilot area0.790.790.780.780.780.770.710.620.680.68
All0.780.780.760.760.770.750.710.640.640.69
Initial water use efficiencyPilot area0.910.900.840.880.880.890.880.810.870.86
Non-pilot area0.930.940.930.950.940.920.890.720.800.83
All0.930.930.910.930.930.910.890.740.810.84
Wastewater treatment efficiencyPilot area0.830.840.860.790.830.790.790.860.810.81
Non-pilot area0.850.840.830.820.840.830.800.850.790.82
All0.850.840.840.810.840.820.800.850.790.82
Table 4. Water rights trading pilot policies and water resource utilization efficiency.
Variable(1)(2)(3)
TEISEWTE
Treat0.089 ***
(0.033)
0.090 ***
(0.033)
0.010
(0.025)
LnPerGDP0.672 ***
(0.213)
0.404 **
(0.177)
0.336 **
(0.165)
IndustryStructure−0.210
(0.211)
−0.456 *
(0.250)
0.139
(0.153)
PerWater−0.119
(0.127)
−0.075
(0.148)
−0.071
(0.129)
LnCOD−0.182 ***
(0.050)
−0.130 ***
(0.047)
−0.061 *
(0.037)
IndusWaterRate−0.059 **
(0.024)
−0.022
(0.017)
−0.046 **
(0.021)
AgriWaterRate0.005
(0.009)
−0.008
(0.009)
0.010 **
(0.005)
EcoloWaterRate0.021
(0.180)
0.134
(0.306)
0.018
(0.291)
LnFinanceExpo−0.061
(0.177)
−0.057
(0.162)
−0.064
(0.134)
_Cons−5.191 ***
(1.975)
−2.355
(1.657)
−2.024
(1.361)
Year FEYesYesYes
Province FEYesYesYes
N240240240
R20.7000.6600.671
Note: ***, ** and * indicate significance at the levels of 1%, 5%, and 10%, respectively. The standard errors adjusted by province-year clustering are in brackets.
Table 5. Common trend test.
Variable(1)(2)(3)
TEISEWTE
Trend−0.006
(0.017)
−0.014
(0.015)
0.006
(0.012)
LnPerGDP0.588
(0.368)
0.261
(0.194)
0.389
(0.330)
IndustryStructure−0.900
(0.599)
−0.084
(0.269)
−0.818
(0.547)
PerWater0.145
(0.185)
0.111
(0.108)
0.048
(0.155)
LnCOD−0.147
(0.101)
−0.086
(0.076)
−0.072
(0.076)
IndusWaterRate−0.087 **
(0.034)
−0.026
(0.017)
−0.062 **
(0.027)
AgriWaterRate0.016 **
(0.006)
−0.001
(0.003)
0.016 **
(0.007)
EcoloWaterRate−0.361
(0.694)
0.360
(0.354)
−0.668
(0.810)
LnFinanceExpo−0.206
(0.395)
0.096
(0.169)
−0.318
(0.339)
_Cons−3.017
(3.181)
−2.246
(1.723)
−0.262
(2.762)
Year FEYesYesYes
Province FEYesYesYes
N120120120
R20.7860.8550.818
Note: ** indicate significance at the levels of 5%. The standard errors adjusted by province-year clustering are in brackets.
Table 6. Water rights trading pilot policies, water use structure for industry and agriculture and water resource utilization efficiency.
Variable(1)(2)(3)
TEISEWTE
Treat×IndAgr0.003
(0.002)
0.004 *
(0.002)
0.001
(0.001)
Treat0.091 ***
(0.033)
0.090 ***
(0.032)
0.012
(0.025)
IndAgr0.000
(0.000)
−0.000
(0.000)
0.000
(0.000)
LnPerGDP0.678 ***
(0.214)
0.402 **
(0.178)
0.343 **
(0.165)
IndustryStructure−0.187
(0.211)
−0.441 *
(0.246)
0.153
(0.155)
PerWater−0.118
(0.127)
−0.083
(0.149)
−0.064
(0.129)
LnCOD−0.182 ***
(0.050)
−0.130 ***
(0.047)
−0.061
(0.037)
IndusWaterRate−0.055 **
(0.025)
−0.026
(0.020)
−0.039
(0.025)
AgriWaterdRate0.004
(0.009)
−0.008
(0.009)
0.010 **
(0.005)
EcoloWaterRate0.032
(0.180)
0.132
(0.308)
0.030
(0.292)
LnFinanceExpo−0.062
(0.177)
−0.059
(0.163)
−0.064
(0.133)
_Cons−5.253 ***
(1.991)
−2.323
(1.682)
−2.112
(1.368)
Year FEYesYesYes
Province FEYesYesYes
N240240240
R20.7020.6620.673
Note: ***, ** and * indicate significance at the levels of 1%, 5%, and 10%, respectively. The standard errors adjusted by province-year clustering are in brackets.
Table 7. Dynamic effects.
Variable(1)(2)(3)
TEISEWTE
Treat*Year10.063
(0.063)
0.047
(0.060)
0.019
(0.034)
Treat*Year20.144 ***
(0.051)
0.133 ***
(0.050)
0.028
(0.051)
Treat*ear30.148 ***
(0.052)
0.123 **
(0.061)
0.044
(0.057)
LnPerGDP0.597 ***
(0.174)
0.385 ***
(0.147)
0.280 *
(0.149)
IndustryStructure−0.253
(0.171)
−0.352 *
(0.184)
0.005
(0.139)
PerWater−0.220 *
(0.121)
−0.045
(0.127)
−0.195
(0.132)
LnCOD−0.170 ***
(0.044)
−0.122 ***
(0.041)
−0.060 *
(0.033)
IndusWaterRate−0.057 **
(0.024)
−0.019
(0.017)
−0.047 **
(0.022)
AgriWaterRate0.003
(0.010)
−0.010
(0.009)
0.010 **
(0.004)
EcoloWaterRate0.034
(0.175)
0.187
(0.287)
−0.012
(0.295)
LnFinanceExpo−0.081
(0.148)
−0.095
(0.128)
−0.050
(0.130)
_Cons−4.211 ***
(1.620)
−1.885
(1.356)
−1.478
(1.190)
Year FEYesYesYes
Province FEYesYesYes
N270270270
R20.7030.6720.647
Note: ***, ** and * indicate significance at the levels of 1%, 5%, and 10%, respectively. The standard errors adjusted by province-year clustering are in brackets.
Publisher’s Note: MDPI stays neutral with regard to jurisdictional claims in published maps and institutional affiliations.

