Article

Analysis of Turbulent Flow Structure with Its Fluvial Processes around Mid-Channel Bar

1
Department of Civil Engineering, Galgotias College of Engineering and Technology, Greater Noida 201310, India
2
Center for Environmental Sciences & Engineering (CESE), Shiv Nadar University, Greater Noida 201314, India
3
Faculty of Engineering and Informatics, University of Bradford, Bradford BD7 1DP, UK
4
Department of Civil Engineering, College of Engineering, King Saud University, Riyadh 11421, Saudi Arabia
5
School of Civil engineering & Architecture, Institute of Technology, Dire-Dawa University, Dire Dawa 1362, Ethiopia
*
Author to whom correspondence should be addressed.
Sustainability 2022, 14(1), 392; https://doi.org/10.3390/su14010392
Submission received: 19 November 2021 / Revised: 19 December 2021 / Accepted: 24 December 2021 / Published: 30 December 2021
(This article belongs to the Section Sustainable Water Management)

Abstract

:
Researchers have recognized that the successive growth of mid-channel bar deposits can be entertained as the raison d’être for the initiation of the braiding process, which is closely interlinked with the growth, decay, and vertical distribution of fluvial turbulent kinetic energy (TKE). Thus, focused analysis on the underlying mechanics of turbulent flow structures in the proximity of a bar deposit occurring in the middle of the channel can afford crucial scientific clues for insight into the initiating fluvial processes that give rise to braiding. In the study reported herein, a physical model of a mid-channel bar is constructed in an experimental flume to analyze the turbulence parameters in a region close to the bar. Notably, the flow velocity plays an important role in understanding the flow behavior in the scour-hole location in the upstream flow divergence zone as well as near the downstream zone of flow convergence in a mid-channel bar. Therefore, the fluctuating components of turbulent flow velocity are herein discussed and analyzed for the regions located close to the bar. In the present study, the impact of the mid-channel bar, as well as its growth in turbulent flow, on higher-order velocity fluctuation moments are investigated. For near-bed locations, the results show the dominance of ejection events in upstream zones and the dominance of sweep events at locations downstream of the mid-channel bar. In scour-hole sections, the negative value of the stream-wise flux of turbulent kinetic energy and the positive value of the vertical flux of turbulent kinetic energy indicate energy transport in downward and forward directions, respectively. The downward and forward energy transport processes lead to scouring at these locations. The maximum turbulent production rate occurs in the wake region of the bar. The high rate of turbulence production has occurred in that region, which can be ascribed to the process of shedding turbulent vortices. The results show that the impact of the presence of the bar is mainly restricted to the lower layers of flow. The turbulent dissipation rate monotonically decreases with an increase in the vertical distance from the bed. The turbulent production rate first increases and then decreases with successive increases in the vertical distance from the bed. The paper concludes with suggestions for the future potential use of the present research for the practical purpose of examining braid bar occurrences in alluvial rivers to develop an appropriate response through training measures.

1. Introduction

The appearance of braiding in alluvial rivers with large fluvial energy is closely interlinked with the growth, decay, and vertical distribution of turbulent kinetic energy (TKE). In the Indian subcontinent, the Brahmaputra, Ganga, and Kosi Rivers, along with many others, are well-known for their intense braiding characteristics. In the past, a significant amount of work has been done by many researchers on braided rivers and their channel pattern forms [1] (Leopold and Wolman 1957). However, specific research on the intrinsic fluvial mechanics of turbulent flow structure leveraging on braid bar formation is very limited. The morphological changes of braided streams are closely related to bank erosion and deformation due to the mutual interlinking of sediment transport and water flow.
In natural rivers, the mid-channel bar is formed due to the deposition of sediment. With time, the mid-channel bar takes the form of an island, and this island is stabilized by vegetation. The island divides the river flow into several smaller channels, which leads to the braiding of the river [1] (Leopold and Wolman 1957). Ref. [2] Ashmore (1991) observed that the braiding process is initiated with the formation of the bar.
The analysis of turbulence in the proximity of the bar is critically important for studying the fluid-and-bar interaction [3,4] (Khan et al., 2017, Khan and Sharma 2018). In this context, an in-depth analysis of the flow turbulence in the vicinity of the bar was performed in the present study. The flow structure in regions upstream and downstream of the submerged structure plays a crucial role in gaining insight into the internal mechanics of flow turbulence in regions close to the submerged structure [5,6,7] (Shamloo et al., 2001, Zhao et al., 2010, Sarkar et al., 2016). Therefore, in the present study, comprehensive flow measurements were made at locations upstream and downstream of the bar. An idealized laboratory model of a mid-channel bar is constructed by drawing inspiration from notable past laboratory experiments of [1] Leopold and Wolman (1957). As has been done in this research, the idealized version of the mid-channel bar model is necessary for flow simulation to quantify the desired velocity and turbulent parameters in flow domains close to the bar.
Refs. [5,8] Shamloo et al. (2001) and Sarkar and Ratha (2014) observed the down-flow at locations upstream and the wake at locations downstream of the submerged structure. Ref. [9] Dey et al. (2008) found that the down-flow occurred upstream of the submerged cylinder and acted as a main scouring agent. They also observed that the vortex formed at the top of the submerged cylinder joined the main flow downstream of the cylinder. As discussed above, the flow at locations upstream and downstream of the submerged structure has great importance. Thus, in this experimental phase, the flow structure at locations upstream and downstream of the mid-channel bar is studied.
The flow velocity plays a crucial role in investigating the flow behavior in the scour-hole region [10,11,12,13] (Melville and Raudkivi 1977, Ben Meftah and Mossa 2006, Guan et al., 2014, Vijayasree et al., 2018). Thus, the velocity is thoroughly analyzed to study the behavior of flow in regions close to the bar. The third-order moments are sensitive to the occurrence cycle of ejection/sweep bursts [14] (Gad-El-Hak and Bandyopadhyay, 1994). Therefore, it is closely associated with coherent structures through turbulent characteristics [15] (Nagano and Tagawa, 1988). The higher-order moments of the velocity signal contain important information related to the turbulent statistics of flow. In addition, the processes involving Reynolds stress production and bursting events characterization can be investigated by analyzing the third-order moments of velocity signals. The third-order moments can also be used for measuring the skewness of velocity data [16] (Raupach, 1981). The skewness coefficients detect the existence of turbulent bursts of high-value presence in velocity signals [17] (Lacey and Rennie 2012). This indicates that the skewness is linked with the turbulent events that are instrumental in the transport of sediments [18] (Bennett and Best 1995). Despite the importance of higher moments of turbulence, still no research is found in the literature related to the turbulence parameters such as turbulent production, skewness coefficients, turbulent kinetic energy flux, and associated bursting events for regions in the vicinity of the mid-channel bar. Therefore, the higher-order moments of velocity signals generated due to bar-and-fluid interaction are studied in this paper for characterization of their consequential impacts on changes in streambed elevations, particularly channel morphology.

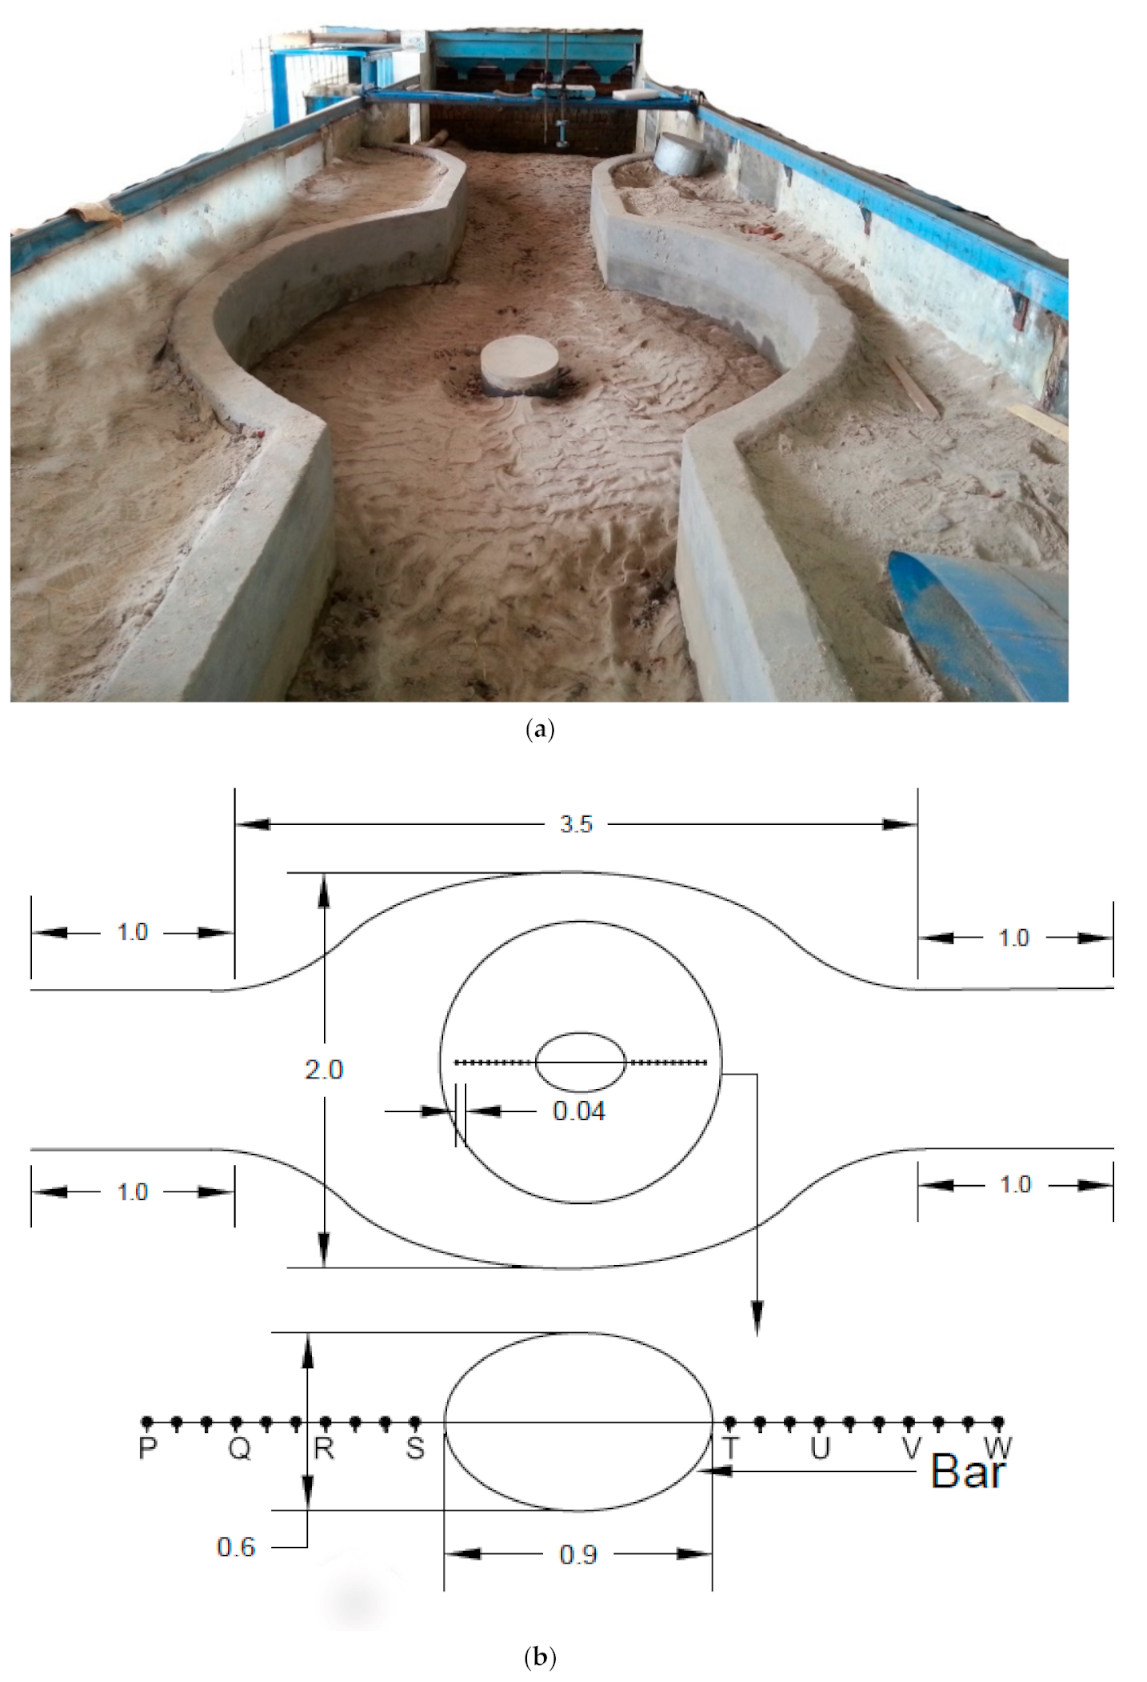
2. Experimental Program

The experiments were performed in a flume that was 10 m long, 2.6 m wide, and 1 m deep. The bed slope of 0.005 was taken for all experimental runs. The flow depth was maintained with the help of a tailgate. The measurement of velocity was done by using acoustic Doppler velocimetry (ADV). ADV records the instantaneous velocity of flow using the Doppler shift technique. ADV can measure velocity accurately up to a 100-Hz frequency [19] (Voulgaris and Trowbridge 1998). High accuracy of measurement, even at high frequency, makes this instrument the most versatile for laboratory study [19,20] (Lohrmann et al., 1994, Voulgaris et al., 1998).
‘White noise’ can be identified as an added noise floor in the high-frequency region of the spectrum [19] (Voulgaris et al., 1998). Ref. [21] Goring and Nikora (2002) observed that the frequency range of 20–25 Hz is best for measuring velocity by Doppler velocimetry. Therefore, a frequency of 25 Hz was selected for velocity measurement. To select the optimum measurement time, the convergence test was carried out as shown in Table 1. For a measurement time of 4 min, the standard of velocity data from the mean value becomes constant. Therefore, the measurement time of 4 min was taken for velocity measurement.
Following [21] Goring and Nikora (2002), data having a correlation coefficient lower than 90 were excluded from the velocity data.
Initial deposition at the center of the channel occurred due to slight change incompetence [22] (Ashmore, 1982). The initial deposition at the center is considered the prime reason for the initiation of braiding [22] (Ashmore 1982). The deposition that occurred in the middle of the channel is not uniform in shape, but for simplification of the experimental setup, the elliptical shape of the mid-channel bar is taken in the experimental model (Figure 1a). On the basis of [1,2] (Ashmore 1991; Leopold and Wolman 1957) research, [23] Ashworth (1996) developed a physical model for mid-channel bar growth. The model was developed based on [23] Ashworth’s (1996) research.
The flume bed was prepared with loose sediment of uniform grading, having uniformity coefficient 2.1 and D50 = 0.23 mm. D50 is the size of a sieve through which 50 percent of sediment can pass.
The plan and dimensions of the bar model are shown in Figure 1b. The model is constructed with the help of mortar and bricks. The mid-channel bar, measuring 60 by 90 cm, is constructed. The small elliptical-shaped structure placed in the center of the channel acts as a mid-channel deposition (Figure 1a). To minimize the wall effect on the flow in the proximity of the bar, the width of the channel is increased to 2 m in the central region of the bar model. The idealized laboratory model of the mid-channel bar is constructed, keeping in view the earlier laboratory work of [1] Leopold and Wolman (1957).
Experiments were performed for six different submergence ratios (Table 2). In experimental runs, only the submergence ratio varies, and all other parameters are kept constant (Table 2). In this paper, the impact of the submergence ratio on flow turbulence is studied. The submergence ratio is the ratio of the height of the bar to the depth of the water. The flow depth is kept constant (30 cm) for all experimental runs by using the tailgate.
The experimental details are provided in Table 2. The velocity measurement was done at 16 different depths for each section. The measurements of velocity were taken at 10 sections upstream as well as downstream of the bar, indicated by the dot (Figure 1b). As it is not possible to show the experimental data for all 20 sections in the paper, four sections were selected upstream of the bar which were named ‘P’, ‘Q’, ‘R’, and ‘S’ (Figure 1b). The ‘P’ section is farthest from the upstream end of the bar, and the effect of the mid-channel bar is minimal at this location. The ‘S’ section is closest to the upstream end of the bar, and maximum scouring is observed at this location. Similarly, four sections were selected downstream of the bar that were named ‘T’, ‘U’, ‘V,’ and ‘W’ (Figure 1b). The magnitude of deposition reaches its maximum at the ‘T’ section and its minimum at the ‘W’ section. From the sediment data obtained from the Assam Water Resource Department, it was observed that the sediment size of the Brahmaputra River lies between 0.22–0.26 mm. Therefore, the flume bed was made up of sediment of uniform grading with D50 = 0.25 mm.
In reference to Table 2, L indicates the major dimension, B represents the minor dimension of elliptical bar, and H b indicates the height of the bar.
Velocity measurements were taken after attainment of equilibrium condition. The average magnitude of bed shear stress was kept lower than critical shear stress. This indicates that scouring occurs only when the local shear stress becomes greater than the critical shear stress. The local shear stress increases due to the generation of turbulence by the mid-channel bar. Before each experimental run, the bed was leveled with a hand leveler, and ADV measurements were taken once the equilibrium condition had been reached.
The experiments were carried out in clear water conditions. The bed elevation measurements were taken before commencement ( h i ) and after completion of the experiment ( h f ). The difference between the initial bed level reading and the final bed level reading ( h i h f ) was calculated. The negative values of the difference indicate scouring and the positive values indicate deposition. The scouring and deposition occurring at different sections is shown in Table 3.

3. Results and Discussion

3.1. Wake Flow Analysis

The flow structure in the region of the wake is analyzed by plotting the normalized velocity u u * versus the normalized distance y u * / ϑ from the bed for sections downstream of the mid-channel bar (Figure 2), where u * is the shear velocity of flow, ϑ is the kinematic viscosity of flow, and y is the vertical distance of section from the bed. The Prandtl–von Karman log law is given by Equation (1).
u u * = 1 k ln y y 0
where k is von Karman’s constant (the value of this constant is 0.41), and y 0 is the zero-velocity level. As per [24] Van Rijn and Kroon (1993), the value of y 0 is mentioned by Equation (2).
y 0 = ϑ 9.1 u *
Figure 2 indicates that the highest deviation of the velocity profile is observed for the section which is closest to the downstream end of the bar, i.e., ‘T’. This highlights that the occurrence of vortex shedding is greatest at the location closest to the bar. Figure 2 also shows that the deviation of the velocity profile from the log law line is greater for experimental run 4R as compared to experimental run 2R. The velocity profile deviation from the log law indicates the manifestation of the vortex shedding phenomenon [24] (Van Rijn and Kroon 1993). This indicates that vortex shedding increases with an increase in the submergence ratio.

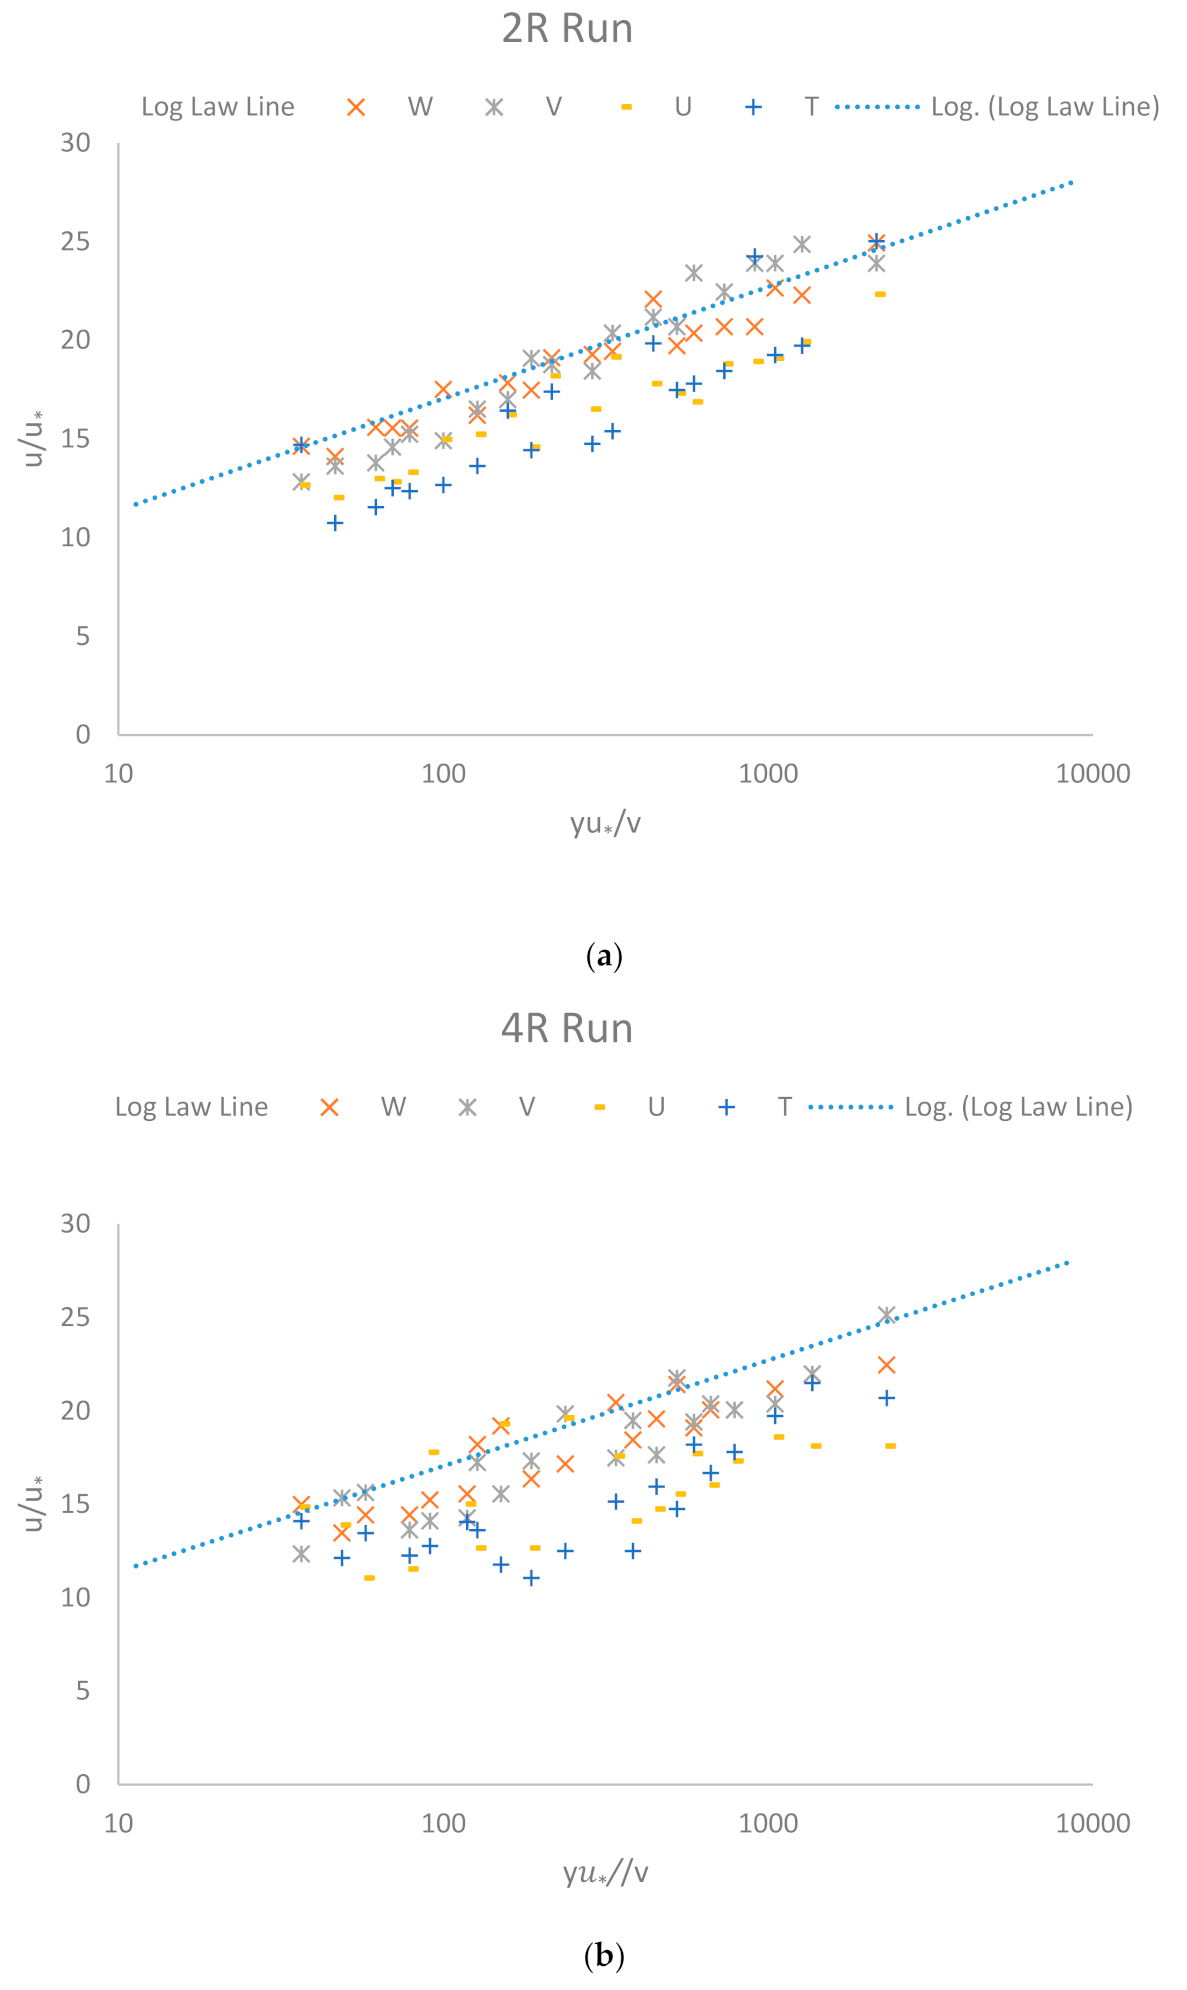
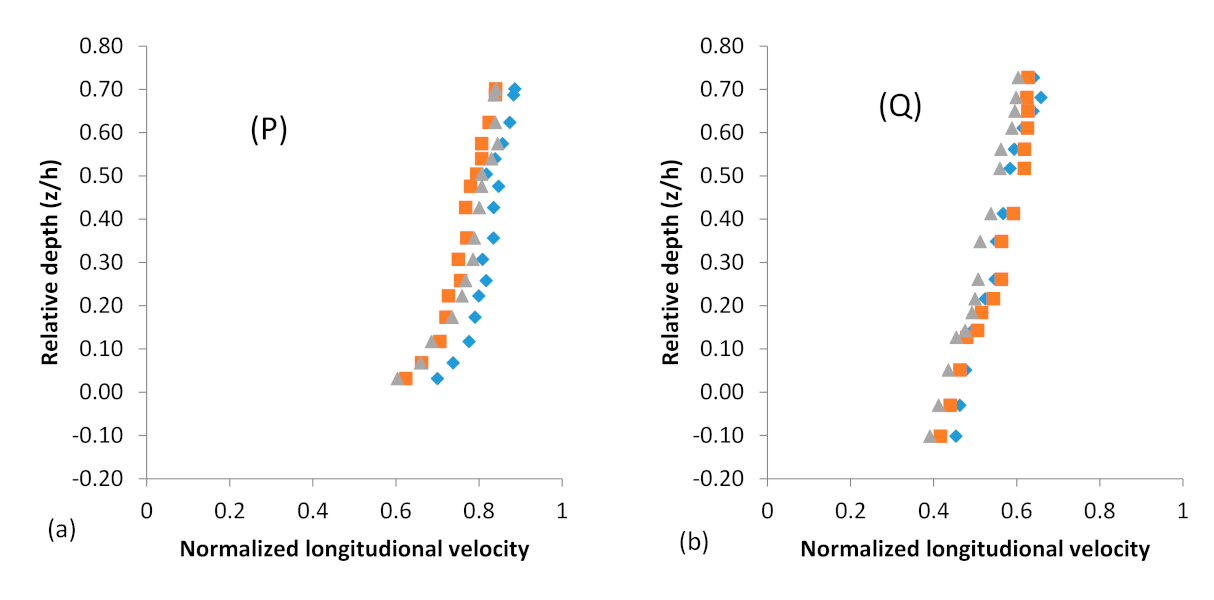
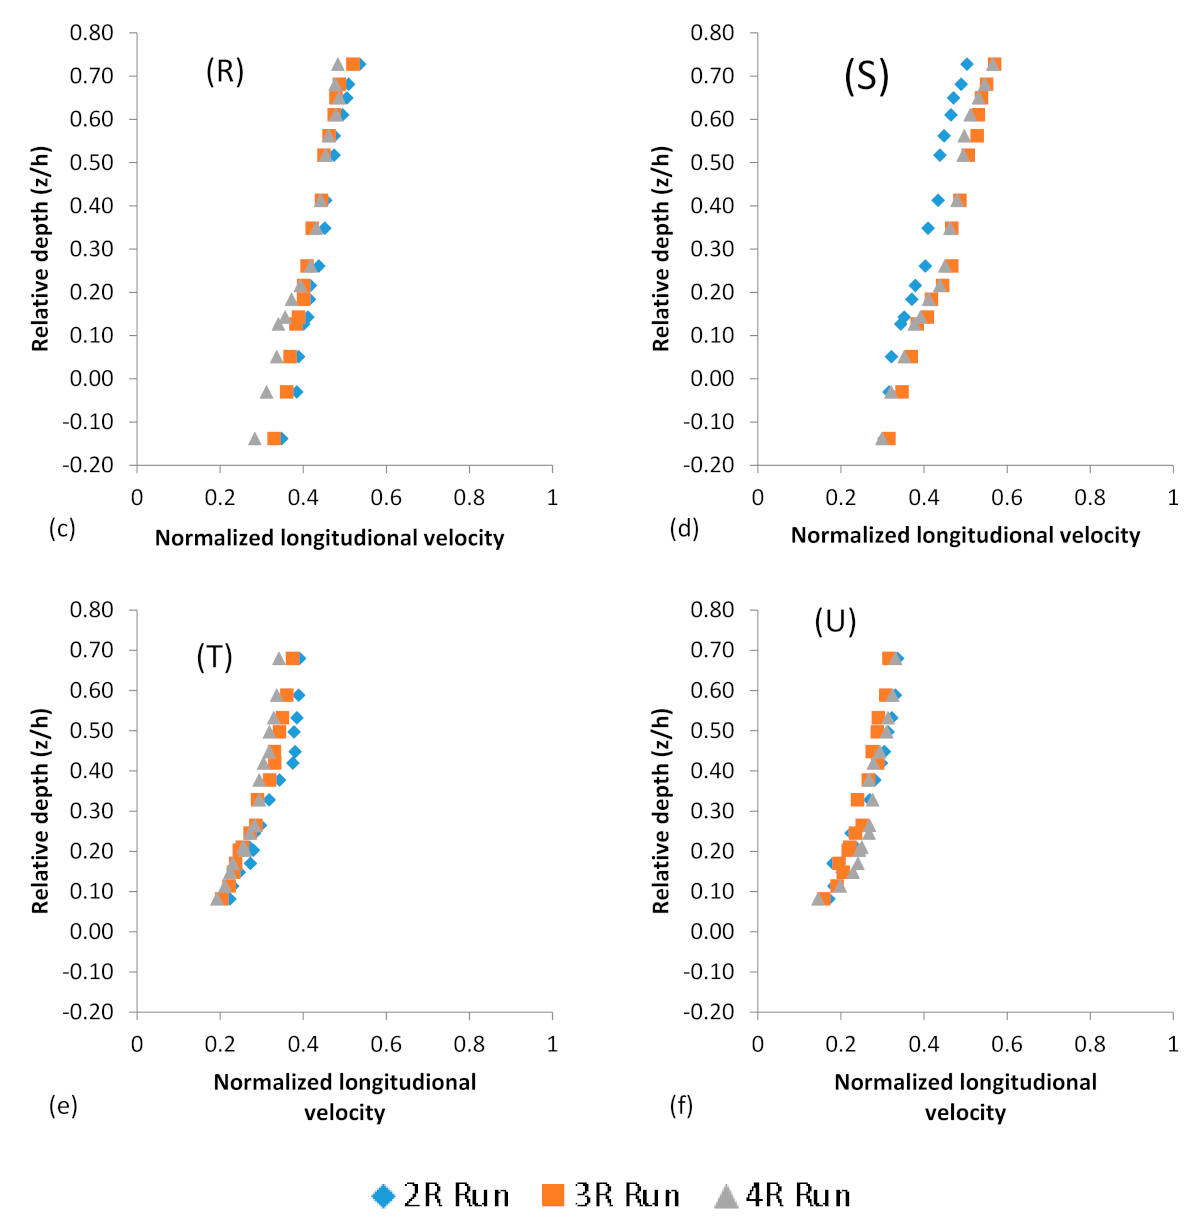
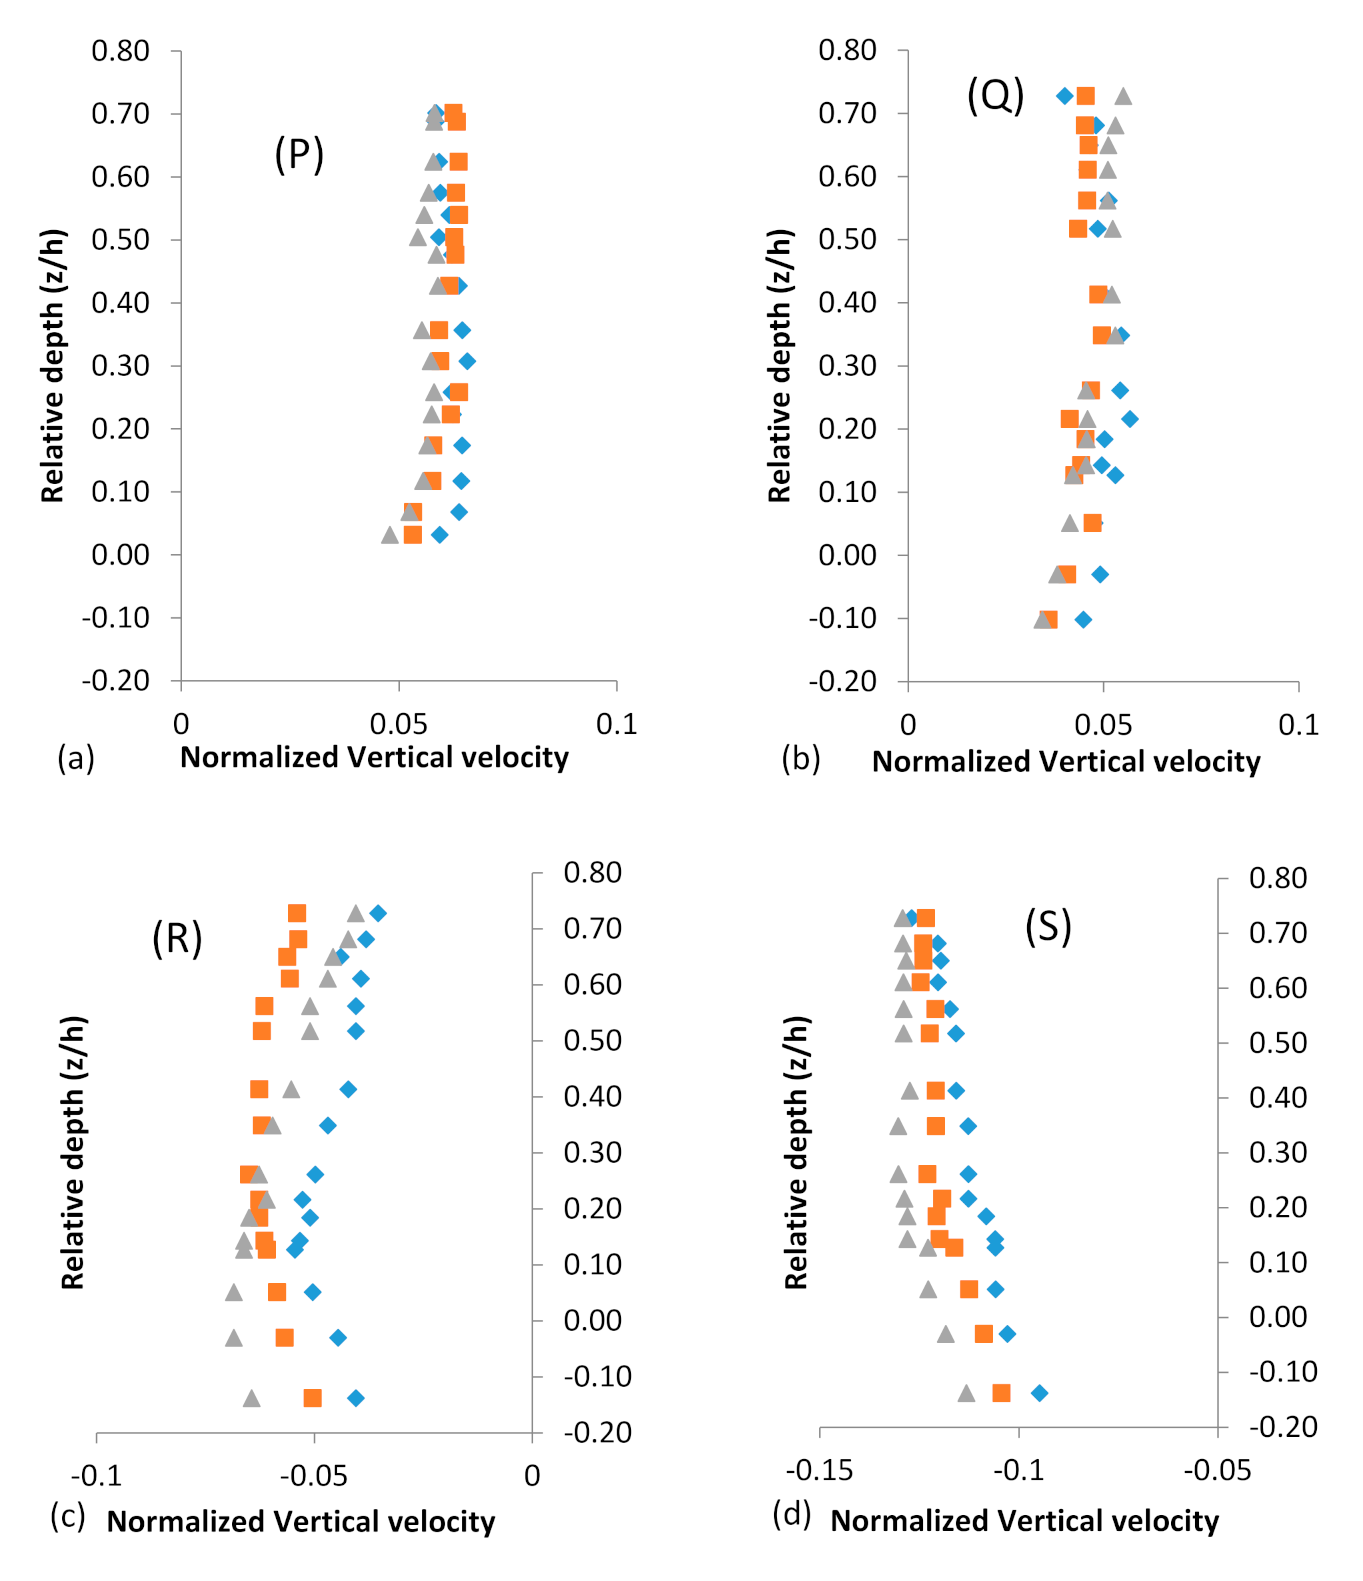
3.2. Flow Velocity Analysis

Velocity Distribution
The flow velocity plays a crucial role in understanding the flow behavior in the scour-hole region [10,12] (Melville and Raudkivi 1977; Guan et al., 2014). In this research, velocity is analyzed in-depth to study the flow behavior in the proximity of the bar. The velocity components are normalized by the approaching flow velocity U. The depth-wise profile of normalized longitudinal velocity is plotted at six different sections and for three experimental runs (Figure 3). The longitudinal velocity in the sections ‘R’ and ‘S’ is low compared to the sections ‘P’ and ‘Q.’ The depth of the scour hole is greater in sections close to the upstream end of the bar, i.e., the ‘R’ and ‘S’ sections. The flow area increases due to the scour-hole formation, which leads to the reduction in velocity in these sections. The longitudinal velocity in sections downstream of the bar is quite low compared to the upstream sections.
The low velocity in downstream sections occurs due to the shedding of vortices in regions downstream of the mid-channel bar, as indicated by Figure 2. This vortex shedding was also observed by [5,6,7] Shamloo et al. (2001), Zhao et al. (2010), and Sarkar et al. (2016).
The depth-wise distribution of normalized vertical flow velocity is plotted at six different sections and for three different experimental conditions (Figure 4). In the ‘R’ and ‘S’ sections, the negative value of vertical velocity indicates down-flow at these locations. Down-flow is primarily responsible for scouring in the vicinity of submerged structures [25,26] (Kothyari et al., 1992; Ahmed and Rajaratnam 1998).
The vertical velocity is also negative at sections ‘T’ and ‘U’ (Figure 4). As shown in Table 3, negative vertical velocity and low longitudinal velocity cause deposition in the ‘T’ and ‘U’ sections.

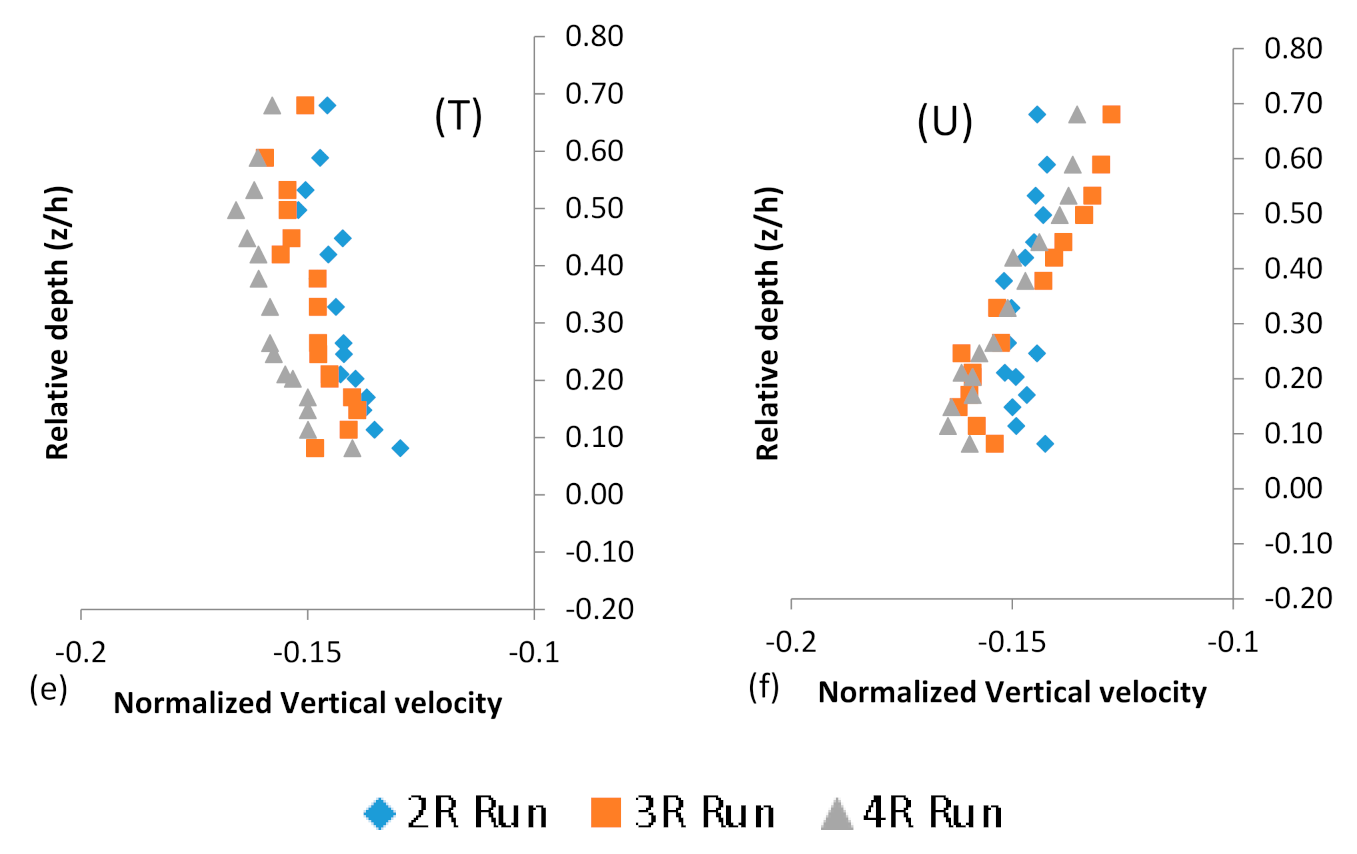
3.3. Effect of Bar Submergence on Channel Bed Elevations

By an inspection of Table 3, it could be discerned that scouring has been occurring in a region upstream of the bar while deposition has been observed in a region downstream of the mid-channel bar. The scour profile for the section upstream of the bar under different experimental conditions is depicted in Figure 5a. The magnitude of scouring increases as the submergence ratio increases (Figure 5a). Ref. [9] Dey et al. (2008) have reported that the value of down-flow increases with an increase in the submergence ratio of the bar, which is considered the primary agent of scouring. Thus, the down-flow is responsible for the increase in the extent of channel bed scouring associated with an increase in the submergence ratio of the bar. The main inference drawn from the above experimental findings is that the increase in the size of bar height creates a flow region upstream of the bar in which the channel bed is very prone to scouring.
The deposition profile on the channel bed downstream of the bar under different experimental conditions is shown in Figure 5b. The magnitude of deposition in the region downstream of the mid-channel bar increases as the submergence ratio increases (Figure 5b). The vortex shedding phenomenon intensifies with an increase in the submergence ratio due to a rise in bar height, as indicated by Figure 2, which induces an enhanced deposition process downstream.
According to the preceding discussion, the scouring happened upstream of the mid-channel bar and the deposition occurred downstream of the mid-channel bar. Scouring occurring upstream of the mid-channel bar and deposition happening downstream of the bar leads to the migration of the mid-channel bar, according to researchers such as [1,2,23] Ashmore (1991), Ashworth (1996), and Leopold and Wolman (1957).

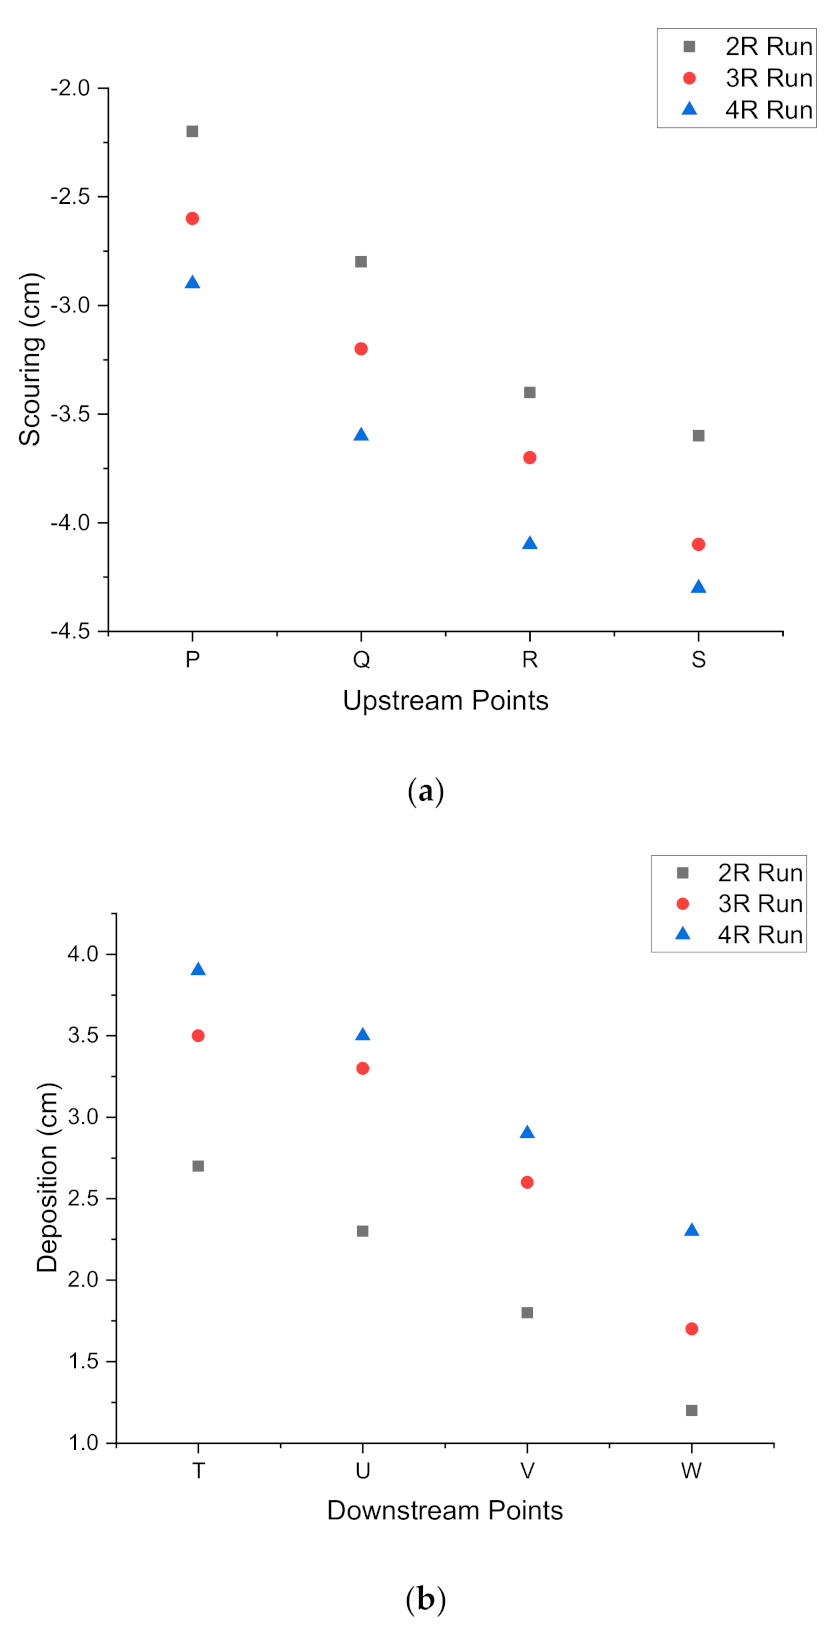
3.4. Third-Order Moments of Fluctuating Velocity Signals

Despite the significance of the higher-order moments of velocity signals, hardly any work has been reported in the literature which could analyze the higher moments of velocity signals along with associated bursting events in regions in proximity to the mid-channel bar linking with the growth of the bar.
The significant novelty of the current study is the dedicated focus for a focused study on the higher-order moments of velocity signals, which are increasingly generated due to the intrinsic fluvial dynamics of the changing bar height interaction with the flowing fluid of high turbulence. This approach of analyzing the skewness of third-order velocity fluctuation from the average value can provide useful information on ejection and sweep events of flow structures to provide scientific clues on the mechanics of bar formation as well as deformation. Such a crucial scientific knowledge basis would lay the foundation for informed decision making on the management of channel processes in braided rivers, such as the Ganga, the Brahmaputra, the Kosi, etc., with appropriate training measures.

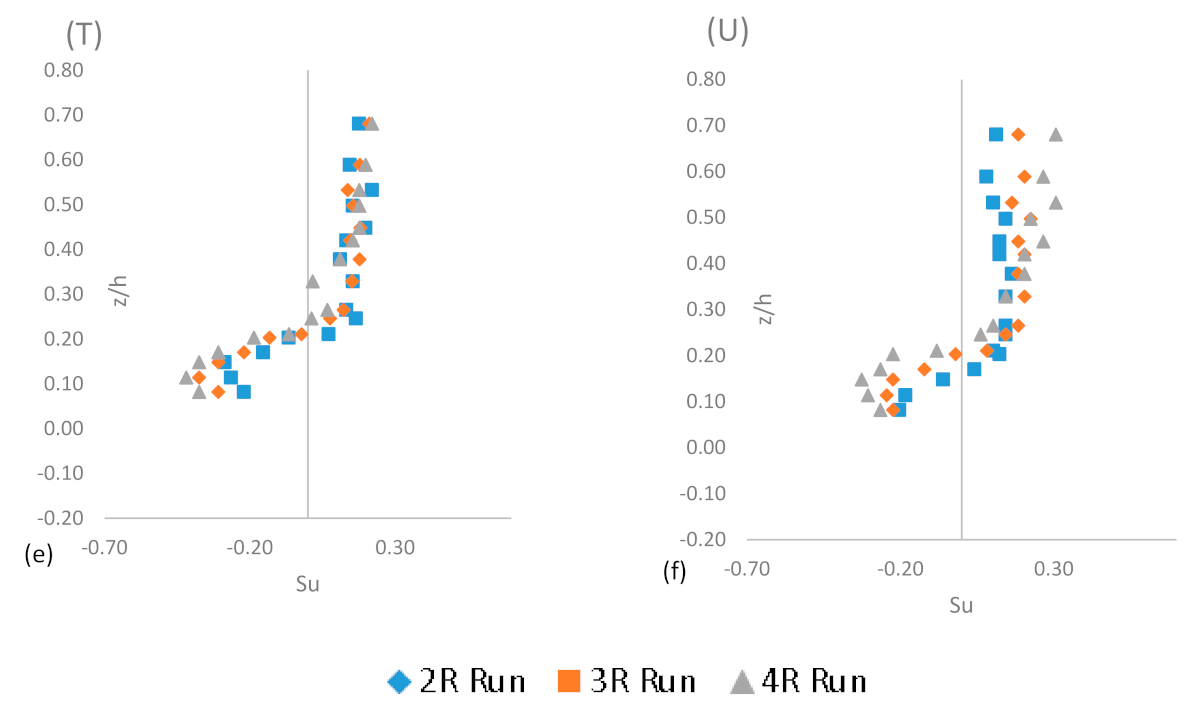
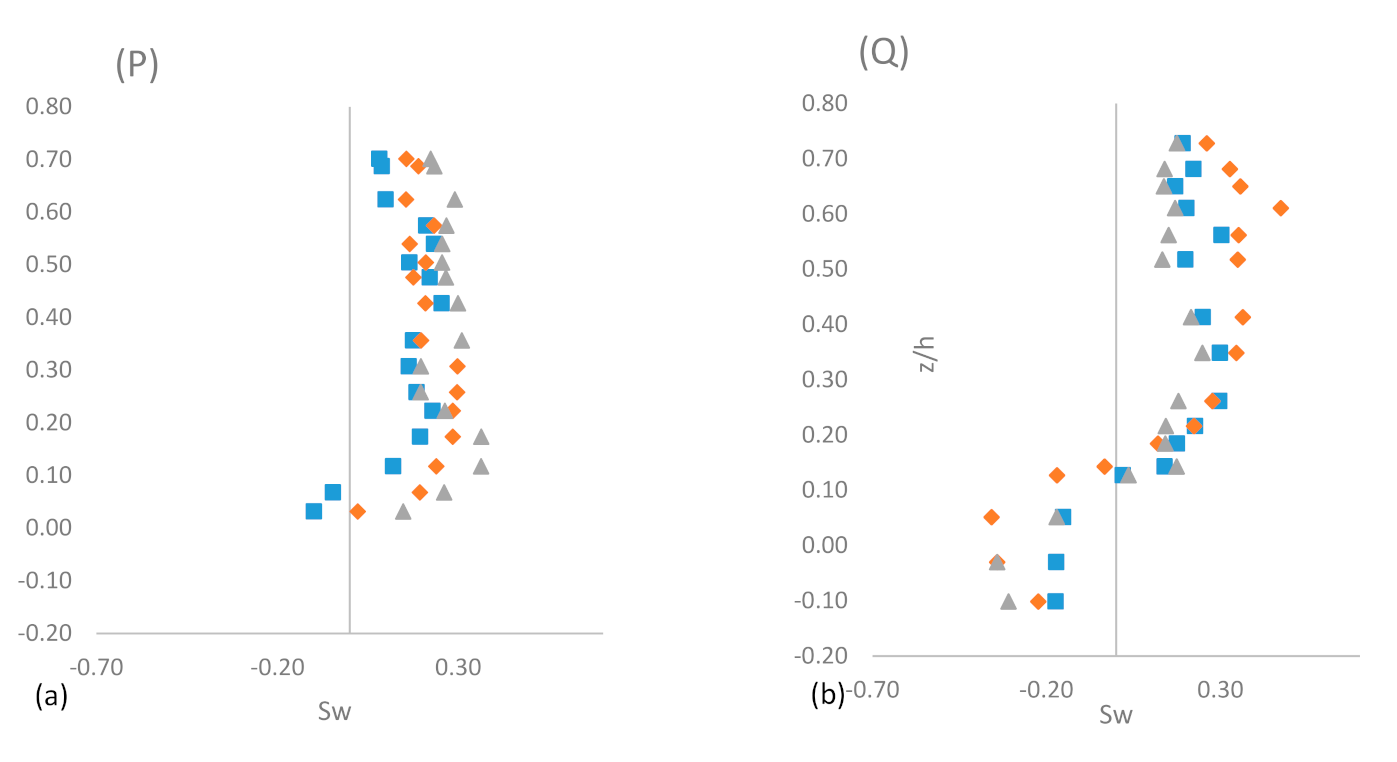
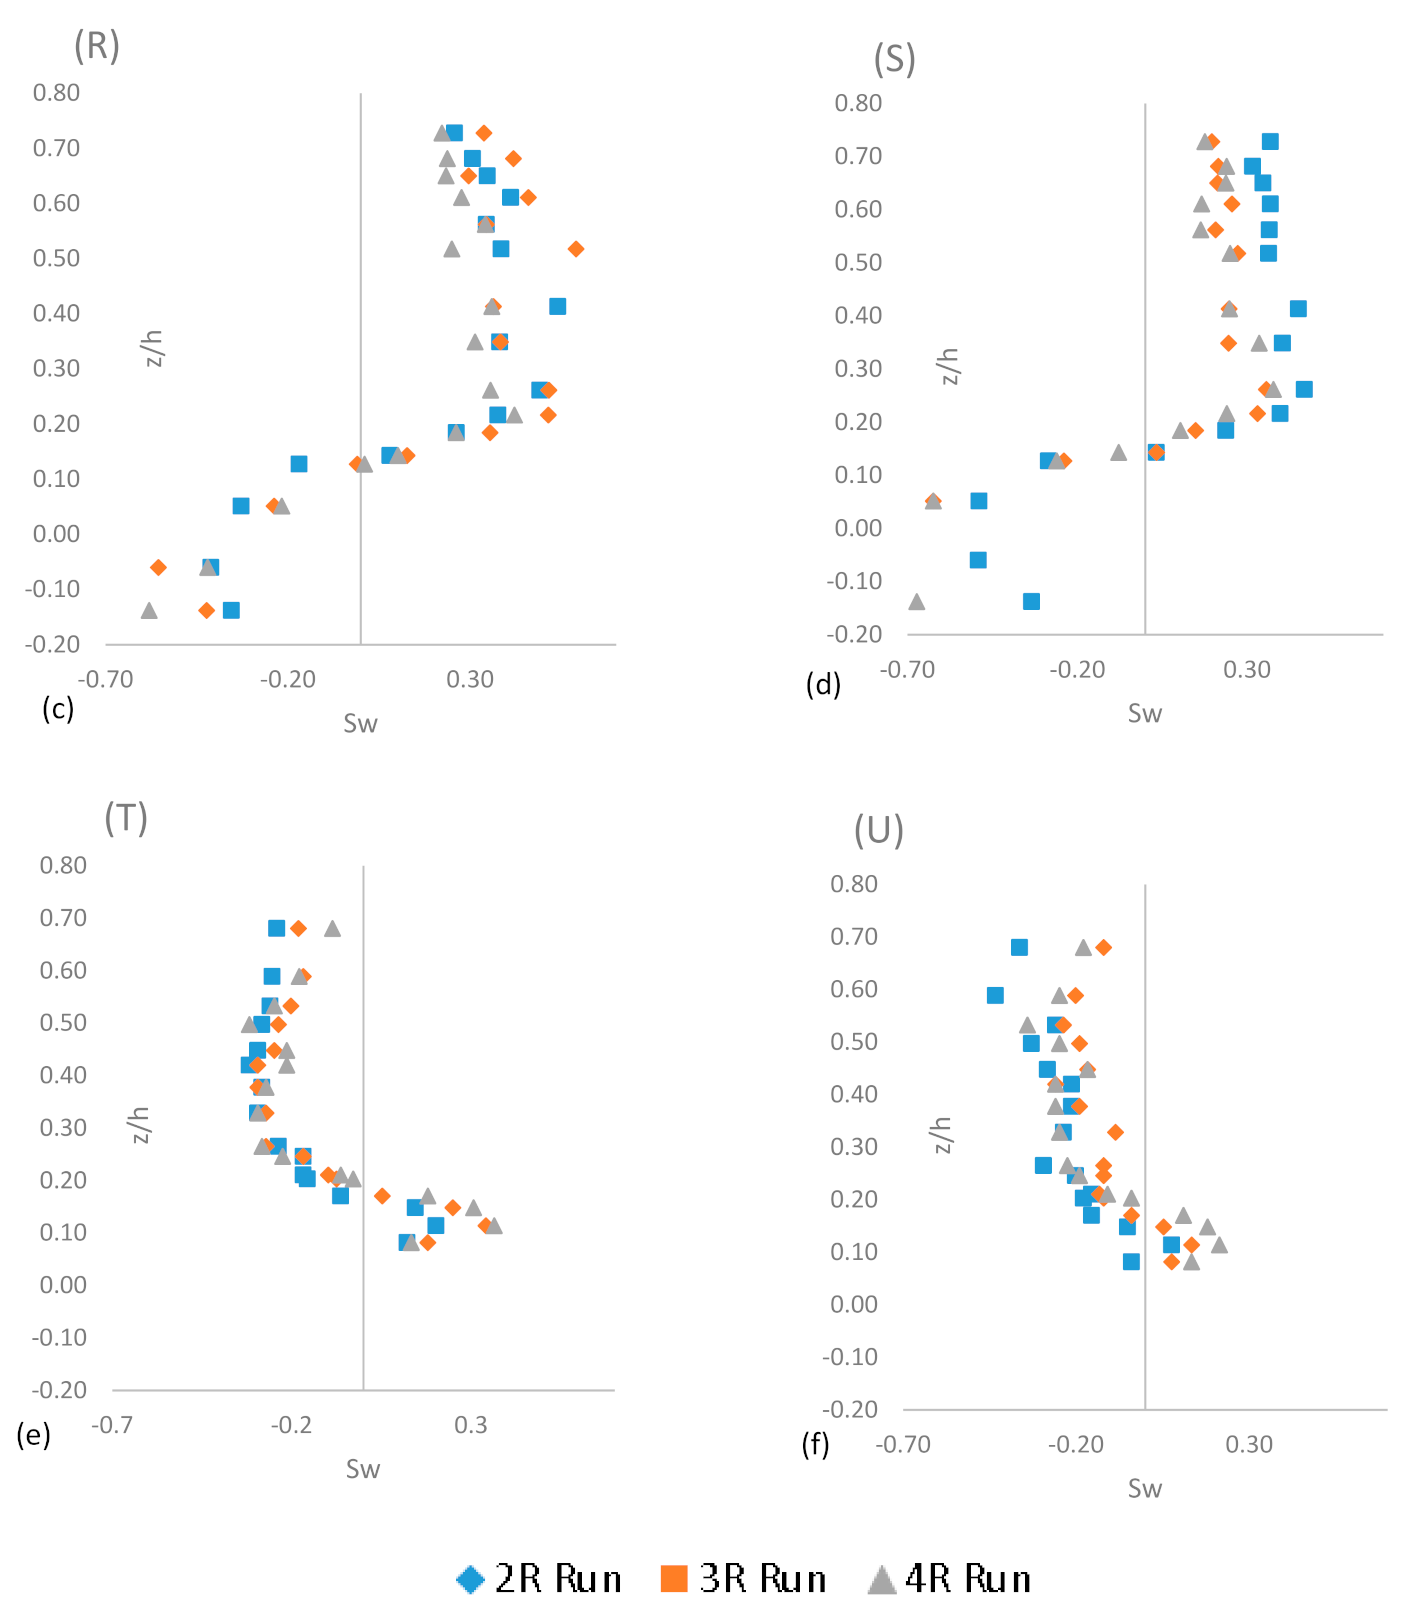
3.4.1. Skewness Coefficients

The skewness coefficients provide the velocity fluctuation skewness from the average value [27,28,29](Krogstadt and Antonia 1999, Keirsbulck et al., 2002, Balachandar and Bhuiyan 2007). The coefficients of skewness in the longitudinal direction (x) ( S u ) and in the vertical direction (z) ( S w ) are given by Equations (3) and (4), respectively.
S u = u 3 ¯ σ u 3
S w = w 3 ¯ σ w 3
Here, u and w are fluctuating velocity in the x and z directions, respectively. σ u and σ w are the root mean square values of u and w fluctuations, respectively.
The depth-wise profile of S u is plotted at six different sections and for three different experimental conditions (Figure 6). At section ‘P’, the value of S u is negative up to the relative depth (z/h) of 0.4, changing over to a positive value afterward. At ‘Q’, ‘R’ and ‘S’ sections, the value of S u is positive in the scour-hole region (z/h < 0), changes sign at z/h = 0.15, and stays negative for the remaining depth of flow. For Sections ‘T’ and ‘U’, the S u is negative for (z/h < 0.2) and becomes positive afterward. A positive value of S u in the scour hole indicates the skewness of u in the longitudinal direction.
The S w is plotted at six different sections and for three different experimental conditions (Figure 7). For section ‘P’, the value of S w is positive throughout the flow depth. At ‘Q’, ‘R’, and ‘S’ sections, the value of S w is negative in the scour-hole region (z/h < 0) and becomes positive for relative depth (z/h) > 0.1.
For sections upstream of the bar, the value of S w is positive for z/h < 0.15. The magnitude of S u in scour-hole sections is much greater compared to the other sections. This indicates that the scour hole causes the greater skewing of the fluctuating component u’. Negative values of S u at scour-hole sections indicate that the sign of u fluctuation is the negative, and positive values of S w at scour-hole sections indicate that the sign of w is positive. This shows that the ejection event is dominant at sections upstream of the bar. For sections downstream of the bar, i.e., ‘T’ and ‘U’ sections, the positive value of S u and negative value of S w indicate the dominance of sweep events. This result indicates that the ejection and sweep events are the main quadrant events for analyzing the flow structure in regions close to the bar, which exert profound impacts on streambed scouring, deposition, and bank erosion processes in alluvial rivers, culminating in the manifestation of braid bars as well as their disintegration. The occurrence of such fluvial processes can be held responsible for the almost perpetual instability of channel geometry and the migration behavior of thalweg channels in alluvial braided rivers.

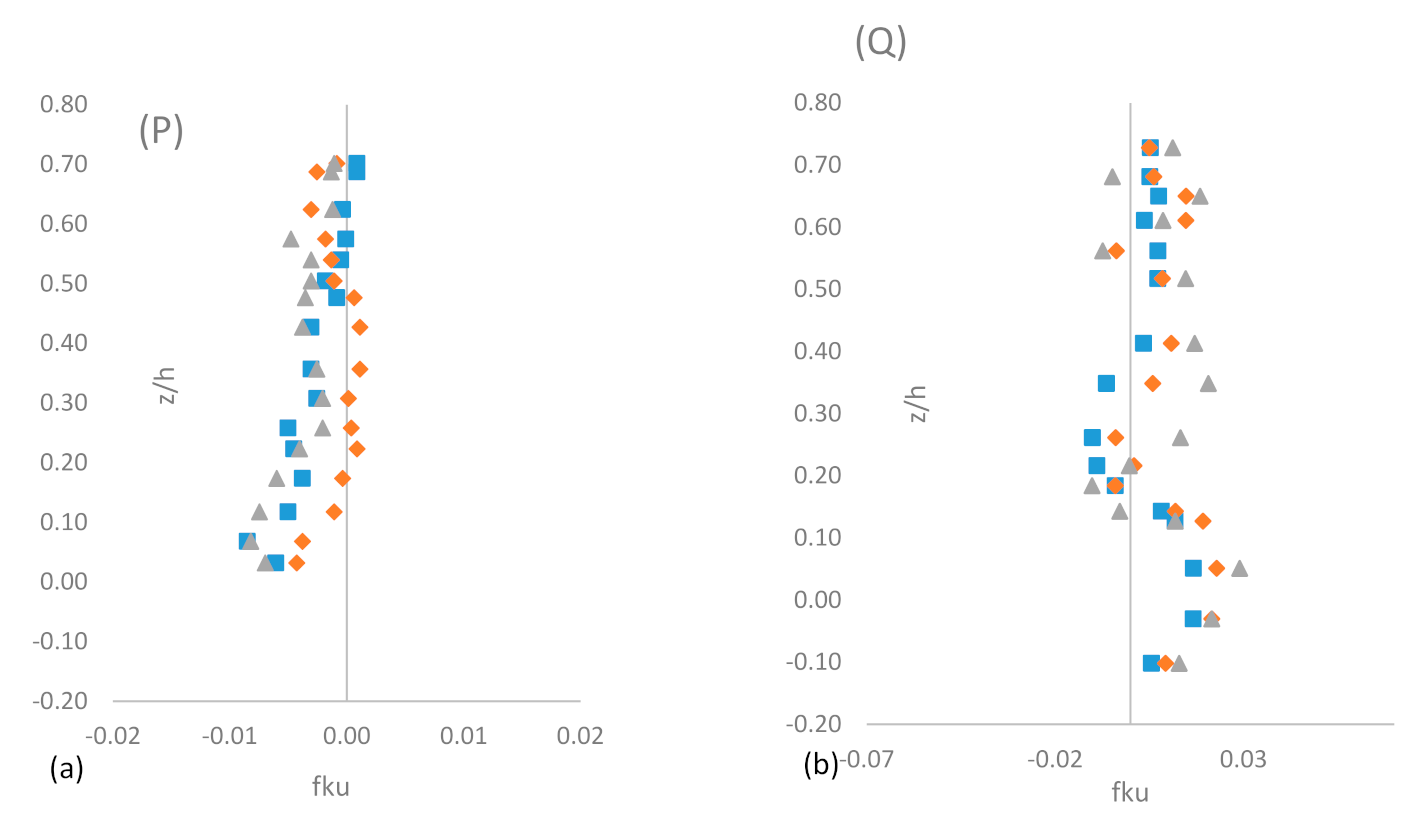
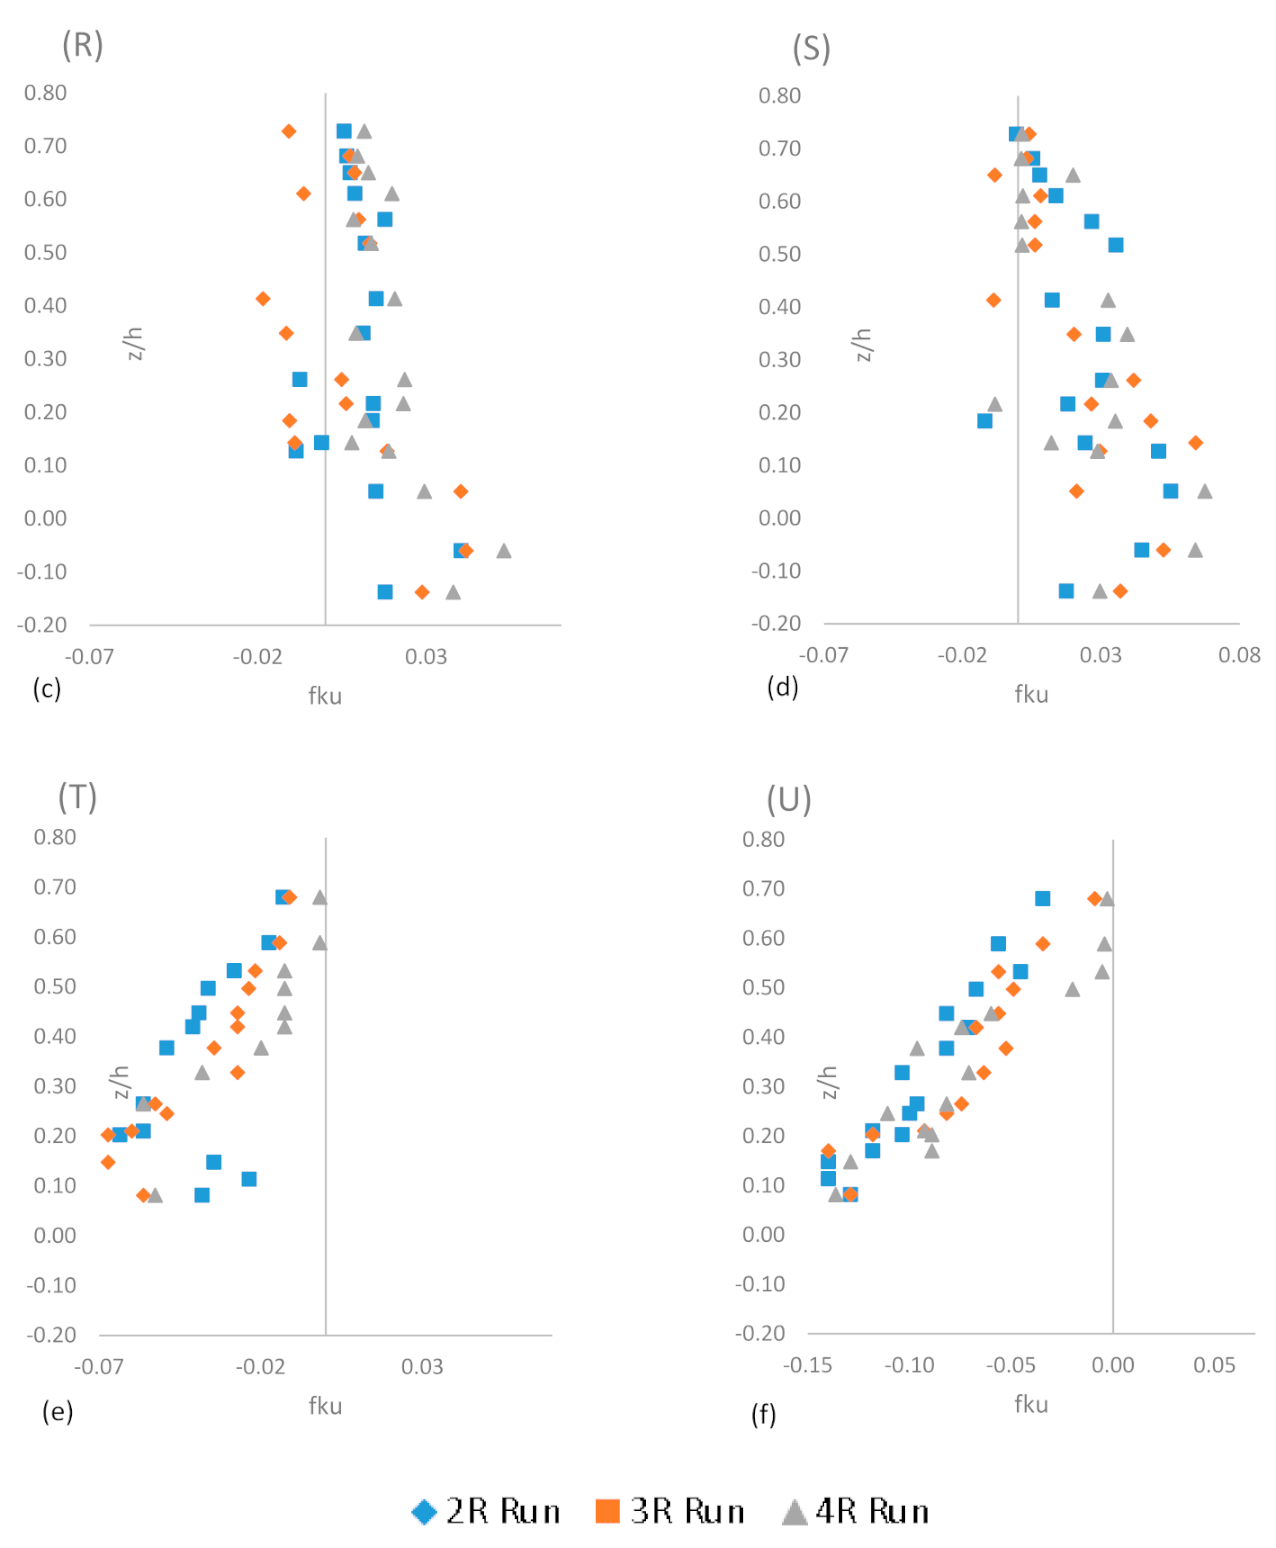
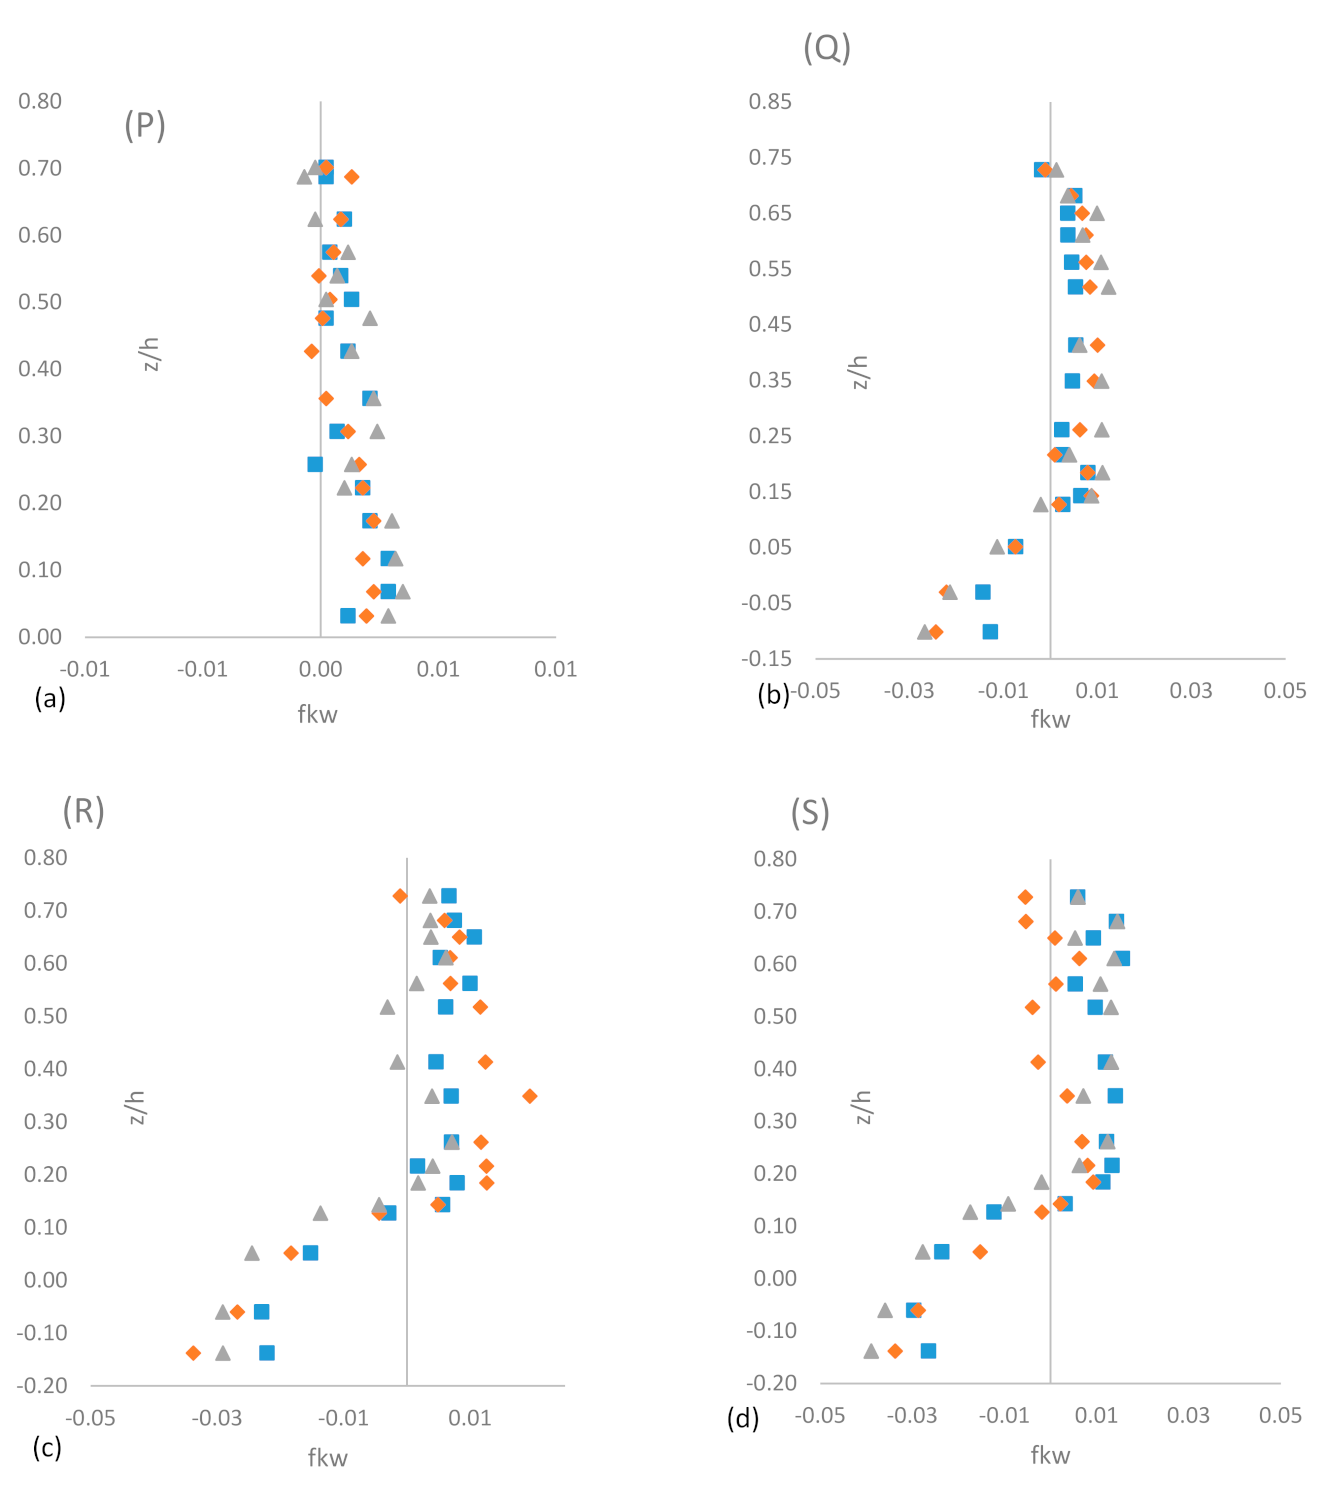
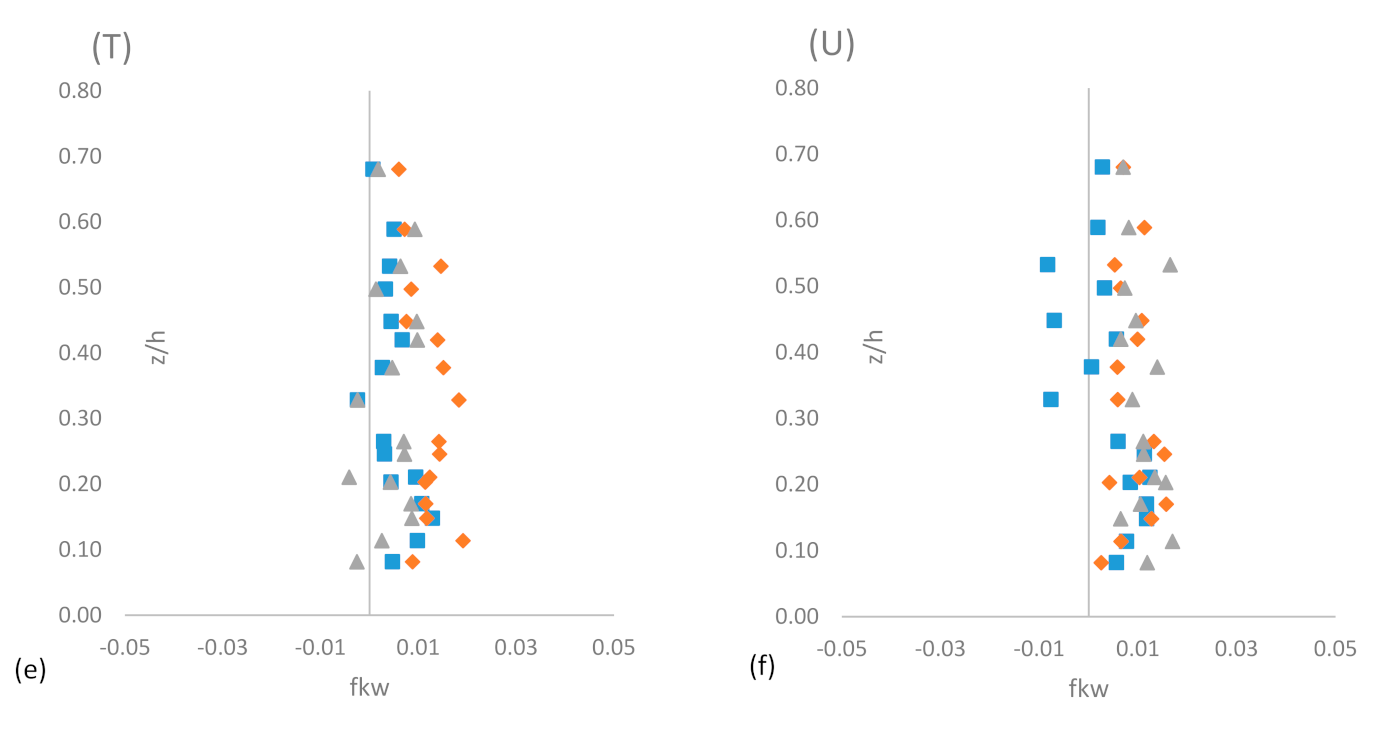
3.4.2. Turbulent Kinetic Energy Flux

The vertical and streamwise fluxes of turbulent kinetic energy (TKE) are important for modelers [27,30,31] (Krogstadt and Antonia 1999, Balachandar and Patel 2005, Bey et al., 2007). The depth-wise distribution of these fluxes of the TKE is plotted.
The expression for streamwise flux Fku and vertical flux of TKE ( Fkw ) are given by Equations (5) and (6), respectively.
Fku = 0.75 u u u ¯ + u w w ¯
Fkw = 0.75 w w w ¯ + w u u ¯
In section ‘P’, the value of Fku is negative throughout the flow depth (Figure 8). At scour-hole sections, the value of Fku is positive for (z/h < 0.15) and becomes negative for (0.15 > z/h < 0.3). At depth (z/h > 0.3), the Fku again becomes positive. At the ‘T’ and ‘U’ sections, the value of Fku is negative throughout the flow depth.
The depth-wise profile of Fkw is also plotted (Figure 9). In section ‘P’, the Fkw is positive throughout the flow depth. At ‘Q’, ‘R’, and ‘S’ sections, the value of Fkw is negative for (z/h < 0.15) and stays positive for the remaining depth of flow.
Negative and positive values of Fku indicate energy transportation in backward and forward directions, respectively, while the negative and positive magnitudes of Fkw indicate the transport of energy in downward and upward directions, respectively. At scour-hole sections, the negative value of Fkw and positive value of Fku indicate energy transport in downward and forward directions, respectively. The energy transport in the downward vertical and forward longitudinal direction is responsible for scouring at a location situated upstream of the bar, as displayed by Table 3.
At the ‘T’ and ‘U’ sections, the negative magnitude of Fku and positive magnitude of Fkw indicate the transport of energy in backward and upward directions, respectively. The energy transport in the upward vertical and backward longitudinal direction is responsible for deposition at these sections (Table 3).

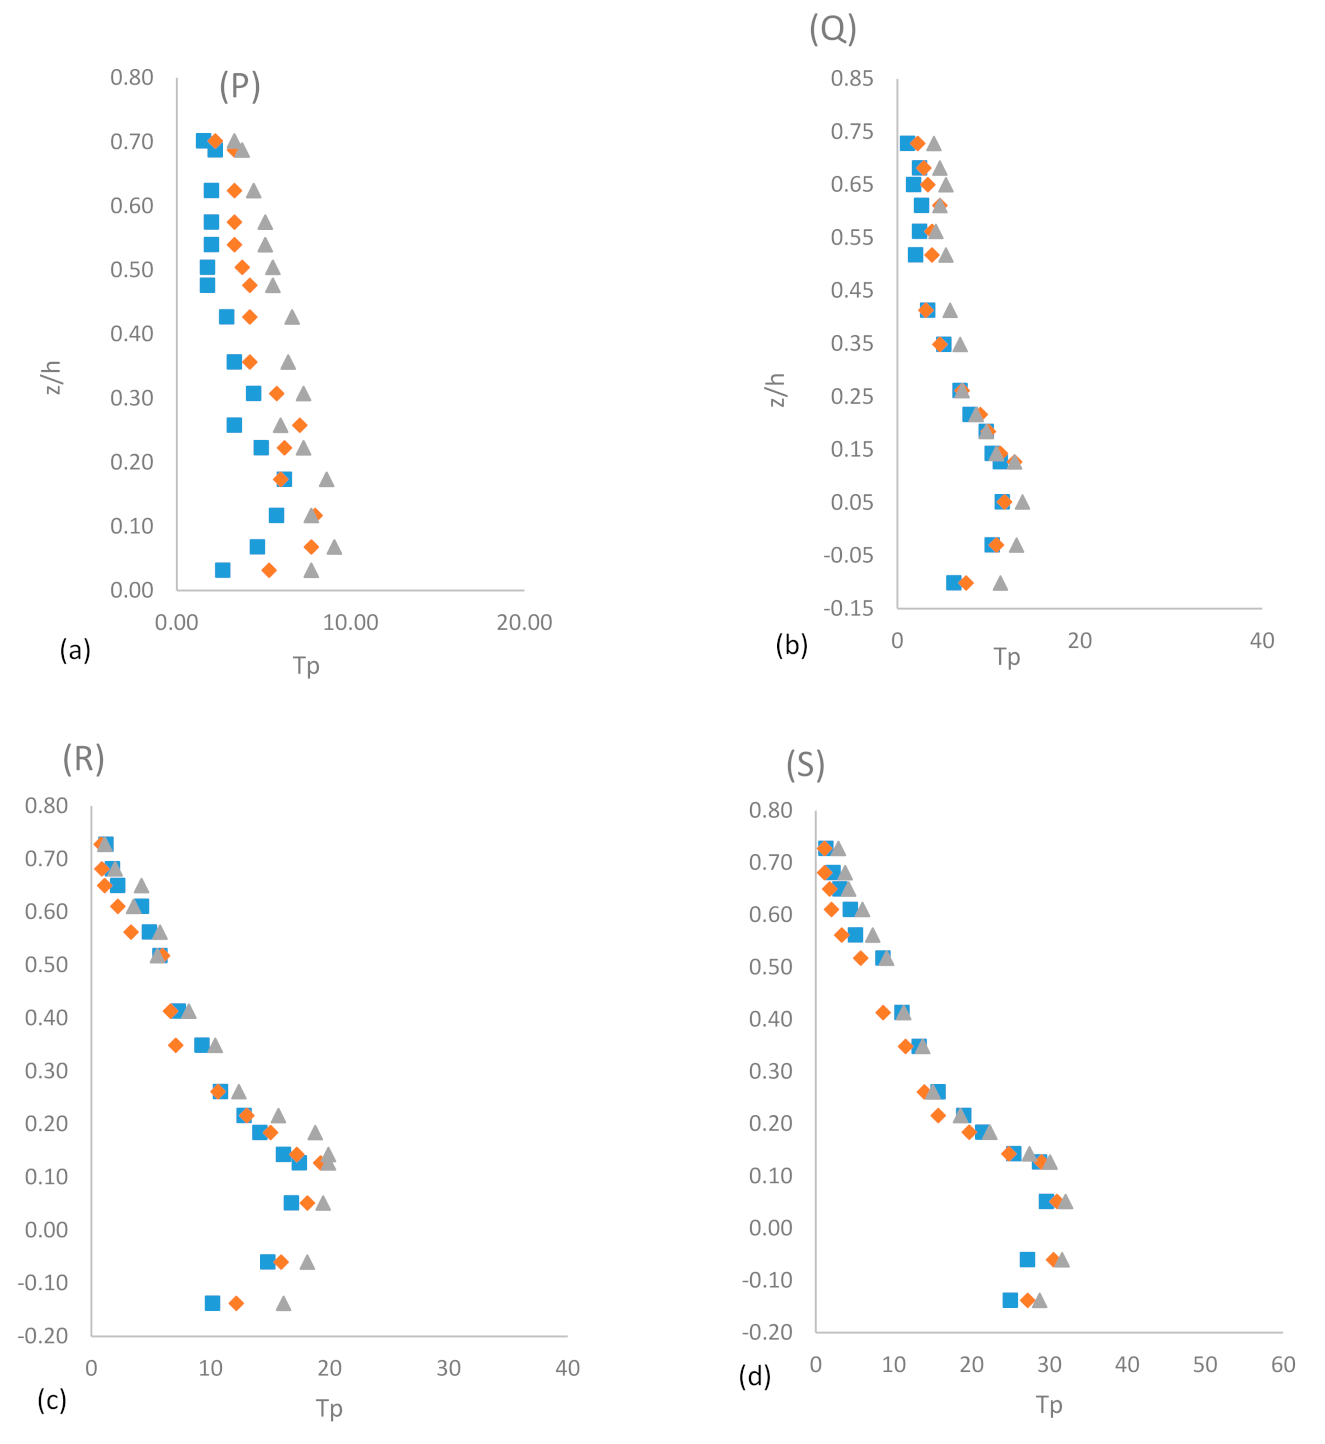
3.4.3. Turbulent Kinetic Energy Production and Dissipation

The equation for turbulent kinetic energy budget for open channel flow has been developed by [32] Nezu et al. (1994) as presented in Equation (7).
u w ¯ u _ z = 1 ρ p w ¯ z + f kw z ϑ δ 2 k δ z 2 + Td
In our experimental condition, the turbulent flow is fully developed. Thus, the viscous diffusion rate ϑ δ 2 k δ z 2 is negligible for the present study. The turbulent kinetic energy generated at the region close to the bed is transported to the region of the free surface by maintaining the dynamic equilibrium, in which the turbulent kinetic energy production rate is balanced by the pressure diffusion 1 ρ p w ¯ z , turbulent kinetic energy diffusion f kw z , and turbulent kinetic energy dissipation Td . The depth-wise distribution of turbulent kinetic energy production rate is plotted at six different sections and for different experimental conditions (Figure 10).
The maximum turbulent kinetic energy production rate T p occurs at sections downstream of the bar due to the vortex shedding at that location. The amplification of the turbulent kinetic energy production rate is observed in the lower bed region, followed by its continuous decrease afterward. The high turbulent kinetic energy production in the lower region of flow indicates the transfer of kinetic energy from the time-averaged flow to the turbulence zone. The turbulent kinetic energy production rate is greater at locations close to the bed. This indicates that the turbulent bursts are generated mainly in the wall region. The turbulent kinetic energy dissipation T d is estimated by the equation
T d = ( 15 v / u 2 ) u / t 2 ¯ , which was developed by Krogstad and Antonia (1999). The turbulent kinetic energy dissipation rate monotonically decreases as the distance from the bed increases, which is in contrast with the turbulent energy production rate, which first increases and then decreases with an increase in the distance from the bed (Figure 10 and Figure 11). The distribution of T d has a distinct lag from the T p . Figure 10 and Figure 11 denote that the turbulent production rate at any section is greater compared to the turbulent dissipation rate at that section.

4. Potential Use of the Present Research in Braided Alluvial Rivers

The research information elicited from the present study leveraging TKE on ejection and sweep events of flow structures would provide useful scientific clues affording objective insight into the underlying mechanics of mid-channel bar formation as well as deformation processes. Such a scientific knowledge basis would lay the foundation for an informed decision-making procedure closely bearing upon the management of unwanted intensification of braid bar formation witnessed in large alluvial rivers, such as the Ganga, Brahmaputra, Kosi, etc., with suitable training devices.
According to the current study’s findings, analyzing the TKE of flow structure in regions close to a bar allows for the prediction of fluvial processes such as scouring, deposition, and bank erosion, which culminate in the manifestation of massive-sized braid bars. The appearance of such fluvial landforms in large braided rivers such as the Ganga, Brahmaputra, Kosi, etc. can be held responsible for perpetuating channel form instability and frequent migration of the thalweg channel. Such adverse river behavior severely upsets the desired channel morphological stability, along with causing navigation bottle-neck zones in large rivers such as the Ganga and Brahmaputra by impeding the plying of cargo vessels of greater tonnages due to insufficient water depth. In the future, CFD modeling can be utilized to analyze the turbulent flow structure in the vicinity of the mid-channel bar [33,34,35,36] (Calomino et al., 2018, Lauria et al., 2020, Tafarojnoruz and Lauria 2020).
The demonstrated analysis on the growth and amplification of TKE involving velocity fluctuation skewness from the average value, turbulent kinetic energy (TKE) fluxes, TKE production rate (Tp), and its dissipation rate (Td), arising from the vortex shedding in the downstream region of the bar, may provide significant potential uses in the actual river on a better scientific footing.
The energy transport in downward vertical and forward longitudinal directions is responsible for scouring at a location situated upstream of the bar, while the energy transport in upward vertical and backward longitudinal directions is responsible for deposition downstream of the bar. This will lead to mid-channel bar elongation, thereby intensifying the braiding character of the river, which would likely trigger further bank erosion by the stream to carve out its required widened waterway.

5. Conclusions

The following are some of the significant conclusions that can be derived from this research.
When compared to upstream sections, the longitudinal velocity downstream of the bar is less. The vortex shedding causes the low velocity in the downstream sections. The downward flow is shown by the negative value of vertical velocity in downstream sections. With a higher submergence ratio, the down-flow is greater.
According to an analysis of the flow structure in the wake zone of the mid-channel bar, the occurrence of vortex shedding reaches its maximum at the downstream site nearest to the mid-channel bar. In addition, for experimental run 4R, the deviation of the velocity profile from the Prandtl log law line is found to be greater than for experimental run 2R. The appearance of the vortex shedding phenomena is underpinned by a divergence from the Prandtl log law in the velocity profile, which is intensified by an increase in the submergence ratio due to a rise in bar height, resulting in an enhanced deposition process downstream.
The magnitude of S u for scour-hole sections is much greater compared to the other sections. This indicates that the scour hole causes greater skewing of the fluctuating component u’. A negative value of S u and a positive value of S w at scour-hole sections indicate the dominance of ejection events. At the downstream ‘T’ and ‘U’ sections, the positive magnitude of S u and negative magnitude of S w indicate the dominance of the sweep event. The results unambiguously underscore that the ejection and sweep events are the main quadrant events for analyzing the flow structure in regions close to the bar.
Analysis of the vertical (Fkw) and streamwise fluxes (Fku) of the turbulent kinetic energy underlines that the negative and positive values of Fkw and Fku indicate the energy transport in a downward and forward direction, respectively, at scour-hole sections. The energy transport in the downward vertical and forward longitudinal direction is responsible for scouring at locations situated upstream of the bar. For downstream sections, the energy transport in the upward vertical and backward longitudinal direction is responsible for deposition.
The maximum turbulent production rate occurs in the wake region located downstream of the bar. The turbulent production rate is greater in regions close to the bed, and its value is equal to zero for z/h > 0.5. This indicates that the turbulent burst is generated mainly in the wall region. The turbulent dissipation rate monotonically decreases as the distance from the bed increases, which is in contrast with the turbulent production rate, which first increases and then decreases with an increase in the distance from the bed.

Author Contributions

M.A.K.: drafting—data collection and preparation of the manuscript, writing—review and editing; N.S.: drafting—preparation of the manuscript, revision, and correction; J.P.: composing—reviewing and modifying; F.M.A.: composing—reviewing and modifying; S.A.: composing—reviewing and modifying; W.A.K.: composing—reviewing and modifying. All authors have read and agreed to the published version of the manuscript.

Funding

This research and APC was funded by the King Saud University, Riyadh, Saudi Arabia through the Researchers Support Project, number (RSP−2021/297).

Institutional Review Board Statement

Not applicable.

Informed Consent Statement

Not applicable.

Data Availability Statement

Not applicable.

Conflicts of Interest

The authors declare no conflict of interest.

References

  1. Ahmed, F.; Rajaratnam, N. Flow around bridge piers. J. Hydraul. Eng. 1998, 124, 288–300. [Google Scholar] [CrossRef]
  2. Ashmore, P.E. Laboratory modelling of gravel braided stream morphology. Earth Surf. Processes Landf. 1982, 7, 201–225. [Google Scholar] [CrossRef]
  3. Ashmore, P.E. How do gravel-bed rivers braid? Can. J. Earth Sci. 1991, 28, 326–341. [Google Scholar] [CrossRef] [Green Version]
  4. Ashworth, P.J. Mid-channel bar growth and its relationship to local flow strength and direction. Earth Surf. Processes Landf. 1996, 21, 103–123. [Google Scholar] [CrossRef]
  5. Balachandar, R.; Bhuiyan, F. Higher-order moments of velocity fluctuations in an open-channel flow with large bottom roughness. J. Hydraul. Eng. 2007, 133, 77–87. [Google Scholar] [CrossRef]
  6. Balachandar, R.; Patel, V. Velocity measurements in a developed open channel flow in the presence of an upstream perturbation. J. Hydraul. Res. 2005, 43, 258–266. [Google Scholar] [CrossRef]
  7. Barman, K.; Debnath, K.; Mazumder, B.S. Higher-order turbulence statistics of wave–current flow over a submerged hemisphere. Fluid Dyn. Res. 2017, 49, 025504. [Google Scholar] [CrossRef]
  8. Ben Meftah, M.; Mossa, M. Scour holes downstream of bed sills in low-gradient channels. J. Hydraul. Res. 2006, 44, 497–509. [Google Scholar] [CrossRef]
  9. Bennett, S.J.; Best, J.S. Mean flow and turbulence structure over fixed, two-dimensional dunes: Implications for sediment transport and bedform stability. J. Int. Assoc. Sedimentol. 1995, 42, 491–513. [Google Scholar] [CrossRef]
  10. Bey, A.; Faruque, M.; Balachandar, R. Two-dimensional scour hole problem: Role of fluid structures. J. Hydraul. Eng. 2007, 133, 414–430. [Google Scholar] [CrossRef]
  11. Calomino, F.; Alfonsi, G.; Gaudio, R.; D’Ippolito, A.; Lauria, A.; Tafarojnoruz, A.; Artese, S.J.W. Experimental and numerical study of free-surface flows in a corrugated pipe. Water 2018, 10, 638. [Google Scholar] [CrossRef] [Green Version]
  12. Dey, S.; Raikar, R.V.; Roy, A. Scour at submerged cylindrical obstacles under steady flow. J. Hydraul. Eng. 2008, 134, 105–109. [Google Scholar] [CrossRef]
  13. Gad-el-Hak, M.; Bandyopadhyay, P.R. Reynolds number effects in wall-bounded turbulent flows. Appl. Mech. Rev. 1994, 47, 307–365. [Google Scholar] [CrossRef]
  14. Goring, D.G.; Nikora, V.I. Despiking acoustic Doppler velocimeter data. J. Hydraul. Eng. 2002, 128, 117–126. [Google Scholar] [CrossRef] [Green Version]
  15. Guan, D.; Melville, B.W.; Friedrich, H. Flow patterns and turbulence structures in a scour hole downstream of a submerged weir. J. Hydraul. Eng. 2014, 140, 68–76. [Google Scholar] [CrossRef]
  16. Keirsbulck, L.; Labraga, L.; Mazouz, A.; Tournier, C. Influence of surface roughness on anisotropy in a turbulent boundary layer flow. Exp. Fluids 2002, 33, 497–499. [Google Scholar] [CrossRef]
  17. Khan, M.A.; Sharma, N. Analysis of turbulent flow characteristics around bar using the conditional bursting technique for varying discharge conditions. KSCE J. Civ. Eng. 2018, 22, 2315–2324. [Google Scholar] [CrossRef]
  18. Khan, M.A.; Sharma, N.; Singhal, G.E. Experimental study on bursting events around a bar in physical model of a braided channel. J. Hydraul. Eng. 2017, 23, 63–70. [Google Scholar] [CrossRef]
  19. Khan, M.A.; Sharma, N.; Pandey, M.; Qamar, M. Turbulent characteristics of flow in the vicinity of mid-channel braid bar. Can. J. Civ. Eng. 2021, 48. [Google Scholar]
  20. Kothyari, U.C.; Garde, R.C.J.; Raju, K.G.R. Temporal variation of scour around circular bridge piers. J. Hydraul. Eng. 1992, 118, 1091–1106. [Google Scholar] [CrossRef]
  21. Krogstadt, P.-Å.; Antonia, R. Surface roughness effects in turbulent boundary layers. Exp. Fluids 1999, 27, 450–460. [Google Scholar] [CrossRef]
  22. Kumar, A.; Kothyari, U.C.; Raju, K.G.R. Flow structure and scour around circular compound bridge piers–A review. J. Hydro-Environ. Res. 2012, 6, 251–265. [Google Scholar] [CrossRef]
  23. Lacey, R.W.J.; Rennie, C. Laboratory investigation of turbulent flow structure around a bed-mounted cube at multiple flow stages. J. Hydraul. Eng. 2012, 138, 71–84. [Google Scholar] [CrossRef]
  24. Lauria, A.; Alfonsi, G.; Tafarojnoruz, A. Flow Pressure Behavior Downstream of Ski Jumps. Fluids 2020, 5, 168. [Google Scholar] [CrossRef]
  25. Leopold, L.B.; Wolman, M.G. River channel patterns. In Fluv Geom: Geom Crit Conc; Water Department: San Deigo, CA, USA, 1957; Volume 3. [Google Scholar]
  26. Lohrmann, A.; Cabrera, R.; Kraus, N.C. Acoustic-Doppler velocimeter (ADV) for laboratory use. In Fundamentals and Advancements in Hydraulic Measurements and Experimentation; American Society of Civil Engineering: San Diego, CA, USA, 1994. [Google Scholar]
  27. Melville, B.W.; Raudkivi, A.J. Flow characteristics in local scour at bridge piers. J. Hydraul. Res. 1977, 15, 373–380. [Google Scholar] [CrossRef]
  28. Nagano, Y.; Tagawa, M. Statistical characteristics of wall turbulence with a passive scalar. J. Fluid Mech. 1988, 196, 157–185. [Google Scholar] [CrossRef]
  29. Nezu, I.; Nakagawa, H.; Jirka, G.H. Turbulence in open-channel flows. J. Hydraul. Eng. 1994, 120, 1235–1237. [Google Scholar] [CrossRef]
  30. Raupach, M.R. Conditional statistics of Reynolds stress in rough-wall and smooth-wall turbulent boundary layers. J. Fluid Mech. 1981, 108, 363–382. [Google Scholar] [CrossRef]
  31. Sarkar, A.; Ratha, D. Flow around submerged structures subjected to shallow submergence over plane bed. J. Fluids Struct. 2014, 44, 166–181. [Google Scholar] [CrossRef]
  32. Sarkar, K.; Chakraborty, C.; Mazumder, B. Variations of bed elevations due to turbulence around submerged cylinder in sand beds. Environ. Fluid Mech. 2016, 16, 659–693. [Google Scholar] [CrossRef]
  33. Shamloo, H.; Rajaratnam, N.; Katopodis, C. Hydraulics of simple habitat structures. J. Hydraul. Res. 2001, 39, 351–366. [Google Scholar] [CrossRef]
  34. Tafarojnoruz, A.; Lauria, A. Large eddy simulation of the turbulent flow field around a submerged pile within a scour hole under current condition. Coast. Eng. J. 2020, 62, 489–503. [Google Scholar] [CrossRef]
  35. van Rijn, L.C.; Kroon, A. Sediment transport by currents and waves. Coast. Eng. 1992, 12, 2613–2628. [Google Scholar]
  36. Vijayasree, B.; Eldho, T.; Mazumder, B.; Viswanadham, B.J.S. Effectiveness of combinations of raft foundation with aprons as a protection measure against bridge pier scour. Sadhana 2018, 43, 21. [Google Scholar] [CrossRef] [Green Version]
Figure 1. The model of braided bar constructed in the River Engineering lab at IIT Roorkee. (a) Photograph of mid-channel braided bar model; (b) the sketch of the bar model (all dimensions in meters).
Sustainability 14 00392 g001
Figure 2. Variation of u/ u * versus y u * /v for 2R experimental run (a) and for 4R experimental run (b).
Sustainability 14 00392 g002
Figure 3. The depth-wise distribution of normalized longitudinal velocity for -P- section (a), -Q- section (b), -R- section (c), -S- section (d), -T- section (e), and -U- section (f).
Sustainability 14 00392 g003aSustainability 14 00392 g003b
Figure 4. The depth-wise distribution of normalized vertical velocity for -P- section (a), -Q- section (b), -R- section (c), -S- section (d), -T- section (e), and -U- section (f).
Sustainability 14 00392 g004aSustainability 14 00392 g004b
Figure 5. The scour profile for points upstream of mid-channel bar (a); the deposition profile for points downstream of mid-channel bar (b).
Sustainability 14 00392 g005
Figure 6. The depth-wise distribution of S u for -P- section (a), -Q- section (b), -R- section (c), -S- section (d), -T- section (e), and -U- section (f).
Sustainability 14 00392 g006aSustainability 14 00392 g006b
Figure 7. The depth-wise distribution of S w for -P- section (a), -Q- section (b), -R- section (c), -S- section (d), -T- section (e), and -U- section (f).
Sustainability 14 00392 g007aSustainability 14 00392 g007b
Figure 8. The depth-wise distribution of Fku for -P- section (a), -Q- section (b), -R- section (c), -S- section (d), -T- section (e), and -U- section (f).
Sustainability 14 00392 g008aSustainability 14 00392 g008b
Figure 9. The depth-wise distribution of Fkw for -P- section (a), -Q- section (b), -R- section (c), -S- section (d), -T- section (e), and -U- section (f).
Sustainability 14 00392 g009aSustainability 14 00392 g009b
Figure 10. The depth-wise distribution of T p for -P- section (a), -Q- section (b), -R- section (c), -S- section (d), -T- section (e), and -U- section (f).
Sustainability 14 00392 g010aSustainability 14 00392 g010b
Figure 11. The depth-wise distribution of T d for -R- section (a), -S- section (b), -T- section (c), -U- section (d).
Sustainability 14 00392 g011aSustainability 14 00392 g011b
Table 1. The convergence test for acoustic Doppler velocimetry measurement.
Measurement Time (Min)Standard Deviation (%)
19
27
35
44
54
Table 2. Showing the experimental details.
Experimental CodeBar Size (L × B × Hb) (cm)Flow Depth (cm)Submergence Ratio
IR90 by 70 by 7.5300.25
2R90 by 70 by 11300.37
3R90 by 70 by 15300.5
4R90 by 70 by 19300.63
5R90 by 70 by 21300.7
6R90 by 70 by 24300.8
Table 3. Shows the scouring/deposition that occurred at sections upstream and downstream of the mid-channel bar.
S. No.Sections2R RUN3R RUN4R RUN
1P−2.2−2.6−2.9
2Q−3.1−3.2−3.6
3R−3.4−3.7−4.1
4S−3.6−4.1−4.3
5T2.73.53.9
6U2.33.33.5
7V1.82.62.9
8W1.21.72.3
Publisher’s Note: MDPI stays neutral with regard to jurisdictional claims in published maps and institutional affiliations.

