
Potential Impact of Biostimulator NeOsol and Three Different Manure Types on Physical Soil Properties and Crop Status in Heavy Soils Conditions


Abstract
:
1. Introduction
2. Materials and Methods
2.1. Biostimulator NeOsol
2.2. Site and Crop Management
2.3. Data Acquisition and Processing
2.4. Crop Status
3. Results
3.1. Unit Draft
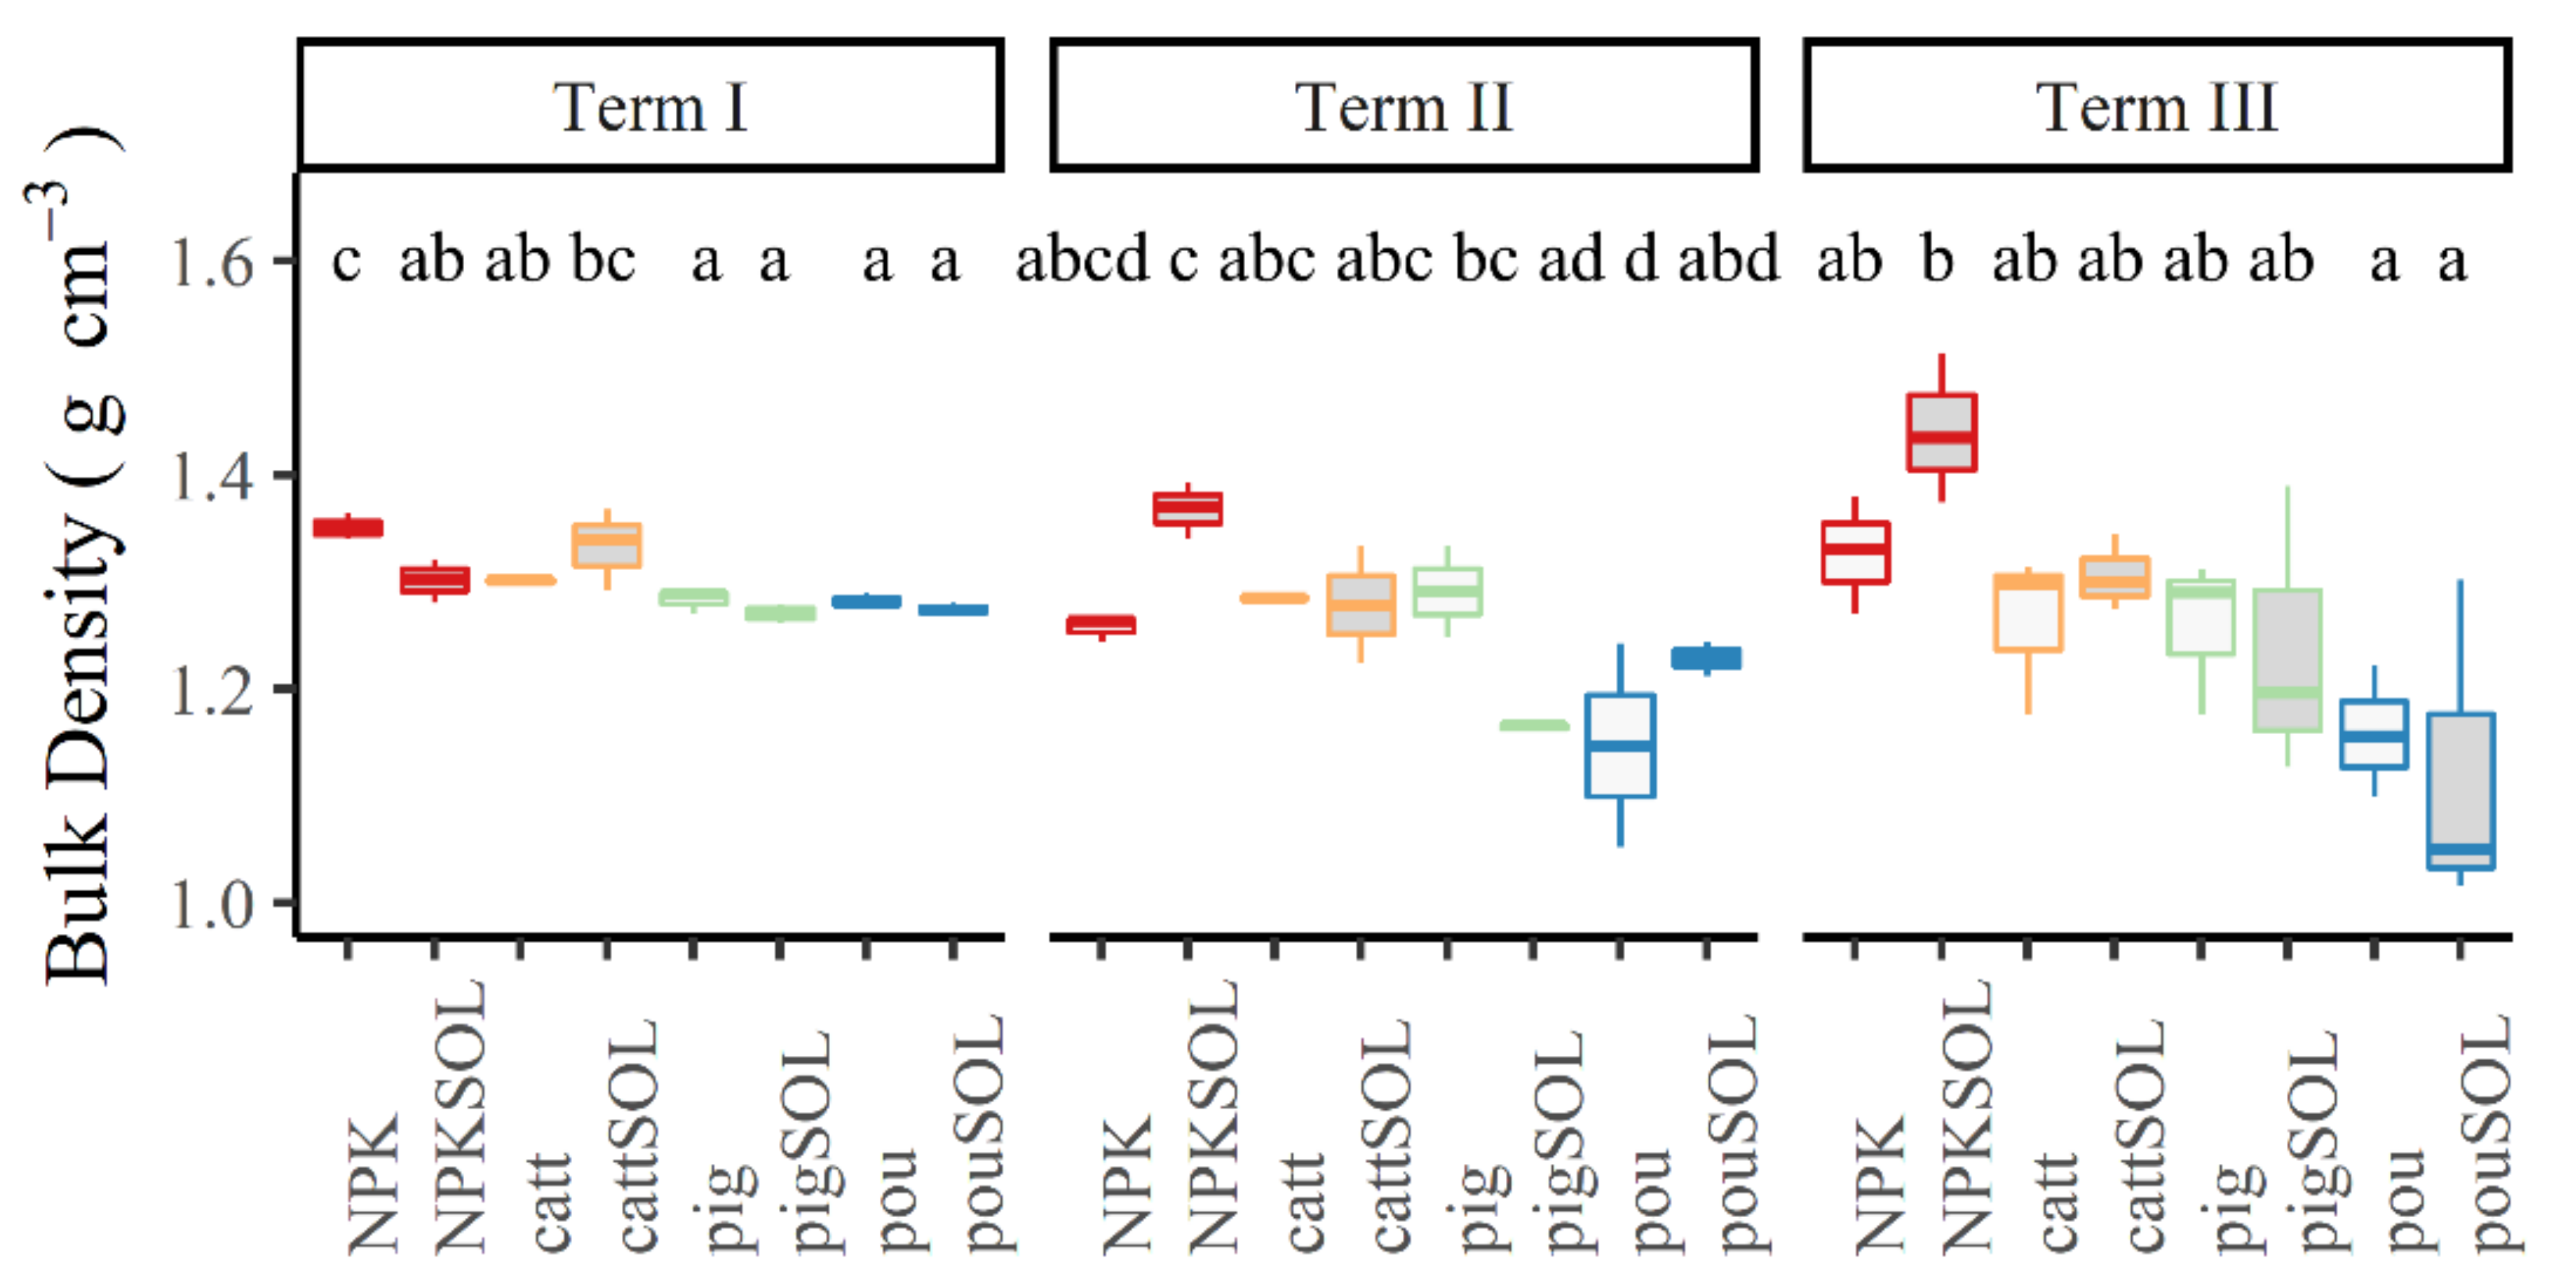
3.2. Bulk Density
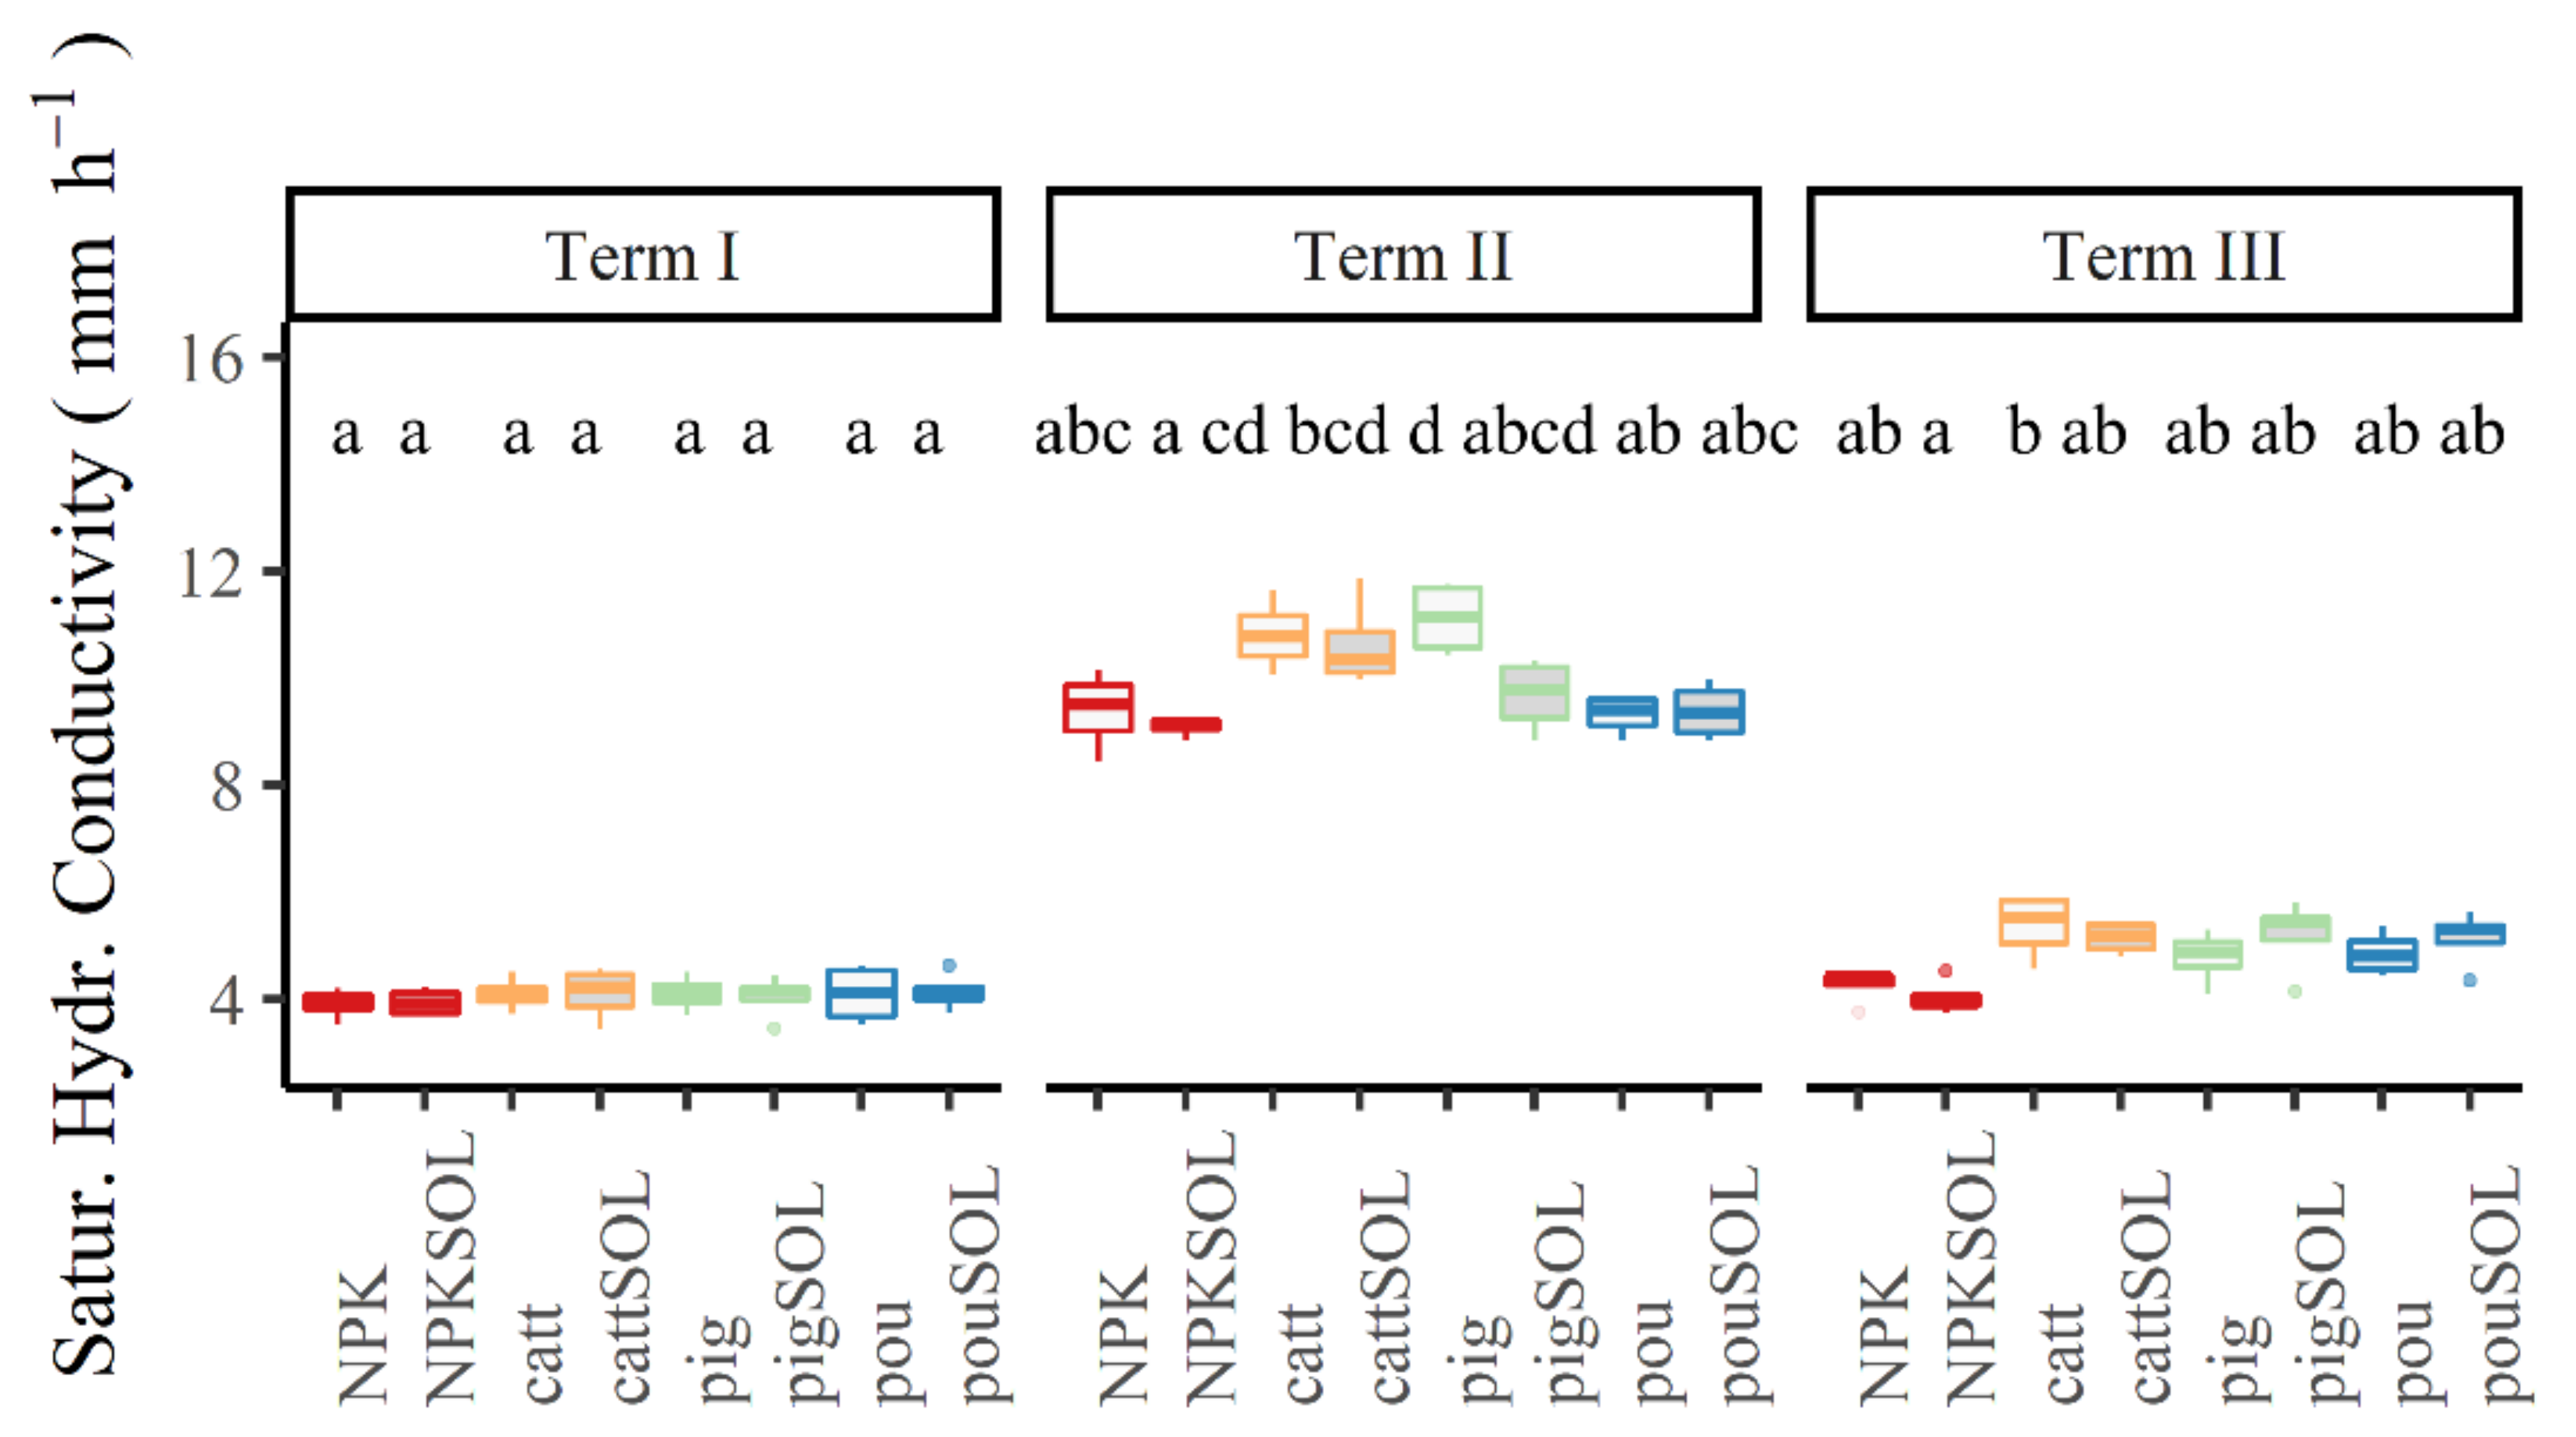
3.3. Saturated Hydraulic Conductivity
3.4. Vegetation Indices
3.5. Yield
4. Discussion
5. Conclusions
Author Contributions
Funding
Institutional Review Board Statement
Informed Consent Statement
Data Availability Statement
Acknowledgments
Conflicts of Interest
References
- Anderson, R.; Bayer, P.E.; Edwards, D. Climate Change and the Need for Agricultural Adaptation. Curr. Opin. Plant Biol. 2020, 56, 197–202. [Google Scholar] [CrossRef]
- Jain, H.K. The Green Revolution History, Impact and Future; Studium Press LLC: Houston, TX, USA, 2010; ISBN 1933699639. [Google Scholar]
- Pham, X.; Stack, M. How Data Analytics Is Transforming Agriculture. Bus Horiz. 2018, 61, 125–133. [Google Scholar] [CrossRef]
- Zhai, Z.; Martínez, J.F.; Beltran, V.; Martínez, N.L. Decision Support Systems for Agriculture 4.0: Survey and Challenges. Comput. Electron. Agric. 2020, 170, 105256. [Google Scholar] [CrossRef]
- Klerkx, L.; Rose, D. Dealing with the Game-Changing Technologies of Agriculture 4.0: How Do We Manage Diversity and Responsibility in Food System Transition Pathways? Glob. Food Sec. 2020, 24. [Google Scholar] [CrossRef]
- Maeder, P.; Fliessbach, A.; Dubois, D.; Gunst, L.; Fried, P.; Niggli, U. Soil Fertility and Biodiversity in Organic Farming. Science 2002, 296, 1694–1697. [Google Scholar] [CrossRef] [Green Version]
- Goldberg, N.; Nachshon, U.; Argaman, E.; Ben-Hur, M. Short Term Effects of Livestock Manures on Soil Structure Stability, Runoff and Soil Erosion in Semi-Arid Soils under Simulated Rainfall. Geosciences 2020, 10, 213. [Google Scholar] [CrossRef]
- Gilley, J.E.; Risse, L.M.; Eghball, B. Managing Runoff Following Manure Application. J. Soil Water Conserv. 2002, 57, 530–533. [Google Scholar]
- Badalucco, L.; Rao, M.; Colombo, C.; Palumbo, G.; Laudicina, V.A. Reversing Agriculture from Intensive to Sustainable Improves Soil Quality in a Semiarid South Italian Soil. Biol. Fertil Soils 2010, 46, 481–489. [Google Scholar] [CrossRef]
- Menšík, L.; Hlisnikovský, L.; Pospíšilová, L.; Kunzová, E. The Effect of Application of Organic Manures and Mineral Fertilizers on the State of Soil Organic Matter and Nutrients in the Long-Term Field Experiment. J. Soils Sediments 2018, 18, 2813–2822. [Google Scholar] [CrossRef]
- Food and Agriculture Organizations of the United Nations Food and Agriculture Data. Available online: http://www.fao.org/faostat (accessed on 22 October 2021).
- Spychalski, W.; Sulewska, H.; Ratajczak, K.; Kaczmarek, T. Composition of Soil Solution after 10 Years of PRP SOL Fertilization Based on the Selected Chemical Properties. J. Res. Appl. Agric. Eng. 2017, 62, 139–143. [Google Scholar]
- Šindelková, I.; Badalíková, B.; Kubíková, Z. The Soil Biostimulant Usage Effect on Soil Properties in Dry Area. In Proceedings of the International Multidisciplinary Scientific GeoConference Surveying Geology and Mining Ecology Management, SGEM, Albena, Bulgaria, 28 June–7 July 2019; Volume 19, pp. 561–568. [Google Scholar]
- Szűcs, L.; Tuba, G.; Zsembeli, J. Effect of PRPSOL Soil Conditioner on the Physical Status of the Soil in Conventional and Reduced Tillage Systems. Acta Agrar. Debreceniensis 2014, 55, 109–113. [Google Scholar] [CrossRef]
- Urbanovičová, O.; Krištof, K.; Findura, P.; Mráz, M.; Jobbágy, J.; Križan, M. The Effect of Soil Conditioner on the Spatial Variability of Soil Environment. Agron. Res. 2018, 16, 2197–2210. [Google Scholar] [CrossRef]
- Bielińska, E.J.; Futa, B.; Bik-Mołodzińska, M.; Szewczuk, C.; Sugier, D. The Impact of Fertilizing Agents on the Enzymatic Activity of Soils (Wpływ preparatów użyźniających na aktywność enzymatyczną gleb). J. Res. Appl. Agric. Eng. 2013, 58, 15–19. [Google Scholar]
- Borowiak, K.; Niewiadomska, A.; Sulewska, H.; Szymanska, G. Effect of PRP SOL and PRP EBV Nutrition on Yield, Photosynthesis Activity and Soil Microbial Activity of Three Cereal Species. Fresenius Environ. Bull. 2016, 25, 2026–2035. [Google Scholar]
- Swędrzyńska, D.; Zielewicz, W.; Swędrzyński, A. Comparison of Soil Bioconditioners and Standard Fertilization in Terms of the Impact on Yield and Vitality of Lolium Perenne and Soil Biological Properties. Open Life Sci. 2019, 14, 666–680. [Google Scholar] [CrossRef] [Green Version]
- Jukić, G.; Šunjić, K.; Varnica, I.; Gašo, D.; Labudović, B. Effect of Different Kinds of Fertilizer on Soybean Yield. In Proceedings of the 8th International Scientific/Professional Conference, Agriculture in Nature and Environment Protection, Vukovar, Croatia, 1–3 June 2015; pp. 110–115. [Google Scholar]
- Sulewska, H.; Niewiadomska, A.; Majchrzak, L.; Panasiewicz, K. Potatoes Reaction on PRP SOL Fertilisation. J. Res. Appl. Agric. Eng. 2012, 57, 116–121. [Google Scholar]
- Ratajczak, K.; Sulewska, H.; Szymańska, G.; Wolna-Maruwka, A.; Faligowska, A. The Effect of Soil Type and Soil Additives on the Selected Growth Parameters and Yield of Flowerheads of Calendula Officinalis L. Herba Polonica 2016, 62, 17–30. [Google Scholar] [CrossRef] [Green Version]
- Porro, D.; Pedò, S. Implication of Nutrition on Root Development. In Proceedings of the I International Symposium on Grapevine Roots, Rauscedo, Italy, 16–17 October 2014; pp. 193–200. [Google Scholar]
- Krzywy-Gawrońska, E. Enzymatic Activity of Urease and Degydrogenase in Soil Fertilized with GWDA Compost with or without a PRP SOL Addition. Pol. J. Environ. Stud. 2012, 21, 949–955. [Google Scholar]
- Krzywy-Gawrońska, E.; Woloszyk, C. Effect of Compost Produced by the GWDA Method and PRP SOL on the Yield of Winter Wheat and Soil Properties. Fertil. Fertil. 2011, 43, 29–38. [Google Scholar]
- Klír, J.; Kunzová, E.; Cérmák, P. Frame Methodics of Plant Nutrition and Fertilization (Rámcová Metodika Výživy Rostlin a Hnojení), 2nd ed.; Crop Research Institute: Prague, Czech Republic, 2008; ISBN 78-80-87011-61-4. [Google Scholar]
- Bagarello, V.; Iovino, M.; Elrick, D. A Simplified Falling-Head Technique for Rapid Determination of Field-Saturated Hydraulic Conductivity. Soil Sci. Soc. Am. J. 2004, 68, 66–73. [Google Scholar] [CrossRef]
- Elrick, D.E.; Reynolds, W.D.; Tan, K.A. Hydraulic Conductivity Measurements in the Unsaturated Zone Using Improved Well Analyses. Groundw. Monit. Remediat. 1989, 9, 184–193. [Google Scholar] [CrossRef]
- Rouse, R.W.H.; Haas, J.A.W.; Deering, D.W. Monitoring Vegetation Systems in the Great Plains with ERTS. In Proceedings of the Third Earth Resources Technology Satellite-1 Symposium NASA SP-351, Washington, DC, USA, 10–14 December 1973; Section A. Volume 1, pp. 309–317. [Google Scholar]
- Gao, B.C. NDWI—A Normalized Difference Water Index for Remote Sensing of Vegetation Liquid Water from Space. Remote Sens. Environ. 1996, 58, 257–266. [Google Scholar] [CrossRef]
- Boegh, E.; Soegaard, H.; Broge, N.; Hasager, C.B.; Jensen, N.O.; Schelde, K.; Thomsen, A. Airborne Multispectral Data for Quantifying Leaf Area Index, Nitrogen Concentration, and Photosynthetic Efficiency in Agriculture. Remote Sens. Environ. 2002, 81, 179–193. [Google Scholar] [CrossRef]
- RStudio Team RStudio: Integrated Deveopment for R; R Foundation: Vienna, Austria, 2021.
- Moitzi, G.; Neugschwandtner, R.W.; Kaul, H.; Wagentristl, H. Energy Efficiency of Winter Wheat in a Long-Term Tillage Experiment under Pannonian Climate Conditions. Eur. J. Agron 2019, 103, 24–31. [Google Scholar] [CrossRef]
- Rashidi, M.; Najjarzadeh, I.; Jaberinasab, B.; Emadi, S.M.; Fayyazi, M. Effect of Soil Moisture Content, Tillage Depth and Operation Speed on Draft Force of Moldboard Plow. Middle East J. Sci. Res. 2013, 16, 245–249. [Google Scholar] [CrossRef]
- Liang, A.; Mclaughlin, N.B.; Ma, B.L.; Gregorich, E.G.; Morrison, M.J.; Burtt, S.D.; Patterson, B.S.; Evenson, L.I. Changes in Mouldboard Plough Draught and Tractor Fuel Consumption on Continuous Corn after 18 Years of Organic and Inorganic N Amendments. Energy 2013, 52, 89–95. [Google Scholar] [CrossRef]
- Mclaughlin, N.B.; Gregorich, E.G.; Dwyer, L.M.; Ma, B.L. Effect of Organic and Inorganic Soil Nitrogen Amendments on Mouldboard Plow Draft. Soil Tillage Res. 2002, 64, 211–219. [Google Scholar] [CrossRef]
- Žemličková, N.; Šařec, P. Influence of Application of Organic Matter and Its Activators on Soil-Tillage Implement Draft on Modal Luvisol. In Proceedings of the 6th International Conference on Trends in Agricultural Engineering, Prague, Czech Republic, 7–9 September 2016; pp. 736–742.
- Tuba, G.; Kovács, G.; Sinka, L.; Nagy, P.; Rivera-Garcia, A.; Bajusová, Z.; Findura, P.; Zsembeli, J. Effect of Soil Conditioning on Soil Penetration Resistance and Traction Power Demand of Ploughing. Agriculture 2021, 67. [Google Scholar] [CrossRef]
- Blanco-canqui, H.; Stone, L.R.; Schlegel, A.J.; Lyon, D.J.; Vigil, M.F.; Mikha, M.M.; Stahlman, P.W.; Rice, C.W. No-till Induced Increase in Organic Carbon Reduces Maximum Bulk Density of Soils. Soil Sci. Soc. Am. J. 2009, 73, 1871–1879. [Google Scholar] [CrossRef]
- Nouri, A.; Lee, J.; Yin, X.; Tyler, D.D.; Jagadamma, S.; Arelli, P. Soil Physical Properties and Soybean Yield as Influenced by Long-Term Tillage Systems and Cover Cropping in the Midsouth USA. Sustainability 2018, 10, 4696. [Google Scholar] [CrossRef] [Green Version]
- United States Department of Agriculture. Soil Bulk Density/Moisture/Aeration; United States Department of Agriculture: Washington, DC, USA, 2019.
- Schjønning, P.; Christensen, B.T.; Carstensen, B. Physical and Chemical Properties of a Sandy Loam Receiving Animal Manure, Mineral Fertilizer or No Fertilizer for 90 Years. Eur. J. Soil Sci. 1994, 45, 257–268. [Google Scholar] [CrossRef]
- Hemmat, A.; Aghilinategh, N.; Rezainejad, Y.; Sadeghi, M. Long-Term Impacts of Municipal Solid Waste Compost, Sewage Sludge and Farmyard Manure Application on Organic Carbon, Bulk Density and Consistency Limits of a Calcareous Soil in Central Iran. Soil Tillage Res. 2010, 108, 43–50. [Google Scholar] [CrossRef]
- Šařec, P.; Žemličková, N. Soil Physical Characteristics and Soil-Tillage Implement Draft Assessment for Different Variants of Soil Amendments. Agron. Res. 2016, 14, 948–958. [Google Scholar]
- Boyle, M.; Frankenberger, W.T.; Stolzy, L.H. The Influence of Organic Matter on Soil Aggregation and Water Infiltration. J. Prod. Agric. 1989, 2, 290–299. [Google Scholar] [CrossRef]
- Tejada, M.; Gonzalez, J.L. Influence of Organic Amendments on Soil Structure and Soil Loss under Simulated Rain. Soil Tillage Res. 2007, 93, 197–205. [Google Scholar] [CrossRef]
- Abrol, V.; Ben-Hur, M.; Verheijen, F.G.A.; Keizer, J.J.; Martins, M.A.S.; Tenaw, H.; Tchehansky, L.; Graber, E.R. Biochar Effects on Soil Water Infiltration and Erosion under Seal Formation Conditions: Rainfall Simulation Experiment. J. Soils Sediments 2016, 16, 2709–2719. [Google Scholar] [CrossRef]
- Šařec, P.; Novák, P.; Kumhálová, J. Impact of Activators of Organic Matter on Soil and Crop Stand Properties in Conditions of Very Heavy Soils. In Proceedings of the Engineering for Rural Development, Jelgava, Latvia, 24–26 May 2017; Volume 16, pp. 486–491. [Google Scholar]
- Li, T.; Zhang, Y.; Bei, S.; Li, X.; Reinsch, S.; Zhang, H.; Zhang, J. Contrasting Impacts of Manure and Inorganic Fertilizer Applications for Nine Years on Soil Organic Carbon and Its Labile Fractions in Bulk Soil and Soil Aggregates. Catena 2020, 194, 4739. [Google Scholar] [CrossRef]
- Voltr, V.; Menšík, L.; Hlisnikovský, L.; Hruška, M.; Pokorný, E.; Pospíšilová, L. The Soil Organic Matter in Connection with Soil Properties and Soil Inputs. Agronomy 2021, 11, 779. [Google Scholar] [CrossRef]
- Liang, Q.; Chen, H.; Gong, Y.; Fan, M.; Yang, H.; Lal, R.; Kuzyakov, Y. Effects of 15 Years of Manure and Inorganic Fertilizers on Soil Organic Carbon Fractions in a Wheat-Maize System in the North China Plain. Nutr. Cycl. Agroecosyst. 2012, 92, 21–33. [Google Scholar] [CrossRef]
- Sulewska, H.; Koziara, W.; Szymańska, G.; Niewiadomska, A.; Panasiewict, K.; Ratajczak, K. Response of spring barley to prp sol application as a complex of mineral inducer prosess (MIP). Nauka Przyr. Technol. 2016, 10, 1–14. [Google Scholar] [CrossRef]
- Kováč, L.; Jakubová, J.; Šariková, D. Effect of Tillage System and Soil Conditioner Application on Soybean (Glycine Max (L.) Merrill.) and Its Crop Management Economic Indicators. Agriculture 2014, 60, 60–69. [Google Scholar] [CrossRef] [Green Version]


| Soil Profile Depth (m) | Unit | ||
|---|---|---|---|
| 0.00–0.30 | 0.30–0.60 | ||
| Clay (<0.002 mm) | 48 | 60 | % w/w |
| Silt (0.002–0.05 mm) | 32 | 39 | % w/w |
| Very fine sand (0.05–0.10 mm) | 2 | 1 | % w/w |
| Fine sand (0.10–0.25 mm) | 18 | 0 | % w/w |
| Bulk density | 1.46 | 1.48 | g cm−1 |
| Porosity | 46.15 | 43.99 | % w/w |
| Hummus content | 3.89 | 1.44 | % w/w |
| Cation exchange capacity | 278 | 272 | mmol kg−1 |
| Volumetric moisture | 35.65 | 40.20 | % v/v |
| pH (KCl) | 7.18 | 7.21 | |
| Variant | Treatment | ||
|---|---|---|---|
| NPK 1 | Manure | NeOsol | |
| NPK | Yes—full rate | No | No |
| NPKSOL | Yes—full rate | No | Yes |
| catt | Yes—top-up rate | Yes—cattle | No |
| cattSOL | Yes—top-up rate | Yes—cattle | Yes |
| pig | Yes—top-up rate | Yes—pig | No |
| pigSOL | Yes—top-up rate | Yes—pig | Yes |
| pou | Yes—top-up rate | Yes—poultry | No |
| pouSOL | Yes—top-up rate | Yes—poultry | Yes |
| Season | Sowing Date | Harvest Date | Crop | NeOsol (kg ha−1) | Cow Manure (t ha−1) | Pig Manure (t ha−1) | Poultry Manure (t ha−1) |
|---|---|---|---|---|---|---|---|
| 2014 | - | - | Barley | 200 | 50 | 40 | 10 |
| 2015 Term I | 14.4.2015 | 27.8.2015 | Corn | 200 | - | - | - |
| 2016 | 23.3.2016 | 5.8.2016 | Spring barley | 200 | 50 | 20 | 8 |
| 2017 Term II | 2.11.2016 | 4.8.2017 | Winter wheat | 150 | - | - | - |
| 2018 | 10.4.2018 | 3.8.2018 | Corn | 150 | - | - | - |
| 2019 | 5.10.2018 | 24.7.2019 | Winter wheat | 150 | 30 | 20 | 10 |
| 2020 Term III | 15.10.2019 | 30.7.2020 | Winter wheat | 150 | - | - | - |
| NDVI | NDWI | LAI | ||||||||||
|---|---|---|---|---|---|---|---|---|---|---|---|---|
| 2017 | 2018 | 2019 | 2020 | 2017 | 2018 | 2019 | 2020 | 2017 | 2018 | 2019 | 2020 | |
| NPK–NPKSOL | −0.0049 | −0.0037 | 0.0007 | −0.0040 | −0.0074 | 0.0062 | −0.0018 | −0.0069 | −0.1032 | 0.1544 | −0.0075 | −0.0427 |
| NPK–catt | −0.0126 | −0.0159 | −0.0125 | −0.0328 *** | −0.0225 | −0.0225 | −0.0243 ** | −0.0493 *** | −0.2705 | −0.0196 | −0.1401 | −0.3302 *** |
| NPK–cattSOL | −0.0121 | −0.0107 | −0.0087 | −0.0256 *** | −0.0218 | −0.0144 | −0.0195 | −0.0385 *** | −0.2154 | 0.1198 | −0.1054 | −0.2519 ** |
| NPK–pig | −0.0107 | −0.0368 * | −0.0173 * | −0.0352 *** | −0.0232 | −0.0312 | −0.0291 *** | −0.0529 *** | −0.2540 | −0.4654 | −0.2331 | −0.4828 *** |
| NPK–pigSOL | −0.0182 * | −0.0410 ** | −0.0191 ** | −0.0384 *** | −0.0333 * | −0.0338 | −0.0284 ** | −0.0554 *** | −0.3051 | −0.9308 | −0.3241 ** | −0.5624 *** |
| NPK–pou | −0.0125 | −0.0403 ** | −0.0226 *** | −0.0384 *** | −0.0291 * | −0.0206 | −0.0290 ** | −0.0545 *** | −0.1564 | −0.8391 | −0.3627 *** | −0.5481 *** |
| NPK–pouSOL | −0.0129 | −0.0316 | −0.0188 ** | −0.0354 *** | −0.0289 * | −0.0215 | −0.0249 ** | −0.0519 *** | −0.1757 | −0.6348 | −0.3284 ** | −0.5207 *** |
| NPKSOL–catt | −0.0077 | −0.0123 | −0.0132 | −0.0288 *** | −0.0150 | −0.0287 | −0.0225 * | −0.0425 *** | −0.1673 | −0.1739 | −0.1325 | −0.2874 *** |
| NPKSOL–cattSOL | −0.0072 | −0.0070 | −0.0094 | −0.0216 *** | −0.0144 | −0.0206 | −0.0178 | −0.0316 *** | −0.1122 | −0.0346 | −0.0979 | −0.2092 * |
| NPKSOL–pig | −0.0059 | −0.0331 * | −0.0180 * | −0.0312 *** | −0.0158 | −0.0374 * | −0.0273 ** | −0.0460 *** | −0.1508 | −0.6198 | −0.2256 | −0.4401 *** |
| NPKSOL–pigSOL | −0.0133 | −0.0373 * | −0.0198 ** | −0.0343 *** | −0.0259 | −0.0400 * | −0.0266 ** | −0.0485 *** | −0.2019 | −1.0852 * | −0.3165 ** | −0.5197 *** |
| NPKSOL–pou | −0.0076 | −0.0366 * | −0.0233 *** | −0.0344 *** | −0.0217 | −0.0268 | −0.0273 ** | −0.0476 *** | −0.0532 | −0.9935 * | −0.3551 ** | −0.5054 *** |
| NPKSOL–pouSOL | −0.0081 | −0.0279 | −0.0195 ** | −0.0314 *** | −0.0214 | −0.0277 | −0.0231 * | −0.0450 *** | −0.0725 | −0.7892 | −0.3209 ** | −0.4780 *** |
| catt–cattSOL | 0.0005 | 0.0053 | 0.0038 | 0.0072 | 0.0006 | 0.0081 | 0.0048 | 0.0109 | 0.0551 | 0.1393 | 0.0347 | 0.0783 |
| catt–pig | 0.0018 | −0.0209 | −0.0048 | −0.0024 | −0.0007 | −0.0087 | −0.0048 | −0.0035 | 0.0165 | −0.4458 | −0.0931 | −0.1526 |
| catt–pigSOL | −0.0056 | −0.0251 | −0.0066 | −0.0056 | −0.0108 | −0.0113 | −0.0040 | −0.0060 | −0.0346 | −0.9113 | −0.1840 | −0.2323 ** |
| catt–pou | 0.0001 | −0.0243 | −0.0101 | −0.0056 | −0.0067 | 0.0019 | −0.0047 | −0.0051 | 0.1142 | −0.8196 | −0.2226 | −0.2179 * |
| catt–pouSOL | −0.0003 | −0.0156 | −0.0063 | −0.0027 | −0.0064 | 0.0010 | −0.0006 | −0.0026 | 0.0949 | −0.6153 | −0.1884 | −0.1905 |
| cattSOL–pig | 0.0013 | −0.0261 | −0.0086 | −0.0096 | −0.0014 | −0.0168 | −0.0096 | −0.0144 | −0.0386 | −0.5851 | −0.1278 | −0.2309 ** |
| cattSOL–pigSOL | −0.0061 | −0.0303 | −0.0103 | −0.0127 | −0.0115 | −0.0194 | −0.0088 | −0.0169 | −0.0897 | −1.0506 * | −0.2187 | −0.3105 *** |
| cattSOL–pou | −0.0004 | −0.0296 | −0.0139 | −0.0128 | −0.0073 | −0.0062 | −0.0095 | −0.0160 | 0.0590 | −0.9589 * | −0.2573 * | −0.2962 *** |
| cattSOL–pouSOL | −0.0009 | −0.0209 | −0.0101 | −0.0098 | −0.0070 | −0.0071 | −0.0054 | −0.0134 | 0.0397 | −0.7546 | −0.2231 | −0.2688 ** |
| pig–pigSOL | −0.0074 | −0.0042 | −0.0017 | −0.0031 | −0.0101 | −0.0026 | 0.0008 | −0.0025 | −0.0511 | −0.4655 | −0.0909 | −0.0796 |
| pig–pou | −0.0017 | −0.0034 | −0.0053 | −0.0032 | −0.0059 | 0.0106 | 0.0001 | −0.0016 | 0.0977 | −0.3738 | −0.1295 | −0.0653 |
| pig–pouSOL | −0.0022 | 0.0053 | −0.0015 | −0.0002 | −0.0057 | 0.0097 | 0.0042 | 0.0010 | 0.0783 | −0.1695 | −0.0953 | −0.0379 |
| pigSOL–pou | 0.0057 | 0.0007 | −0.0035 | 0.0000 | 0.0042 | 0.0132 | −0.0007 | 0.0009 | 0.1488 | 0.0917 | −0.0386 | 0.0143 |
| pigSOL–pouSOL | 0.0052 | 0.0094 | 0.0002 | 0.0029 | 0.0044 | 0.0123 | 0.0035 | 0.0035 | 0.1295 | 0.2960 | −0.0044 | 0.0417 |
| pou–pouSOL | −0.0005 | 0.0087 | 0.0038 | 0.0029 | 0.0003 | −0.0009 | 0.0042 | 0.0026 | −0.0193 | 0.2043 | 0.0342 | 0.0274 |
| Variant. | Term I Corn (t ha−1) | Term II Winter Wheat (t ha−1) | Term III Winter Wheat (t ha−1) |
|---|---|---|---|
| NPK | 32.9 ± 0.7 (a) | 7.71 ± 0.35 (a) | 7.36 ± 0.33 (a) |
| NPKSOL | 32.3 ± 0.8 (a) | 7.95 ± 0.33 (a) | 8.11 ± 0.32 (b) |
| catt | 32.5 ± 0.7 (a) | 8.43 ± 0.42 (a) | 7.93 ± 0.21 (ab) |
| cattSOL | 33.1 ± 0.7 (ab) | 8.48 ± 0.42 (a) | 8.29 ± 0.40 (b) |
| pig | 32.1 ± 1.0 (a) | 7.71 ± 0.36 (a) | 8.11 ± 0.18 (b) |
| pigSOL | 35.7 ± 0.6 (c) | 8.10 ± 0.46 (a) | 8.38 ± 0.22 (b) |
| pou | 34.8 ± 0.8 (bc) | 7.62 ± 0.30 (a) | 8.11 ± 0.19 (b) |
| pouSOL | 32.3 ± 0.9 (a) | 7.90 ± 0.41 (a) | 8.32 ± 0.19 (b) |
Publisher’s Note: MDPI stays neutral with regard to jurisdictional claims in published maps and institutional affiliations. |
© 2021 by the authors. Licensee MDPI, Basel, Switzerland. This article is an open access article distributed under the terms and conditions of the Creative Commons Attribution (CC BY) license (https://creativecommons.org/licenses/by/4.0/).
Share and Cite
Novák, V.; Šařec, P.; Křížová, K.; Novák, P.; Látal, O. Potential Impact of Biostimulator NeOsol and Three Different Manure Types on Physical Soil Properties and Crop Status in Heavy Soils Conditions. Sustainability 2022, 14, 438. https://doi.org/10.3390/su14010438
Novák V, Šařec P, Křížová K, Novák P, Látal O. Potential Impact of Biostimulator NeOsol and Three Different Manure Types on Physical Soil Properties and Crop Status in Heavy Soils Conditions. Sustainability. 2022; 14(1):438. https://doi.org/10.3390/su14010438
Chicago/Turabian StyleNovák, Václav, Petr Šařec, Kateřina Křížová, Petr Novák, and Oldřich Látal. 2022. "Potential Impact of Biostimulator NeOsol and Three Different Manure Types on Physical Soil Properties and Crop Status in Heavy Soils Conditions" Sustainability 14, no. 1: 438. https://doi.org/10.3390/su14010438