Article

Estimation of the Setting and Infrastructure Criterion of the UI GreenMetric Ranking Using Unmanned Aerial Vehicles

by
Jose Eduardo Fuentes
1,*,
Cesar Edwin Garcia
2 and
Robin Alexis Olaya
2
1
AGESAT Research Group, Geography Department, Universidad del Valle, Cali 760031, Colombia
2
School of Civil and Geomatics Engineering, Universidad del Valle, Cali 760031, Colombia
*
Author to whom correspondence should be addressed.
Sustainability 2022, 14(1), 46; https://doi.org/10.3390/su14010046
Submission received: 1 December 2021 / Revised: 14 December 2021 / Accepted: 18 December 2021 / Published: 21 December 2021

Abstract

:
This study presents a methodology to estimate the seven indicators of the Setting and Infrastructure criterion of the UI GreenMetric World University Ranking based on three-dimensional data from a point cloud taken from an unmanned aerial vehicle (UAV). This study also estimated the potential aerial biomass, C and CO2, stored in the green spaces of a university campus using photogrammetric data analyzed in a Geographic Information System (GIS). The method was based on isolating classified point clouds using digital surface models (DSMs) and ground control points (GCPs) considering the canopy height model (CHM), the allometric equation (DBH, p, h), the biomass conversion factor, and carbon dioxide equivalents (CO2-e). The results confirmed that the national models for estimating the potential C reserves in natural forests are very close to reality and that the open space and green areas available to people on campus are adequate. The use of photogrammetric data facilitated the estimation of UI GreenMetric indicators from a highly detailed, low-cost three-dimensional model. The results of a case study revealed that the campus assimilates the CO2 emissions it produces and generates a surplus.

1. Introduction

Climate change, air pollution, ocean pollution by plastics, and the loss of biodiversity are global environmental problems that threaten life on Earth [1]. Universities, as research and learning institutions, play a fundamental role in society by addressing these problems from multiple disciplines and are crucial components in the construction of a more sustainable society through the training of new generations. Green universities are a concept in which higher education institutions promote environmental sustainability not only through research activities but also through improving the infrastructure of their campus, to create a more environmentally friendly environment, and updating their curricula to include courses on the environment and sustainability [2]. A green university implements sustainability in all the different dimensions of its activity, that is, institutional framework, campus operations, teaching, research, community participation, accountability, and reporting [3]. Shifting towards green university practices has become increasingly important for all universities worldwide [2]. Therefore, universities are not only concerned with their quality of education, but also aim to obtain a competitive advantage by creating a “greener” campus environment for their students by investing in sustainability [2]. Currently, the United Nations 2030 Agenda and more than 300 universities around the world are committed to the UNESCO “education for sustainable development” initiative. This commitment has emphasized the fundamental role of universities in the construction of a more environmentally friendly society that is aligned with the Sustainable Development Goals [4]. To compare efforts towards “sustainability” and academic performance, an initiative has been carried out at the University of Indonesia (UI) since 2010 with the objective of classifying the world’s universities by their activities related to a green campus and sustainability, for which a “green” ranking, called the UI GreenMetric World University Ranking, has been developed. The first attempt sought to make a global ranking of universities according to their sustainable behavior [5]. As this new world ranking of universities is administered mainly through the use of an online open access system, many universities have participated with enthusiasm to classify their performance and evaluate their place in the ranking [6]. The classification can be used for both developed and developing countries [6]. The methodology is based on a set of simple and easy-to-collect criteria for any university, which are related to the key aspects of sustainability used to implement the ranking. There are six criteria—Setting and Infrastructure (SI), Energy and Climate Change (EC), Waste (WS), Water (WR), Transportation (TR), and Education (ED)—and 39 indicators are associated with the criteria. In the most recent ranking for 2020, the Universidad del Valle ranked 19th nationally and 264th worldwide, showing the effects of efforts to implement sustainability policies and climate change mitigation in the collective consciousness of its university community.
Natural forests in tropical regions are the largest terrestrial carbon sinks in the world, and host rich biological diversity that provides a variety of ecosystem services [7]. Colombia is one of the most biodiverse countries in the world, and quantification of the carbon reserves of these ecosystems is very important to understand the global carbon cycle and how much it can contribute to reducing the effects of climate change. The efforts associated with reducing and offsetting the carbon footprint of university campuses often focus on the dynamics associated with their green areas and forest areas. Traditionally, biomass densities have been evaluated using inventory plots in the field, which are very valuable but are also expensive and time-consuming and are inherently limited to geographically representative areas [8]. The estimation of carbon stocks in tropical forests has evolved from an activity based mainly on field inventories to an effort assisted by remote aerial and spatial sensors [9]. Geospatial technology plays an important role in this context, offering rapid and accurate assessments of forest biomass at detailed spatial scales [7]. In recent years, significant advances have been made in terrain and surface modeling; advanced models have been developed for mapping data from photogrammetric, satellite, or aerial sources such as light detection and ranging (LIDAR) to UAVs that allow reconstruction of the three-dimensional shape of trees, buildings, and infrastructure with great detail and precision [10,11]. Fonstad et al. [12] demonstrated that the structure from motion (SfM) method and low-height platforms can produce products comparable to those of LIDAR surveys with high precision, lower costs, and easier logistics. For most geographic areas, precise aerial biomass data are not available. Currently, the combination of field measurements, mapping, and remote sensing data taken from UAVs allows the evaluation of the biomass potential in forest areas from a model of vegetation height; this approach offers an efficient and more accessible way to characterize a specific place in any forest where a UAV flight can be performed. Many of the analyses where three-dimensional models have been developed are based on the use of a Geographic Information System (GIS) in conjunction with a digital surface model (DSM) or digital terrain model (DTM) generated from different types of source data, such as photogrammetric UAV and allometric equations, as illustrated in Table 1.
Three-dimensional data make it possible to perform complex surface modeling, locate precise geographical positions, and estimate the shapes of objects. As with the quantification of biomass, many of these spatial measurements can be estimated from surface models, which are applied in multiple fields, such as construction, infrastructure planning, architecture, archeology, and real-estate analysis. Table 2 shows some of the applications based on the use of photogrammetric data from UAVs to generate a three-dimensional reconstruction of the surface.
The modeling of the terrain surface is used as a theoretical basis in this work. A UAV–GreenMetric methodology aimed at obtaining the seven indicators of the Setting and Infrastructure criterion of the UI GreenMetric World University Ranking is presented, and the carbon in the aboveground biomass is estimated as an additional criterion. These data are obtained using the height of the vegetation, forest data, and an allometric equation through GIS analysis in conjunction with surface data resulting from the processing of images taken by a UAV. Currently, there is no applicable methodology for estimating UI GreenMetric infrastructure criteria on a university campus with remote sensors at a detailed enough scale to precisely quantify the metrics of the different types of campus coverage and carbon content. This methodology can be applied to quantify data required for this ranking and estimate carbon fixation in forest areas that contribute to the sustainability of university campuses. The objective of this work is to estimate the basic measures to calculate the aerial biomass and infrastructure metrics of a university campus, using data from a photogrammetric flight taken from unmanned aerial vehicles (UAVs).

2. Materials and Methods
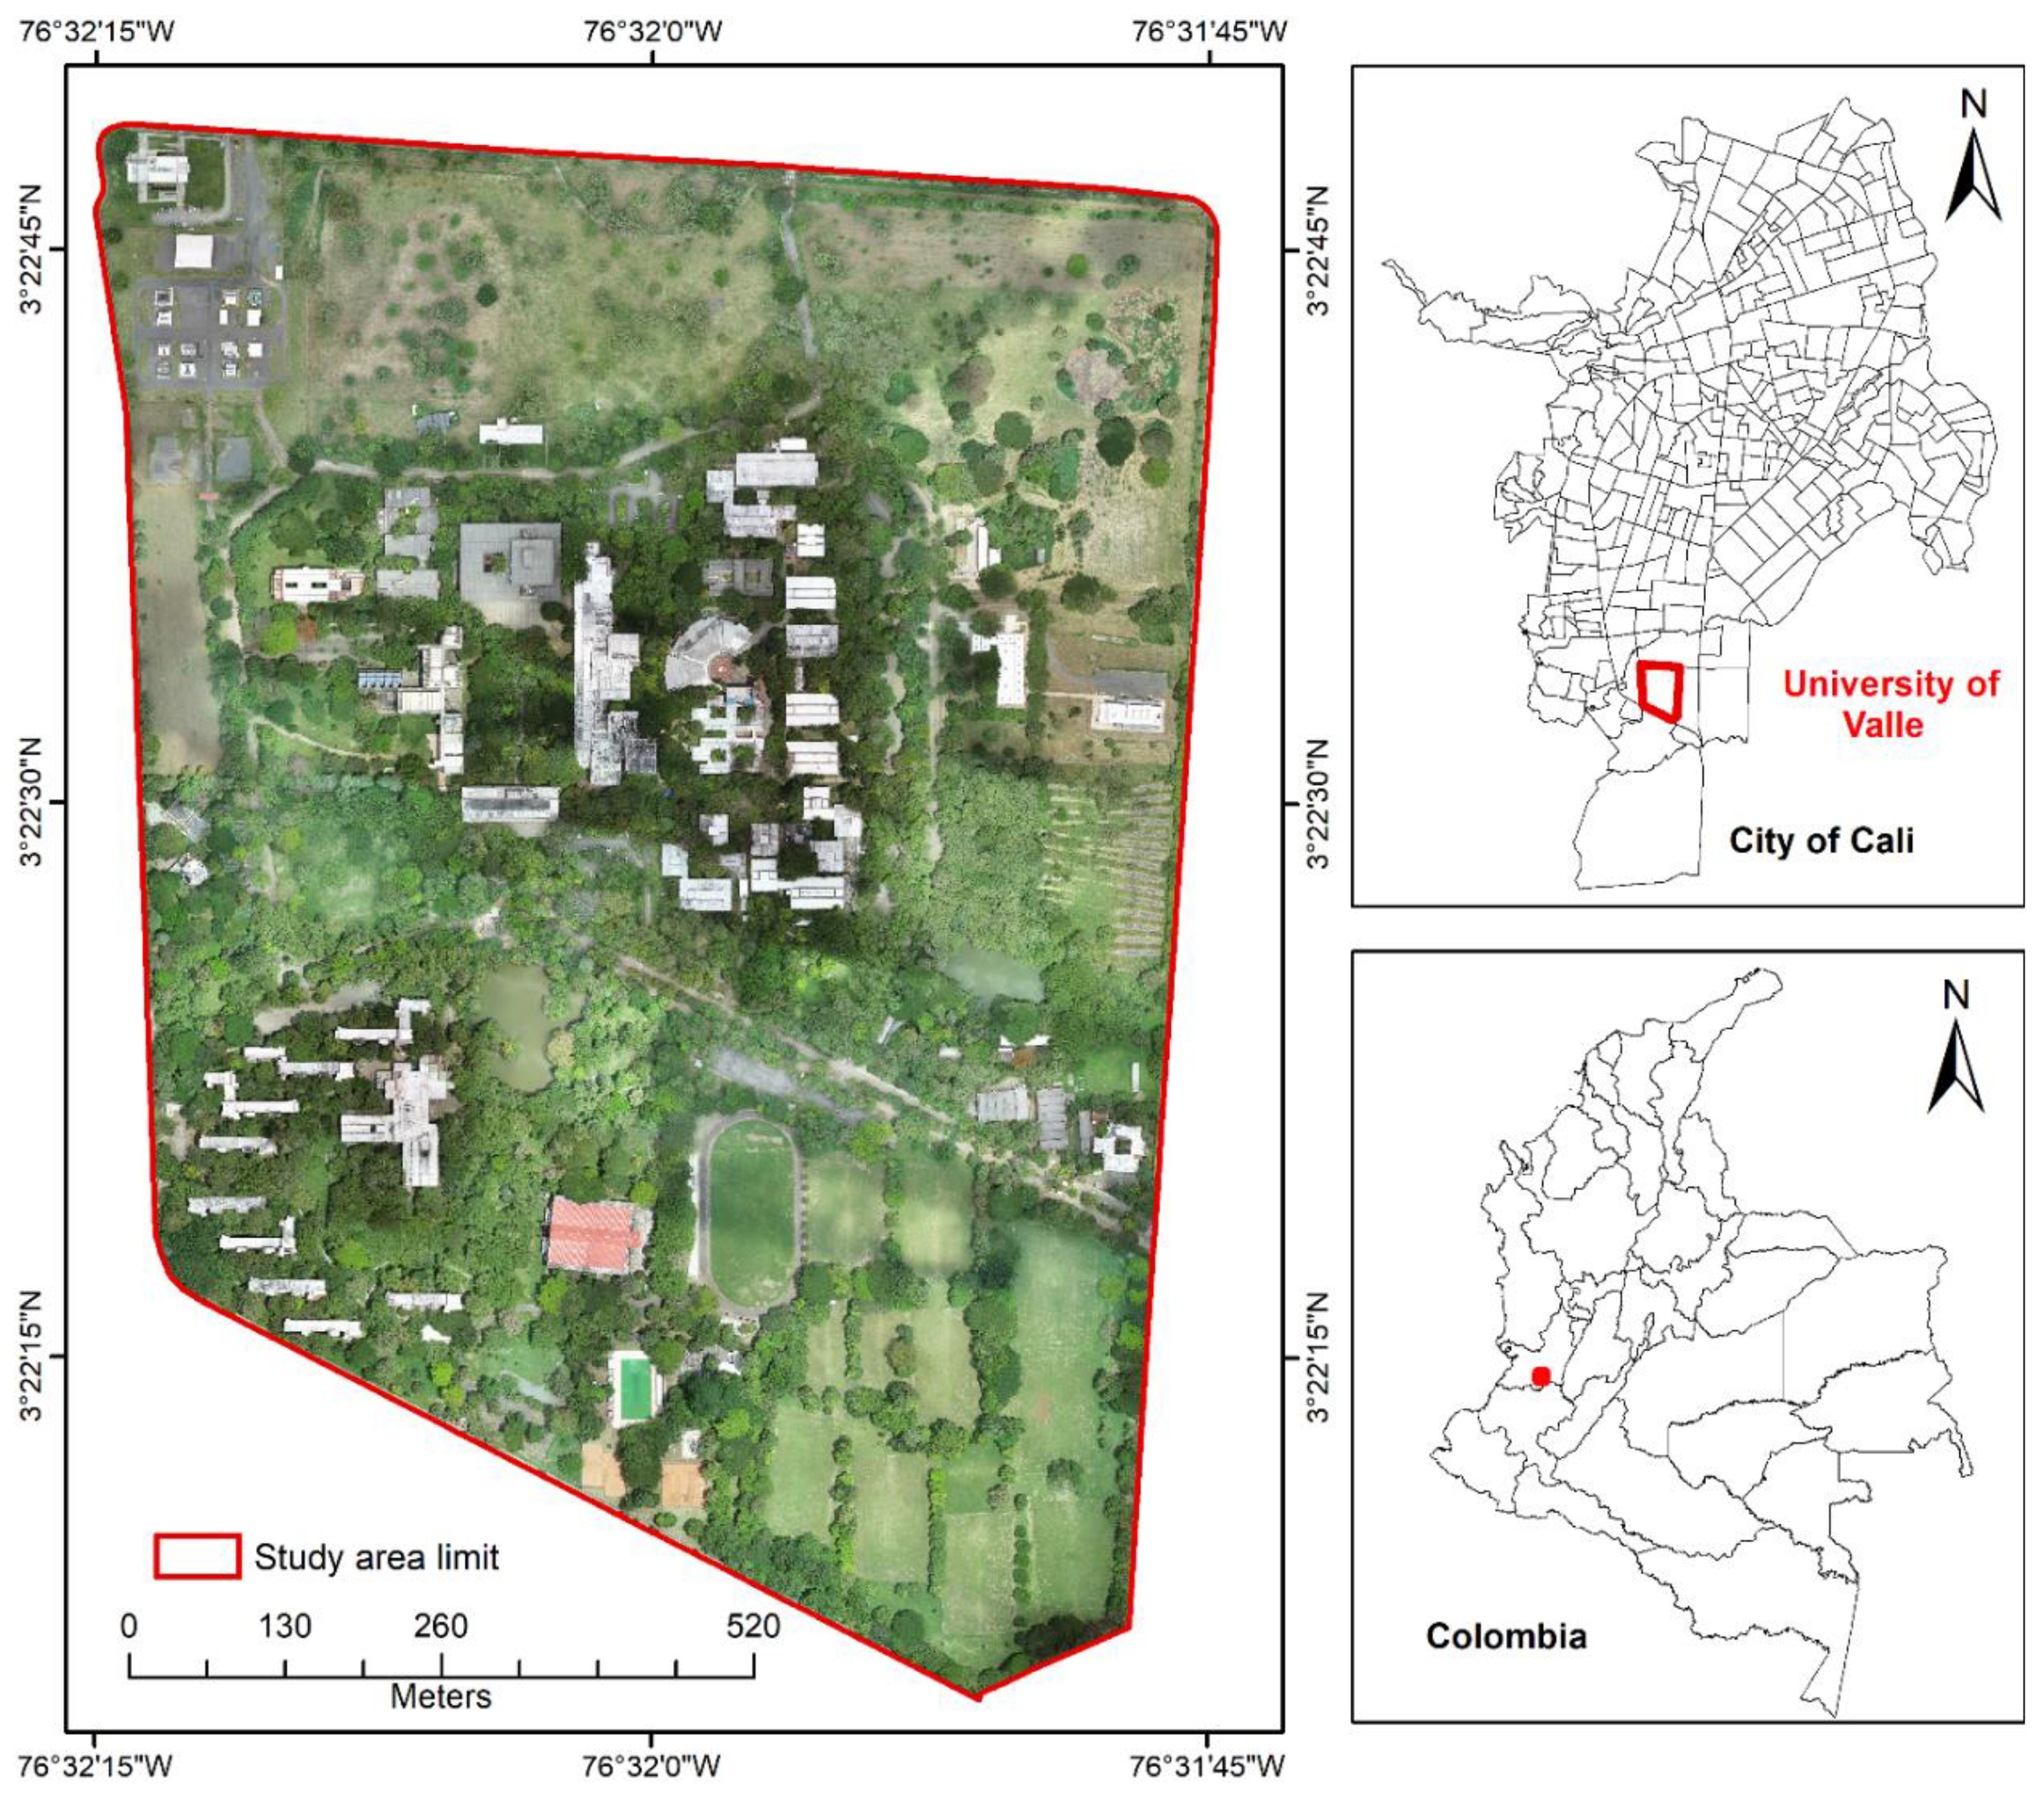
2.1. Study Area

The main campus of the University of Valle Sede Meléndez was used as a case study. This area is located south of the city of Santiago de Cali in the department of Valle del Cauca, Colombia. The topography of the city is largely flat with mountains and low hills toward the western side; it has a high density of arboreal vegetation and multiple green areas. The campus is surrounded by a large residential area and comprises approximately 979,123 m2, as shown in Figure 1, framed within the geographical coordinates 3°22′28.75″ N and 76°32′0.33″ W. This city is located at an average elevation of 973 MAMSL; the average temperature is 23.9 °C, and the annual precipitation is 1483 mm, which classifies the study area in a tropical climate zone [45]. The University of Valle Sede Meléndez is the second largest university campus in Colombia in terms of area, surpassed only by the main campus of the National University of Colombia in the city of Bogotá.

2.2. Tree Inventory and University Population

To obtain information on the vegetation present on the Meléndez campus of the Universidad del Valle, the tree inventory of the University Botanical Garden was consulted. The Meléndez campus has a great diversity of plant species and was declared a University Botanical Garden (JBU) in 2010. The tree inventory, developed between 2014 and 2015, shows that much of the campus vegetation is representative of a tropical dry forest ecosystem. All the stems of woody individuals with a diameter at breast height (DBH, 1.3 m from the ground) ≥ 10 cm were marked using aluminum plates with consecutive numbers. These biological data have been published by the Colombian Biodiversity Information System in the Global Biodiversity Information Facility [46] in standard format versions to make the biodiversity data publicly accessible. The classification system of APG III (2009) for angiosperms was followed. A total of 5011 individuals with a DBH ≥ 10 cm were recorded and georeferenced. The species with the highest number of individuals were Mangifera indica and Pithecellobium dulce, with 696 and 546 individuals, respectively. These data are updated by the Miscellaneous Services and Environmental Management unit; the 2019 inventory was used in this study. The university population on the Meléndez campus, headquarters of the Universidad del Valle, is 22,571 people. This information was obtained from the statistical yearbook of 2019; the university population was analyzed in terms of the number of undergraduate and graduate students and employees, teachers, and administrators present on campus.

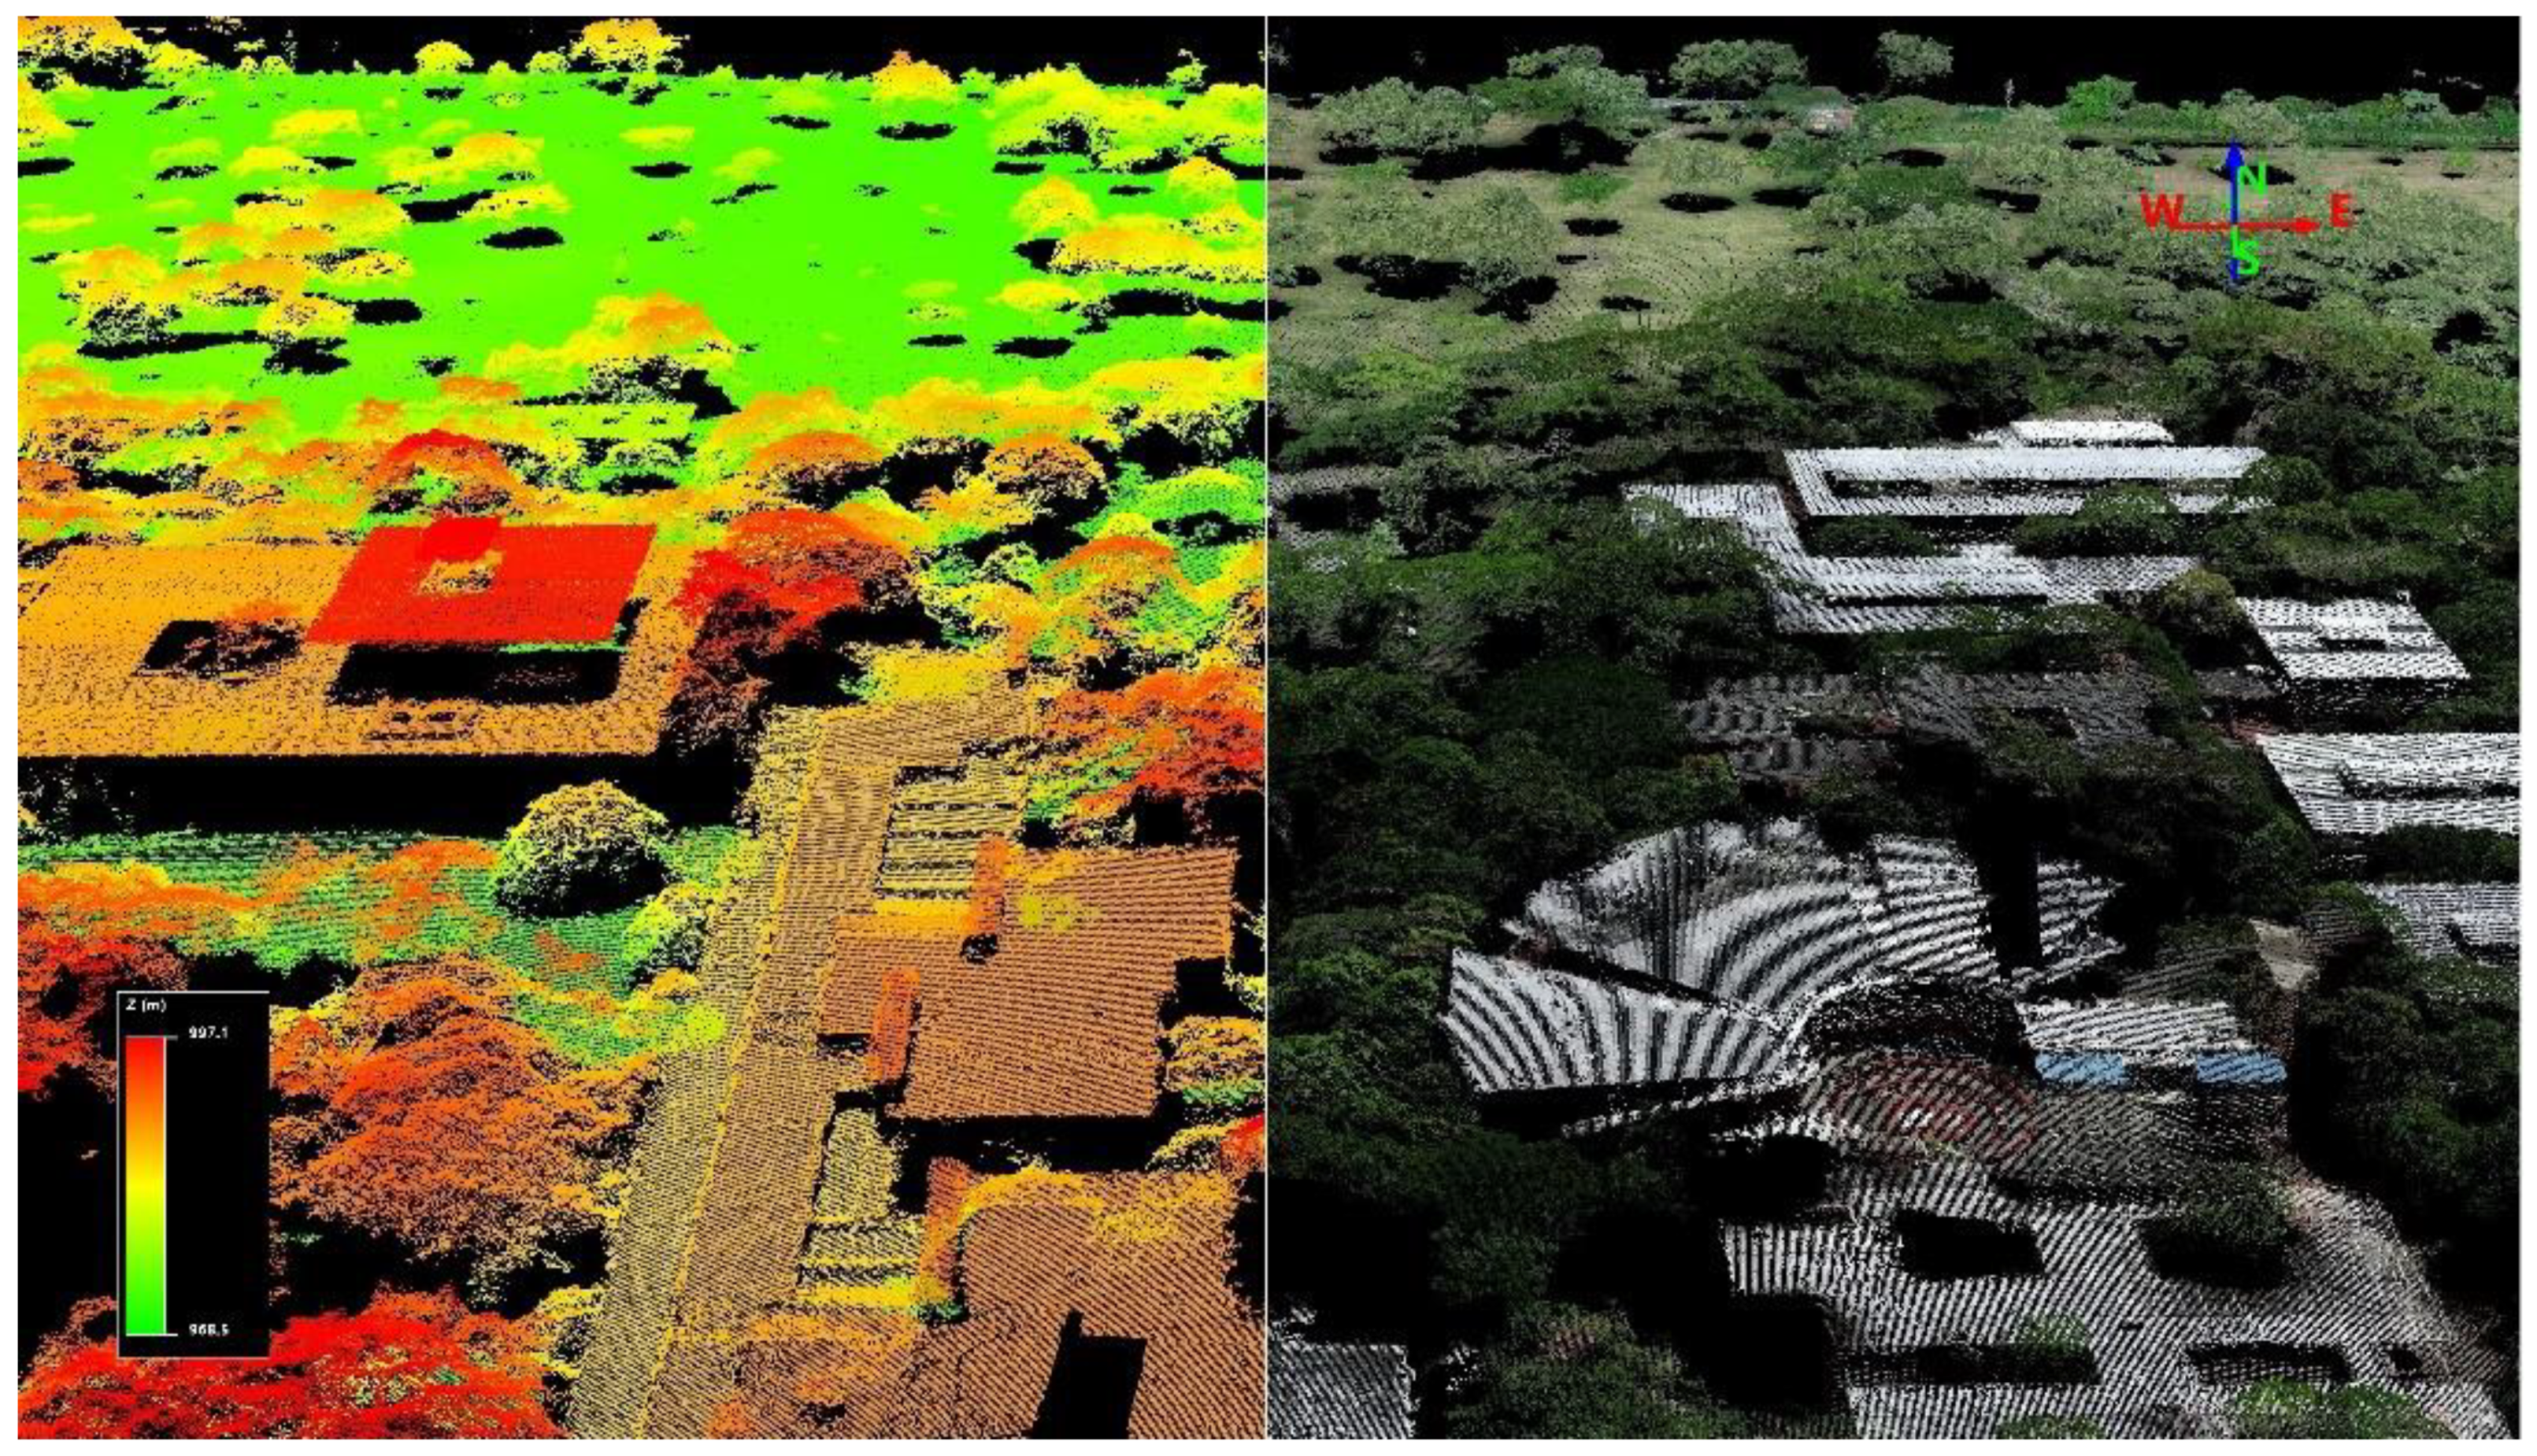
2.3. Acquisition and Processing of Data from Unmanned Aerial Vehicles

Aerial images were captured in March 2021 using a DJI Phantom 4 Pro multicopter and the built-in FC6310s 20 MP camera. The flight missions were designed using Pix4DCapture software (Pix4DInc, Prilly, Switzerland) in a double grid pattern to ensure good reconstruction of the three-dimensional models. The flights in the study area were at an altitude of approximately 100 m above the ground with 80% frontal overlap and 70% lateral overlap and covered an area of approximately 155,000 m2. Data collection was performed between 10:00 and 11:30 a.m. and was only performed when the weather was clear. A total of 763 images were collected for processing. The initial planned resolution of the UAV data was 2.9 cm per pixel. Before flying, 10 ground control points (GCPs) were established for image adjustment and 10 additional points for validation distributed over pavement areas and on the grass in open areas were established using Emlid Reach RS + RTK GPS for precise georeferencing to optimize the adjustment of the images relative to the terrain. The captured images were processed using Pix4D Mapper photogrammetric software (v. 4.5.6, Pix4DInc, Prilly, Switzerland) to create a three-dimensional point cloud (Figure 2), a DSM (a model that represents the elevations of the upper part of the surface, such as vegetation and buildings), a DTM (a model that represents the lowest level of the land surface devoid of vegetation and buildings), and an orthomosaic with a resolution of 3.24 cm per pixel generated from orthorectified images (geometrically corrected images that have a uniform scale and have been adjusted to the shape of the terrain). Reconstruction of the surface from the UAV data was performed by automatically identifying and linking coincident link points in the superimposed images and calibrating the camera with internal and external orientation parameters. Then, the camera parameters of each image were self-calibrated, and a high-resolution scattered cloud of points was derived to estimate the positions of the three-dimensional points [12,47]. After this, the GCPs were manually loaded and identified in all the images, and the photogrammetric adjustment blocks were optimized using the newly oriented and calibrated images. This process allowed the study area to be located with high precision for the subsequent derivation of building and vegetation metrics and estimates of aerial biomass.

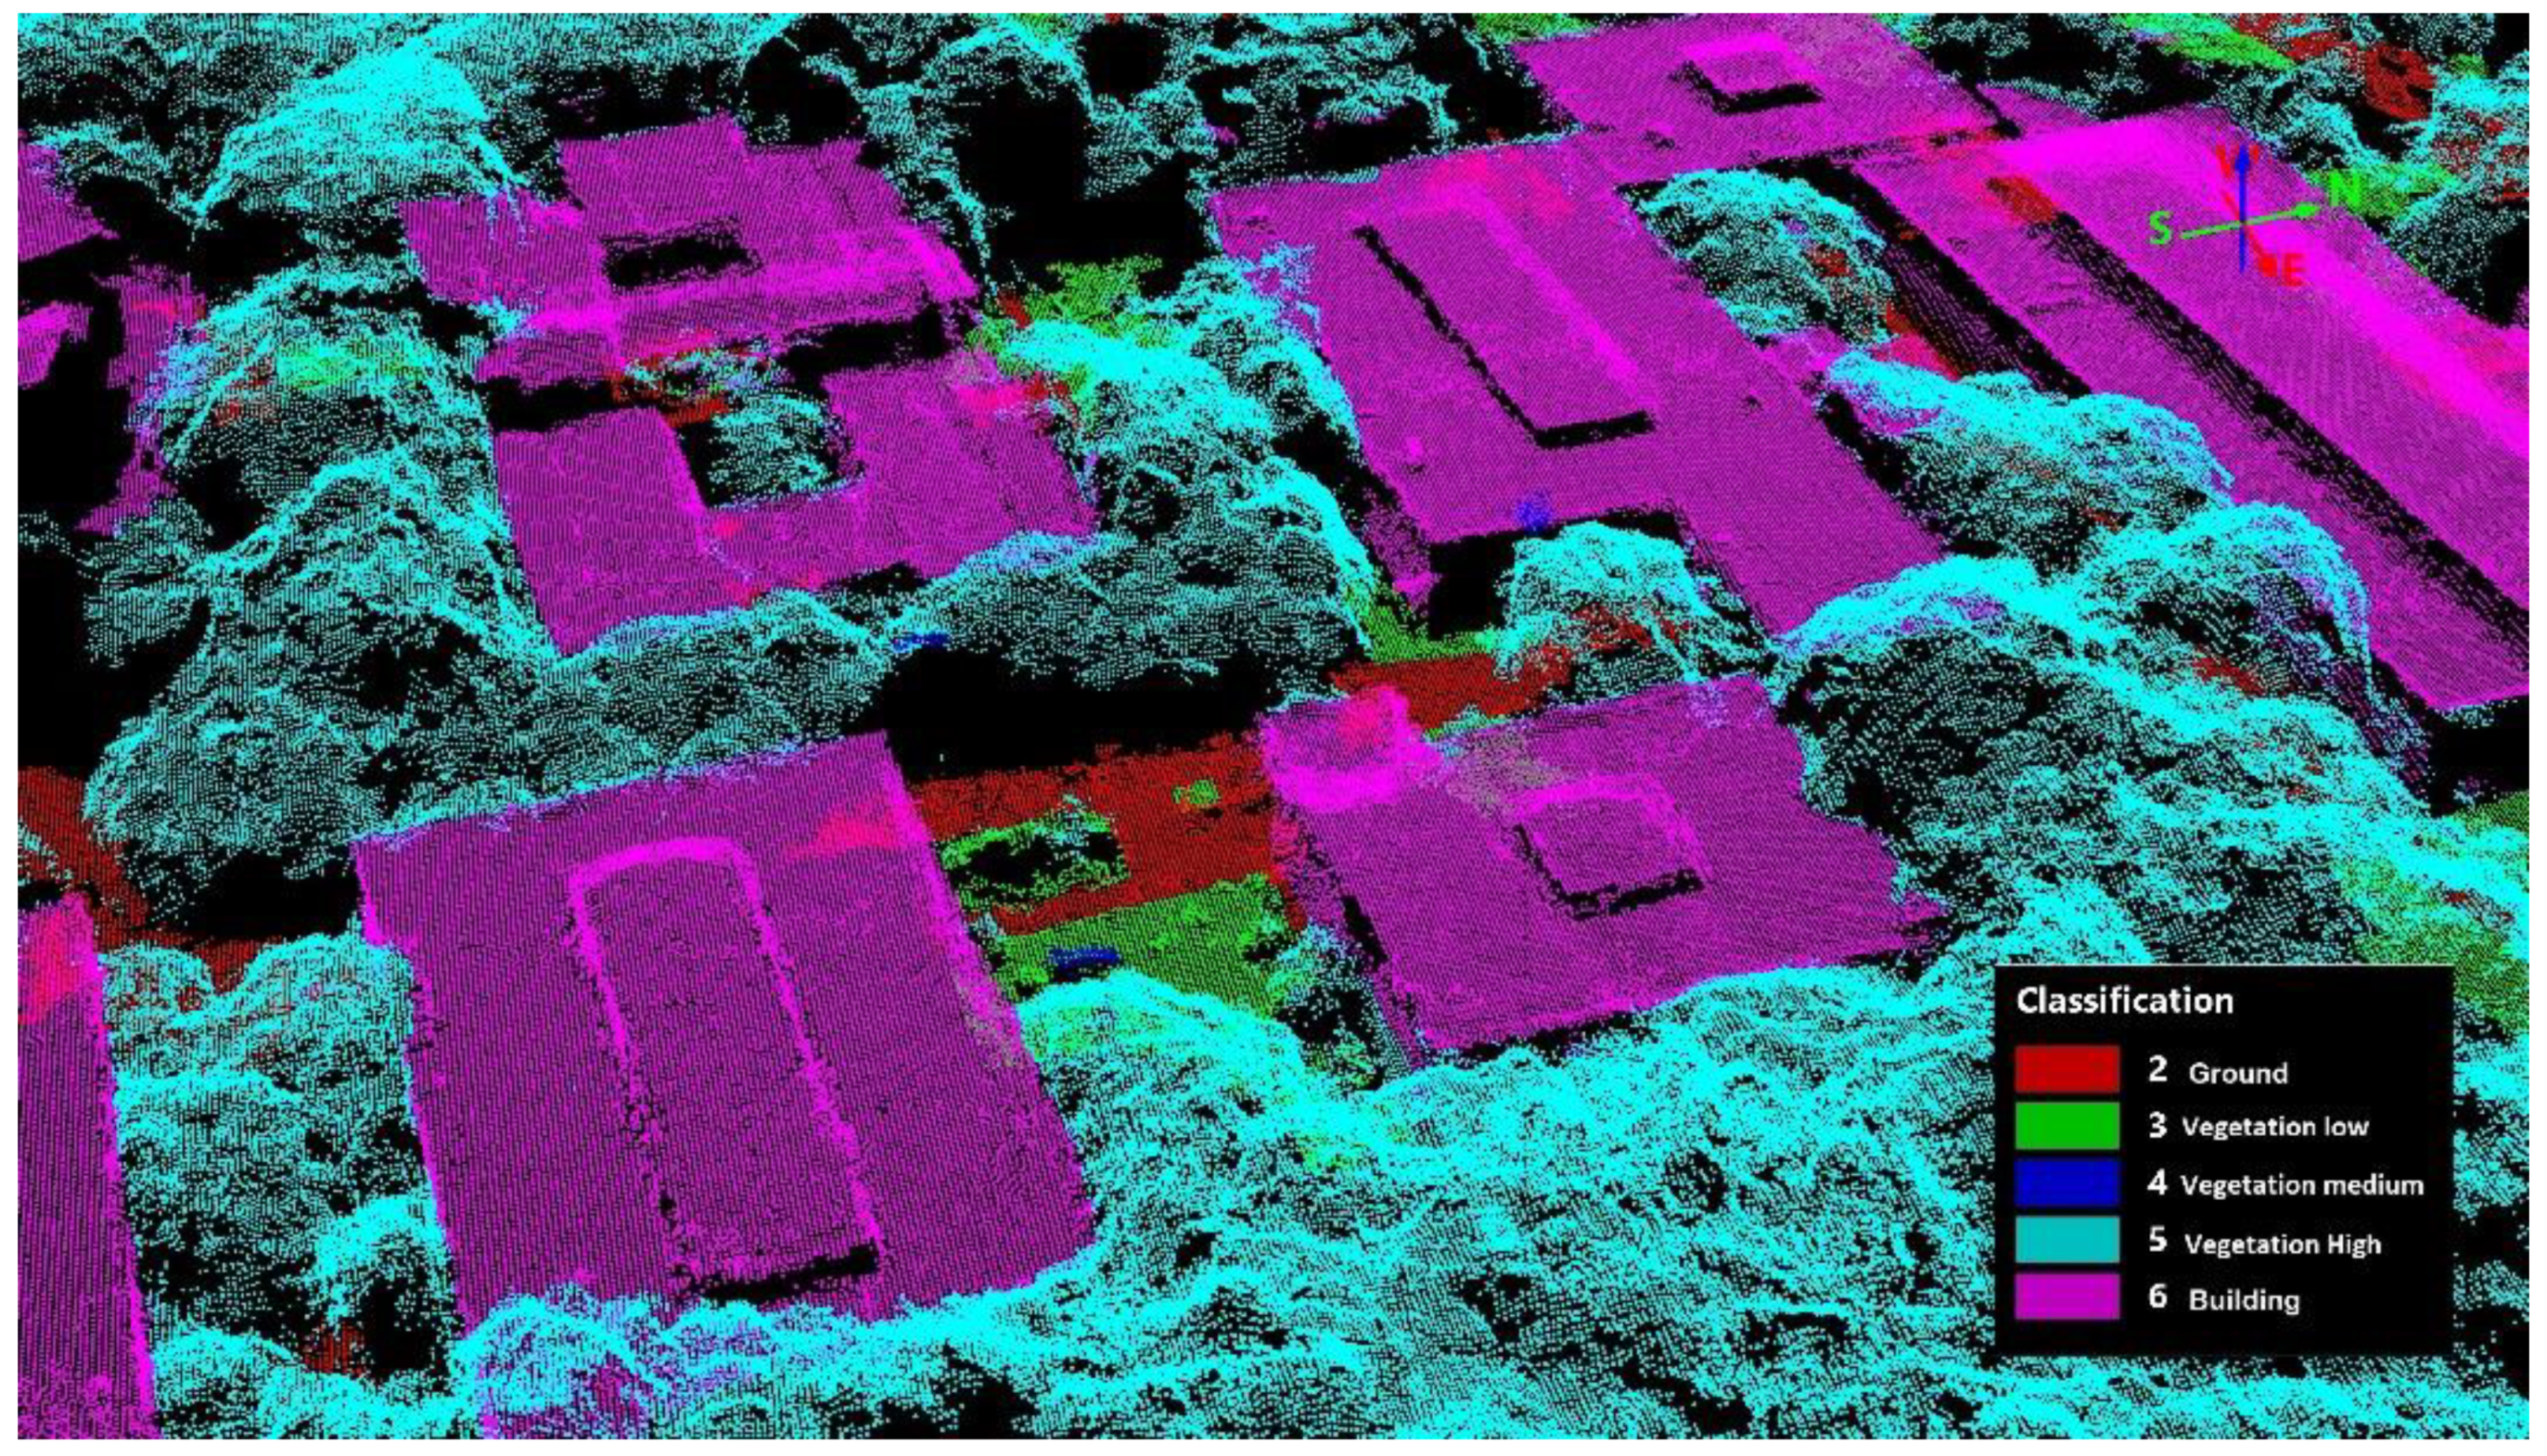
2.4. Classification of the Point Cloud

After derivation of the densified point cloud via the photogrammetric process, we proceeded to generate a classification of all the elements present in the area, and the classification of the point cloud was used to generate the DTM, DSM, and orthomosaic. The software automatically classified each point into one of a series of predefined groups, such as soil, road surface, tall vegetation, buildings, and human-made objects. In Pix4D Mapper software, classification of the point cloud is based on machine learning techniques that require training on previously labeled data. Both the geometry and the color information are used to assign points in the densified point cloud to one of the predefined groups; unlike point cloud classification methods that are based exclusively on geometric characteristics, the incorporation of information from color significantly increases the precision of the detection of semantic classes [47]. The process works well for environments similar to those of the datasets used to train the algorithm, such as soil, tall vegetation, and buildings, but there are areas where the classification does not work well, and manual intervention is needed to edit the generated data classes. After the point cloud classified by the autonomous learning method was generated, it was edited in Global Mapper Geographic Information Systems Software (v 22.1, Blue Marble Geographics, Hallowell, ME, USA) using the LIDAR module. Groups of points can be edited to improve the classification results. The points can be reassigned to previous classes, or new classes can be created based on the exchange format and standard data files of LAS point clouds created by the American Society for Photogrammetry and Remote Sensing (ASPRS). The standard describes classes of high vegetation, medium vegetation, low vegetation, buildings, and terrain. Points that were erroneously assigned by the previous classification were reassigned to the appropriate group by editing the classified point cloud (Figure 3).

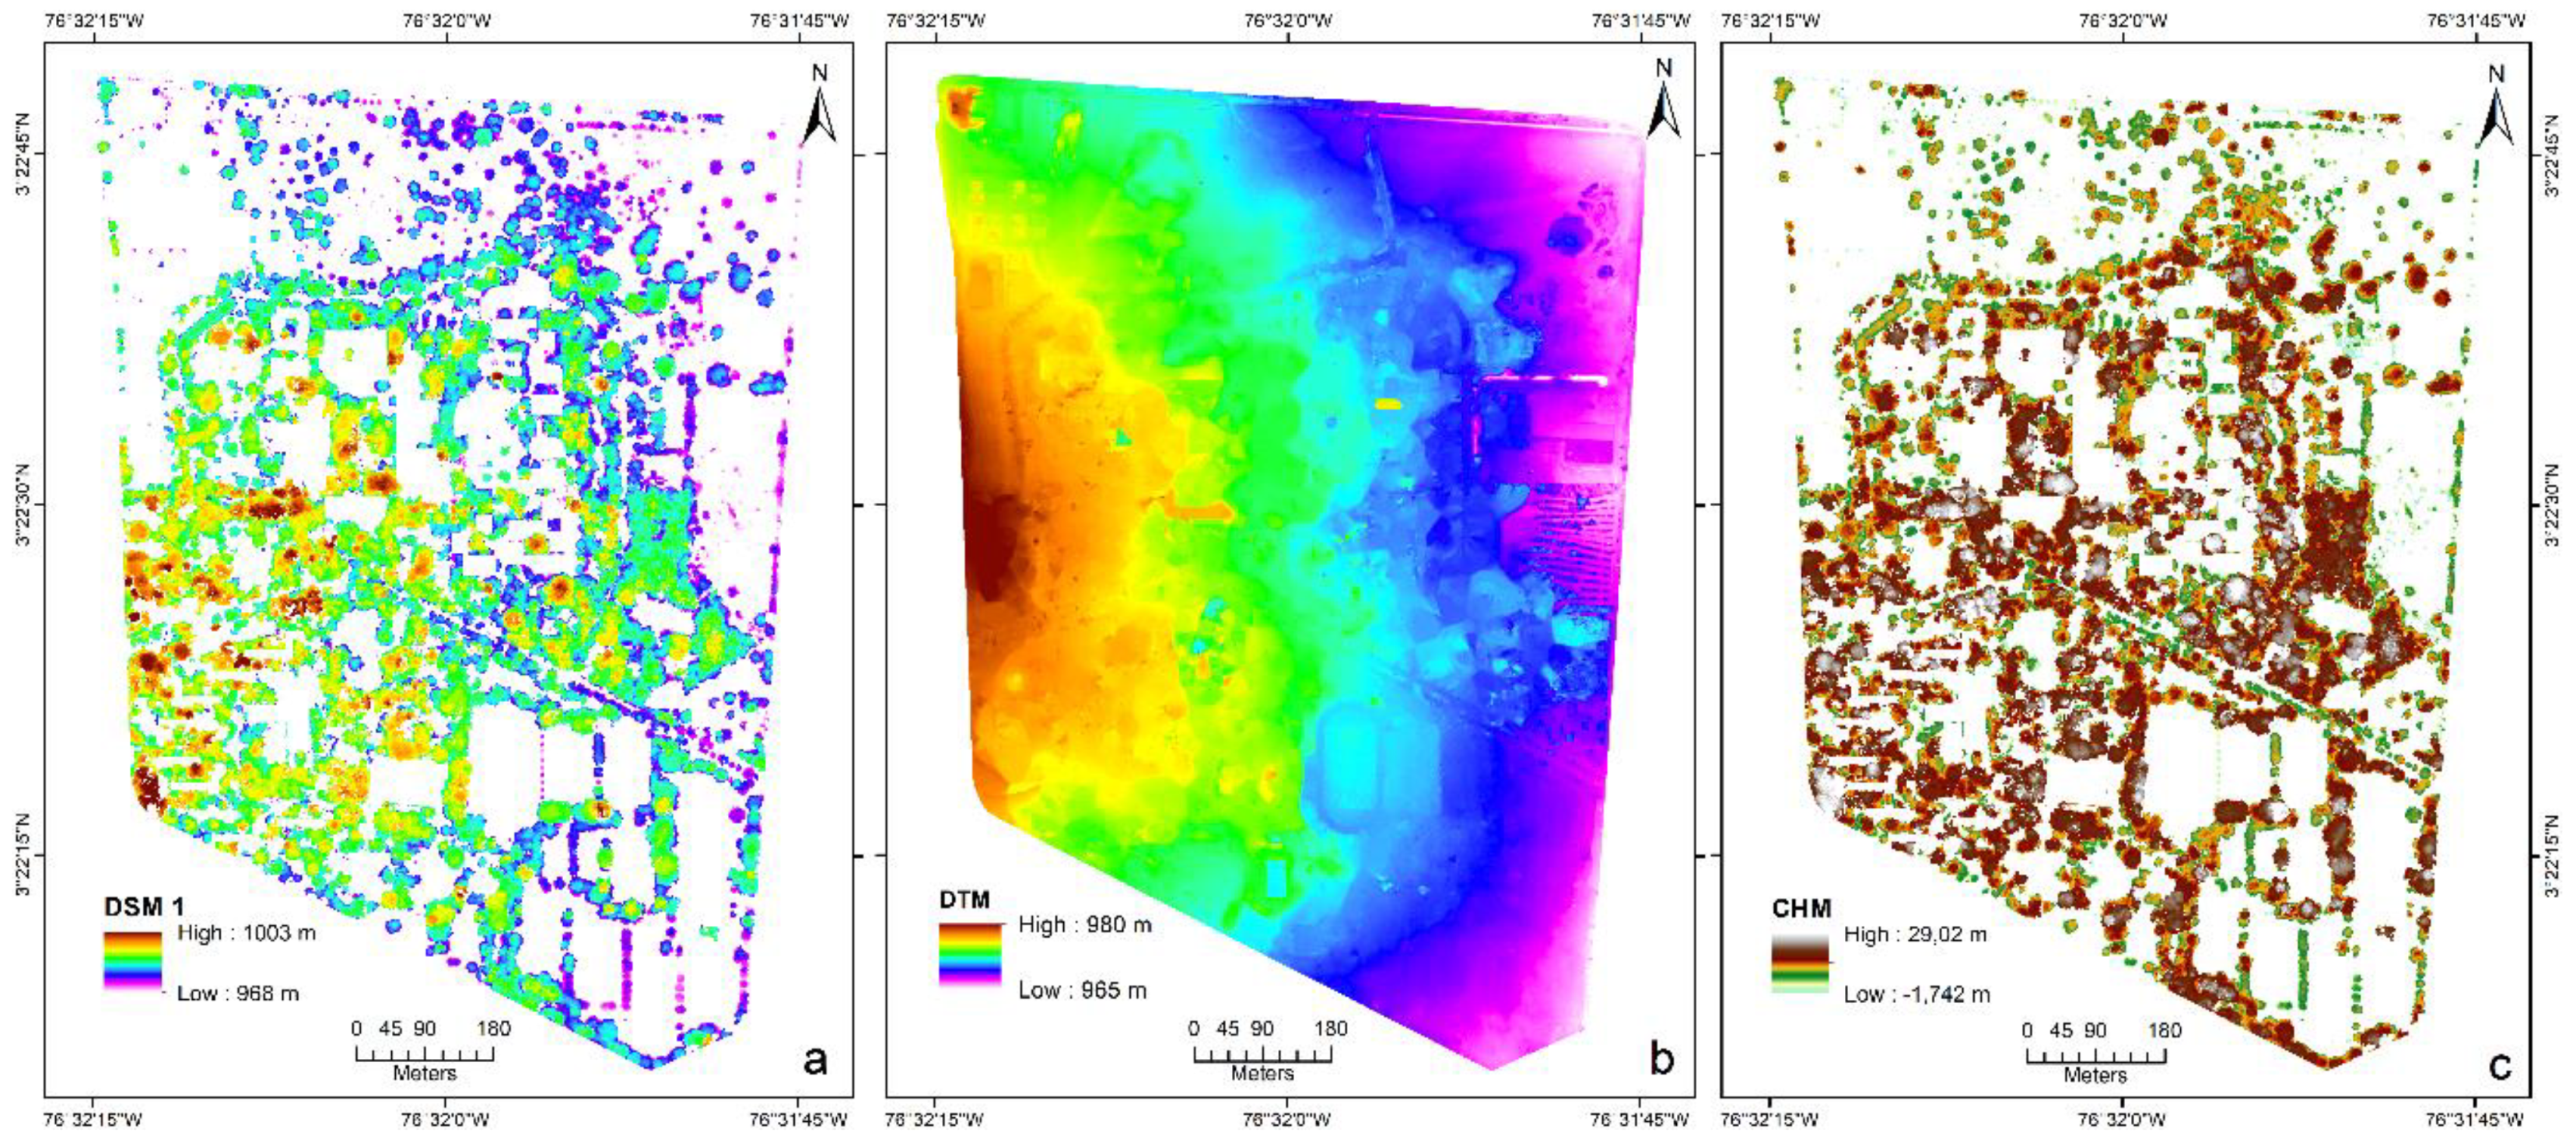
2.5. Reconstruction of the Forest Surface and Parameters

From the classified photogrammetric point cloud, four classes were isolated, and individual surface models were created for each class. The first model represents the high vegetation in the study area (DSM1) (Figure 4a), the second represents the buildings (DSM2), the third represents the low vegetation (DSM3), and, finally, the fourth represents the soil areas (DSM4). Conversion from point format to raster format was performed with a spatial resolution of 1 m. Subsequently, a DTM was created from the edited data of the photogrammetric point cloud. This was achieved by selecting the terrain and low-vegetation classes, and then an inverse distance weighted (IDW) spatial interpolation was performed to fill the areas without information; this surface was created with a 1 m resolution (Figure 4b). The precision of the DTM and DSM was evaluated using the root mean square error (RMSE) between the height of the model and the corresponding height of the GCPs. Finally, a canopy height model (CHM) was developed with an average resolution of 1 m by subtracting the DTM values of DSM1 using the maximum height metric (Figure 4c). The vegetation height models represent the real height of trees after the influence of soil elevation had been removed; the trees were isolated using DSM1, which contained surfaces with high vegetation.
Two maps were made that represent the biological data and forest records of the tree inventory of the University Botanical Garden of the Meléndez campus. For use in the calculation of aerial biomass, the georeferenced records were integrated in a layer of points that represents 5011 individuals corresponding to 185 species, 145 genera, and 51 botanical families. The trees were separated into two categories according to their DBH in cm and wood density in g/cm3, which resulted in two raster files after using the Point to Raster function in ArcGIS (v 10.8, ESRI, USA). The resulting surfaces had 1 m resolution and were called DBH (Figure 5a) and DENSITY (Figure 5b), respectively.

2.6. Aerial Biomass, Carbon, and CO2 Equivalents

There are two methods for measuring and estimating tree biomass on the ground: the direct method and the indirect method [48]. The direct method uses allometric equations, and the indirect method uses biomass expansion factors based on the volume of the main trunk [49]. To estimate the aboveground biomass in a forested area, field measurements are performed, and allometric equations targeting the type of forest (dry, wet, or pluvial) or specific vegetation are applied. The equations relate DBH and the wood density of the sampled individuals at the family, genus, or species level to the total height. To calculate the aboveground biomass, the allometric equation (DBH, p, h) of Chave et al. [50] was used to calculate the aerial biomass, as it is one of the most adjusted equations for dry forest studies and one of the most appropriate for places where precipitation is less than 1500 mm. This equation is also recommended by national regulations in the estimation of aerial biomass in natural forests in Colombia [51], where precipitation is used as a diagnostic variable; for the case study, precipitation is 1483 mm. These models have been used in several studies [25,27,51,52], showing that they are robust for estimating aboveground biomass in tropical forests where the most important parameters are the heights of the trees and the density of the wood, as stated below:
AGB = exp (−2.977 + Ln (ρ × DBH ^2 × h))
where
  • AGB = Aerial biomass, dry matter on the ground.
  • exp = Exponent in base e (power).
  • Ln = Natural logarithm.
  • ρ = Density of the wood (g/cm3).
  • DBH = Diameter at breast height in cm.
  • h = Tree height.
The density of the vegetation, or biomass, is calculated by analyzing the density and frequency for a given area as well as the height of the vegetation above the ground. The estimation of tree height is useful for analyzing growth and approximating wood volume. The biomass density was calculated with the CHM generated from the UAV photogrammetric data using the Raster calculator tool in ArcGIS. This tool builds and executes a simple map algebra expression using a syntax, or set of rules, that must be followed to create a valid expression in an interface similar to a calculator; within this framework, the allometric equation is applied to the set of data. For the indirect determination of the carbon (C) content in the aboveground biomass of tall vegetation, it was estimated that approximately 50% of the plant biomass corresponds to carbon, so the biomass data were multiplied by a factor that includes the carbon content in the dry biomass and the relationship between the weight of a CO2 molecule and the weight of a carbon atom. For this case, the Brown conversion factor [53] was calculated by multiplying one gram of aerial biomass (TB) by the carbon content (C), which is equal to 0.5 g of C, as stated below:
SC = TB × 0.5
where
  • SC = Stored carbon (tons/ha).
  • TB = Total biomass (tons/ha).
To determine the carbon dioxide equivalents (CO2-eq) stored in the forest area of the campus within tall vegetation, the formula proposed by the Intergovernmental Panel on Climate Change (IPCC) [54] was used. The amount of C stored in forests is calculated by multiplying the number of tons of C stored in the forest by a factor of 3.6711, which corresponds to the ratio of the molecular weight of CO2 to C, and is expressed in tons CO2-e. This equivalent is also recommended by national protocols for estimating aboveground biomass in tropical forests [51].

2.7. Setting and Infrastructure Criterion

A geospatial analysis methodology was implemented for one of the five base criteria of the UI GreenMetric World University Ranking. These criteria include Setting and Infrastructure, Energy and Climate Change, Waste, Water, and Transportation. Based on the GreenMetric forms for the first criterion, the seven infrastructure subcriteria that are part of the ranking in the Setting and Infrastructure component were determined, as well as a new carbon estimation criterion proposed for this methodology:
(1)
Total campus area (m2).
(2)
Total campus ground floor area of buildings (m2).
(3)
Ratio of open space area to total area.
(4)
Total area on campus covered in forest vegetation.
(5)
Total area on campus covered in planted vegetation.
(6)
Total area on campus for water absorption other than the forest and planted vegetation.
(7)
Total open space area divided by the total campus population.
(8)
Carbon fixation and CO2 equivalents in the forest vegetation of the campus (tons/ha).
Beyond these indicators, we wanted to obtain an idea of how the university campus is responding to the issue of sustainability by evaluating the degree of green spaces and how these spaces contribute to carbon fixation and CO2 emissions. We added a criterion that, with the data collected in this methodology, would allow estimating the amount of fixed carbon and CO2 equivalents in the forest area of the campus.

2.8. UAV–GreenMetric Methodology Workflow

The ability of the methodology to estimate seven of the environment and infrastructure subcriteria that are part of the UI GreenMetric ranking facilitates the creation of high-precision maps in GIS based on surface models from UAV data. These two tools are integrated into the workflow used in the ranking to analyze data for a specific area in a university campus. Figure 6 shows the flowchart of the methodology used in this research.

3. Results

3.1. GreenMetric Data Obtained

The precision of the data was evaluated using the RMSE between the height and the corresponding height of the GCPs in the DSM. The horizontal error (x, y) was 1.08 cm, and the vertical error (z) was 2.2 cm. For the DTM, the horizontal error (x, y) was 1.37 cm, and the average vertical error (z) was 3.3 cm, compared to the validation GCPs. First, the exact area of the university campus was determined from the orthomosaic with an average pixel resolution of 3.2 cm. This provided the reference surface area that was used for subsequent calculations. The analysis of the area also allowed calculation of the number of trees per hectare on the university campus, which was 51.17 trees/ha. To determine the total area of the ground floors of the buildings, DSM2 data were used, in which the areas of the buildings had been isolated. The same procedure was followed to determine the other criteria. The area covered by forest vegetation was obtained by isolating the tall vegetation in DSM1; the planted vegetation criterion that excludes the forest and focuses on lawns and gardens was obtained from the low vegetation in DSM3; and, finally, the water absorption areas represented by bare soil and pavement were obtained from DSM4. The Raster to Polygon tool of ArcGIS was used to determine the areas corresponding to each criterion after conversion to vector format. The relationship between the open space area and the total area was calculated by subtracting the DSM2 values from the campus area values and then dividing the result by the total (100%) campus area. Finally, the total area of open spaces was calculated using the total area of the campus minus DSM2 divided by the total estimated population. The results for the calculated criteria are shown in Table 3.

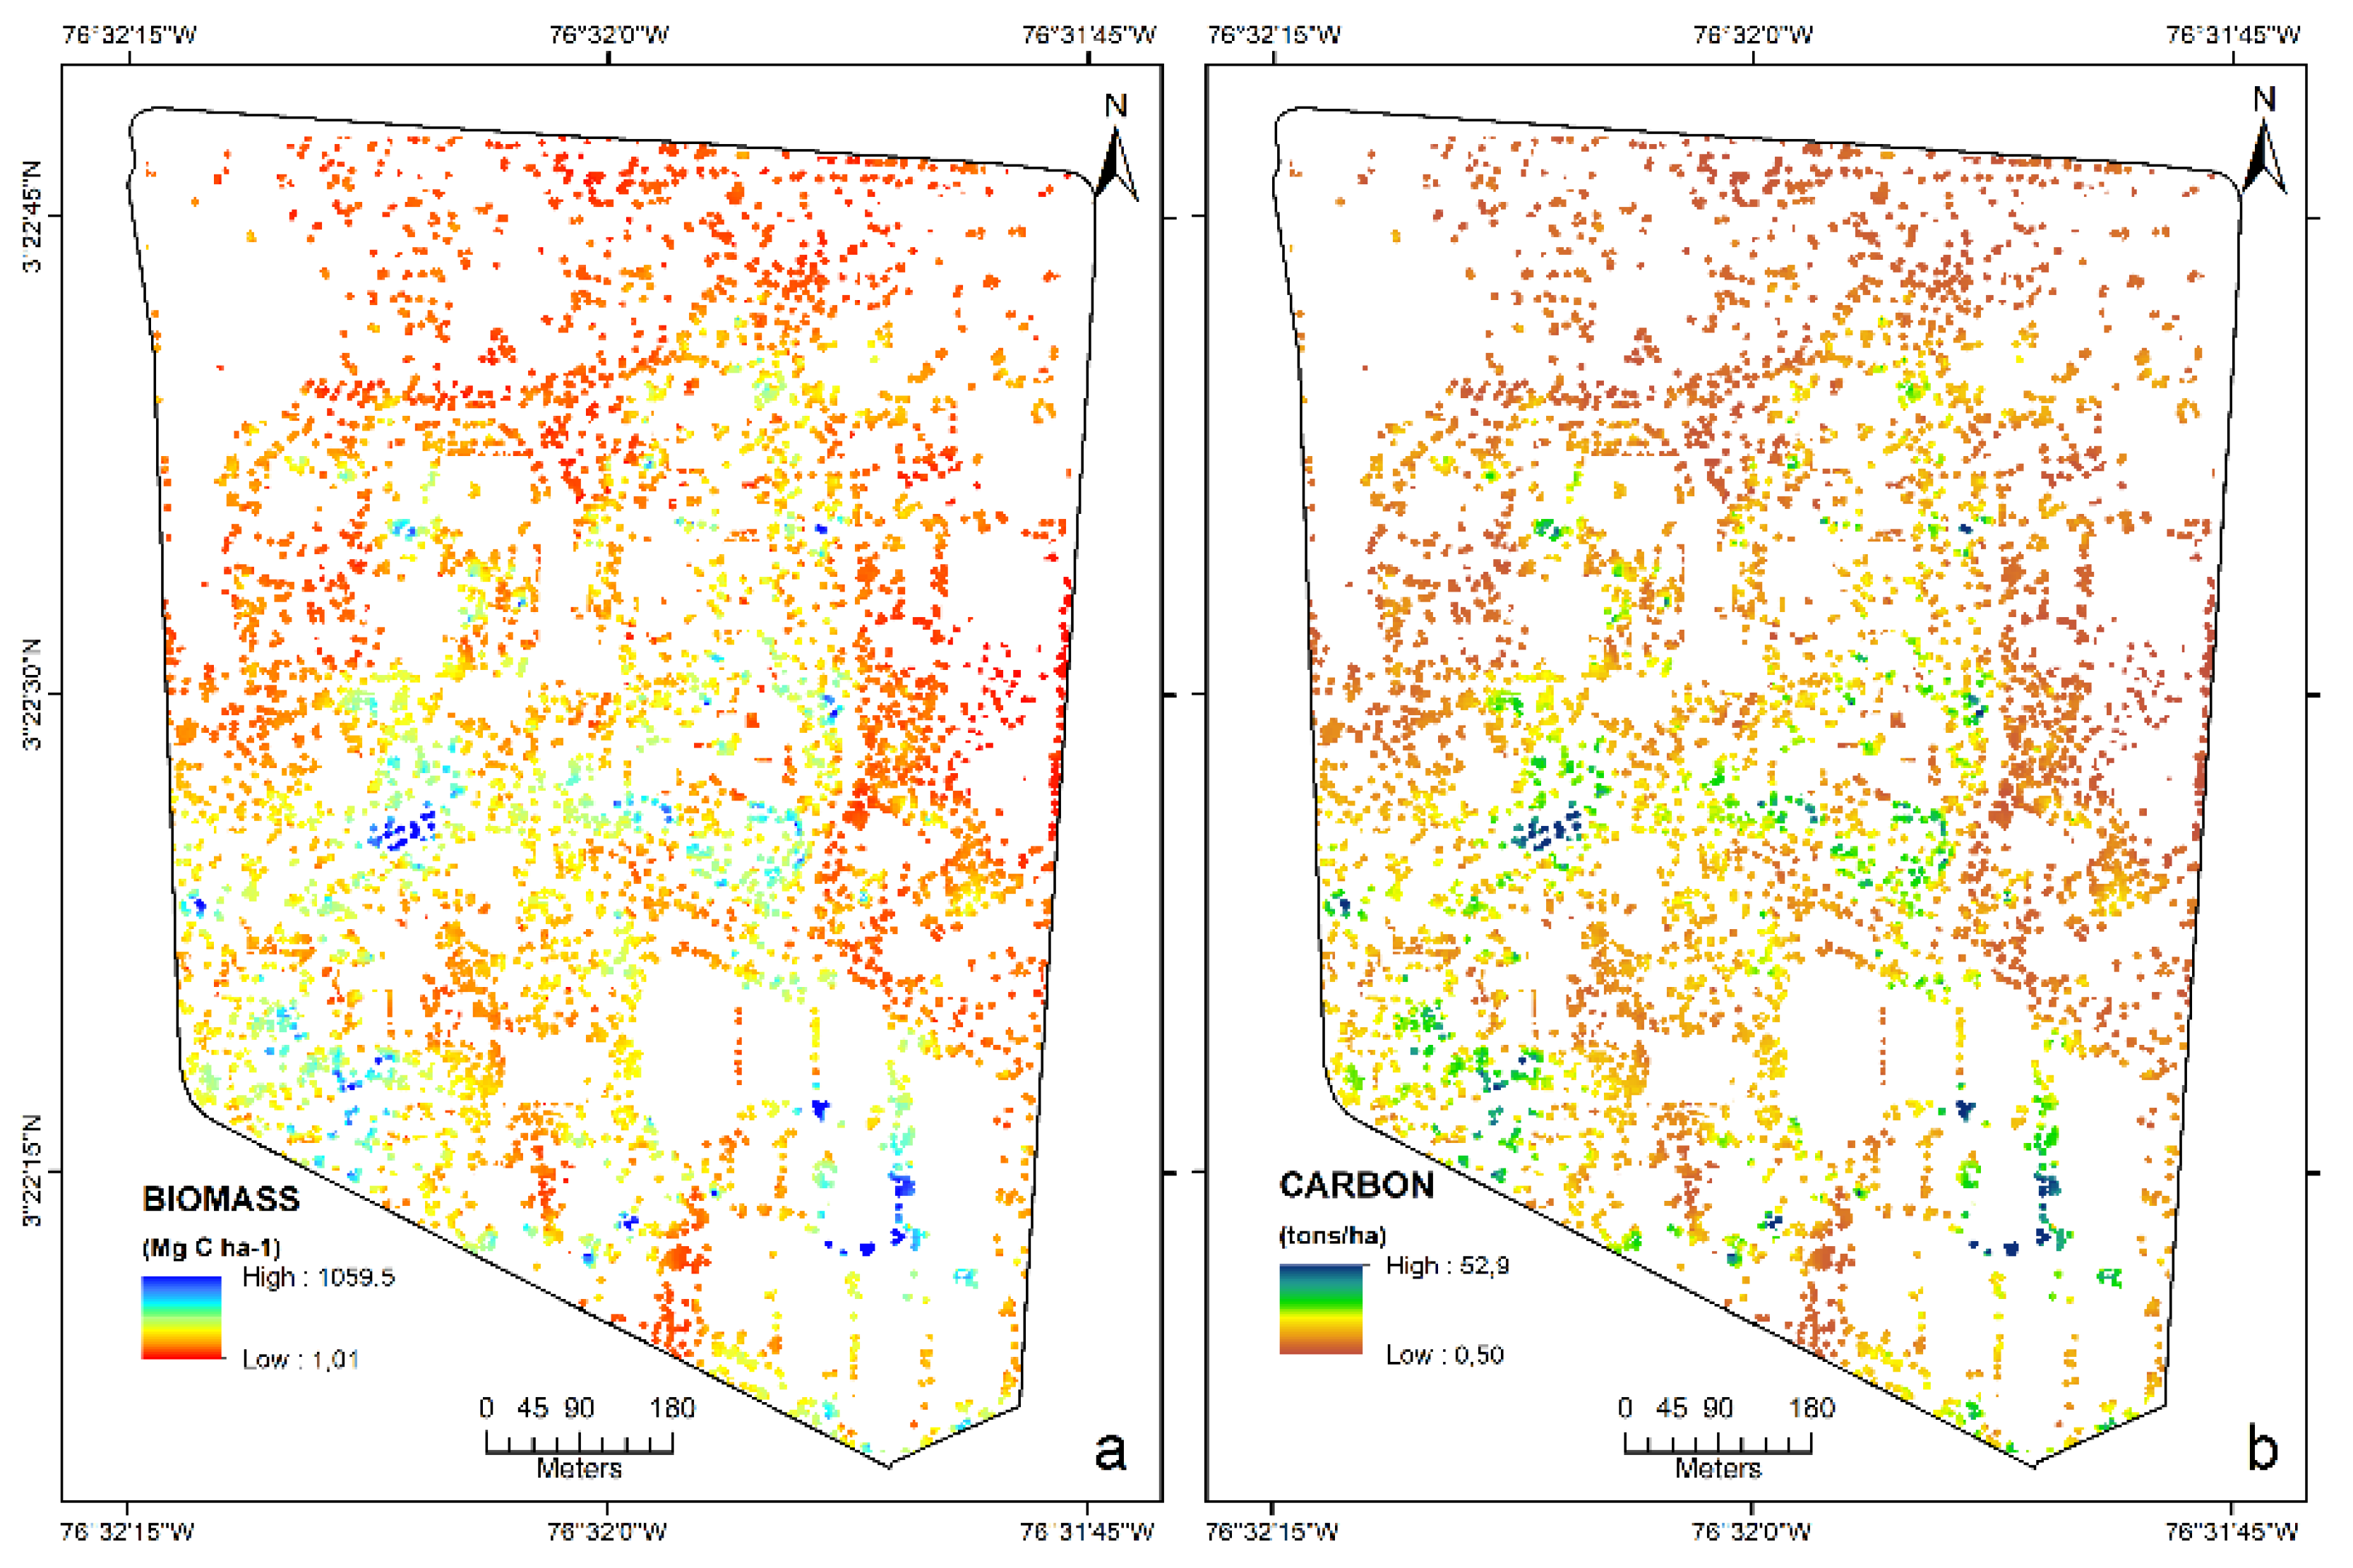
3.2. Estimation of Biomass and Carbon Sequestration

One of the objectives of the methodology was to estimate the potential of carbon sequestration in the high vegetation of the university campus, which requires knowledge of the amount of aerial biomass available. With the information resulting from the CHM within ArcGIS, the allometric equation (DBH, p, h) of Chave et al. [50] was applied. This equation used the elevation calculated from the CHM model to determine the heights of the trees in conjunction with the data for the DENSITY and DBH maps. The result of the equation is a raster with values expressed in carbon content (Mg C ha−1), called BIOMASS (Figure 7a). After the determination of the aboveground biomass, the carbon content was calculated using the Brown conversion factor in a raster called CARBON (Figure 7b) with values expressed in carbon content (tons/ha).
Statistical parameters were calculated from the resulting raster data using the Zonal Statistics as Table function from ArcGIS on the campus boundary. After completing all the calculations and extracting specific areas, there were two datasets, one representing the biomass of high vegetation in the study area, and the other representing the carbon content in this biomass; the amount of CO2 equivalents was calculated by applying the IPCC factor of 3.6711 to the carbon content (Table 4).

4. Discussion

In recent years, there has been a growing emphasis on the use of UAV data to estimate various three-dimensional characteristics of the canopy structure and infrastructure. In this study, the efficiency of this type of data and the good precision and effectiveness when using GCPs were confirmed, in agreement with other authors [29,30,31]. The DSM and DTM used for modeling in this work were developed with an average precision of 1.22 cm in the horizontal axes (x, y) and 2.75 cm in the vertical axis (z). The individual DSM data effectively estimated the areas required for the Setting and Infrastructure subcriteria. The 3.2 cm orthomosaic allowed the campus area to be calculated in more detail than previously calculated areas from urban plans, with a difference of 11,942 m2.
The total campus area with built surfaces was 17.81%, a low percentage compared to the area covered with vegetation, which represents 82.25% of the total campus surfaces, showing that green areas predominate. The latter percentage further agrees with the high total open space ratio, which is 97.81%. The spatial distribution of the campus population in relation to the open space was 39.14 m²/person, which indicates that the open space and green surfaces available to people on campus are more than adequate, taking into account that the World Health Organization proposes an ideal ratio of 9 m²/person [55]. The Ministry of the Environment of Colombia proposes a ratio of 7.50 m²/person, and in the city of Cali, the ratio is 5.93 m²/person [53]. In this case, the biomass potential was estimated by using an allometric equation to subsequently calculate the C content and how much CO2 is fixed by biomass. It was found that the national models using the formula of Chave et al. [50] for potential carbon stocks in natural forests are very close to reality; the average value for dry forest was 48.1 tons/ha [51], which was corroborated in this work, where the carbon content of the campus was 43.56 tons/ha, with a difference of only 10% from 4.54 tons/ha. An important factor for the selection of the allometric equation was that Chave adjusts his methods based on rainfall, and by considering places where plants suffer water stress, as in the case of the study area, the results are very close to reality.
The great environmental benefits of a green campus were verified after comparing the estimated CO2 equivalents, yielding an average value of 160 tons CO2-e; this value was higher than the average for dry forest at a national level, with 129.8 tons CO2-e [51], showing that the fixation of the forest area of the campus was higher by 30 tons CO2-e. The entire area of the campus has a value of approximately 8384 tons CO2-e. If we compare the greenhouse gas emissions of the Universidad del Valle with a study from 2011 that estimated emissions equivalent to 5095 tons CO2-e [56], the campus assimilates the CO2 emissions it produces and generates a surplus of 3289 tons CO2-e, which contributes to the sustainability of the city.

5. Conclusions

This study verified the good performance of the UAV–GreenMetric methodology, which allowed us to accurately derive different measurements from a three-dimensional point cloud to model the infrastructure criteria of the UI GreenMetric ranking to estimate the aboveground biomass, carbon potential, and CO2 equivalents present on a university campus at a detailed scale. The use of photogrammetric data taken from a UAV in conjunction with metrics derived from GIS analysis facilitated estimation from a highly detailed and low-cost three-dimensional model. It should be taken into account that the topographic accuracy of surface models is a function of the GCPs, which must be measured with high-precision GPS to obtain the best results in terms of spatial accuracy and subsequent location derivation. Our methodological approach can be successfully extended to other university campuses in the world by obtaining photogrammetric information with a conventional UAV that can be easily acquired at low cost by any university institution. It is important to highlight that this work was implemented with forest data from 2019, periods prior to COVID-19, the photogrammetric data were captured exceptionally during the pandemic after 4 months of isolation, which allowed us to see the campus without its usual population and with many places without alteration, something that rarely occurs. In a post-COVID-19 scenario, it must be considered that the vegetation and infrastructure present variations due to the dynamics of the campus itself.
This methodology covers the main criteria of the UI GreenMetric ranking, contributing to improving the collection of verifiable data from environmental and infrastructure measurements and expanding the understanding of how a university campus compensates for its carbon footprint; the method can be implemented if the aboveground biomass, carbon, and CO2 stored in campus green spaces are analyzed as long as the forest information for the campus is available. This methodology can also be easily integrated with the smart campus trend, where sustainability processes such as the inventory of assets, the phytosanitary state of vegetation, and the physical planning of the campus can be integrated into a GIS to support decision-making within the university campus. It should be clarified that the 2019 forestry data and the 2021 photogrammetric flight yielded an estimate of campus emissions that were compared to the most complete calculation available, which was performed in 2011: the university was working on an updated 2020 estimate but due to the isolation period, it could not be concluded.

Author Contributions

Conceptualization, J.E.F. and C.E.G.; methodology, J.E.F.; software, J.E.F.; validation, J.E.F. and C.E.G.; formal analysis, J.E.F. and C.E.G.; investigation, J.E.F. and R.A.O.; resources, J.E.F. and R.A.O.; data curation, R.A.O.; writing—original draft preparation, J.E.F. and R.A.O.; writing—review and editing, J.E.F. and R.A.O.; visualization, J.E.F.; supervision, J.E.F. and C.E.G.; project administration, J.E.F.; funding acquisition, J.E.F. and R.A.O. All authors have read and agreed to the published version of the manuscript.

Funding

This work was supported in part by the Vicerrectoría de Investigaciones de la Universidad del Valle under grant CI 4406—“Convocatoria Interna 124-2020” associated with the project “Análisis multitemporal de la vulnerabilidad por erosión costera en la Unidad Ambiental Costera Malaga Buenaventura”.

Acknowledgments

In this work, information provided by the Tree Inventory of the University Botanical Garden of the University of Valle was used.

Conflicts of Interest

The authors declare no conflict of interest.

References

  1. Khraim, H.S.; Al-Afaishat, T.M. The Effect of Green Marketing on Students’ Selection of Private Universities in Jordan. Multicult. Educ. 2021, 7. [Google Scholar] [CrossRef]
  2. Fissi, S.; Romolini, A.; Gori, E.; Contri, M. The path toward a sustainable green university: The case of the University of Florence. J. Clean. Prod. 2021, 279, 123655. [Google Scholar] [CrossRef]
  3. Marques, C.; BACHEGA, S.J.; Tavares, D.M. Framework proposal for the environmental impact assessment of universities in the context of Green IT. J. Clean. Prod. 2019, 241, 118346. [Google Scholar] [CrossRef]
  4. Grindsted, T. Sustainable universities–from declarations on sustainability in higher education to national law. Environ. Econ. 2011, 2, 29–36. [Google Scholar] [CrossRef] [Green Version]
  5. Suwartha, N.; Sari, R.F. Evaluating UI GreenMetric as a tool to support green universities development: Assessment of the year 2011 ranking. J. Clean. Prod. 2013, 61, 46–53. [Google Scholar] [CrossRef]
  6. Khaple, A.K.; Devagiri, G.M.; Veerabhadraswamy, N.; Babu, S.; Mishra, S.B. Chapter 6—Vegetation biomass and carbon stock assessment using geospatial approach. In Forest Resources Resilience and Conflicts; Kumar Shit, P., Pourghasemi, H.R., Adhikary, P.P., Bhunia, G.S., Sati, V.P., Eds.; Elsevier: Amsterdam, The Netherlands, 2021; pp. 77–91. [Google Scholar] [CrossRef]
  7. Asner, G.P. Tropical forest carbon assessment: Integrating satellite and airborne mapping approaches. Environ. Res. Lett. 2009, 4, 034009. [Google Scholar] [CrossRef]
  8. Asner, G.P.; Mascaro, J. Mapping tropical forest carbon: Calibrating plot estimates to a simple LiDAR metric. Remote Sens. Environ. 2014, 140, 614–624. [Google Scholar] [CrossRef]
  9. Tian, Y.; Huang, H.; Zhou, G.; Zhang, Q.; Tao, J.; Zhang, Y.; Lin, J. Aboveground mangrove biomass estimation in Beibu Gulf using machine learning and UAV remote sensing. Sci. Total Environ. 2021, 781, 146816. [Google Scholar] [CrossRef]
  10. Mao, P.; Qin, L.; Hao, M.; Zhao, W.; Luo, J.; Qiu, X.; Xu, L.; Xiong, Y.; Ran, Y.; Yan, C.; et al. An improved approach to estimate above-ground volume and biomass of desert shrub communities based on UAV RGB images. Ecol. Indic. 2021, 125, 107494. [Google Scholar] [CrossRef]
  11. Abdullah, M.M.; Al-Ali, Z.M.; Abdullah, M.T.; Srinivasan, S.; Assi, A.T.; Al Atiqi, S. Investigating the applicability of UAVs in characterizing desert shrub biomass and developing biological indicators for the selection of suitable revegetation sites. J. Environ. Manag. 2021, 288, 112416. [Google Scholar] [CrossRef]
  12. Fonstad, M.A.; Dietrich, J.T.; Courville, B.C.; Jensen, J.L.; Carbonneau, P.E. Topographic structure from motion: A new development in photogrammetric measurement. Earth Surf. Process. Landf. 2012, 38, 421–430. [Google Scholar] [CrossRef] [Green Version]
  13. Abdullah, M.M.; Al-Ali, Z.M.; Srinivasan, S. The use of UAV-based remote sensing to estimate biomass and carbon stock for native desert shrubs. MethodsX 2021, 8, 101399. [Google Scholar] [CrossRef] [PubMed]
  14. Sankey, T.T.; Leonard, J.; Moore, M.M.; Sankey, J.B.; Belmonte, A. Carbon and ecohydrological priorities in managing woody encroachment: An UAV perspective 63 years after a control treatment. Environ. Res. Lett. 2021, 16, 37. [Google Scholar] [CrossRef]
  15. Chianucci, F.; Marchino, L.; Bidini, C.; Giorcelli, A.; Coaloa, D.; Chiarabaglio, P.; Giannetti, F.; Chirici, G.; Tattoni, C. Dataset of tree inventory and canopy structure in poplar plantations in Northern Italy. Ann. Silvicul. Res. 2021, 46, 4. [Google Scholar]
  16. Song, Y.; Wang, J.; Shan, B. Estimation of Winter Wheat Yield from UAV-Based Multi-Temporal Imagery Using Crop Allometric Relationship and SAFY Model. Drones 2021, 5, 78. [Google Scholar] [CrossRef]
  17. Fakhri, S.A.; Latifi, H. A Consumer Grade UAV-Based Framework to Estimate Structural Attributes of Coppice and High Oak Forest Stands in Semi-Arid Regions. Remote Sens. 2021, 13, 4367. [Google Scholar] [CrossRef]
  18. Matese, A.; Berton, A.; Chiarello, V.; Dainelli, R.; Nati, C.; Pastonchi, L.; Toscano, P.; Di Gennaro, S.F. Determination of Riparian Vegetation Biomass from an Unmanned Aerial Vehicle (UAV). Forests 2021, 12, 1566. [Google Scholar] [CrossRef]
  19. Hernández-Cole, J.; Ortiz-Malavassi, E.; Moya, R.; Murillo, O. Evaluation of Unmanned Aerial Vehicles (UAV) as a Tool to Predict Biomass and Carbon of Tectona grandis in Silvopastoral Systems (SPS) in Costa Rica. Drones 2021, 5, 47. [Google Scholar] [CrossRef]
  20. Guascal, E.; Rojas, S.; Kirby, E.; Toulkeridis, T.; Fuertes, W.; Heredia, M. Application of Remote Sensing Techniques in the Estimation of Forest Biomass of a Recreation Area by UAV and RADAR Images in Ecuador. In Proceedings of the 2020 Seventh International Conference on eDemocracy & eGovernment (ICEDEG), Buenos Aires, Argentina, 22–24 April 2020; pp. 183–190. [Google Scholar] [CrossRef]
  21. Fuentes, J. Comparación de Modelos de Altura de la Vegetación para Estimación de Biomasa en un Bosque de Manglar en el Caribe Colombiano; Entorno Geográfico; Universidad del Valle: Cali, Colombia, 2020; pp. 1–18. [Google Scholar]
  22. Navarro, A.; Young, M.; Allan, B.; Carnell, P.; Macreadie, P.; Ierodiaconou, D. The application of Unmanned Aerial Vehicles (UAVs) to estimate above-ground biomass of mangrove ecosystems. Remote Sens. Environ. 2020, 242, 111747. [Google Scholar] [CrossRef]
  23. Jones, A.R.; Raja Segaran, R.; Clarke, K.D.; Waycott, M.; Goh, W.S.H.; Gillanders, B.M. Estimating Mangrove Tree Biomass and Carbon Content: A Comparison of Forest Inventory Techniques and Drone Imagery. Front. Mar. Sci. 2020, 6, 784. [Google Scholar] [CrossRef] [Green Version]
  24. Fernandes, M.R.; Aguiar, F.C.; Martins, M.J.; Rico, N.; Ferreira, M.T.; Correia, A.C. Carbon Stock Estimations in a Mediterranean Riparian Forest: A Case Study Combining Field Data and UAV Imagery. Forests 2020, 11, 376. [Google Scholar] [CrossRef] [Green Version]
  25. González-Jaramillo, V.; Fries, A.; Bendix, J. AGB Estimation in a Tropical Mountain Forest (TMF) by Means of RGB and Multispectral Images Using an Unmanned Aerial Vehicle (UAV). Remote Sens. 2019, 11, 1413. [Google Scholar] [CrossRef] [Green Version]
  26. Ye, N.; van Leeuwen, L.; Nyktas, P. Analysing the potential of UAV point cloud as input in quantitative structure modelling for assessment of woody biomass of single trees. Int. J. Appl. Earth Obs. Geoinf. 2019, 81, 47–57. [Google Scholar] [CrossRef]
  27. Panday, U.S.; Shrestha, N.; Maharjan, S. Estimation of above Ground Forest Biomass Using Ultra High Resolution Uav Images: A Case Study from Barandabhar Forest, Nepal. ISPRS-Int. Arch. Photogramm. Remote. Sens. Spat. Inf. Sci. 2019, XLII-5/W3, 77–83. [Google Scholar] [CrossRef] [Green Version]
  28. Lin, J.; Wang, M.; Ma, M.; Lin, Y. Aboveground Tree Biomass Estimation of Sparse Subalpine Coniferous Forest with UAV Oblique Photography. Remote Sens. 2018, 10, 1849. [Google Scholar] [CrossRef] [Green Version]
  29. Puniach, E.; Gruszczyński, W.; Ćwiąkała, P.; Matwij, W. Application of UAV-based orthomosaics for determination of horizontal displacement caused by underground mining. ISPRS J. Photogramm. Remote Sens. 2021, 174, 282–303. [Google Scholar] [CrossRef]
  30. Biçici, S.; Zeybek, M. An approach for the automated extraction of road surface distress from a UAV-derived point cloud. Autom. Constr. 2021, 122, 103475. [Google Scholar] [CrossRef]
  31. Elkhrachy, I. Accuracy Assessment of Low-Cost Unmanned Aerial Vehicle (UAV) Photogrammetry. Alex. Eng. J. 2021, 60, 5579–5590. [Google Scholar] [CrossRef]
  32. Valkaniotis, S.; Papathanassiou, G.; Ganas, A. Mapping an earthquake-induced landslide based on UAV imagery; case study of the 2015 Okeanos landslide, Lefkada, Greece. Eng. Geol. 2018, 245, 141–152. [Google Scholar] [CrossRef]
  33. Sărășan, A.; Ardelean, A.-C.; Bălărie, A.; Wehrheim, R.; Tabaldiev, K.; Akmatov, K. Mapping burial mounds based on UAV-derived data in the Suusamyr Plateau, Kyrgyzstan. J. Archaeol. Sci. 2020, 123, 105251. [Google Scholar] [CrossRef]
  34. Jeong, G.Y.; Nguyen, T.N.; Tran, D.K.; Hoang, T.B.H. Applying unmanned aerial vehicle photogrammetry for measuring dimension of structural elements in traditional timber building. Measurement 2020, 153, 107386. [Google Scholar] [CrossRef]
  35. Fuentes, J.E.; Moya, F.D.; Montoya, O.D. Method for Estimating Solar Energy Potential Based on Photogrammetry from Unmanned Aerial Vehicles. Electronics 2020, 9, 2144. [Google Scholar] [CrossRef]
  36. Park, J.; Kim, P.; Cho, Y.K.; Kang, J. Framework for automated registration of UAV and UGV point clouds using local features in images. Autom. Constr. 2018, 98, 175–182. [Google Scholar] [CrossRef]
  37. Lee, G.; Choi, M.; Yu, W.; Jung, K. Creation of river terrain data using region growing method based on point cloud data from UAV photography. Quat. Int. 2019, 519, 255–262. [Google Scholar] [CrossRef]
  38. Liu, W.; Yang, M.; Xie, M.; Guo, Z.; Li, E.; Zhang, L.; Pei, T.; Wang, D. Accurate Building Extraction from Fused DSM and UAV Images Using a Chain Fully Convolutional Neural Network. Remote Sens. 2019, 11, 2912. [Google Scholar] [CrossRef] [Green Version]
  39. Al-Najjar, H.A.H.; Kalantar, B.; Pradhan, B.; Saeidi, V.; Halin, A.A.; Ueda, N.; Mansor, S. Land Cover Classification from fused DSM and UAV Images Using Convolutional Neural Networks. Remote Sens. 2019, 11, 1461. [Google Scholar] [CrossRef] [Green Version]
  40. Mavroulis, S.; Andreadakis, E.; Spyrou, N.-I.; Antoniou, V.; Skourtsos, E.; Papadimitriou, P.; Kasssaras, I.; Kaviris, G.; Tselentis, G.A.; Voulgaris, N.; et al. UAV and GIS based rapid earthquake-induced building damage assessment and methodology for EMS-98 isoseismal map drawing: The June 12, 2017 Mw 6.3 Lesvos (Northeastern Aegean, Greece) earthquake. Int. J. Disaster Risk Reduct. 2019, 37, 101169. [Google Scholar] [CrossRef]
  41. Nikolakopoulos, K.G.; Soura, K.; Koukouvelas, I.K.; Argyropoulos, N.G. UAV vs classical aerial photogrammetry for archaeological studies. J. Archaeol. Sci. Rep. 2016, 14, 758–773. [Google Scholar] [CrossRef]
  42. Vacca, G.; Dessì, A.; Sacco, A. The Use of Nadir and Oblique UAV Images for Building Knowledge. ISPRS Int. J. Geo-Inf. 2017, 6, 393. [Google Scholar] [CrossRef] [Green Version]
  43. Banaszek, A.; Banaszek, S.; Cellmer, A. Possibilities of Use of UAVS for Technical Inspection of Buildings and Constructions. IOP Conf. Series Earth Environ. Sci. 2017, 95, 32001. [Google Scholar] [CrossRef]
  44. Chen, B.; Chen, Z.; Deng, L.; Duan, Y.; Zhou, J. Building change detection with RGB-D map generated from UAV images. Neurocomputing 2016, 208, 350–364. [Google Scholar] [CrossRef]
  45. IDEAM. Características Climatológicas de Ciudades Principales y Municipios Turísticos de Colombia; IDEAM: Bogotá, Colombia, 2012; p. 48. Available online: http://www.ideam.gov.co/documents/21021/418894/Caracter%C3%ADsticas+de+Ciudades+Principales+y+Municipios+Tur%C3%ADsticos.pdf/c3ca90c8-1072-434a-a235-91baee8c73fc (accessed on 23 September 2021).
  46. Alba Marina, T.; Viviana, L.; Jhon Alexander, V.; Angela Cristina, J.; Katherine Lorena, R.; Olga Lucía, D. Inventario Arbóreo del Jardín Botánico Universitario del Campus Meléndez de la Universidad del Valle, Santiago de Cali; Universidad del Valle: Cali, Colombia, 2015. [Google Scholar] [CrossRef]
  47. Becker, C.; Rosinskaya, E.; Häni, N.; d’Angelo, E.; Strecha, C. Classification of aerial photogrammetric 3D point clouds. Photogramm. Eng. Remote. Sens. 2018, 84, 287–295. [Google Scholar] [CrossRef]
  48. Wang, Q.; Pang, Y.; Chen, D.; Liang, X.; Lu, J. Lidar biomass index: A novel solution for tree-level biomass estimation using 3D crown information. For. Ecol. Manag. 2021, 499, 119542. [Google Scholar] [CrossRef]
  49. Lockwood, B.R.; Maxwell, J.T.; Robeson, S.M.; Au, T.F. Assessing bias in diameter at breast height estimated from tree rings and its effects on basal area increment and biomass. Dendrochronologia 2021, 67, 125844. [Google Scholar] [CrossRef]
  50. Chave, J.; Andalo, C.; Brown, S.; Cairns, M.A.; Chambers, J.Q.; Eamus, D.; Fölster, H.; Fromard, F.; Higuchi, N.; Kira, T.; et al. Tree allometry and improved estimation of carbon stocks and balance in tropical forests. Oecologia 2005, 145, 87–99. [Google Scholar] [CrossRef] [PubMed]
  51. Phillips, J.; Duque, A.; Cabrera, K.; Yepes, A.; Navarrete, D.; García, M.; Álvarez, E.; Cabrera, E.; Cárdenas, D.; Galindo, G. Estimación de las Reservas Potenciales de Carbono Almacenadas en la Biomasa Aérea en Bosques Naturales de Colombia; Instituto de Hidrología: Bogotá, Colombia, 2011; Volume 1, p. 70. [Google Scholar]
  52. Mohd Zaki, N.A.; Rajuli, M.F.; Latif, Z.A.; Suratman, M.N.; Omar, H.; Norashikin, S.; Zainal, M.Z.; Talib, N. Analysis of Canopy Height Model (CHM) Extraction using Quick Terrain Modeller (QTM) for Tropical Forest Area. IOP Conf. Ser. Earth Environ. Sci. 2020, 540, 012045. [Google Scholar] [CrossRef]
  53. Brown, S. Measuring, monitoring, and verification of carbon benefits for forest–based projects. Philosophical Transactions of the Royal Society of London. Ser. A Math. Phys. Eng. Sci. 2002, 360, 1669–1683. [Google Scholar] [CrossRef] [PubMed]
  54. Hergoualc’h, K.; Akiyama, H.; Bernoux, M.; Chirinda, N.; del Prado, A.; Kasimir, A.; MacDonald, J.D.; Ogle, S.M.; Regina, K.; Weerden, T.J.v.d. N2O emissions from managed soils, and CO2 emissions from lime and urea application. In Refinement to the 2006 IPCC Guidelines for National Greenhouse Gas Inventories; Intergovernmental Panel on Climate Change: Bangkok, Thailand, 2019; Volume 4, pp. 11.1–11.48. [Google Scholar]
  55. Díaz Arteaga, A.; Granados, S.; Saldaña Barahona, A. Informe Nacional de Calidad Ambiental Urbana: Áreas Urbanas con Población Superior a 500.000 Habitantes; Ministerio de Ambiente y Desarrollo Sostenible: Bogotá, Colombia, 2014; p. 95.
  56. Agredo, L. Aproximación a la Huella Ecológica de la Universidad del Valle, Campus Universitario de Meléndez. Bachelor’ Thesis, Universidad del Valle, Cali, Colombia, August 2011. [Google Scholar]
Figure 1. Location of the study area relative to the city of Cali and Colombia.
Sustainability 14 00046 g001
Figure 2. Three-dimensional point cloud. The left part shows the elevation, and the right part shows the elements in natural color.
Sustainability 14 00046 g002
Figure 3. Classification of the point cloud after manual reclassification.
Sustainability 14 00046 g003
Figure 4. High vegetation surface model (a), terrain model (b), and canopy height model (c).
Sustainability 14 00046 g004
Figure 5. DBH map (a); wood density map (b).
Sustainability 14 00046 g005
Figure 6. Flowchart of the UAV–GreenMetric methodology.
Sustainability 14 00046 g006
Figure 7. Aboveground biomass map (a); carbon content map (b).
Sustainability 14 00046 g007
Table 1. Studies around the world that implement biomass estimation with UAV data and allometric equations.
PlaceTechniqueEcosystemReference
KuwaitAllometry, UAVShrubAbdullah et al., 2021 [11].
KuwaitAllometry, UAVShrubAbdullah et al., 2021 [13].
CanadaAllometry, UAVWoody vegetationSankey et al., 2021 [14].
ItalyAllometry, UAVPoplar plantationsChianucci et al., 2021 [15].
CanadaAllometry, UAVCultivationSong et al., 2021 [16].
IranAllometry, UAVForestFakhri and Latifi, 2021 [17].
ItalyAllometry, UAVForestMatese et al., 2021 [18].
Costa RicaAllometry, UAVForestHernández-Cole et al., 2021 [19].
EcuadorAllometry, UAVForestGuascal et al., 2020 [20].
ColombiaAllometry, UAVMangroveFuentes, 2020 [21].
AustraliaAllometry, UAVMangroveNavarro et al., 2020 [22].
AustraliaAllometry, UAVMangroveJones et al., 2020 [23].
PortugalAllometry, UAVForestFernandes et al., 2020 [24].
EcuadorAllometry, UAVForestGonzález et al., 2019 [25].
GermanyAllometry, UAVForestYe al., 2019 [26].
NepalAllometry, UAVForestPanday et al., 2019 [27].
ChinaAllometry, UAVForestLin et al., 2018 [28].
Table 2. Studies around the world that implement three-dimensional analysis for multiple applications in infrastructure using UAV data.
PlaceTechniqueEnvironmentReference
PolandGIS, UAVTerrainPuniach et al., 2021 [29].
TurkeyGIS, UAVRoadsBiçici and Zeybek, 2021 [30].
Saudi ArabiaGIS, UAVInfrastructureElkhrachy, 2021 [31].
GreeceGIS, UAVTerrainValkaniotis et al., 2021 [32].
China, KyrgyzstanGIS, UAVArcheologySarașan et al., 2020 [33].
South KoreaGIS, UAVInfrastructureJeong et al., 2020 [34].
ColombiaGIS, UAVInfrastructureFuentes et al., 2020 [35].
USAGIS, UAVInfrastructurePark et al., 2019 [36].
South KoreaGIS, UAVTerrainLee et al., 2019 [37].
ChinaGIS, UAVConstructionLiu et al., 2019 [38].
MalaysiaGIS, UAVConstructionAl-Najjar et al., 2019 [39].
GreeceGIS, UAVConstructionMavroulis et al., 2019 [40].
GreeceGIS, UAVArcheologyNikolakopoulos et al., 2017 [41].
ItalyGIS, UAVConstructionVacca et al., 2017 [42].
PolandGIS, UAVInfrastructureBanaszek et al., 2017 [43].
ChinaGIS, UAVConstructionChen et al., 2016 [44].
Table 3. Calculations for criterion 1 (Setting and Infrastructure (SI)) in UI GreenMetric.
Criterion 1 (Setting and Infrastructure (SI))UAV–GreenMetric DataCampus %
Total campus area979,123 m2100%
Total campus ground floor area of buildings95,598 m29.75%
Ratio of open space area to total area97.81%
Total area on campus covered in forest vegetation430,551 m243.96%
Total area on campus covered in planted vegetation374,949 m238.29%
Total area on campus for water absorption79,062 m28.06%
Total open space area divided by total campus population39.14 m²/person
Table 4. Variables related to the calculations of aboveground biomass, carbon content, and CO2 equivalents on the university campus.
VariableAverageTotal Campus Area
Aerial biomass (Mg C ha−1)87.124569
Carbon content (tons/ha)43.562284
CO2 equivalents (tons CO2-e)1608384
Publisher’s Note: MDPI stays neutral with regard to jurisdictional claims in published maps and institutional affiliations.

