Article

A Novel Hybrid Sine Cosine Algorithm and Pattern Search for Optimal Coordination of Power System Damping Controllers

by
Mahdiyeh Eslami
1,*,
Mehdi Neshat
2 and
Saifulnizam Abd. Khalid
3
1
Department of Electrical Engineering, Kerman Branch, Islamic Azad University, Kerman 7635131167, Iran
2
Centre for Artificial Intelligence Research and Optimization, Torrens University Australia, Brisbane, QLD 4006, Australia
3
School of Electrical Engineering, Faculty of Engineering, Universiti Teknologi Malaysia, Johor Bahru 81310, Malaysia
*
Author to whom correspondence should be addressed.
Sustainability 2022, 14(1), 541; https://doi.org/10.3390/su14010541
Submission received: 16 November 2021 / Revised: 25 December 2021 / Accepted: 29 December 2021 / Published: 4 January 2022
(This article belongs to the Special Issue Optimal Dynamic Control of Active Distribution Power System)

Abstract

:
This paper presents an effective hybrid optimization technique based on a chaotic sine cosine algorithm (CSCA) and pattern search (PS) for the coordinated design of power system stabilizers (PSSs) and static VAR compensator (SVC)-based controllers. For this purpose, the design problem is considered as an optimization problem whose decision variables are the controllers’ parameters. Due to the nonlinearities of large, interconnected power systems, methods capable of handling any nonlinearity of power networks are preferable. In this regard, a nonlinear time domain-based objective function was used. Then, the proposed hybrid chaotic sine cosine pattern search (hCSC-PS) algorithm was employed for solving this optimization problem. The proposed method employed the global search ability of SCA and the local search ability of PS. The performance of the new hCSC-PS was investigated using a set of benchmark functions, and then the results were compared with those of the standard SCA and some other methods from the literature. In addition, a case study from the literature is considered to evaluate the efficiency of the proposed hCSC-PS for the coordinated design of controllers in the power system. PSSs and additional SVC controllers are being considered to demonstrate the feasibility of the new technique. In order to ensure the robustness and performance of the proposed controller, the objective function is evaluated for various extreme loading conditions and system configurations. The numerical investigations show that the new approach may provide better optimal damping and outperforms previous methods. Nonlinear time-domain simulation shows the superiority of the proposed controller and its ability in providing efficient damping of electromechanical oscillations.

1. Introduction

The stability of power systems has become a key study area as a result of the integration of power systems. As a result, the power system has been upgraded with more complex control technology and stronger protective mechanisms to improve stability. Electromechanical oscillations, which can be categorized into inter-area and local modes, are detected in the power system as a result of mechanical and electrical torque imbalances at the synchronous generator, which are induced by changes in the power system topology or loads [1]. The generator rotor shaft and power transfers are severely damaged when these low frequency oscillations (LFOs) are insufficiently damped. These oscillations have a significant impact on the dependability and security of a power supply. Power system stabilizers (PSSs) have long been used to increase power system stability and boost system damping of oscillation modes in order to combat these negative phenomena. These stabilizers are used to add damping torque to the generator rotor oscillations that are caused by the generator’s speed, frequency, or power. However, power networks are nonlinear and complex, making the use of nonlinear models instead of linear approximations more advisable to treat any nonlinearity in the tuning problem. Moreover, recent research has revealed that if only one PSS is tuned, the required damping level cannot be reached. Thus, it is advised to ensure coordination between the design processes of all PSSs. From the literature review, such as in [1], it is shown that PSSs regulators may fail sometimes to provide adequate damping torque for inter-area modes. Unfortunately, some weakness is encountered in the damping of inter-area oscillations, and other solutions need to be involved.
In recent years, power electronic-based flexible AC transmission systems (FACTS) controllers, which are based on power electronics, have been considered as efficient alternative solutions [2]. Generally, FACTS devices have been employed for handling different power system control problems [3]. In other words, they can increase power transfer capability, and improve power system stability and controllability. Thus, power flow will be better controlled, and the voltages will be better maintained within their rated limits, which will make it possible to increase the stability margins and to tend towards the thermal limits of the lines. However, the combination of PSSs and FACTS devices in the same network has raised a new problem in terms of coordination between these regulators. Indeed, it is essential to ensure that there is a good coordination between these devices in a way that their actions are not negative in view of the security of the network.
One of the well-known shunt FACTS devices, named static VAR compensator (SVC), is considered a competent device to provide adequate damping of the LFOs in modern power systems after the apparition of disturbances [4]. It also has the capability of regulating bus voltage at its terminals by injecting controllable reactive power into the power network through the bus where it is connected. In the last few years, many studies have proposed design techniques for SVC devices to enhance power system stability. Furthermore, other proprieties of the power system can be improved, such as the dynamic control of power flow, steady-state stability limits, and damping of electromechanical oscillations [5]. Most of these studies have been focused on the coordinated design of SVC and PSS controllers. Uncoordinated design between SVC and PSS causes the system to become unstable. Therefore, stability and damping modes are essential for optimal coordinated design between PSS and SVC-based controllers. A comprehensive study of the PSS and SVC controllers when applied in a coordinated manner and also separately has been investigated in [6]. The problem of designing the power system controller’s parameters is formulated as a non-differentiable, large-scale nonlinear problem. This optimization problem is hard to solve by employing traditional optimization techniques such as sequential quadratic programming (SQP) techniques due to their high sensitivity to the initial point [7]. Furthermore, these methods require a long convergence process. To overcome the drawbacks mentioned, intelligent techniques are involved in real-life engineering problems, including power system stability [8,9,10,11,12,13,14].
Most of this research has been focused on the coordinated design of SVC and PSS controllers. For the coordinated design of power system controllers, a large number of such algorithms have recently been offered, including: Teaching–Learning Algorithm (TLA) [15], Bacterial Foraging Optimization (BFO) [16], Brainstorm optimization algorithm (BOA) [17], Coyote Optimization Algorithm (COA) [18], ant colony optimization (ACO) [19], bat algorithm (BAT) [20], bee colony algorithm (BCA) [7], Genetic Algorithm (GA) [21], particle swarm optimization (PSO) [22], flower pollination algorithm (FPA) [23], gravitational search algorithm (GSA) [24,25], sine-cosine algorithm (SCA) [26], grey wolf optimizer (GWO) [27], firefly algorithm (FA) [28], Differential Evolution (DE) [29], Biogeography-Based Optimization (BBO) [30], Cuckoo Search (CS) algorithm [31], Harmony Search (HS) [32], Seeker Optimization Algorithm (SOA) [33], Imperialist Competitive Algorithm (ICA) [34], Harris Hawk Optimization (HHO) [35], Sperm Swarm Optimization (SSO) [36], Tabu Search (TS) [37], Simulated Annealing [38], Multi-Verse Optimizer (MVO) [39], Moth-flame Optimization (MFO) [40], Tunicate Swarm Algorithm (TSA) [41] and collective decision optimization (CDO) [42]. Although metaheuristics algorithms could provide relatively satisfactory results, no algorithm could provide superior performance than others in solving all optimizing problems. Therefore, several studies have been carried out to improve the performance and efficiency of the original metaheuristic algorithms in some ways and apply them for a specific purpose [43,44,45,46,47,48].
The SCA is a relatively new meta-heuristic optimization approach introduced by Mirjalili in 2016 [49]. Compared with other meta-heuristic, the SCA has a simple concept and structure and does not have complicated mathematical functions. In the SCA, the formulas for updating the population rely solely on sine and cosine functions. SCA is better than other competitive methods at finding optimal solutions and is suitable for tackling real-world optimization problems [50]. However, SCA tends to become trapped in local optima and, in some complex cases, is unable to successfully converge [51]. In addition, according to the No-Free-Lunch theorem [52], even though various optimization algorithms are introduced in the literature, there is no guarantee that an optimization algorithm could solve every kind of optimization problem. In other words, one algorithm or method cannot outperform others in all optimization problems. An optimization method may have satisfied results for some problems, but not for others. As a result, opportunities to introduce new methods will always exist. Therefore, in the current study an effective hybrid algorithm is developed based on the chaotic version of the SCA and pattern search (PS) method called hCSC-PS. The proposed hybrid algorithm utilizes the exploration ability of SCA and exploitation ability of PS, which can significantly improve the finding results. SCA and pattern search offer complementary benefits and the combination these two techniques can result in a faster and more reliable algorithm. To validate the efficacy of the new hybrid approach, a set of benchmark functions as well as controller design problems of a multi-machine power system are studied. Simulation results validate the superiority of the new method in design controllers under several loading situations.
The rest of this paper is organized as follows: Section 2 explains the proposed hybrid optimization algorithm. The problem is formulated as an optimization problem in Section 3. Section 4 discusses model verification. Section 5 contains a description of the simulation results. Finally, in Section 6, the study’s findings are summarized.

2. Proposed Hybrid Algorithm

2.1. CSCA

SCA is a population-based metaheuristic technique based on the mathematical properties of sine and cosine functions [49]. This algorithm begins the search process with a collection of randomly generated solutions in the search space, as shown in the following equation.
x i = l b i + r a n d × ( u b i l b i ) ;   i = 1 ,   2 ,   ,   N
where x i is the placement of ith solution in the search space. Furthermore, u b i and l b i represent the solution’s lower and upper bounds, respectively. The parameters are defined in Appendix B. Following the generation of the random starting solutions, each solution dynamically modifies the positions using the equations below:
{ x i t + 1 = x i t + A × s i n ( r 1 ) × | r 2 × x B e s t x i t |       i f   r 3 < 0.5 x i t + 1 = x i t + A × c o s ( r 1 ) × | r 2 × x B e s t x i t |       o t h e r w i s e
where, x i t is the position of ith solution at iteration t, x B e s t represents the best solution in the population, r1 is a random numbers in the range of [0, 2π], r2 is a random weight of the best solution among −2 and 2, r3 is a random number among 0 and 1, and the symbol | . | signifies absolute value. If the parameter r3 is lesser than 0.5, the applicant solution selects the sine function to update its position. The parameter A is a function that may be defined as follows to help balance the exploration and exploitation of a search space:
A = 2 2 ( t t m a x )
where, t m a x is the maximum number of iterations. The aim of the current research is to implement the global search ability of the SCA. Therefore, to increase the exploration ability of the algorithm and to avoid premature convergence in early iterations, the chaotic sequence is applied in the updating position equation (Equation (2)). Chaotic systems are deterministic systems that present randomness, irregularity and the stochastic property, depending on the initial conditions. Chaotic variables can oscillate through certain ranges based on their own irregularity without repetition. A chaotic map is a map that presents some kind of chaotic behavior, capable of generating chaotic motion. In the current study, a well-known logistic map is applied based on the following equation:
λ (t + 1) = a × λ (t) × (1 − λ (t))
In this equation, λ (t) is the chaotic map and t denotes the iteration number. λ (0) is in the range of (0, 1) and should not be equal to 0, 0.25, 0.5, 0.75 and 1. a is a constant equal to 4. In the CSCA, to increase the stochastic behavior of the algorithm and avoid premature convergence, the random parameters r1 and r2 in Equation (2) are changed with the chaotic map of Equation (4). Therefore, the updated position of the tunicate with respect to the position of the food source is evaluated using the Equation (5). The steps of the proposed CSCA are presented in Algorithm 1.
{ x i t + 1 = x i t + A × s i n ( λ 1 ) × | λ 2 × x B e s t x i t |       i f   r 3 < 0.5 x i t + 1 = x i t + A × c o s ( λ 1 ) × | λ 2 × x B e s t x i t |       o t h e r w i s e
Algorithm 1. CSCA.
Initialization algorithm parameters: population size (N), maximum iteration number ( t m a x ).
Initialize random population X
For i = 1 to N
    Calculate the fitness of each random solution
    Record the optimal individual as Xbest
End
  While (t t m a x )
     Update A using Equation (3)
     Update λ using Equation (4)
     For i = 1 to N
       For j = 1 to dim
         Update r3
         If r3 < 0.5
           Update X by the sine part of Equation (5)
         Else
           Update X by the cosine part of Equation (5)
         End if
       End for
       Calculate the fitness of the updated X
      Update Xbest
     End for
     t = t + 1
  End
Return the best solution

2.2. Pattern Search (PS)

PS is a derivative-free algorithm that can be simply implemented to fine-tune local search. The PS algorithm generates a set of points that may or may not be close to the optimum [53]. To begin, a mesh (a collection of points) is created around an existing point. If a new point in the mesh has a lower value of objective function, it becomes the current point in the following iteration. The PS starts the search with an initial point X0 defined by the user. At the first iteration, the mesh size is considered equal to 1 and the pattern vectors (or direction vectors) are constructed as [0 1] + X0, [1 0] + X0, [−1 0] + X0 and [0 −1] + X0, and new mesh points are added as presented in Figure 1. Then, the objective function is calculated for produced trial points until a value smaller than X0 is found. If there is such a point (f (X1) < f (X0)), the poll is successful, and the algorithm sets this point as a source point. The method multiplies the current mesh size by 2 (called the expansion factor) after a successful poll and moves on to iteration 2 with the following new points: 2 × [0 1] + X1, 2 × [1 0] + X1, 2 × [−1 0] + X1 and 2 × [0 −1] + X1. If a value lesser than for X1 is created, X2 is defined, the mesh size is improved by two, and iterations continue. The current point is not modified if the poll is unsuccessful at any stage (i.e., no point has an objective function lesser than the greatest latest rate) and the mesh size is reduced by multiplying by a reduction factor. This process is repeated until the minimum is found or a terminating conditions is met. The steps of the PS method are presented in Algorithm 2.
Algorithm 2. Pattern search method.
Initialization:
 Initialize the starting point X0 and step size factor SF
 Set t = 0
Iteration:
1. Search step: evaluate f at a finite number of points with the goal of decreasing the objective function value at Xk. If Xk+1 is found satisfying f (Xk+1) < f (Xk), go to step 4.
Otherwise, go to step 2.
2. Poll step: If f (Xk ) ≤ f (X) for every X in the mesh neighborhood, go to step 3.
  Otherwise, choose a point Xk+1 such that f (Xk+1) < f (Xk), go to step 4.
3. Mesh reduction: let SFk+1 = 1/2 × SFk. Set k ← k + 1 and return to step 1 for a new iteration.
4. Mesh expansion: let SFk+1 = 2 × SFk. Set k ← k + 1 and return to step 1 for a new iteration

2.3. Proposed Method (hCSC-PS)

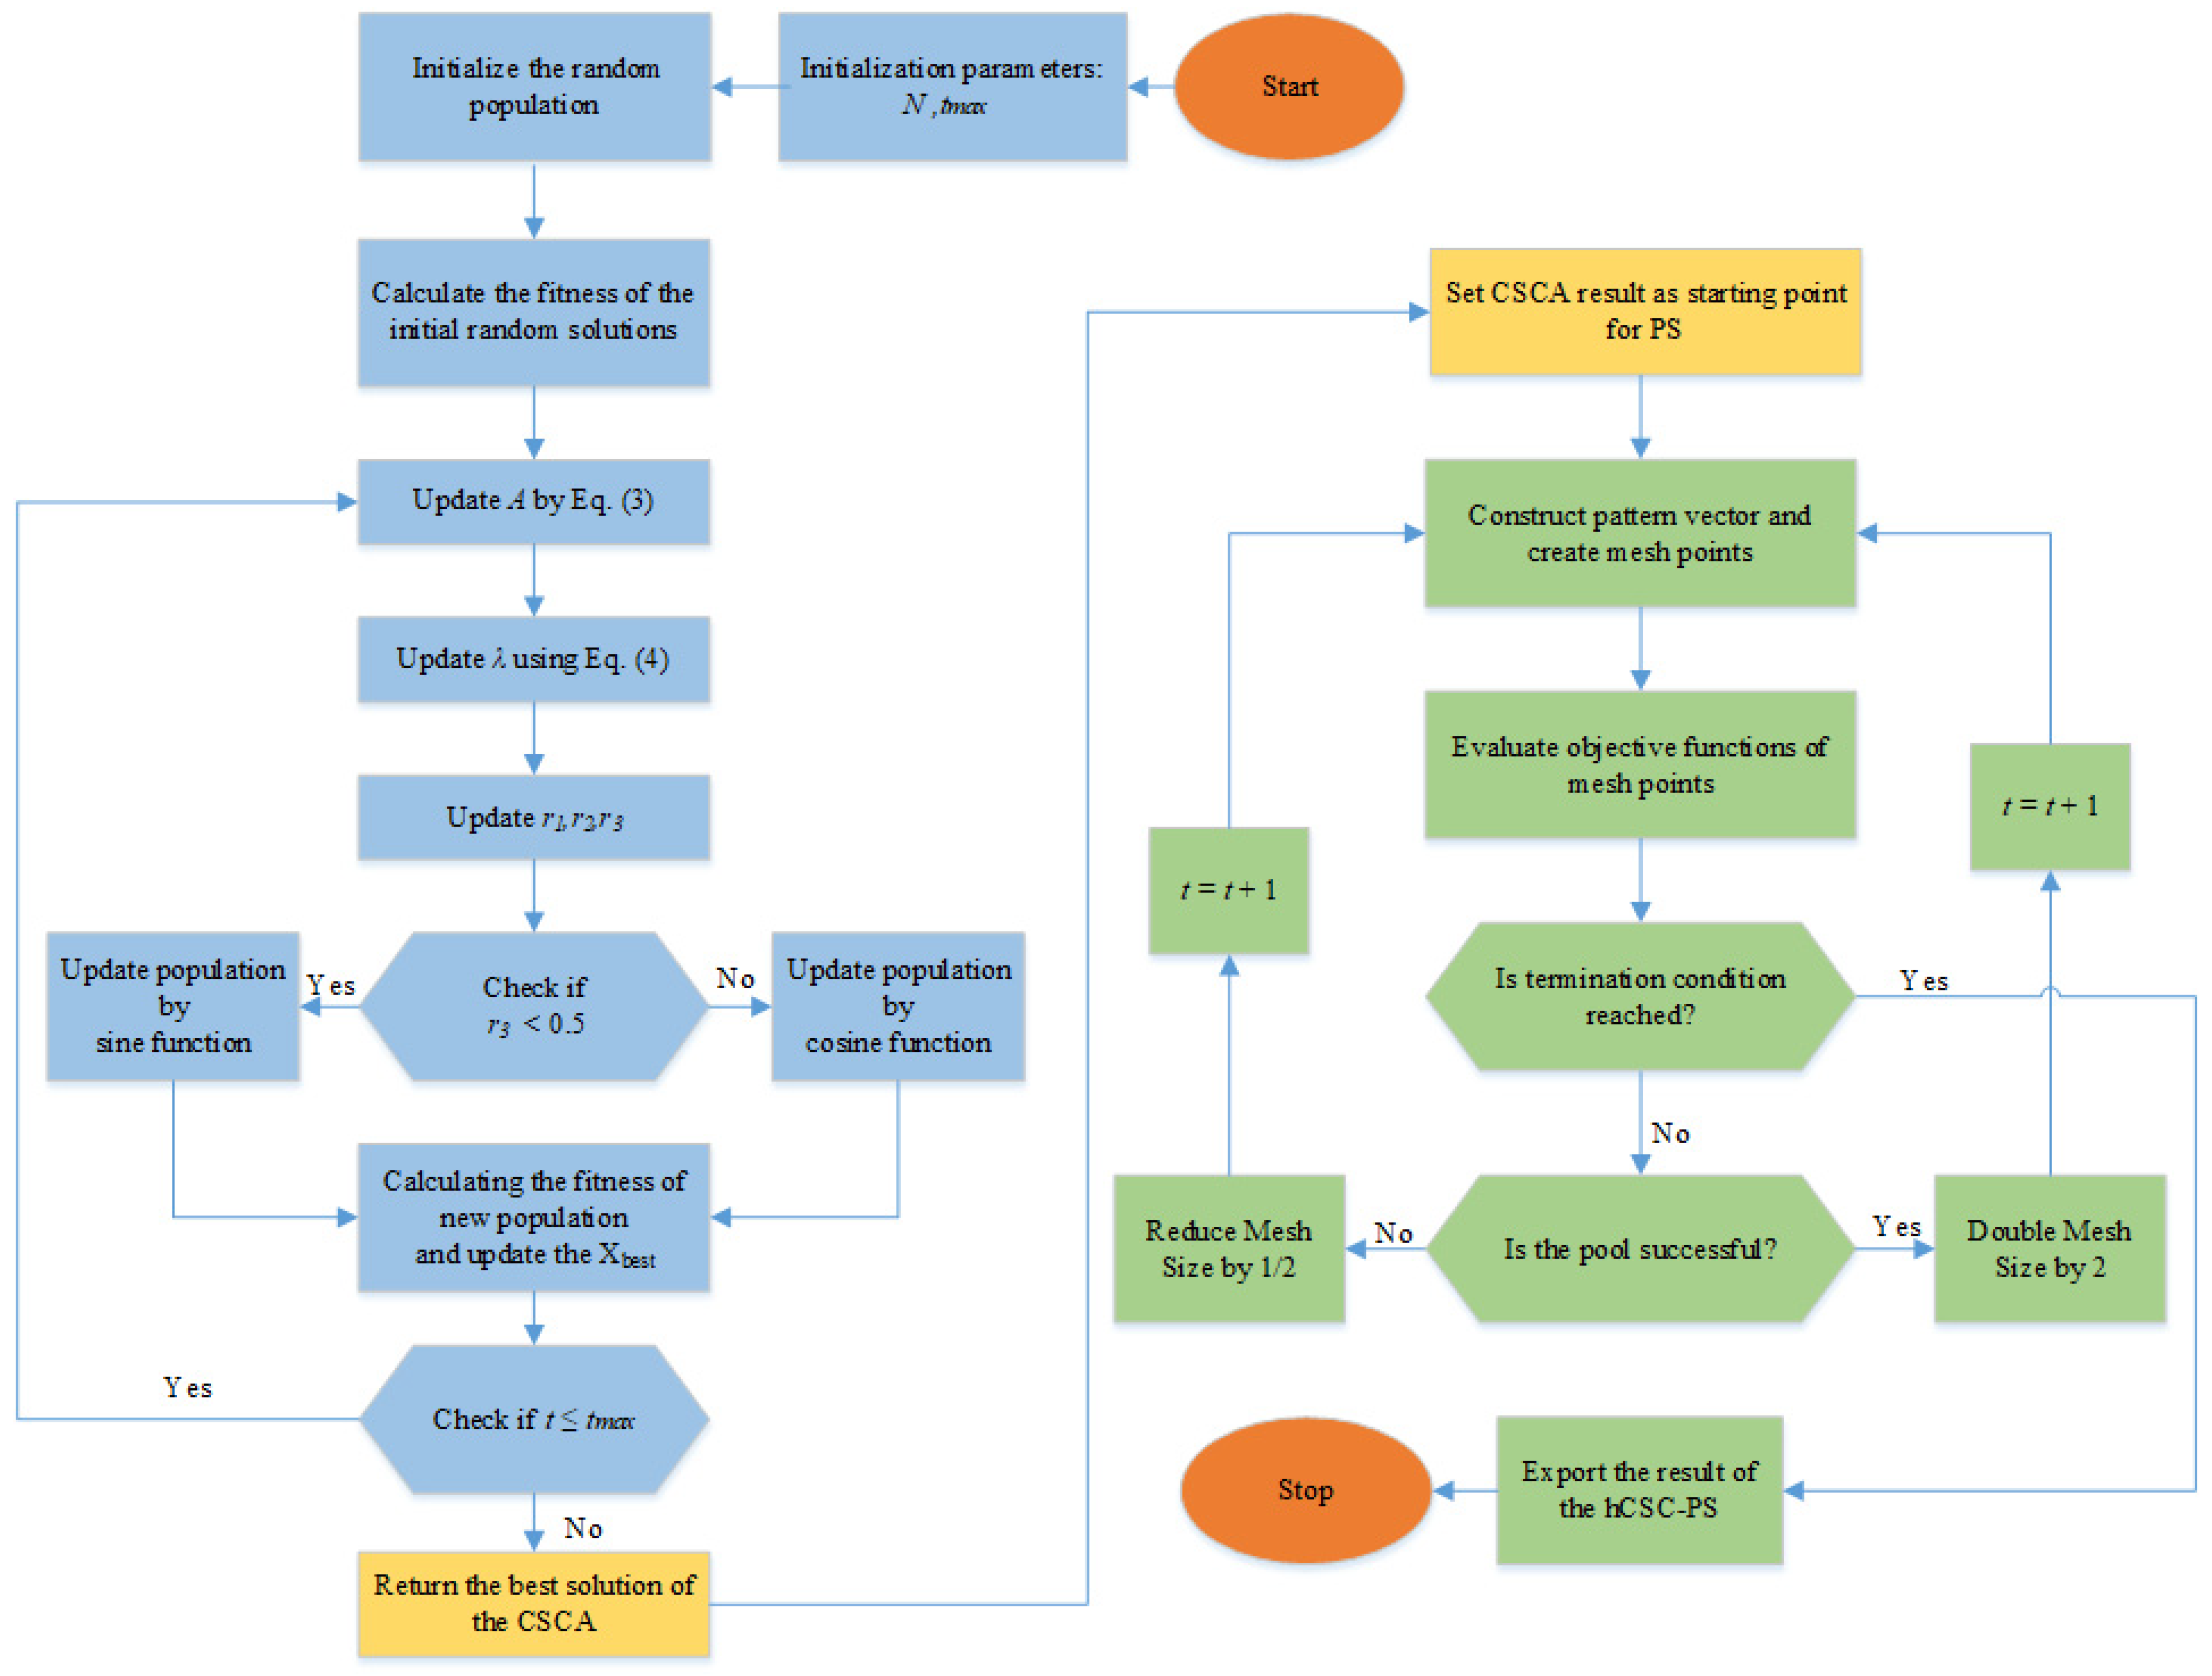
The original SCA has some advantages compared with other optimization algorithms. It has a simple structure and fewer parameters. In addition, the performance of the algorithm depends on the sine and cosine functions for iteration to find the optimal solution. Although the original SCA has high global search capabilities, its parameters are incompatible with the search process in the latter stages of the algorithm. This will reduce the rate of convergence and population diversity. In this study, a hybrid algorithm combining the CSCA with the PS algorithm, called hCSC-PS, is proposed for the coordinated design of PSSs and SVC-based controllers. The hybrid algorithm may take advantage of both the CSCA’s strong global searching capacity and the PS’s strong local searching ability. The chaotic sine cosine method has excellent global optimal performance and is easy to escape from local minima. Theoretically, increasing the numbers of CSCA iteration can improve the search accuracy. When the number of iterations is great enough, however, CSCA is unable to enhance precision. As a result, CSCA’s local search capability is still insufficient. Pattern search is a local optimization approach, and the initial point has a significant impact on the algorithm’s output. However, if a good starting point is chosen, pattern search will be a simple and effective strategy. In this study, we integrate the CSCA’s benefits as global optimization and PS’s advantages as the local optimization to effectively find the optimal solution. The proposed hybrid algorithm begins with the CSCA since the PS is sensitive to the initial solution. The searching process continues with the CSCA for a specific number of iterations. The PS is then turned on to conduct a local search using the current best solution obtained by CSCA as its starting point. The suggested hCSC-PS algorithm’s flowchart is given in Figure 2.

3. Optimization Problem Formulation

The general form of a constraint optimization problem can be expressed mathematically as follows:
m i n i m i z e       f ( X ) s u b j e c t   t o g i ( X ) 0 .       i = 1 , 2 , , p h j ( X ) 0 .       j = 1 , 2 , , m X L X X U
where X is n dimensional vector of design variables, f(X) is the fitness function which returns a scalar value to be minimized, g(X) and h(X) are inequality and equality constraints, respectively. Boundary constraints, XL and XU, are the boundary constraints. Many optimization methods have been developed over the last few decades. Metaheuristics are a new generation of optimization methods that are proposed to solve complex problems.

3.1. Power System Model

The standard modeling for power systems is based on a set of nonlinear differential algebraic calculations, which are as follows:
X ˙ = f ( X . U )
where X = [δ, ω, Eq, Efd] is the state variables vector and U = [uPSS, usvc] is the input control parameters vector. The linear equation with PSSs and SVC controllers is obtained by Equation (8).
X ˙ = A X + B U
At a certain operating point, both A and B are evaluated. The goal of the optimum design is to put the state matrix modes on the left side.

3.1.1. PSS Structure

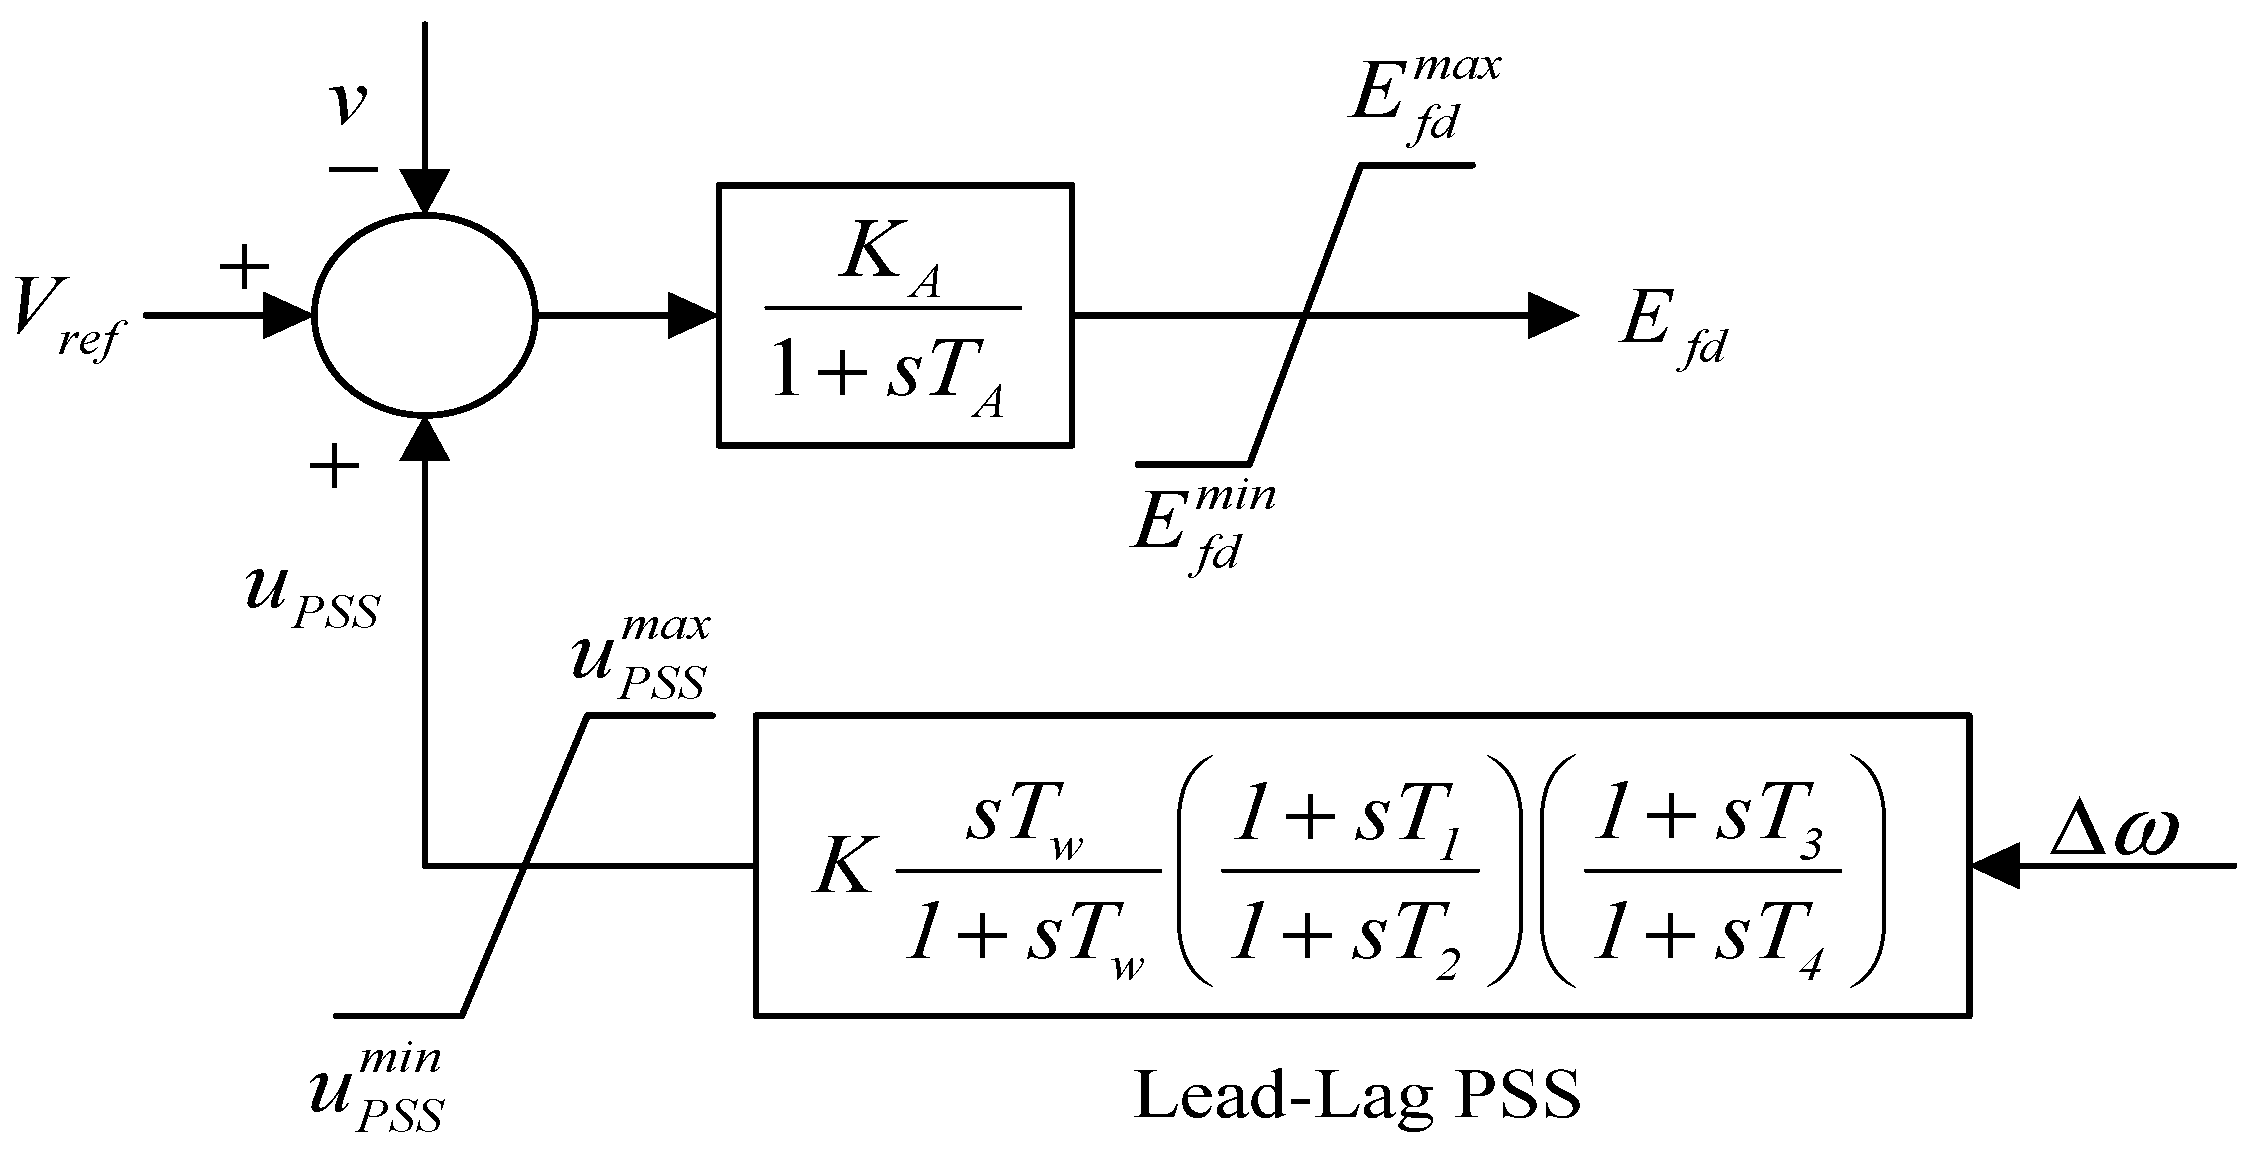
PSS compensates for the phase lag between exciter input and machine electrical torque. An additional stabilizing signal is presented through the excitation system to achieve this goal. PSS generates the necessary torque on the machine’s rotor. The additional stabilizing signal and the speed are proportional. As shown in Figure 3, this stabilizer style contains of a washout filter and a dynamic compensator. The washout filter, which is primarily a high pass filter, will remove the mean component of PSS’s output. In general, the constant value of time can be anywhere between 0.5 and 20 s.

3.1.2. SVC Based Damping Controller Model

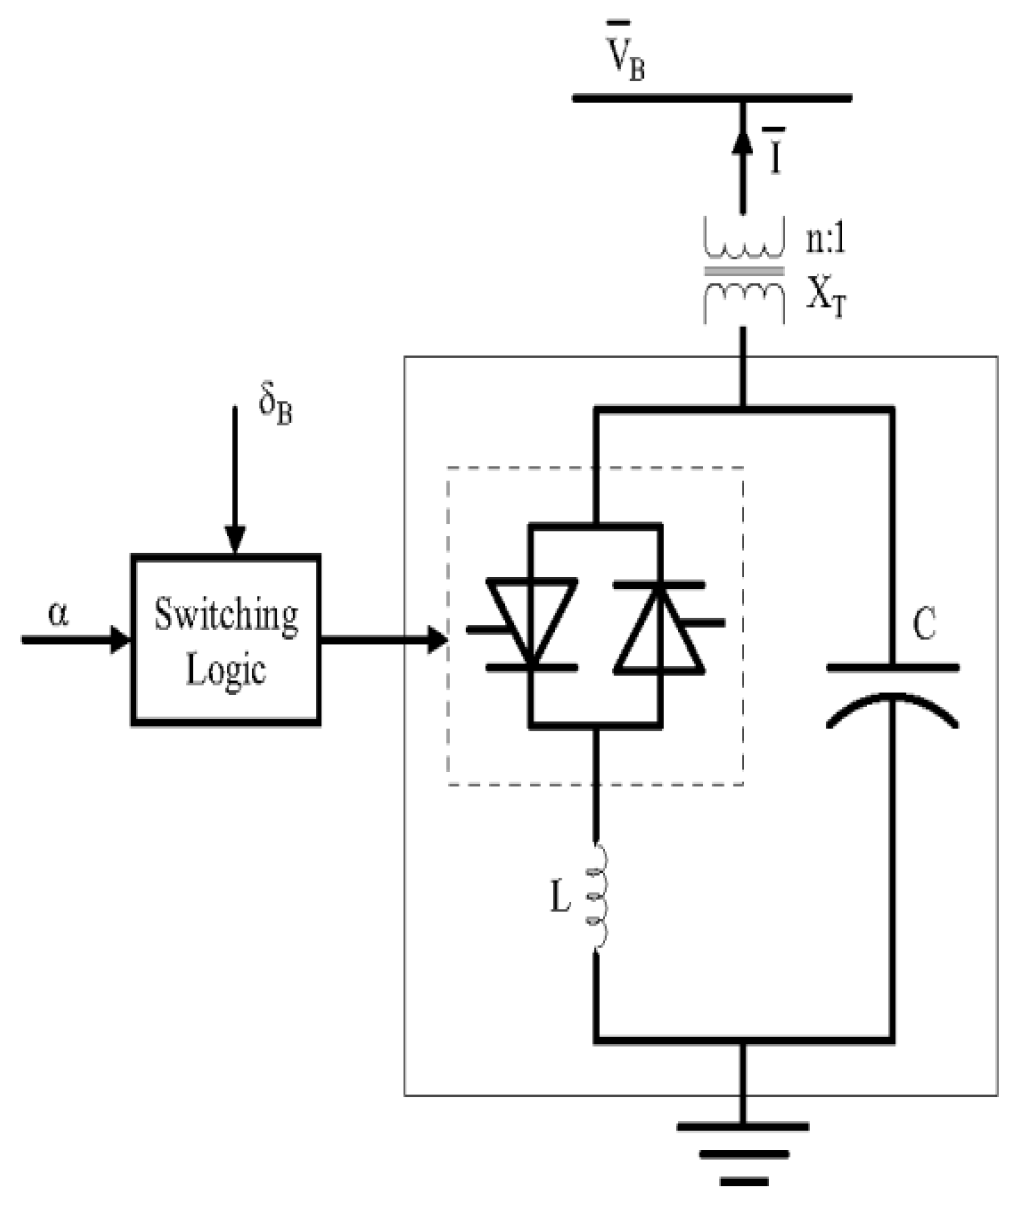
Figure 4 shows the SVC structure in this study, which is a fixed capacitor thyristor-controlled reactor. The firing angle varies between 90 and 180 degrees depending on the capacitor voltage.
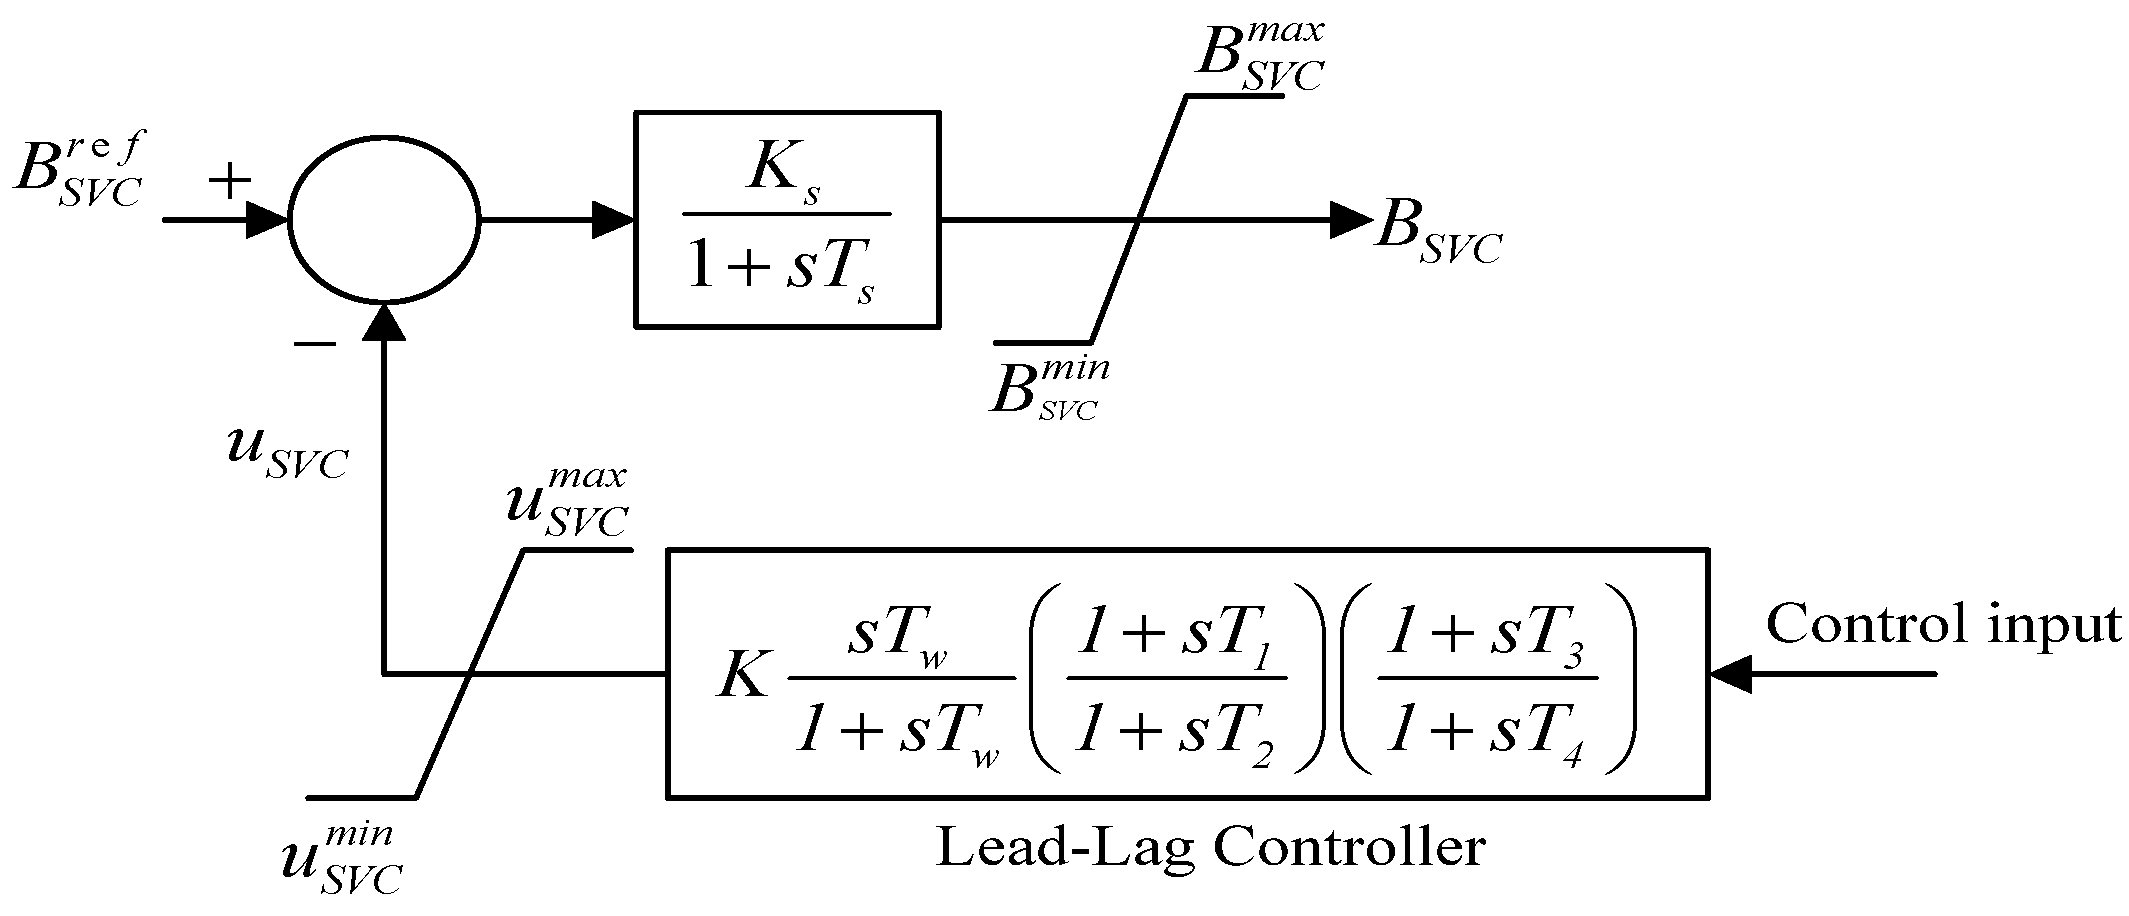
Figure 5 shows an SVC-based damping controller that acts as a lead-lag compensator and consists of two stages of the lead-lag compensator: a signal-washout block, and a gains block. SVC has the following dynamic equation:
B ˙ S V C = ( K s ( B S V C r e f u S V C ) B S V C ) / T s

3.2. Problem Formulation

The optimum parameters are obtained using the suggested technique under a variety of operating conditions and disturbances. For the optimal setting of PSSs and SVC controllers, a nonlinear time domain objective function called ITAE is used in this study. The equation can be used to define ITAE based on system performance characteristics (10).
J = j = 1 N i = 1 M 0 t s i m t ( | Δ ω i | ) d t
where Δω is the speed deviation of rotor, tsim is the time of simulation, N and M are the number of machine and the operating points respectively. The objective function and constrained optimization problem can be described by the following equation for various loading conditions:
m i n i m i z e       J       s u b j e c t   t o K i m i n K i K i m a x T j i m i n T j i T j i m a x       j = 1 , , 4
hCSC-PS determines the gain (K) and time constants (T) of controllers. The washout time constant for both PSS and SVC controllers is TWi =10 s in most previous works. The decision variables’ typical ranges are [1, 100] for Ki and [0.01, 1.5] for T1i to T4i.

4. Performance Verification of hCSC-PS

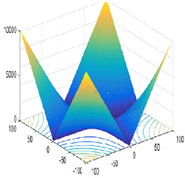
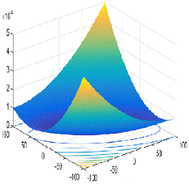
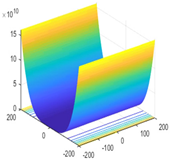
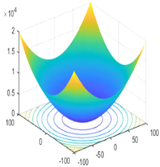
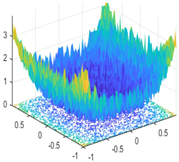
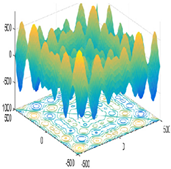
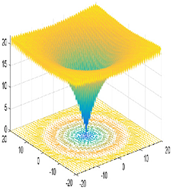
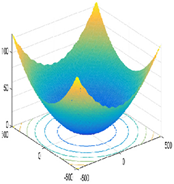
In this section the effectiveness verification of the proposed hybrid method will be investigated. To this aim, the performance of hCSC-PS is compared with the standard version of the algorithm as well as some well-known metaheuristic algorithms on a collection of benchmark test functions from the literature. These are all minimization problems that can be used to assess the robustness and search efficiency of new optimization algorithms. Table 1, Table 2 and Table 3 show the mathematical formulation and features of these test functions.
The results and performance of the proposed hCSC-PS is compared with original SCA and other well-established optimization algorithms include GSA [54], TSA [55] and, GWO [56]. For both hCSC-PS and SCA the size of solution (N) is considered equal to 50. As the proposed algorithm required extra function evaluation, the same value of maximum number of iterations may cause an unfair comparison. Therefore, to have a fair comparison between the algorithms, the same number of function evaluations equal to 50,000 is considered in all experiments. The parameters of the hCSC-PS and other methods are presented in Table 4. Because metaheuristics approaches are stochastic, the findings of a single run may be erroneous, and the algorithms may find better or worse solutions than those previously found. As a result, statistical analysis should be used to make a fair comparison and evaluate the algorithms’ effectiveness. In order to address this issue, 30 separate runs were carried out for the specified algorithms and the statistical outcomes are described in Table 5, Table 6 and Table 7.
The results of Table 5, Table 6 and Table 7 show that, for all functions, hCSC-PS could provide better solutions in terms of the best and the mean value of the objective functions compared with the standard SCA and also other optimization algorithms. The results show that hCSC-PS is a more stable approach than the other methods in terms of standard deviation, which indicates the algorithm’s stability. Based on the findings, it can be inferred that hCSC-PS outperforms the standard algorithm as well as alternative optimization methods.

5. Practical Applications

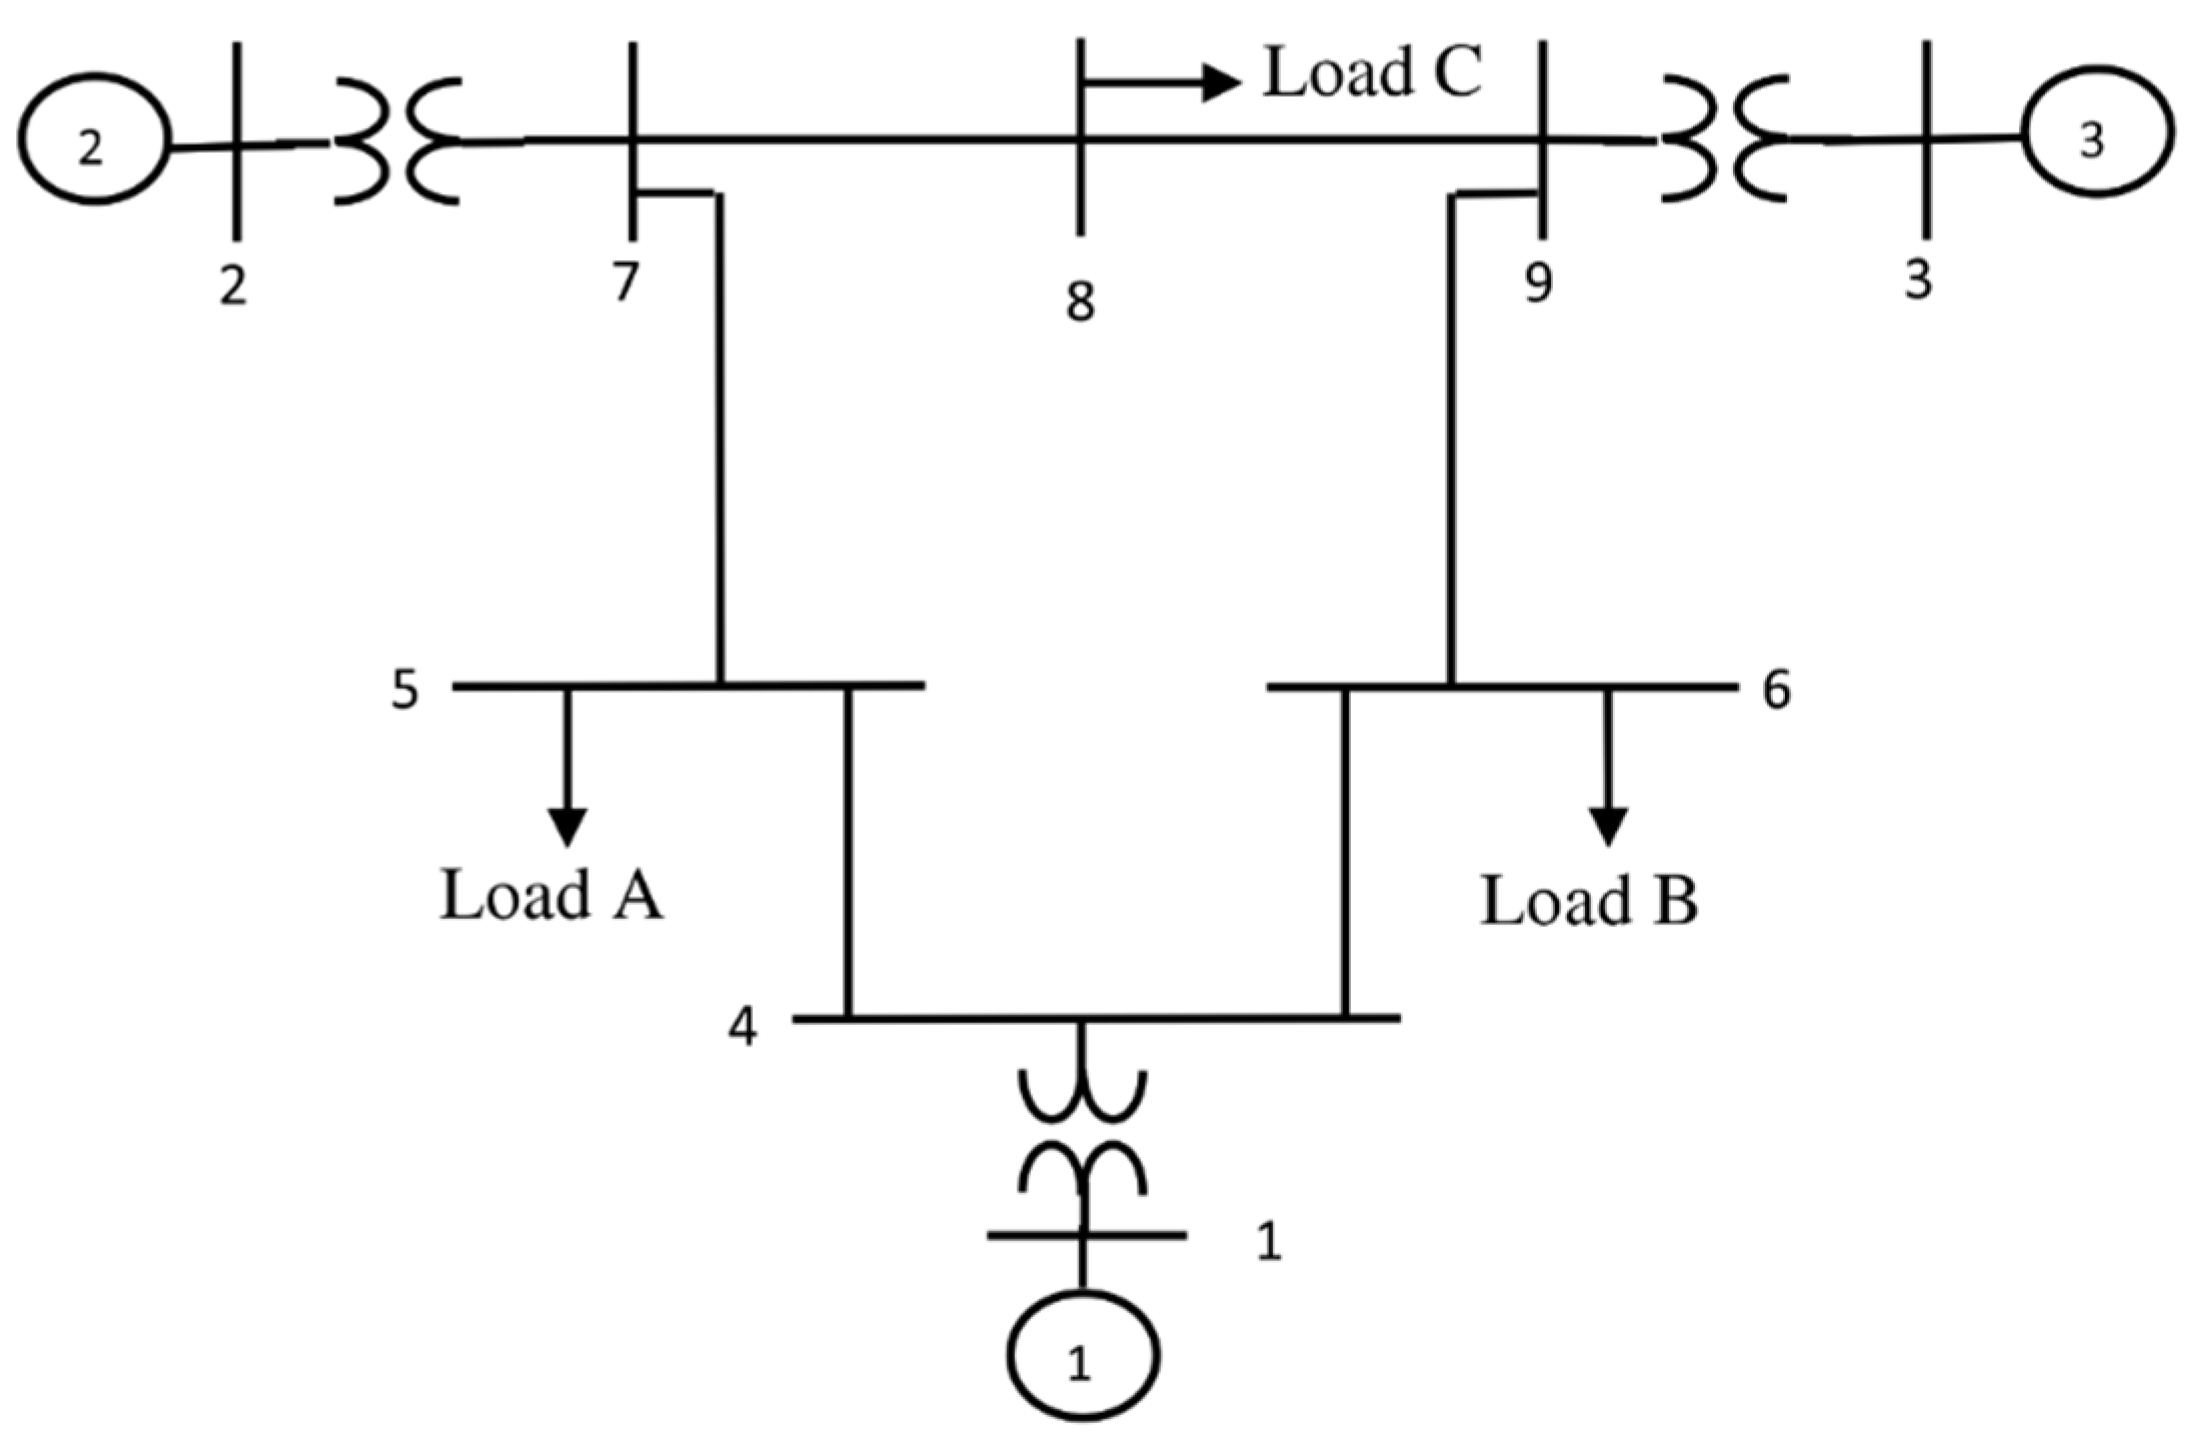
Figure 6 shows a single-line diagram of the 3-machine 9-bus (WSCC), which is used to demonstrate the proposed technique’s efficacy and robustness [5,57]. Different strategies for determining the best location for SVCs devices have been described in the literature [5]. The WSCC system was subjected to two strategies based on the effect of load percentage and line outage on load bus voltages, with bus number 5 being selected as the best location for the SVC device. The proposed controllers’ performance is evaluated using four different loading conditions. Table 8 shows four operating conditions (cases), which they are considered as representative cases in the literature [5,15,18,44], for evaluating the performance of the proposed controllers. These operating conditions are considered for the WSCC test system in the design process. The dynamics model of the system is given in Appendix A.
The objective function given in Equation (10) is minimized with two scenarios of severe fault disturbances under the loading conditions described above in order to find the optimum values of controllers’ parameters. Scenario 1: The line 5–7 close bus 5 experiences a 6-cycle fault disturbance. The fault is cleared by tripping line 5–7 and reclosing it successfully after 1.0 s. Scenario 2 is the same as scenario 1, except for a 0.2 (pu) step increase in mechanical power. Lines 5–7 are tripped to clear the fault and reclosing successfully after 1.0 s. The optimum controller parameters obtained using the nonlinear time domain based objective function are shown in Table 9. To obtain the results presented in this table, the problem has been solved 30 times using the proposed hCSC-PS and the best results are presented in Table 9. After the proposed hCSC-PS technique had converged, these results were obtained. To demonstrate the robustness of the coordination between PSSs and SVC controllers, an individual design is also carried out.
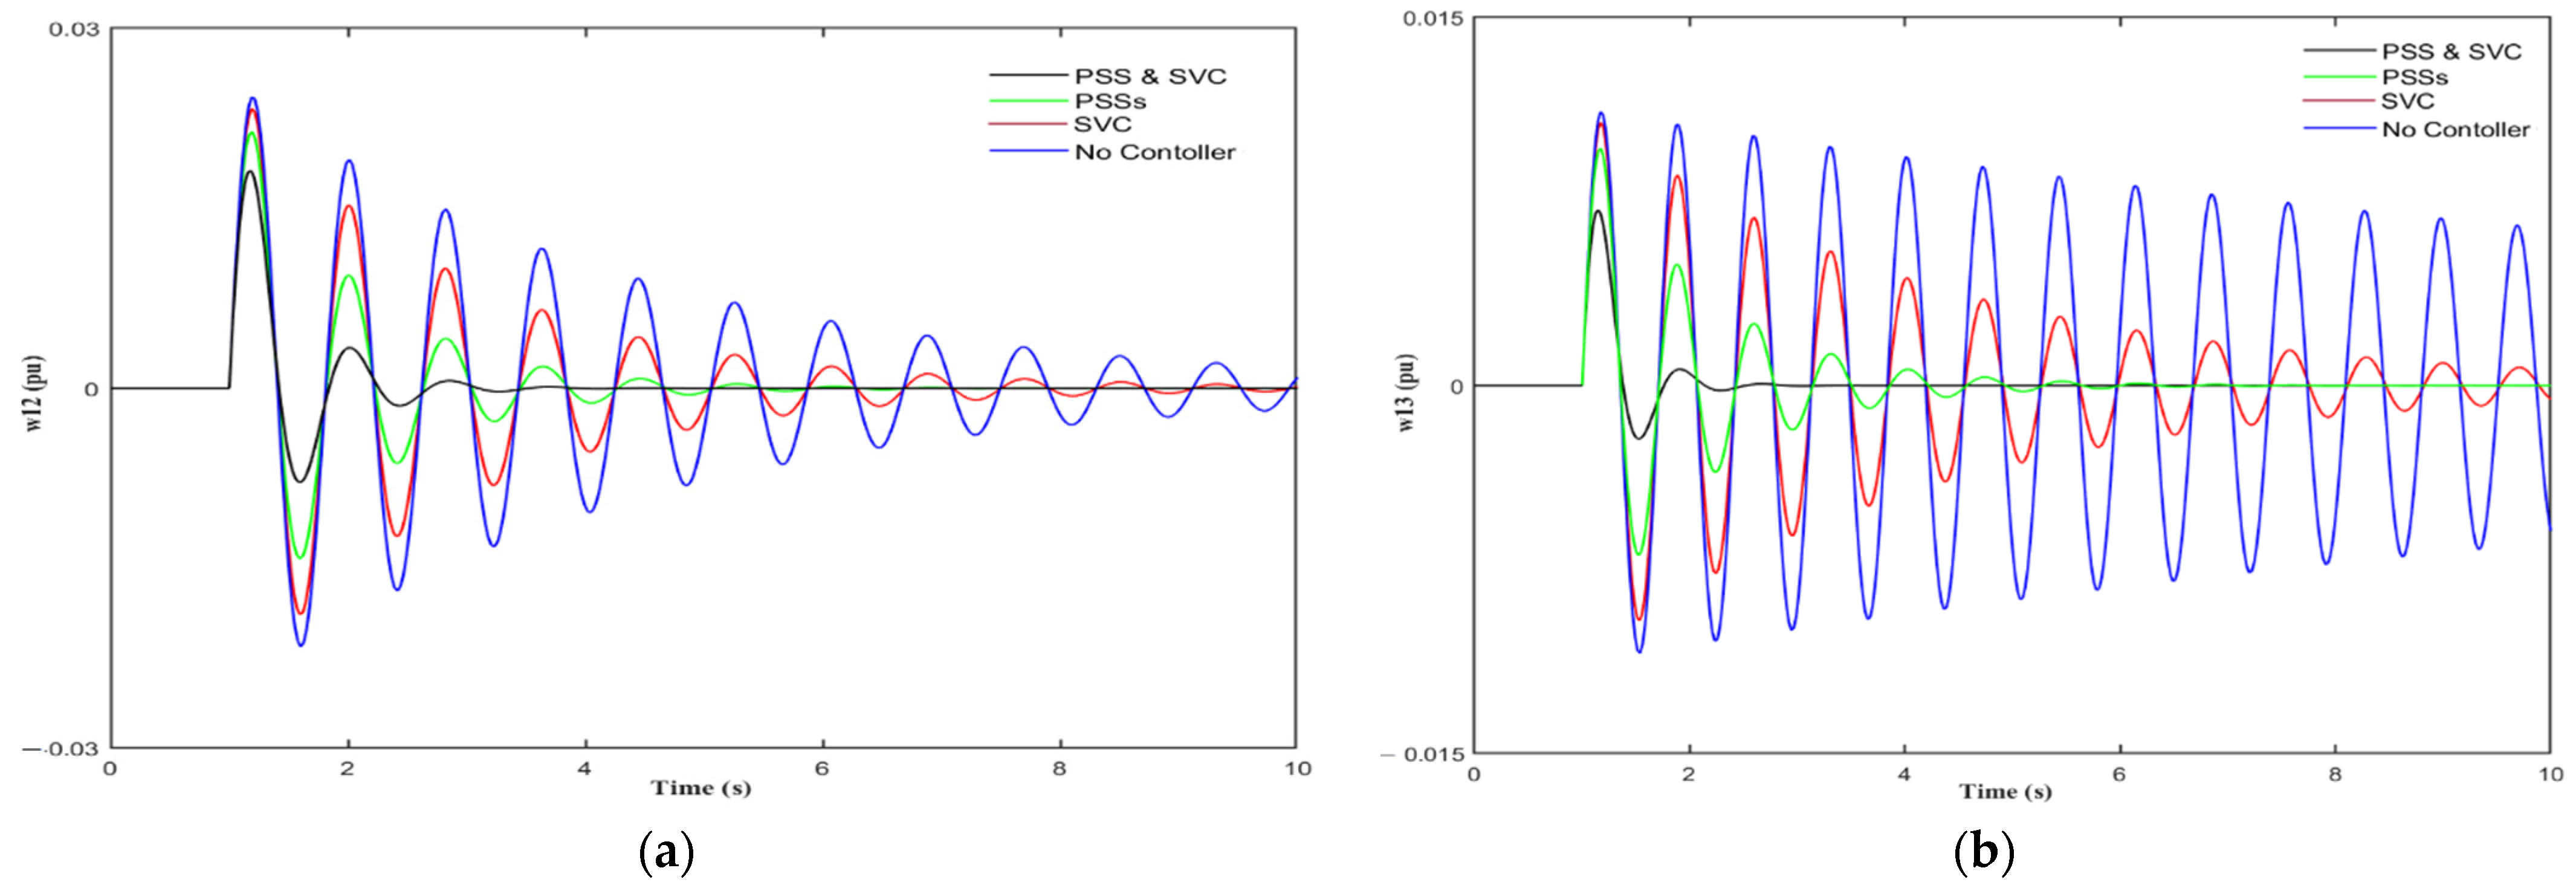
Figure 7 shows the speed deviation response for various loading conditions under two scenarios to demonstrate the contribution of the coordinated design versus the uncoordinated design. When compared to when no controllers are used, Figure 8 clearly shows that SVC-based controllers fail to provide adequate damping of system oscillations when used alone. Furthermore, when compared to SVC controllers, PSSs regulators provide good damping of system oscillations with a short settling time. The suggested coordinated controllers, on the other hand, remain the most effective at damping oscillations and reducing their settling times. The coordinated design of the suggested method outperforms the uncoordinated design, according to the simulation results.
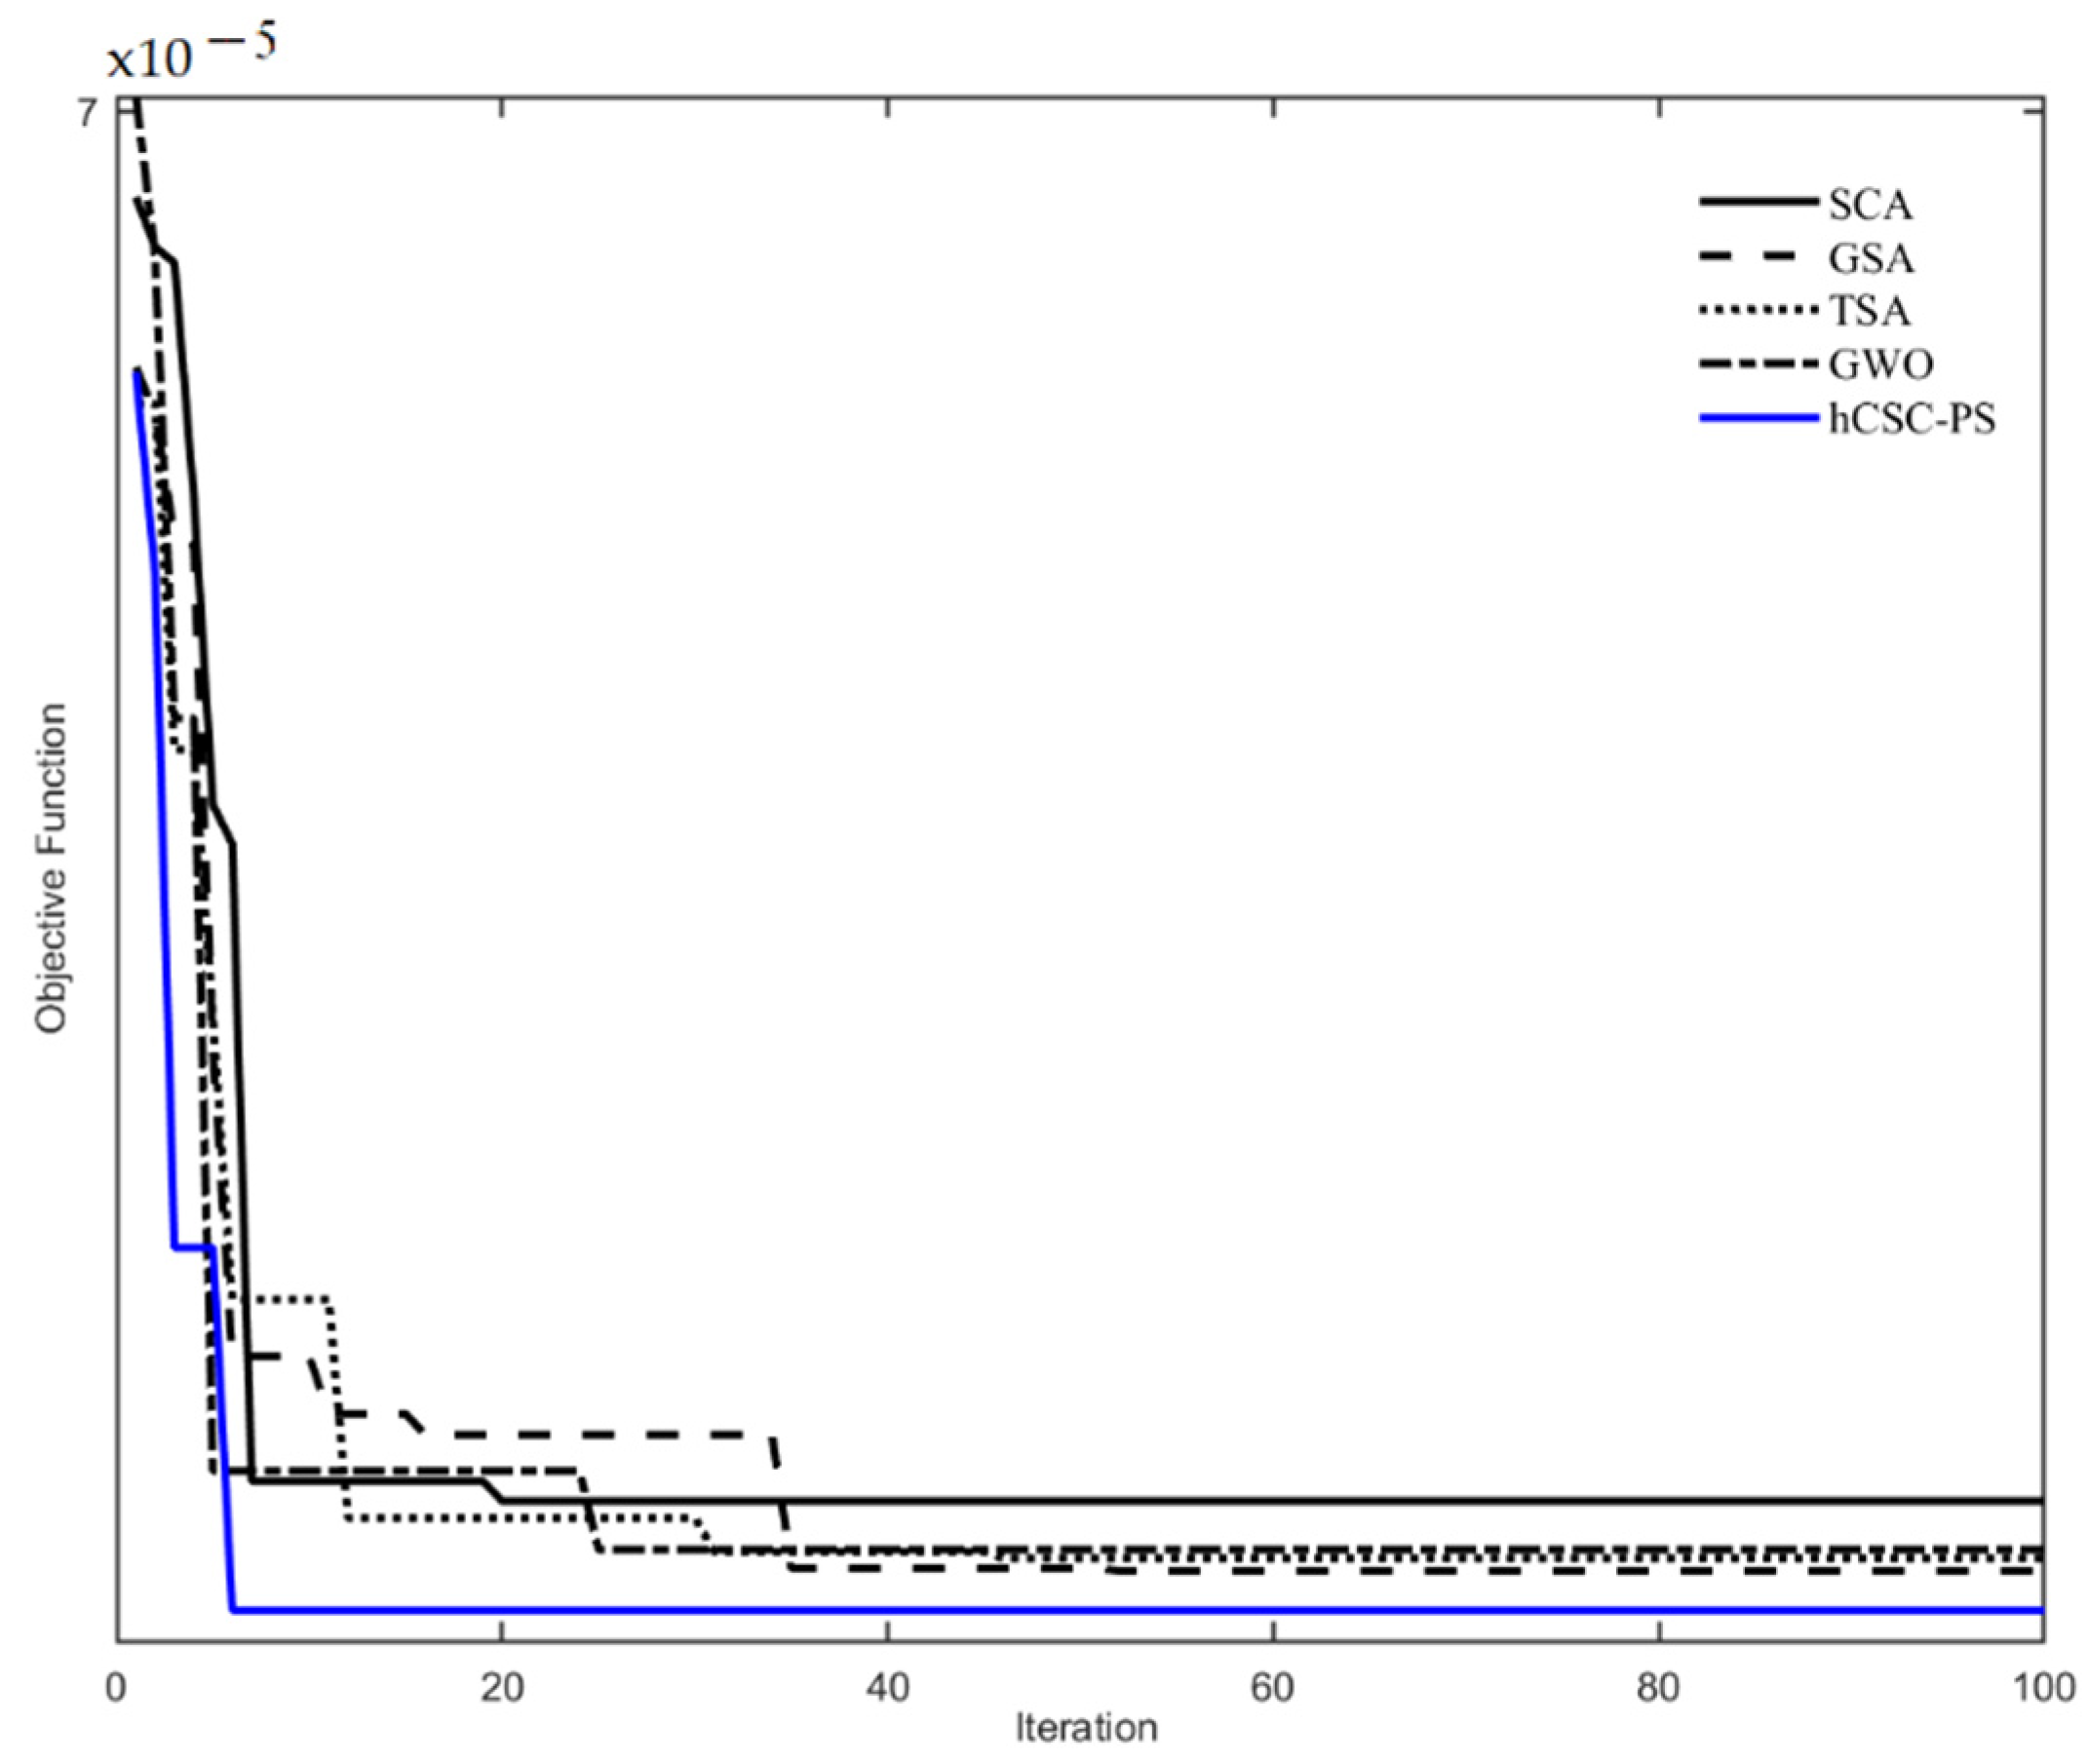
To determine the robustness of the suggested controllers, the parameters of the controllers are also tuned using SCA, TSA, and GSA methods. The values of these parameters are shown in Table 10. Figure 8 depicts the rate of convergence for the best controller tuning. By minimizing a time domain objective function with speed deviations, the proposed method is used to solve the problem of controller parameter design in a multi-machine power system. In addition, when a controller is designed with HCSC-PS, GSA, TSA, and SCA, over the simulation period, the speed divergence is calculated, as shown in Figure 9. Note that w12 = w2w1 and w13 = w3w1. The PSS and SVC controllers built by hCSC-PS provide good damping for the study system and have a superior feature than those designed by SCA, GSA, and TSA, as seen in these graphs. Obtained minimum damping ratios are presented in Table 11 for different loading conditions. The higher values of minimum damping ratio depict the higher capability of the controller to damp out the LFOs. As can be seen from Table 11, proposed method give the larger value of minimum damping ratio compared to the other methods. This means that PSS and SVC controllers optimized by hCSC-PS are capable of providing better damping to the LFOs. The damping ratio is a dimensionless parameter which describes how an oscillating comes to rest. The damping ratio describes how rapidly the amplitude of a vibrating system decays with respect to time. By increasing the system damping ratio, the forced oscillation amplitude can be reduced. The damping ratio of the oscillation is defined as:
ξ = σ σ 2 + ω 2

6. Conclusions

In this paper, a novel hybrid optimization algorithm called hCSC-PS is suggested for the simultaneous coordinated design of PSSs and SVC controllers in multi-machine power system. The proposed hCSC-PS combines two search techniques: the chaotic CSA as an effective global optimization, and pattern search as a robust local search method. Firstly, the performance comparison of the proposed hCSC-PS algorithm on a set of benchmark functions reveals that the proposed method outperforms the standard SCA and also other algorithms. Then, the problem is formulated as an optimization problem where the controllers’ parameters are the decision variables of the problem. The enhancement of the system stability is taken into account in the objective function in which the time responses of the speeds’ deviations of machines are involved. Then, the hCSC-PS algorithm is used to optimize the objective function for four operating conditions (representative cases) and severe fault scenarios. The performance and robustness of the proposed controller are assessed on a power network test, frequently used in power system stability studies. Simulation results showed that the proposed coordinated design of PSSs and SVC controllers greatly improved the damping characteristics of power system oscillations, compared to the individual design.

Author Contributions

Conceptualization, M.N.; methodology, M.E.; software, M.E.; validation, M.E., M.N. and S.A.K.; formal analysis, M.E. and S.A.K.; investigation, M.N.; resources, M.E.; data curation, M.E. and M.N.; writing—original draft preparation, M.E. and S.A.K.; writing—review and editing, M.E., S.A.K. and M.N.; visualization, M.E.; supervision, M.E.; project administration, M.E.; funding acquisition, M.N. All authors have read and agreed to the published version of the manuscript.

Funding

This research received no external funding.

Institutional Review Board Statement

Not applicable.

Informed Consent Statement

Not applicable.

Data Availability Statement

The data presented in this study are available on request from the corresponding author.

Conflicts of Interest

The authors declare no conflict of interest.

Appendix A

The dynamics model of power system is given by [58]:

Appendix A.1. Generator

δ i ˙ = ω b ( ω i 1 )
ω i ˙ = 1 M i ( P m i P e i D i ( ω i 1 ) )
E ´ q i ˙ = 1 T d o i ´ ( E f d i ( x ˙ d i x d i ´ ) i d i E q i ´ )
P e i = v d i i d i + v q i i q i

Appendix A.2. Exciter and PSS

E ´ f d i ˙ = 1 T A i ´ ( K A i ( v r e f i v i + u P S S i ) E f d i )
v i = ( v 2 d i + v 2 q i ) 1 / 2
v d i = x q i i q i
v q i = E q i ´ x d i i d i ´
T e i = E q i ´ i q i ( x q i x d i ´ ) i d i i q i

Appendix A.3. SVC- Based Controller

B ˙ S V C = ( K s ( B S V C r e f u S V C ) B S V C ) / T s

Appendix A.4. Linearized Model

[ Δ δ ˙ Δ ω Δ E ˙ q Δ E ˙ f d ] + [ 0 ω 0 I 0 0 M 1 K 1 M 1 D M 1 K 2 0 T d o 1 K 4 0 T d o 1 K 3 T d o 1 T A 1 K A K 5 0 T A 1 K A K 6 T A 1 ] [ Δ δ Δ ω Δ E q Δ E f d ] + [ 0 0 0 M 1 K p B 0 T d o 1 K q B T A 1 K A T A 1 K A K v B ] [ u P S S i Δ B ]
K 1 = P e δ ,   K 2 = P e E q ´ ,   K 3 = E q E q ´ ,   K 4 = E q δ ,   K 5 = v δ ,   K 6 = v E q ´ ,   K p B = P e B ,   K q B = v E q ´ ,   K v B = v B

Appendix B

Table A1. Nomenclature and Abbreviation.
Variables & Abbreviation DescriptionVariables & Abbreviation Description
f(X)Fitness functiondimDimension
g(X)Inequality constraintsSFSize factor
h(X)Equality constraints P m i Mechanical input power
XDimensional vector of design variables P e i Active power
XL & XUBoundary constraintsMMachine inertia
δRotor angleDDamping the coefficient
ωSpeed deviation v r e f i Reference voltage
EqInternal voltages T d o i Open circuit field time constant
EfaField voltages i d i ,   i q i Stator currents in d- and q -axis circuits
uInput control parametersxVector of state variables
tsimtime of simulationyVector of algebraic variables
NNumber of machinesBSVCSusceptance of SVC
MNumber of operating pointsξDamping ratio
KGainFminMinimum value of the objective function
T1–T4Time constantsdimdimension
TWiTime constant of washoutA4n × 4n matrix
x i Placement of ith solution in the search spaceB4n × m matrix
u b i Upper boundsaControl parameter
l b i Lower boundsmPSS and SVC
r3Random number among 0 and 1X4n × 1 state vector
x i t Position of ith solution at iteration tSFSize factor
x B e s t Best solution in the populationPSSPower system stabilizer
r1Random numbers in the range of [0, 2π]SVCStatic VAR compensator
r2Random weight of the best solutionCSCAChaotic sine cosine algorithm
t m a x Maximum number of iterationsPSPattern search
λ (t)Chaotic mapFACTSFlexible AC transmission systems
tIteration numberhCSC-PSHybrid CSCA and PS
aConstant equal to 4LFOLow frequency oscillations
W12Speed difference response of G1–G2SQPSequential quadratic programming
W13Speed difference response of G1–G3SCASine cosine algorithm
K1–K6Linearization constants Kp, Kq, KBLinearization constants

References

  1. Kundur, P.; Balu, N.J.; Lauby, M.G. Power System Stability and Control; McGraw Hill: New York, NY, USA, 1994; p. 7. [Google Scholar]
  2. Hingorani, N.G. FACTS-flexible AC transmission system. In International Conference on AC and DC Power Transmission; IET: London, UK, 1991; pp. 1–7. [Google Scholar]
  3. Eslami, M.; Shareef, H.; Mohamed, A.; Khajehzadeh, M. A Survey on Flexible AC Transmission Systems (FACTS). Przeglad Elektrotechniczny 2012, 88, 1–11. [Google Scholar]
  4. Chen, J.-H.; Lee, W.-J.; Chen, M.-S. Using a static var compensator to balance a distribution system. In Proceedings of the IAS’96 Conference Record of the 1996 IEEE Industry Applications Conference Thirty-First IAS Annual Meeting, San Diego, CA, USA, 6–10 October 1996; IEEE: Piscataway, NJ, USA, 1996; pp. 2321–2326. [Google Scholar]
  5. Anderson, P.M.; Fouad, A.A. Power System Control and Stability; John Wiley & Sons: Hoboken, NJ, USA, 2008. [Google Scholar]
  6. Noroozian, M.; Adersson, G. Damping of power system oscillations by use of controllable components. IEEE Trans. Power Deliv. 1994, 9, 2046–2054. [Google Scholar] [CrossRef]
  7. Eslami, M.; Shareef, H.; Khajehzadeh, M. Optimal design of damping controllers using a new hybrid artificial bee colony algorithm. Int. J. Electr. Power Energy Syst. 2013, 52, 42–54. [Google Scholar] [CrossRef]
  8. Khajehzadeh, M.; Taha, M.R.; El-Shafie, A.; Eslami, M. Search for critical failure surface in slope stability analysis by gravitational search algorithm. Int. J. Phys. Sci. 2011, 6, 5012–5021. [Google Scholar]
  9. Talaat, M.; Hatata, A.; Alsayyari, A.S.; Alblawi, A. A smart load management system based on the grasshopper optimization algorithm using the under-frequency load shedding approach. Energy 2020, 190, 116423. [Google Scholar] [CrossRef]
  10. Talaat, M.; Farahat, M.; Mansour, N.; Hatata, A. Load forecasting based on grasshopper optimization and a multilayer feed-forward neural network using regressive approach. Energy 2020, 196, 117087. [Google Scholar] [CrossRef]
  11. Talaat, M.; Said, T.; Essa, M.A.; Hatata, A. Integrated MFFNN-MVO approach for PV solar power forecasting considering thermal effects and environmental conditions. Int. J. Electr. Power Energy Syst. 2022, 135, 107570. [Google Scholar] [CrossRef]
  12. Rana, M.J.; Shahriar, M.S.; Shafiullah, M. Levenberg–Marquardt neural network to estimate UPFC-coordinated PSS parameters to enhance power system stability. Neural Comput. Appl. 2019, 31, 1237–1248. [Google Scholar] [CrossRef]
  13. Shafiullah, M.; Abido, M.; Coelho, L. Design of robust PSS in multimachine power systems using backtracking search algorithm. In Proceedings of the 2015 18th International Conference on Intelligent System Application to Power Systems (ISAP), Porto, Portugal, 11–16 September 2015; IEEE: Piscataway, NJ, USA, 2015; pp. 1–6. [Google Scholar]
  14. Firouz, M.H.; Ghadimi, N. Concordant controllers based on FACTS and FPSS for solving wide-area in multi-machine power system. J. Intell. Fuzzy Syst. 2016, 30, 845–859. [Google Scholar] [CrossRef]
  15. Farah, A.; Guesmi, T.; Abdallah, H.H.; Ouali, A. A novel chaotic teaching–learning-based optimization algorithm for multi-machine power system stabilizers design problem. Int. J. Electr. Power Energy Syst. 2016, 77, 197–209. [Google Scholar] [CrossRef]
  16. Abd-Elazim, S.; Ali, E. Coordinated design of PSSs and SVC via bacteria foraging optimization algorithm in a multimachine power system. Int. J. Electr. Power Energy Syst. 2012, 41, 44–53. [Google Scholar] [CrossRef]
  17. Choudhury, S.; Dash, T. Modified brain storming optimization technique for transient stability improvement of SVC controller for a two machine system. World J. Eng. 2021, 18, 841–850. [Google Scholar] [CrossRef]
  18. Guesmi, T.; Alshammari, B.M.; Almalaq, Y.; Alateeq, A.; Alqunun, K. New Coordinated Tuning of SVC and PSSs in Multimachine Power System Using Coyote Optimization Algorithm. Sustainability 2021, 13, 3131. [Google Scholar] [CrossRef]
  19. Kamarposhti, M.A.; Colak, I.; Iwendi, C.; Band, S.S.; Ibeke, E. Optimal Coordination of PSS and SSSC Controllers in Power System Using Ant Colony Optimization Algorithm. J. Circuits Syst. Comput. 2021, 2250060. [Google Scholar] [CrossRef]
  20. Baadji, B.; Bentarzi, H.; Bakdi, A. Comprehensive learning bat algorithm for optimal coordinated tuning of power system stabilizers and static VAR compensator in power systems. Eng. Optim. 2020, 52, 1761–1779. [Google Scholar] [CrossRef]
  21. Abido, M.; Abdel-Magid, Y. Coordinated design of a PSS and an SVC-based controller to enhance power system stability. Int. J. Electr. Power Energy Syst. 2003, 25, 695–704. [Google Scholar] [CrossRef]
  22. Kamari, N.A.M.; Musirin, I.; Ibrahim, A.A. Swarm intelligence approach for angle stability improvement of PSS and SVC-based SMIB. J. Electr. Eng. Technol. 2020, 15, 1001–1014. [Google Scholar] [CrossRef]
  23. Abdelaziz, A.Y.; Ali, E.S. Static VAR compensator damping controller design based on flower pollination algorithm for a multi-machine power system. Electr. Power Compon. Syst. 2015, 43, 1268–1277. [Google Scholar] [CrossRef]
  24. Eslami, M.; Shareef, H.; Mohamed, A.; Khajehzadeh, M. PSS and TCSC damping controller coordinated design using GSA. Energy Procedia 2012, 14, 763–769. [Google Scholar] [CrossRef] [Green Version]
  25. Eslami, M.; Shareef, H.; Mohamed, A.; Khajehzadeh, M. Gravitational search algorithm for coordinated design of PSS and TCSC as damping controller. J. Cent. South Univ. 2012, 19, 923–932. [Google Scholar] [CrossRef]
  26. Kar, M.K.; Kumar, S.; Singh, A.K.; Panigrahi, S. A modified sine cosine algorithm with ensemble search agent updating schemes for small signal stability analysis. Int. Trans. Electr. Energy Syst. 2021, 31, e13058. [Google Scholar] [CrossRef]
  27. Bhukya, J.; Naidu, T.A.; Vuddanti, S.; Konstantinou, C. Coordinated control and parameters optimization for PSS, POD and SVC to enhance the transient stability with the integration of DFIG based wind power systems. Int. J. Emerg. Electr. Power Syst. 2021. [Google Scholar] [CrossRef]
  28. Pandey, R.K.; Gupta, D.K. Performance evaluation of power oscillation damping controller—Firefly algorithm based parameter tuning. Electr. Power Compon. Syst. 2017, 45, 2164–2174. [Google Scholar] [CrossRef]
  29. Panda, S. Robust coordinated design of multiple and multi-type damping controller using differential evolution algorithm. Int. J. Electr. Power Energy Syst. 2011, 33, 1018–1030. [Google Scholar] [CrossRef]
  30. Karthikeyan, K.; Lakshmi, P. Optimal design of PID controller for improving rotor angle stability using BBO. Procedia Eng. 2012, 38, 889–902. [Google Scholar] [CrossRef] [Green Version]
  31. Abd Elazim, S.; Ali, E. Optimal power system stabilizers design via cuckoo search algorithm. Int. J. Electr. Power Energy Syst. 2016, 75, 99–107. [Google Scholar] [CrossRef]
  32. Naresh, G.; Raju, M.R.; Narasimham, S. Coordinated design of power system stabilizers and TCSC employing improved harmony search algorithm. Swarm Evol. Comput. 2016, 27, 169–179. [Google Scholar] [CrossRef]
  33. Afzalan, E.; Joorabian, M. Analysis of the simultaneous coordinated design of STATCOM-based damping stabilizers and PSS in a multi-machine power system using the seeker optimization algorithm. Int. J. Electr. Power Energy Syst. 2013, 53, 1003–1017. [Google Scholar] [CrossRef]
  34. Bijami, E.; Marnani, J.A. Imperialist Competitive Algorithm for Optimal Simultaneous Coordinated Tuning of Damping Controller. Int. J. Tech. Phys. Probl. Eng. (IJTPE) 2012, 11, 34–41. [Google Scholar]
  35. Devarapalli, R.; Bhattacharyya, B. Application of modified harris hawks optimization in power system oscillations damping controller design. In Proceedings of the 2019 8th International Conference on Power Systems (ICPS), Jaipur, India, 20–22 December 2019; IEEE: Piscataway, NJ, USA, 2019; pp. 1–6. [Google Scholar]
  36. Eslami, M.; Babaei, B.; Shareef, H.; Khajehzadeh, M.; Arandian, B. Optimum Design of Damping Controllers using modified Sperm Swarm Optimization. IEEE Access 2021, 9, 145592–145604. [Google Scholar]
  37. Abido, M.; Abdel-Magid, Y. A tabu search based approach to power system stability enhancement via excitation and static phase shifter control. Electr. Power Syst. Res. 1999, 52, 133–143. [Google Scholar] [CrossRef]
  38. Abido, M. Simulated annealing based approach to PSS and FACTS based stabilizer tuning. Int. J. Electr. Power Energy Syst. 2000, 22, 247–258. [Google Scholar] [CrossRef]
  39. Dhal, P. Multi-verse Optimizer for Dynamic Stability Analysis Using STATCOM and Power System Stabilizer. Advanced Computing and Intelligent Engineering: Proceedings of ICACIE 2018; Springer Nature Singapore Pte Ltd.: Singapore, 2020; Volume 2, p. 117. [Google Scholar]
  40. Devarapalli, R.; Bhattacharyya, B.; Kumar, V.; Kumar, S. Improved Moth Flame Optimization in Systematization of STATCOM and PSS. In Smart Grid Automation and Industry 4.0. Lecture Notes in Electrical Engineering; Springer: Singapore, 2021; Volume 693, pp. 481–491. [Google Scholar] [CrossRef]
  41. Aribowo, W.; Muslim, S.; Suprianto, B.; Haryudo, S.I. Tunicate Swarm Algorithm-Neural Network for Adaptive Power System Stabilizer Parameter. Sci. Technol. Asia 2021, 26, 50–63. [Google Scholar]
  42. Dey, P.; Bhattacharya, A.; Das, P. Tuning of power system stabilizer for small signal stability improvement of interconnected power system. Appl. Comput. Inform. 2017, 16, 3–28. [Google Scholar] [CrossRef]
  43. Asghari, K.; Masdari, M.; Gharehchopogh, F.S.; Saneifard, R. Multi-swarm and chaotic whale-particle swarm optimization algorithm with a selection method based on roulette wheel. Expert Syst. 2021, 38, e12779. [Google Scholar] [CrossRef]
  44. Farah, A.; Belazi, A.; Alqunun, K.; Almalaq, A.; Alshammari, B.M.; Ben Hamida, M.B.; Abbassi, R. A New Design Method for Optimal Parameters Setting of PSSs and SVC Damping Controllers to Alleviate Power System Stability Problem. Energies 2021, 14, 7312. [Google Scholar] [CrossRef]
  45. Sahu, P.R.; Hota, P.K.; Panda, S. Modified whale optimization algorithm for coordinated design of fuzzy lead-lag structure-based SSSC controller and power system stabilizer. Int. Trans. Electr. Energy Syst. 2019, 29, e2797. [Google Scholar] [CrossRef]
  46. Eslami, M.; Shareef, H.; Mohamed, A.; Khajehzadeh, M. Optimal location of PSS using improved PSO with chaotic sequence. In Proceedings of the International Conference on Electrical, Control and Computer Engineering 2011 (InECCE), Kuantan, Malaysia, 21–22 June 2011; IEEE: Piscataway, NJ, USA, 2011; pp. 253–258. [Google Scholar]
  47. Khajehzadeh, M.; Taha, M.R.; Eslami, M. A new hybrid firefly algorithm for foundation optimization. Natl. Acad. Sci. Lett. 2013, 36, 279–288. [Google Scholar] [CrossRef]
  48. Eslami, M.; Shareef, H.; Mohamed, A. Optimization and coordination of damping controls for optimal oscillations damping in multi-machine power system. Int. Rev. Electr. Eng. 2011, 6, 1984–1993. [Google Scholar]
  49. Mirjalili, S. SCA: A sine cosine algorithm for solving optimization problems. Knowl.-Based Syst. 2016, 96, 120–133. [Google Scholar] [CrossRef]
  50. Abualigah, L.; Diabat, A. Advances in sine cosine algorithm: A comprehensive survey. Artif. Intell. Rev. 2021, 54, 2567–2608. [Google Scholar] [CrossRef]
  51. Ji, Y.; Tu, J.; Zhou, H.; Gui, W.; Liang, G.; Chen, H.; Wang, M. An adaptive chaotic sine cosine algorithm for constrained and unconstrained optimization. Complexity 2020, 2020, 6084917. [Google Scholar] [CrossRef]
  52. Wolpert, D.H.; Macready, W.G. No free lunch theorems for optimization. IEEE Trans. Evol. Comput. 1997, 1, 67–82. [Google Scholar] [CrossRef] [Green Version]
  53. Torczon, V. On the convergence of pattern search algorithms. SIAM J. Optim. 1997, 7, 1–25. [Google Scholar] [CrossRef]
  54. Rashedi, E.; Nezamabadi-Pour, H.; Saryazdi, S. GSA: A gravitational search algorithm. Inf. Sci. 2009, 179, 2232–2248. [Google Scholar] [CrossRef]
  55. Kaur, S.; Awasthi, L.K.; Sangal, A.; Dhiman, G. Tunicate swarm algorithm: A new bio-inspired based metaheuristic paradigm for global optimization. Eng. Appl. Artif. Intell. 2020, 90, 103541. [Google Scholar] [CrossRef]
  56. Mirjalili, S.; Mirjalili, S.M.; Lewis, A. Grey wolf optimizer. Adv. Eng. Softw. 2014, 69, 46–61. [Google Scholar] [CrossRef] [Green Version]
  57. Pai, M.; Gupta, D.S.; Padiyar, K. Small Signal Analysis of Power Systems; Alpha Science Int’l Ltd.: Oxford, UK, 2004. [Google Scholar]
  58. Sadikovic, R.; Andersson, G.; Korba, P. Damping controller design for power system oscillations. Intell. Autom. Soft Comput. 2006, 12, 51–62. [Google Scholar] [CrossRef]
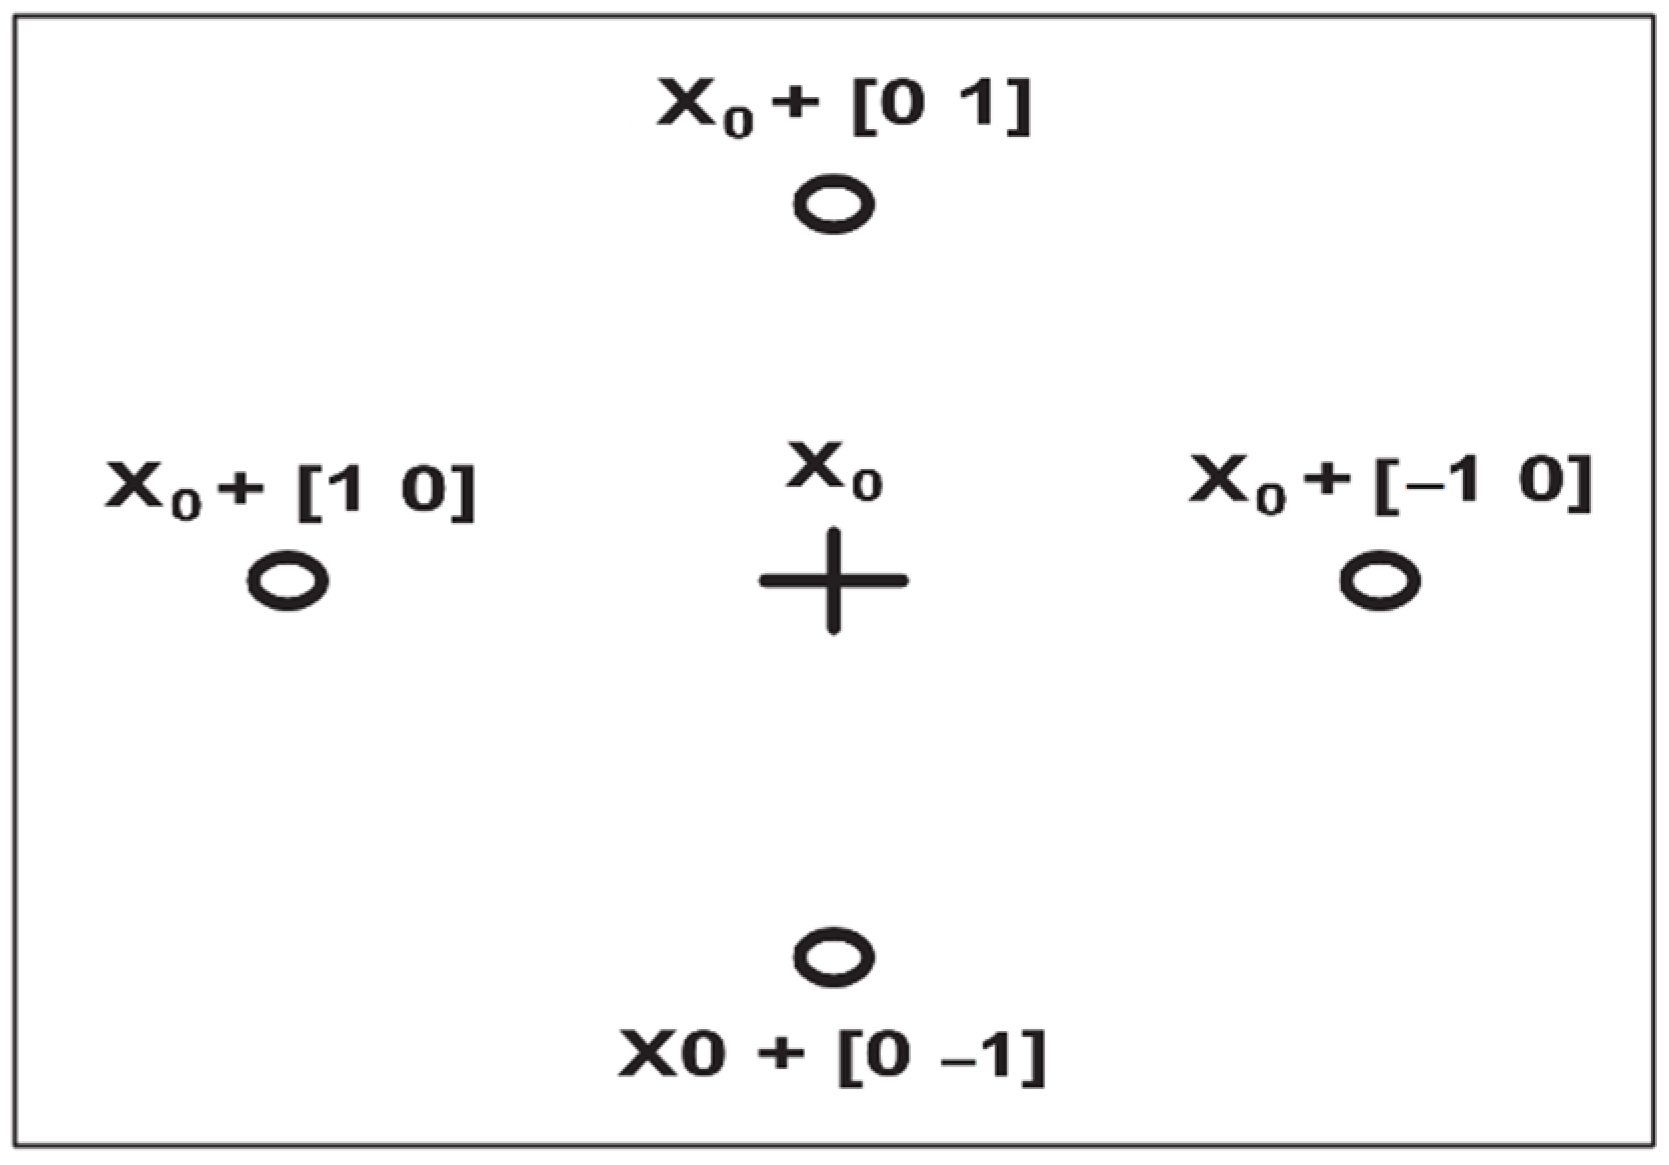
Figure 1. Pattern search mesh points with pattern.
Sustainability 14 00541 g001
Figure 2. The flowchart of the proposed hCSC-PS algorithm.
Sustainability 14 00541 g002
Figure 3. Lead/Lag PSS.
Sustainability 14 00541 g003
Figure 4. Modeling the SVC.
Sustainability 14 00541 g004
Figure 5. SVC with lead–lag controller.
Sustainability 14 00541 g005
Figure 6. 3-machine, 9-bus power system from WSCC.
Sustainability 14 00541 g006
Figure 7. Speed deviation response for various loading conditions. (a) Normal case scenario 1; (b) Case 1 under scenario 2; (c) Case 2 under scenario 1; (d) Case 3 under scenario 2.
Sustainability 14 00541 g007aSustainability 14 00541 g007b
Figure 8. Fitness Convergence with hCSC-PS, GSA, TSA, GWO, SCA.
Sustainability 14 00541 g008
Figure 9. Speed deviation response for various loading conditions. (a) Normal Case under scenario 1; (b) Case 1 under scenario 2; (c) Case 2 under scenario 1; (d) Case 3 under scenario 2.
Sustainability 14 00541 g009aSustainability 14 00541 g009b
Table 1. Description of unimodal benchmark functions.
FunctionRange f m i n n (Dim)3D View
F 1 ( X ) = i = 1 n x i 2 [ 100 ,   100 ] n 030 Sustainability 14 00541 i001
F 2 ( X ) = i = 1 n | x i | + i = 1 n | x i | [ 10 ,   10 ] n 030 Sustainability 14 00541 i002
F 3 ( X ) = i = 1 n ( j = 1 i x j ) 2 [ 100 ,   100 ] n 030 Sustainability 14 00541 i003
F 4 ( X ) = max i   { | x i | .   1 i n   } [ 100 ,   100 ] n 030 Sustainability 14 00541 i004
F 5 ( X ) = i = 1 n 1 [ 100 ( x i + 1 x i 2 ) 2 + ( x i 1 ) 2 ] [ 30 ,   30 ] n 030 Sustainability 14 00541 i005
F 6 ( X ) = i = 1 n ( [ x i + 0.5 ] ) 2 [ 100 ,   100 ] n 030 Sustainability 14 00541 i006
F 7 ( X ) = i = 1 n i x i 4 + r a n d o m [ 0.1 ) [ 1.28 ,   1.28 ] n 030 Sustainability 14 00541 i007
Table 2. Description of multimodal benchmark functions.
FunctionRange f m i n n (Dim)3D View
F 8 ( X ) = i = 1 n x i sin ( | x i | ) [ 500 ,   500 ] n 428.9829 × n30 Sustainability 14 00541 i008
F 9 ( X ) = i = 1 n [ x i 2 10 cos ( 2 π x i ) + 10 ] [ 5.12 ,   5.12 ] n 030 Sustainability 14 00541 i009
F 10 ( X ) = 20   exp ( 0.2 1 n i = 1 n x i 2 ) e x p ( 1 n i = 1 n cos ( 2 π x i ) ) + 20 + e           [ 32 ,   32 ] n 030 Sustainability 14 00541 i010
F 11 ( X ) = 1 4000 i = 1 n x i 2 i = 1 n cos ( x i i ) + 1 [ 600 ,   600 ] n 030 Sustainability 14 00541 i011
F 12 ( X ) = π n { 10 sin ( π y 1 ) + i = 1 n 1 ( y i 1 ) 2 [ 1 + 10 sin 2 ( π y i + 1 ) ] + ( y n 1 ) 2 } + i = 1 n u ( x i .   10 .   100 .   4 ) y i = 1 + x i + 4 4 u ( x i . a .   k .   m ) = { k ( x i a ) m x i > a 0 a < x i < a k ( x i a ) m x i < a [ 50 ,   50 ] n 030 Sustainability 14 00541 i012
F 13 ( X ) = 0.1 { sin 2 ( 3 π x 1 ) + i = 1 n ( x i 1 ) 2 [ 1 + sin 2 ( 3 π x i + 1 ) ] + ( x n 1 ) 2 [ 1 + sin 2 ( 2 π x n ) ] } + i = 1 n u ( x i .   5 .   100 .   4 ) [ 50 ,   50 ] n 030 Sustainability 14 00541 i013
Table 3. Description of fixed-dimension multimodal benchmark functions.
FunctionRange f m i n n (Dim)3D View
F 14 ( X ) = ( 1 500 + j = 1 25 1 j + ( x i a i j ) 6 ) 1 [ 65.53 ,   65.53 ] 2 12 Sustainability 14 00541 i014
F 15 ( X ) = i = 1 11 [ a i x 1 ( b i 2 + b i x 2 ) b i 2 + b i x 3 + x 4 ] 2 [ 5 ,   5 ] 4 0.000304 Sustainability 14 00541 i015
F 16 ( X ) = 4 x 1 2 2.1 x 1 4 + 1 3 x 1 6 + x 1 x 2 4 x 2 2 + 4 x 2 4 [ 5 ,   5 ] 2 −1.03162 Sustainability 14 00541 i016
F 17 ( X ) = ( x 2 5.1 4 π 2 x 1 2 + 5 π x 1 6 ) 2 + 10 ( 1 1 8 π ) cos x 1 + 10 [ 5 ,   5 ] 2 0.3982 Sustainability 14 00541 i017
F 18 ( X ) = [ 1 + ( x 1 + x 2 + 1 ) 2 ( 19 14 x 1 + 3 x 1 2 14 x 2 + 6 x 1 x 2 + 3 x 2 2 ) ] × [ 30 + ( 2 x 1 3 x 2 ) 2 × ( 18 32 x 1 + 12 x 1 2 + 48 x 2 36 x 1 x 2 + 27 x 2 2 ) ] [ 2 ,   2 ] 2 32 Sustainability 14 00541 i018
F 19 ( X ) = i = 1 4 c i   e x p ( j = 1 3 a i j ( x j p i j ) ) 2 [ 1 ,   3 ] 3 −3.863 Sustainability 14 00541 i019
F 20 ( X ) = i = 1 4 c i   e x p ( j = 1 6 a i j ( x j p i j ) ) 2 [ 0 ,   1 ] 6 −3.326 Sustainability 14 00541 i020
F 21 ( X ) = i = 1 5 [ ( X a i ) ( X a i ) T + c i ] 1 [ 0 ,   10 ] n −10.15324 Sustainability 14 00541 i021
F 22 ( X ) = i = 1 7 [ ( X a i ) ( X a i ) T + c i ] 1 [ 0 ,   10 ] n −10.40284 Sustainability 14 00541 i022
F 23 ( X ) = i = 1 10 [ ( X a i ) ( X a i ) T + c i ] 1 [ 0 ,   10 ] n −10.53634 Sustainability 14 00541 i023
Table 4. Bound setting of the proposed methods.
YearAlgorithmParameterSpecifications
2021hCSC-PSSearch agents
Number of elites
Number of function evaluations
50
2
50,000
2016SCASearch agents
Number of elites
Number of function evaluations
50
2
50,000
2009GSASearch agents
Gravitational constant
Alpha coefficient
Number of function evaluations
50
100
20
50,000
2014GWOSearch agents
Control parameter (a)
Number of function evaluations
50
[2,0]
50,000
2020TSASearch agents
Parameter Pmin
Parameter Pmax
Number of function evaluations
50
1
4
50,000
Table 5. Comparison of other techniques in resolving multimodal test functions in Table 1.
FunctionStatisticshCSC-PSSCAGSATSAGWO
F1Best
Worst
Mean
Median
Std.
0.000
0.000
0.000
0.000
0.000
1.551 × 10⁻⁶
2. 030 × 10−3
2.340 × 10⁻⁵
1.874 × 10⁻⁴
7.929 × 10⁻⁵
1.101 × 10⁻¹⁷
3.186 × 10⁻¹⁷
2.117 × 10⁻¹⁷
2.007 × 10⁻¹⁷
5.815 × 10⁻¹⁷
5.145 × 10−60
1.058 × 10−55
8.215 × 10−55
7.401 × 10−55
2.390 × 10−55
2.391× 10−61
3.564× 10−58
4.116× 10−59
1.153× 10−59
1.123× 10−58
F2Best
Worst
Mean
Median
Std.
0.000
0.000
0.000
0.000
0.000
1.500 × 10⁻⁶
9.830 × 10⁻⁶
1.687 × 10⁻⁶
5.402 × 10⁻⁷
2.304 × 10⁻⁶
1.528 × 10⁻⁸
3.331 × 10⁻⁸
2.393 × 10⁻⁸
2.347 × 10⁻⁸
4.002 × 10⁻⁸
1.119 × 10⁻³⁵
3.281 × 10⁻³²
2.151 × 10⁻³³
3.104 × 10⁻³⁴
6.023 × 10⁻³³
8.362 × 10−36
5.340 × 10⁻³⁴
8.361 × 10⁻³⁵
5.929 × 10⁻³⁵
9.850 × 10⁻³⁵
F3Best
Worst
Mean
Median
Std.
0.000
0.000
0.000
0.000
0.000
7.172 × 10
2.660 × 10³
7.991 × 10²
6.294 × 10²
7.562 × 10²
1.029 × 10²
4.686 × 10²
2.454 × 10²
2.211 × 10²
1.001 × 10²
2.568 × 10⁻³²
2.449 × 10⁻¹⁷
8.174 × 10⁻¹⁹
1.869 × 10⁻²⁴
4.471 × 10⁻¹⁸
1.253 × 10⁻¹⁹
3.557 × 10⁻¹³
1.509 × 10⁻¹⁴
2.074 × 10⁻¹⁷
6.554 × 10⁻¹⁴
F4Best
Worst
Mean
Median
Std.
0.000
0.000
0.000
0.000
0.000
1.161
3.467 × 10
9.208
6.080
8.672
2.230 × 10⁻⁹
5.085 × 10⁻⁹
3.303 × 10⁻⁹
3.200 × 10⁻⁹
7.444 × 10⁻⁹
3.235 × 10⁻⁸
6.342 × 10⁻⁵
1.011 × 10⁻⁵
2.027 × 10⁻⁶
1.692 × 10⁻⁵
9.821 × 10⁻¹⁶
2.441 × 10⁻¹³
1.948 × 10⁻¹⁴
6.381 × 10⁻¹⁵
4.491 × 10⁻¹⁴
F5Best
Worst
Mean
Median
Std.
5.061 × 10⁻¹
8.123× 10⁻¹
7.183× 10⁻¹
7.270× 10⁻¹
1.063× 10⁻¹
2.712 × 10
4.951 × 10
2.911 × 10
2.900 × 10
4.152
2.574 × 10
2.209 × 10²
4.228 × 10
2.617 × 10
4.544 × 10
2.562 × 10
2.954 × 10
2.844 × 10
2.891 × 10
7.619 × 10⁻¹
2.521 × 10
2.872 × 10
2.690 × 10
2.713 × 10
8.408 × 10⁻¹
F6Best
Worst
Mean
Median
Std.
0.000
0.000
0.000
0.000
0.000
3.457
4.843
4.436
4.457
2.850 × 10⁻¹
9.712 × 10⁻¹⁸
8.642 × 10⁻¹⁷
3.097 × 10⁻¹⁷
2.933 × 10⁻¹⁷
6.169 × 10⁻¹⁷
2.054
4.772
3.670
3.561
0.693
2.456 × 10⁻¹
1.291
6.476 × 10⁻¹
7.252 × 10⁻¹
3.053 × 10⁻¹
F7Best
Worst
Mean
Median
Std.
3.305 × 10⁻¹⁰
1.221× 0−14
7.280× 0−16
3.300× 0−10
2.488× 10⁻⁵
4.150 × 10⁻²
3.100 × 10⁻³
4.116 × 10⁻¹
8.780 × 10⁻²
5.010 × 10⁻²
8.100 × 10⁻³
9.620 × 10⁻²
3.370 × 10⁻²
1.220 × 10⁻²
8.800 × 10⁻³
6.710 × 10⁻⁴
3.100 × 10⁻²
4.800 × 10⁻²
5.800 × 10⁻²
7.7266 × 10⁻⁴
1.523 × 10⁻⁴
4.200 × 10⁻²
7.995 × 10⁻⁴
7.069 × 10⁻⁴
4.678 × 10⁻⁴
Table 6. Comparison of other techniques in resolving multimodal test functions in Table 2.
FunctionStatisticshCSC-PSSCAGSATSAGWO
F8Best
Worst
Mean
Median
Std.
−1.100 × 10⁴
−1.001× 10⁴
−1.100× 10⁴
−1.102× 10⁴
1.734× 10²
−5.399 × 10³
−3.432 × 10³
−4.576 × 10³
−3.672 × 10³
3.768 × 10²
−3.627 × 10³
−2.103 × 10³
−2.882 × 10³
−2.846 × 10³
3.754 × 10²
−7.999 × 10³
−5.376 × 10³
−6.412 × 10³
−6.513 × 10³
5.692 × 10²³
−8.917 × 10³
−4.878 × 10³
−6.357 × 10³
−6.426 × 10³
8.524 × 10²³
F9Best
Worst
Mean
Median
Std.
0.000
0.000
0.000
0.000
0.000
1.066 × 10⁻⁶
4.143 × 10
5.969
8.339 × 10⁻⁴
1.124 × 10
8.854
2.788 × 10
1.672 × 10
1.531 × 10
3.204
7.877 × 10
2.949 × 10²
1.014 × 10²
1.096 × 10²
3.387 × 10
0.000
1.105 × 10
8.553 × 10⁻¹
0.000
2.4938
F10Best
Worst
Mean
Median
Std.
8.881 × 10⁻¹⁶
8.881 × 10⁻¹⁶
8.881 × 10⁻¹⁶
8.881 × 10⁻¹⁶
0.000
1.556 × 10⁻⁵
2.121 × 10
1.336 × 10
2.112 × 10
7.977
2.428 × 10⁻⁹
4.582 × 10⁻⁹
4.691 × 10⁻⁹
3.486 × 10⁻⁹
5.133 × 10⁻¹⁰
1.569 × 10⁻¹⁴
4.012
2.409
2.765
1.097
1.560 × 10⁻¹⁴
2.020 × 10⁻¹⁴
1.547 × 10⁻¹⁵
1.459 × 10⁻¹⁴
2.376 × 10⁻¹⁵
F11Best
Worst
Mean
Median
Std.
0.000
0.000
0.000
0.000
0.000
4.348 × 10⁻⁷
7.654 × 10⁻¹
2.148 × 10⁻¹
1.320 × 10⁻²
2.218 × 10⁻¹
1.654
1.028 × 10
4.452
3.565
2.023
0.00
1.090 × 10⁻²
6.700 × 10⁻²
7.200 × 10⁻²
5.700 × 10⁻²
0.000
8.400 × 10⁻²
9.400 × 10⁻³
0.000
4.100 × 10⁻³
F12Best
Worst
Mean
Median
Std.
4.611 × 10⁻³²
4.611× 10⁻³²
4.611× 10⁻³²
4.611× 10⁻³²
1.044× 10−47
2.456 × 10⁻¹
5.632
9.654 × 10⁻¹
4.209 × 10⁻¹
1.144
8.214 × 10⁻²⁰
1.343 × 10⁻¹
4.580 × 10⁻²
1.303 × 10⁻¹⁹
4.230 × 10⁻²
2.876 × 10⁻¹
1.398 × 10
6.094
6.765
3.409
2.540 × 10⁻²
4.200 × 10⁻²
6.640 × 10⁻²
8.290 × 10⁻²
5.010 × 10⁻²
F13Best
Worst
Mean
Median
Std.
1.245 × 10⁻³²
1.000× 10⁻²
5.000 × 10⁻³
1.000× 10⁻²
4.000× 10⁻³
1.945
2.298 × 10
3.541
2.366
3.980
1.354 × 10⁻¹⁸
1.000 × 10⁻²
6.334 × 10⁻⁴
2.109 × 10⁻¹⁸
1.800 × 10⁻²
1.9876
3.2305
1.9976
1.8574
6.436 × 10⁻¹
1.001 × 10⁻¹
1.041
5.283 × 10⁻¹
5.235 × 10⁻¹
3.351 × 10⁻¹
Table 7. Comparison of other techniques in resolving multimodal test functions in Table 3.
FunctionStatisticshCSC-PSSCAGSATSAGWO
F14Best
Worst
Mean
Median
Std.
9.980 × 10⁻¹
9.980 × 10⁻¹
9.980 × 10⁻¹
9.980 × 10⁻¹
1.472 × 10⁻¹¹
9.980 × 10⁻¹
2.982
1.196
9.980 × 10⁻¹
6.054 × 10⁻¹
9.980 × 10⁻¹
8.085
3.621
3.045
2.194
9.980 × 10⁻¹
1.267 × 10
7.665
1.076 × 10
4.884
9.980 × 10⁻¹
1.267× 10
4.131
2.982
4.144
F15Best
Worst
Mean
Median
Std.
3.138 × 10⁻⁴
3.968× 10⁻⁴
3.364 × 10⁻⁴
3.232 × 10⁻⁴
2.458 × 10⁻⁵
3.406 × 10⁻⁴
1.400 × 10⁻²
8.597 × 10⁻⁴
7.309 × 10⁻⁴
3.808 × 10⁻⁴
1.200 × 10⁻²
1.180 × 10⁻¹
2.500 × 10⁻²
2.100 × 10⁻²
1.900 × 10⁻²
3.751 × 10⁻⁴
5.660 × 10⁻²
4.300 × 10⁻²
4.539 × 10⁻⁴
1.160 × 10⁻¹
3.174 × 10⁻⁴
2.040 × 10⁻²
4.400 × 10⁻²
3.075 × 10⁻⁴
8.100 × 10⁻²
F16Best
Worst
Mean
Median
Std.
−1.031
−1.031
−1.031
−1.031
1.859 × 10⁻⁶
−1.031
−1.031
−1.031
−1.031
1.039 × 10⁻⁵
−1.031
−1.031
−1.031
−1.031
5.608 × 10⁻⁵
−1.031
−1.000
−1.030
−1.031
5.800 × 10⁻²
−1.031
−1.031
−1.031
−1.031
4.738 × 10⁻⁹
F17Best
Worst
Mean
Median
Std.
3.979 × 10⁻¹
3.979 × 10⁻¹
3.979 × 10⁻¹
3.979 × 10⁻¹
0.000
3.979 × 10⁻¹
3.992 × 10⁻¹
3.982 × 10⁻¹
3.982 × 10⁻¹
3.488 × 10⁻⁴
3.979 × 10⁻¹
3.979 × 10⁻¹
3.979 × 10⁻¹
3.979 × 10⁻¹
0.000
3.979 × 10⁻¹
3.980 × 10⁻¹
3.979 × 10⁻¹
3.979 × 10⁻¹
1.371 × 10⁻⁵
3.979 × 10⁻¹
3.979 × 10⁻¹
3.979 × 10⁻¹
3.979 × 10⁻¹
1.105 × 10⁻⁶
F18Best
Worst
Mean
Median
Std.
3.000
3.000
3.000
3.000
1.098 × 10⁻¹⁴
3.000
3.000
3.000
3.000
5.349 × 10⁻⁶
3.000
3.000
3.000
3.000
1.592 × 10⁻¹⁵
3.000
8.400 × 10
5.700
3.000
14.7885
3.000
3.000
3.000
3.000
9.505 × 10⁻⁶
F19Best
Worst
Mean
Median
Std.
−3.862
−3.862
−3.862
−3.862
4.186 × 10⁻¹⁶
−3.862
−3.854
−3.875
−3.806
2.800 × 10⁻²
−3.862
−3.862
−3.862
−3.862
2.479 × 10⁻⁵
−3.862
−3.954
−3.062
−3.962
1.500 × 10⁻²
−3.862
−3.954
−3.962
−3.962
2.100 × 10⁻²
F20Best
Worst
Mean
Median
Std.
−3.322
−3.322
−3.322
−3.322
1.355× 10⁻¹⁵
−3.191
−2.048
−3.015
−3.013
1.974 × 10⁻¹
−3.322
−1.855
−2.953
−2.987
2.446 × 10⁻¹
−3.321
−3.088
−3.253
−3.202
6.710 × 10⁻²
−3.322
−3.029
−3.249
−3.262
8.210 × 10⁻²
F21Best
Worst
Mean
Median
Std.
−1.015 × 10
−1015 × 10
−1.015× 10
−1.015 × 10
2.499 × 10⁻¹⁷
−8.137
−8.800 × 10⁻¹
−4.318
−4.905
2.078
−1.015 × 10
−2.682
−6.396
−3.954
3.590
−1.013 × 10
−2.666
−7.287
−7.419
2.859
−1.015 × 10
−5.099
−9.479
−1.015 × 10
1.746
F22Best
Worst
Mean
Median
Std.
−1.040 × 10
−1.040 × 10
−1.040 × 10
−1.040 × 10
5.420 × 10⁻¹⁵
−9.054
−9.064 × 10⁻¹
−5.415
−5.037
1.738
−1.040 × 10
−1.040 × 10
−1.040 × 10
−1.040 × 10
4.661 × 10⁻⁶
−1.039 × 10
−2.748
−7.838
−1.025 × 10
3.184
−1.040 × 10
−5.085
−1.022 × 10
−1.040 × 10
9.723 × 10⁻¹
F23Best
Worst
Mean
Median
Std.
−1.053 × 10
−1.053 × 10
−1.053 × 10
−1.053 × 10
2.485 × 10⁻¹⁸
−9.3851
−3.2531
−5.2925
−5.0398
1.0982
−1.053 × 1.0
−1053 × 10
−1.053 × 10
−1.053 × 10
1.836 × 10⁻¹⁵
−1.051 × 10
−1.675
−7.673
−1.041 × 10
3.7585
−1.053 × 10
−1.053 × 10
−1.053 × 10
−1.053 × 10
2.585 × 10⁻⁴
Table 8. System operating conditions.
GeneratorNormal CaseCase 1Case 2Case 3
P(p.u)Q(p.u)P(p.u)Q(p.u)P(p.u)Q(p.u)P(p.u)Q(p.u)
G11.790.282.111.190.331.121.471.05
G21.650.081.220.572.000.572.010.6
G30.85−0.111.290.381.500.381.50.7
Load
A1.250.542.100.701.500.901.50.9
B0.900.311.810.4501.200.801.20.8
C1.100.251.700.801.000.510.5
Table 9. Optimal parameters obtained by hCSC-PS.
Algorithm KT1T2T3T4
Uncoordinated designPSS120.450.0700.0730.0300.045
PSS219.360.1280.0500.0680.055
SVC65.560.0280.1210.5230.048
Coordinated designPSS124.060.0950.0430.2830.050
PSS215.030.0560.0500.0540.029
SVC25.020.0280.2300.0580.493
Table 10. Optimal parameters obtained by SCA, TSA, and GSA.
Algorithm KT1T2T3T4
Coordinated by SCAPSS120.300.2540.8540.2211.214
PSS217.240.0520.5630.0340.376
SVC36.920.0580.0340.0310.098
Coordinated by TSAPSS118.240.0210.2670.1810.276
PSS226.080.8540.1890.0231.149
SVC18.650.5230.1230.0810.100
Coordinated by GSAPSS125.450.2830.8540.631.312
PSS218.050.0540.5610.1010.734
SVC51.230.0580.0340.0450.087
Table 11. Damping ratio comparison for different loading conditions.
Uncoordinated DesignCoordinated DesignCoordinated by SCACoordinated by TSACoordinated by GSA
Case 10.06960.77790.56540.54120.2524
Case 20.28680.83790.50030.51770.5215
Case 30.21390.76860.45380.44170.5459
Publisher’s Note: MDPI stays neutral with regard to jurisdictional claims in published maps and institutional affiliations.