Article

Stochastic Optimization Method for Energy Storage System Configuration Considering Self-Regulation of the State of Charge

1
School of New Energy, North China Electric Power University, Beijing 102206, China
2
School of Economics and Management, North China Electric Power University, Beijing 102206, China
3
Beijing Key Laboratory of New Energy and Low-Carbon Development, Beijing 102206, China
*
Author to whom correspondence should be addressed.
Sustainability 2022, 14(1), 553; https://doi.org/10.3390/su14010553
Submission received: 15 November 2021 / Revised: 25 December 2021 / Accepted: 27 December 2021 / Published: 5 January 2022
(This article belongs to the Collection Sustainable Electric Power Systems Research)

Abstract

:
Photovoltaic (PV) power generation has developed rapidly in recent years. Owing to its volatility and intermittency, PV power generation has an impact on the power quality and operation of the power system. To mitigate the impact caused by the PV generation, an energy storage (ES) system is applied to the PV plants. The capacity configuration and control strategy based on the stochastic optimization method have become an important research topic. However, the accuracy of the probability distribution model is insufficient and a stochastic optimization method is rarely used in a control strategy. In this paper, a stochastic optimization method for the energy storage system (ESS) configuration considering the self-regulation of the battery state of charge (SoC) is proposed. Firstly, to reduce the sampling error when typical scenarios of PV power are generated, a time-divided probability distribution model of the ultra-short-term predicted error of PV power is established. On this basis, to solve the problem that SoC reaches the threshold frequently, a self-regulation model of the SoC based on multiple scenarios is established, which can regulate the SoC according to rolling PV power prediction. A stochastic optimization configuration model of the energy storage system is constructed, which can reduce the impact of PV uncertainty on the configuration result. Finally, the proposed stochastic optimization method is validated. The fitting error of the time-divided probability distribution model is 15.61% lower than that of the t-distribution. The expected revenue of the optimal configuration in this paper is 8.86% higher than the scheme with a fixed probability distribution model, and 16.87% higher than without considering the stochastic optimization method.

1. Introduction

In the context of energy and environmental challenges becoming one of the world’s key problems, renewable energy is receiving an increasing amount of attention and research [1]. The development of renewable energy is of great significance to the world’s sustainability. Photovoltaic (PV) power generation is an essential component of renewable energy generation that has grown quickly in recent years [2,3]. Its application contributes a lot to the sustainability of energy development and utilization. PV is also an important way to reduce greenhouse gas emissions.
PV power generation is influenced by weather conditions and is characterized by volatility and intermittency. As the penetration of PV power generation increases, it will bring new challenges to the power grid, such as PV consumption, power quality, and so on [4,5]. As a device with flexible regulation capability, electrochemical energy storage (ES) serves an important supporting function for wind and PV power, and has been employed more frequently in recent years in the wind farms, the PV stations, and the customer side.
The application of energy storage also has many restrictions, and the cost is one of the main factors impeding the application of electrochemical energy storage [6,7]. Therefore, in the application of the PV-ES system, how to choose the appropriate storage capacity has become a major issue of research. Many academics have studied the optimal configuration of energy storage. The energy storage system (ESS) serves a variety of purposes, including smoothing the PV power fluctuations [8,9]. The literature [8] takes the maximum benefit as the goal and investigates the restriction relationship between grid frequency regulation and energy storage to optimize the configuration of energy storage to produce the optimal smoothing effect. The literature [9] takes the minimum active power fluctuation as the objective function, and proposes an optimization model for the charging and discharging of the energy storage unit of the wind-PV combined system. In literature [10], the statistical methodology was used to optimize the configuration of the energy storage system to smooth out the PV power fluctuations. In literature [11], an optimal configuration of a hybrid energy storage system for smoothing fluctuations of PV in a microgrid was carried out.
However, the above types of research do not consider the PV prediction in the process of smoothing PV power fluctuations and the calculation time of the control strategy is lengthy [11]. Research of control strategies for the PV-ES system and the configuration of energy storage systems based on the prediction of renewable energy or load is critical to improving the system’s economy [12]. In literature [13], the energy balancing using charge/discharge storage control based on the load prediction is investigated. The effect is related to the predicted accuracy. As a result, this paper takes PV ultra-short-term prediction into account to provide a basis for generating typical scenarios. The scenario in this paper refers to the power curve created by sampling the probability distribution model. In literature [14], the dynamic programming is used to solve the energy management problem in the smart islands. The disadvantage of dynamic programming is that it does not have a unified model. In the paper, the probability distribution models and scenarios in each stage or cycle of this paper are different.
Furthermore, different charging and discharging strategies of the energy storage system will affect the life of the energy storage batteries and the configuration results. A battery dynamic model is proposed in literature [15], while the cycle life model is not investigated. The relationship between the cycle life and discharging depth are important to evaluate the battery degradation. In literature [16], the “rain flow counting” algorithm is used to investigate the impact of PV fluctuation on the energy storage cycle-life. Compared to used electric vehicle batteries [17] in a PV-ES system, a model that considers battery degradation will not only improve the overall system economics, but will also minimize the degradation rate of energy storage batteries. For the state of charge mode, the Volterra model is used in literature [13,18]. Instead of the integral form of the Volterra model, the linear discrete model is used in this paper.
The above literature employs deterministic methods to investigate the optimal configuration of energy storage systems. However, the uncertainty of PV power generation will affect the optimization results [19]. A stochastic optimization approach based on multi-scenario theory is important to reduce the impact of uncertainty [20]. The method has been applied to solve problems such as finding the optimal location of wind power transmission channel drop-off sites and stochastic unit combinations [20], microgrid operation [21], and the integrated energy system operation [22]. The advantage of a multi-scenario based method that is the expected value method is handling stochastic optimization problem more easily than chance-constrained programming. In literature [23], the stochastic optimization of integrated energy systems was investigated based on a multi-scenario stochastic optimization approach, taking into account the uncertainty of wind and solar energy resources. The literature [24] investigated the multi-objective stochastic optimal operation of integrated energy systems based on a multi-scenario approach, and the results revealed that the approach outperformed the deterministic approach. The probability distribution models used in the aforementioned literature for generating scenarios are all single probability distribution models, while the uniform model for sampling at different periods will result in high sampling errors, affecting the final optimization results.
In literature [25], a typical normal fuzzy cloud model is used to handle the uncertainty of the wind power. By contrast with the wind power, the PV power has obvious periodicity. The power in the morning and noon are different, apparently. Therefore, building the time-divided probability distribution model is necessary, which is adopted in this paper.
To solve the aforementioned problems, this paper proposes a stochastic optimization method for energy storage systems that considers the battery state of charge self-regulation. The following are the key findings and contributions of this paper:
(1)
The time-divided probability distribution models for the ultra-short-term predicted error of PV power are established. Compared with the model in [21,25], this model can handle the random variable with different distribution characteristics in different periods. Several typical scenarios of PV power generation are generated based on this model. The sampling error is smaller and the statistical characteristics of sampling data are more consistent with the actual data.
(2)
This paper constructs an expected value model for the SoC self-regulation control strategy and the optimal configuration model, which takes into account the rolling power prediction and the uncertainty of PV power. The revenue of operation and configuration are higher than other methods.
(3)
The SoC self-regulation model and optimization configuration model considered the cycle life degradation of the battery. This consideration can delay the cycle life degradation and reduce degradation costs by regulating the battery’s SoC. The results also reveal that the revenue is improved.
The rest of the paper are arranged as follows: Section 2 explains the framework of the ESS optimization configuration method. Section 3 introduces the ultra-short-term predicted error scenarios. Section 4 introduces the stochastic optimization method. Section 5 introduces the results and analysis. The conclusion of this paper is given in Section 6.

2. Framework of the Energy Storage System (ESS) Optimization Configuration Method

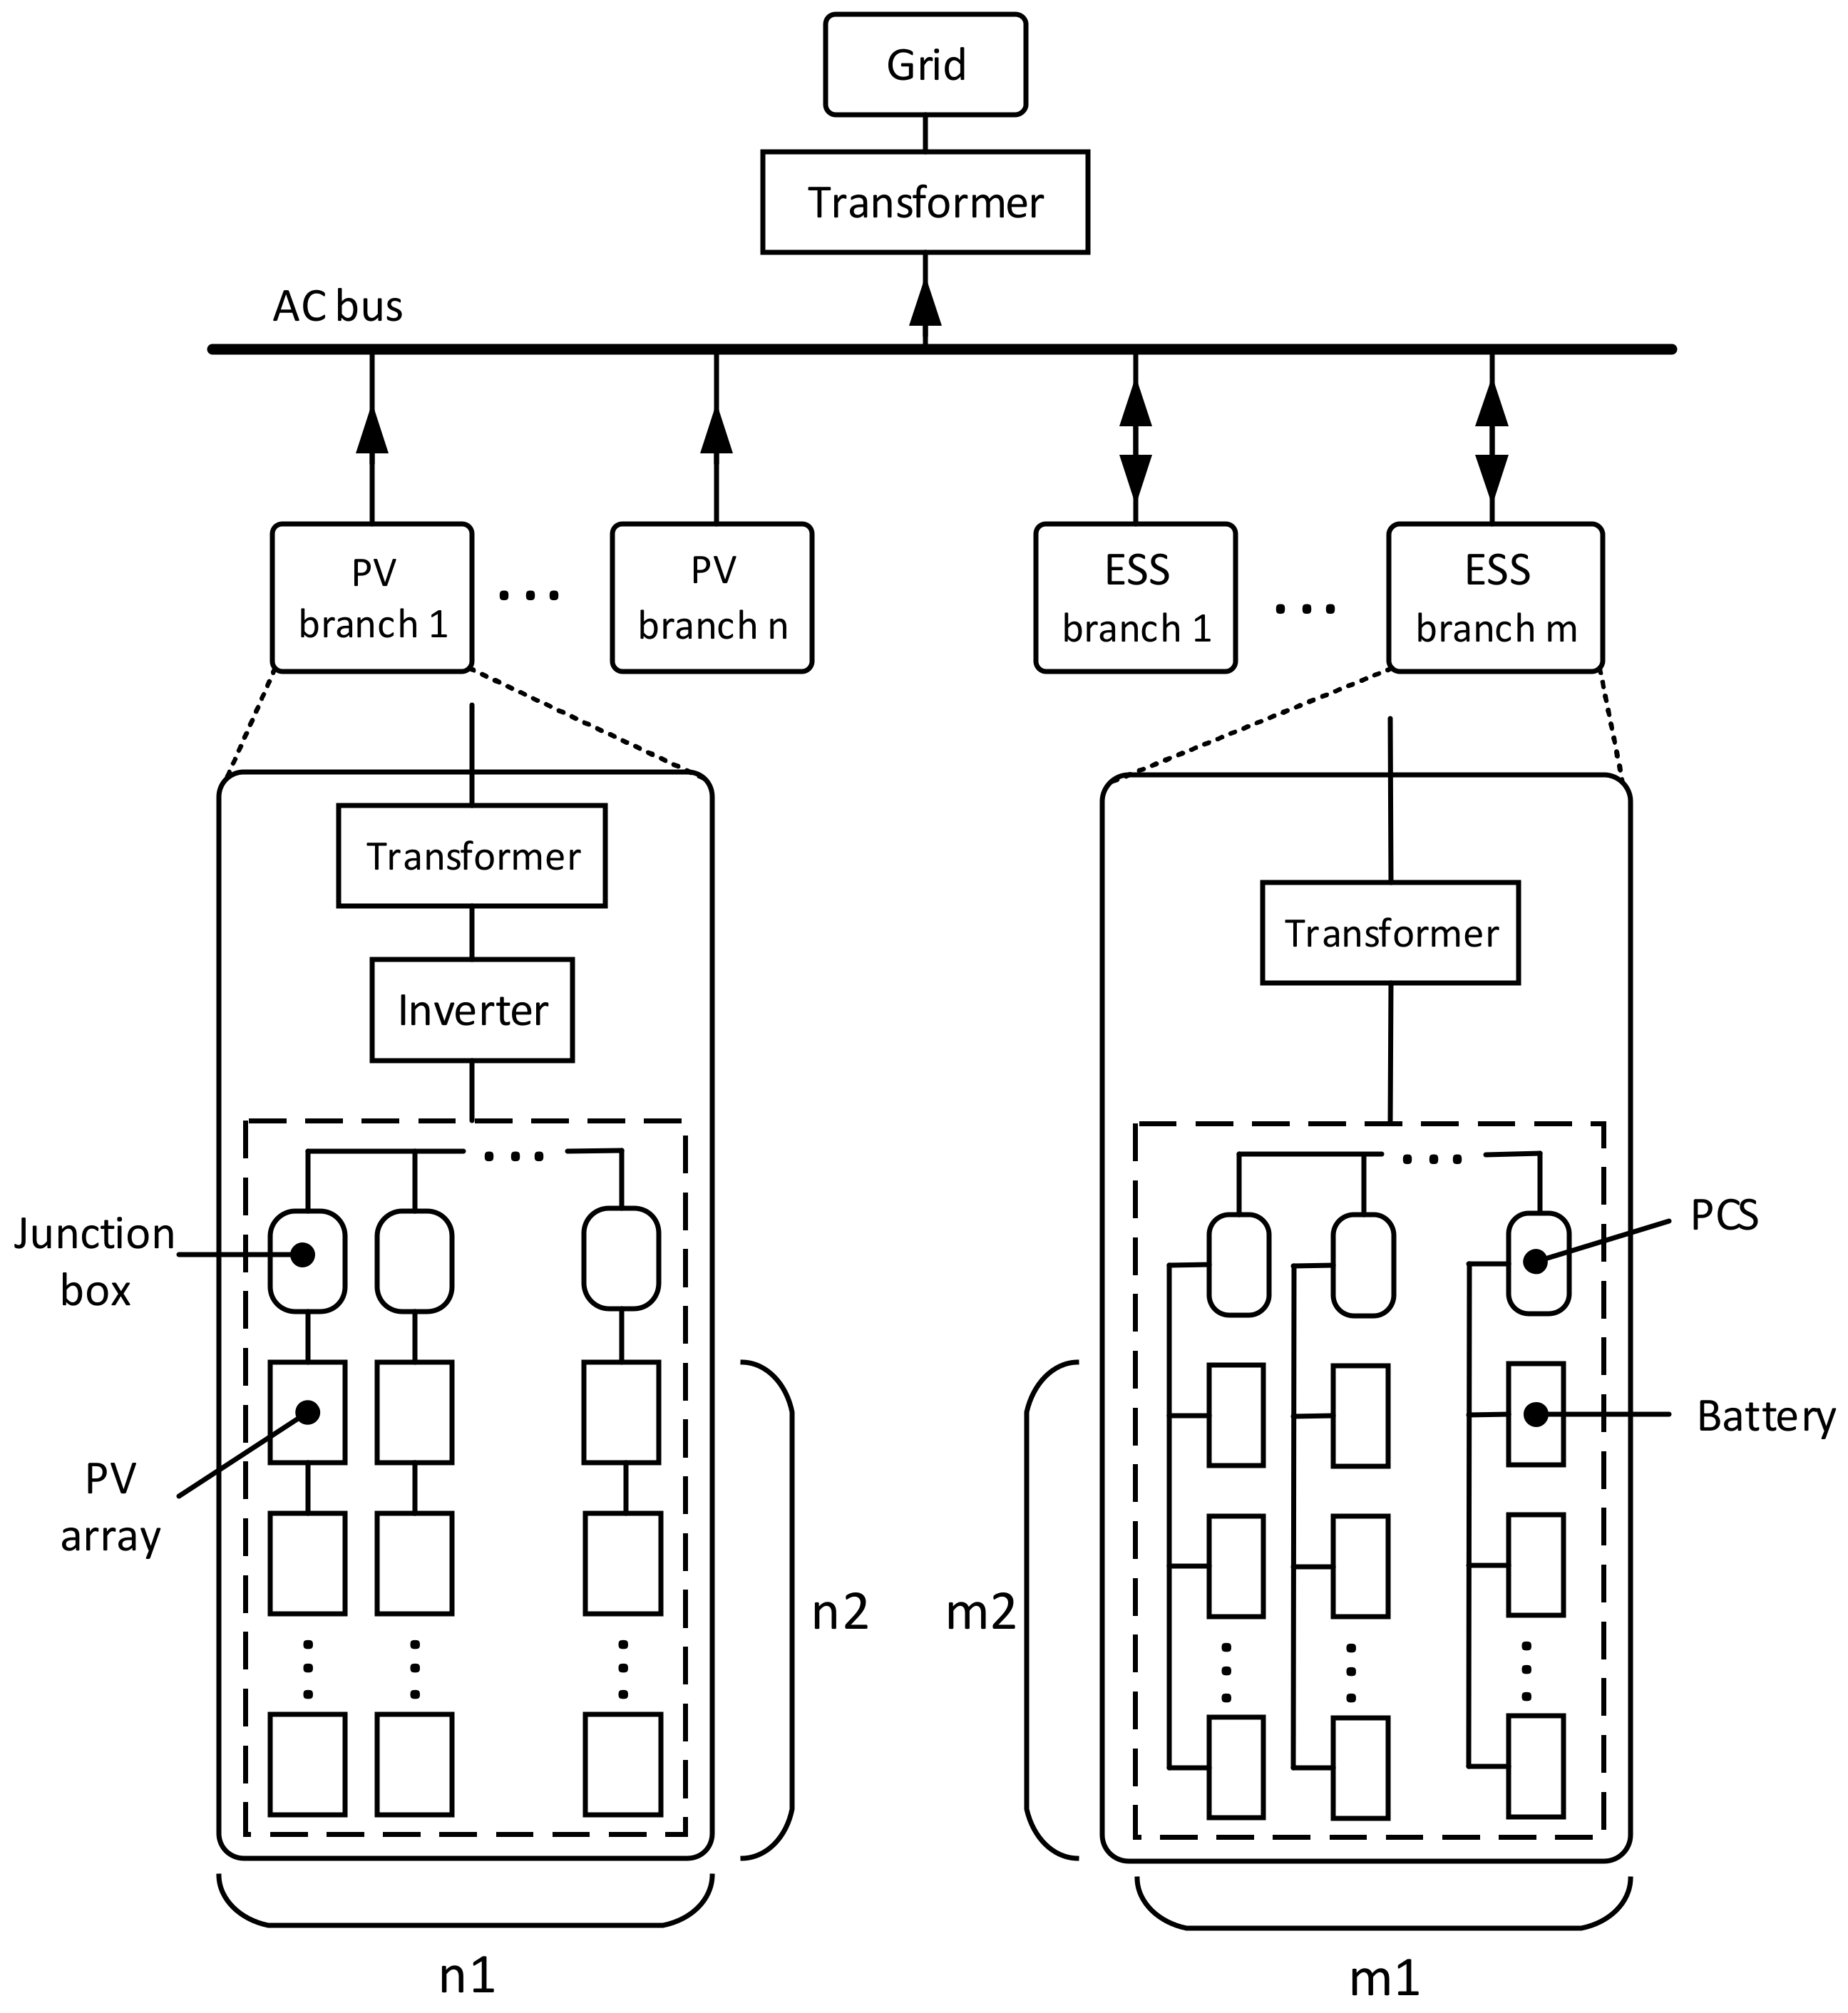
2.1. System Structure of Photovoltaic-Energy Storage (PV-ES) Combined System

To have an intuitive cognition on the research object. The PV-ES combined system is introduced in the section. Figure 1 depicts the structure of the PV-ES combined system, which combines the PV system and the energy storage system in series and parallel with a number of sub-systems, respectively. PV power can be transmitted to the grid or ESS in a PV-ES combined system. The ESS absorbs the power from the PV system when charging and transmits the power to the grid when discharging. The power transmitted to the grid from the PV-ES combined system is:
P P V - E S , t = P P V , t + P E S , t
where, P P V , t is the PV power, P E S , t is the storage charging and discharging power. The charging power is negative and the discharging power is positive.
The effect of the energy storage system is to make the grid-connected power of PV plants be consistent with the dispatch center’s planned power. In this work, the maximum power output model is used as the basis for the combined PV-ES power plants. The maximum output mode refers to the fact that the dispatching power is consistent with the predicted power reported by the PV plant.

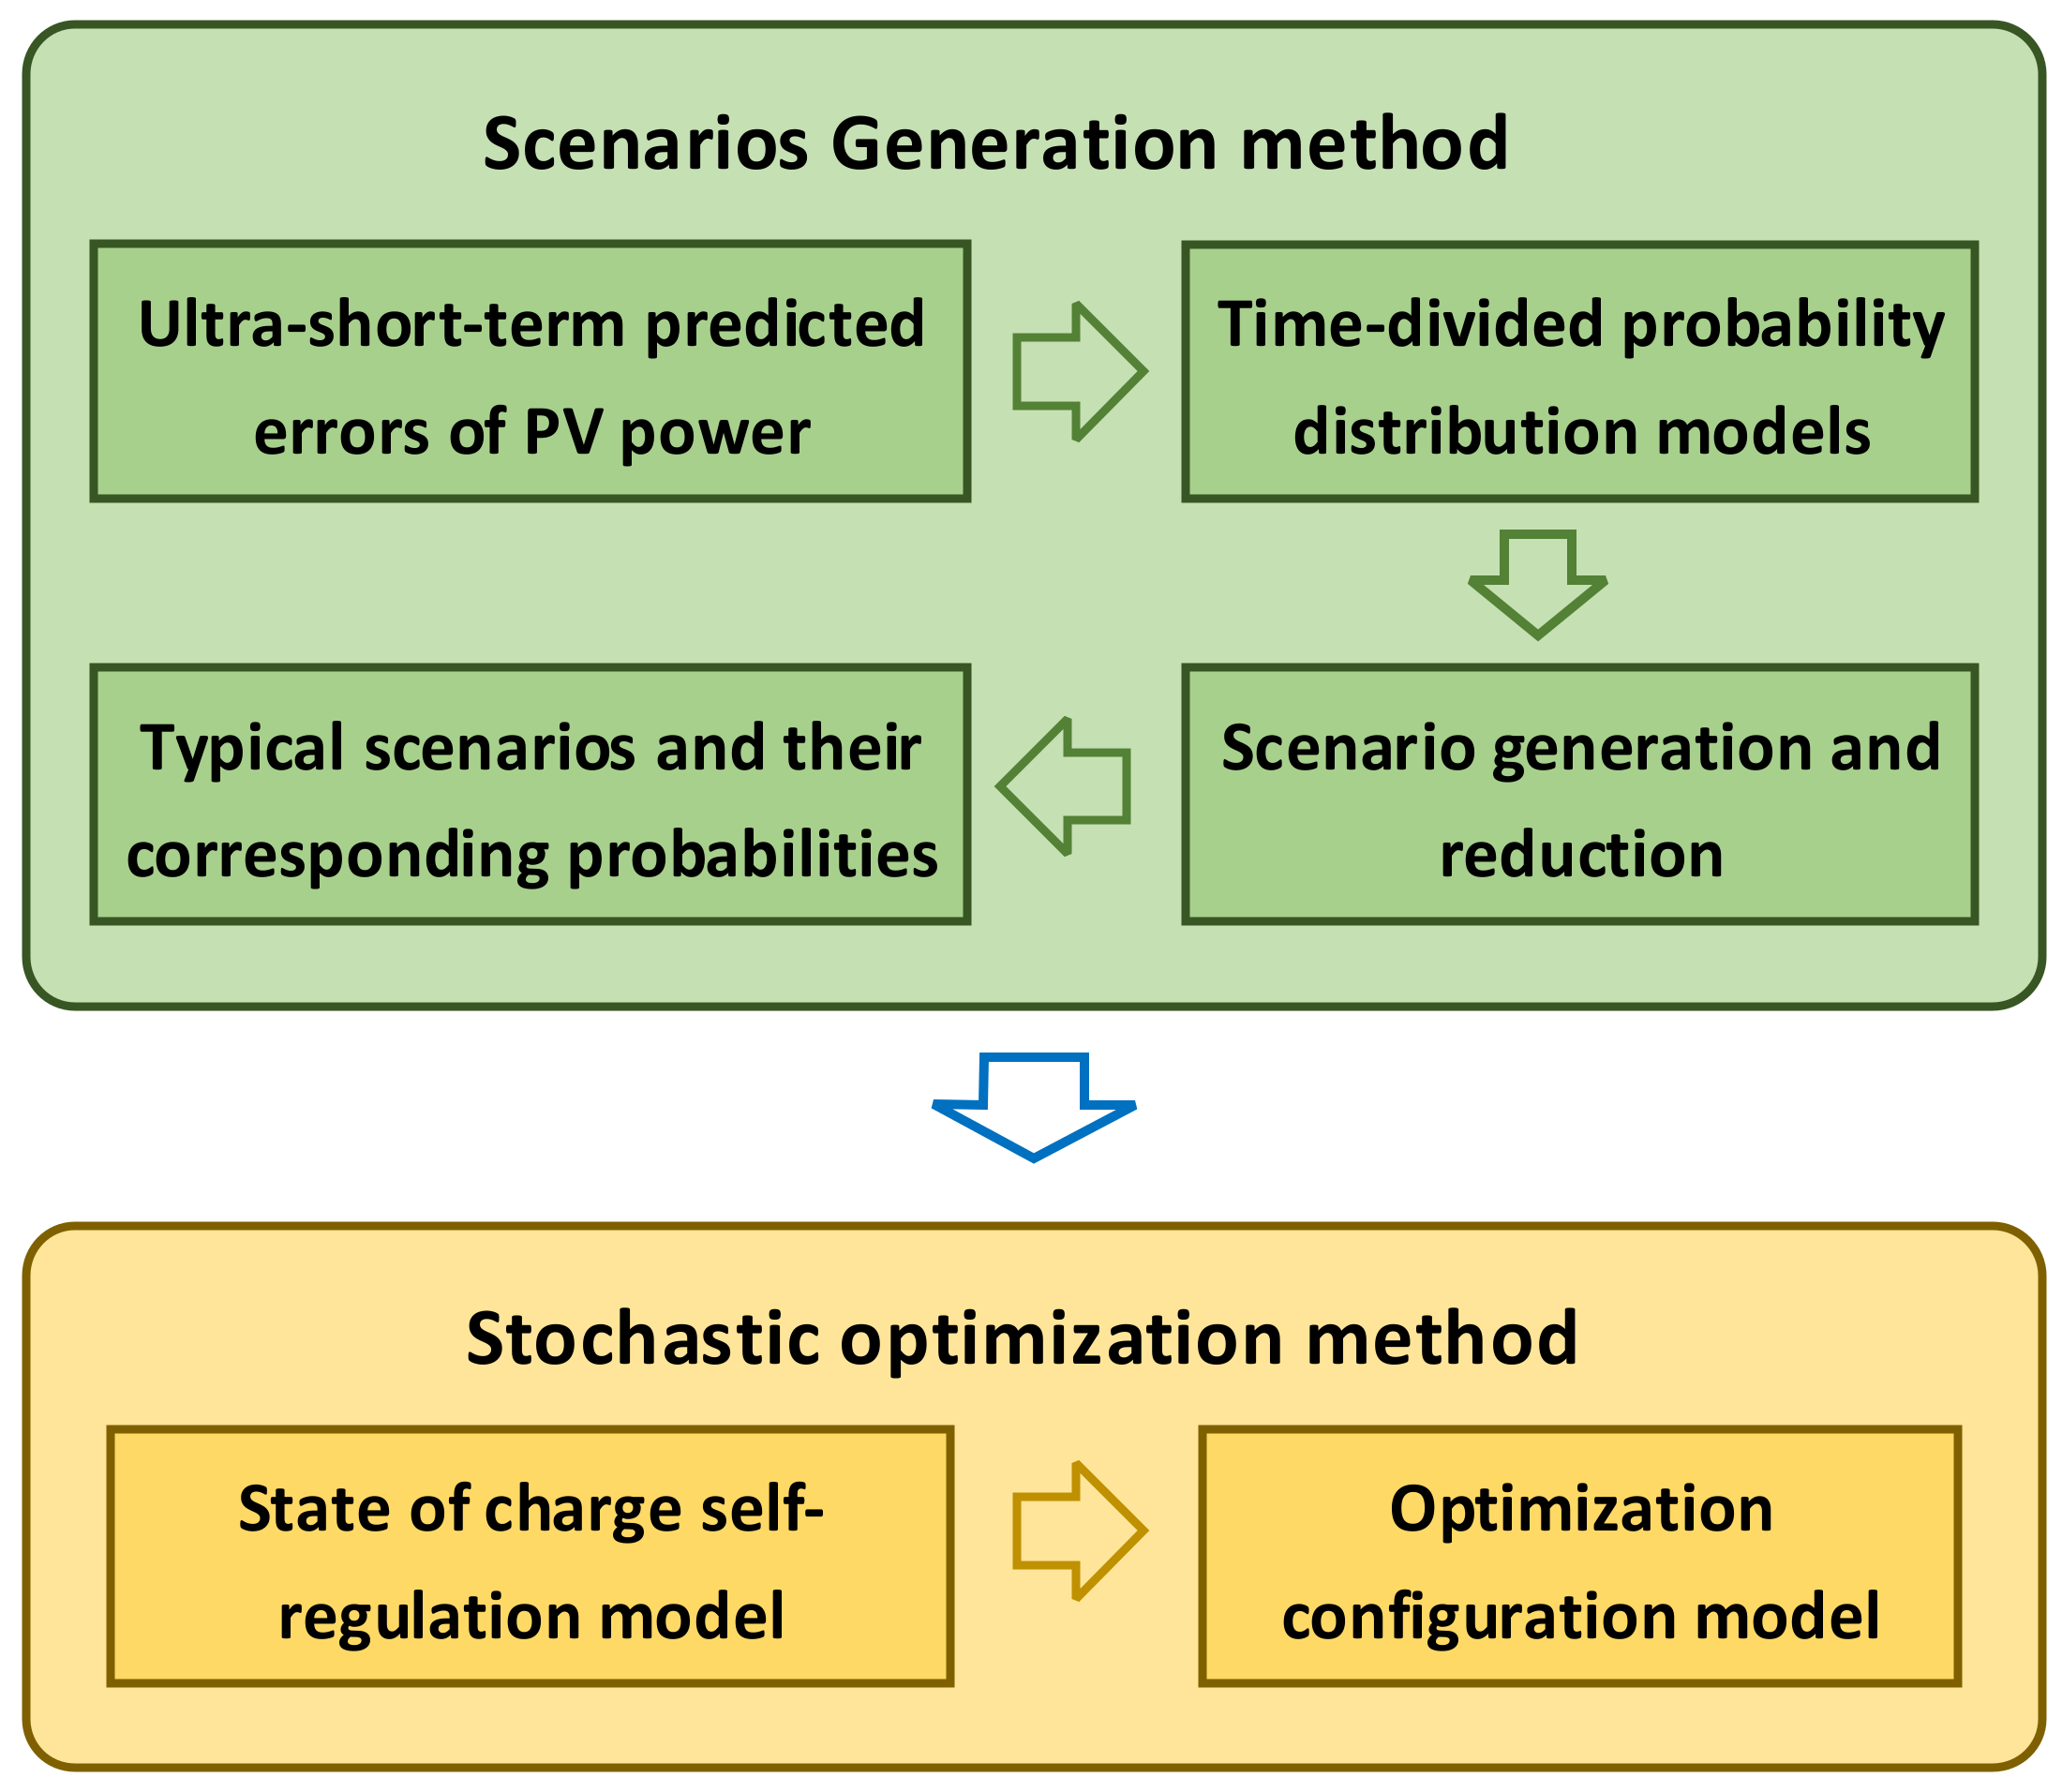
2.2. Framework for Stochastic Optimization Configuration Method

This work proposes a stochastic optimization method for the energy storage system configuration that considers the self-regulation of the battery state of charge (SoC). The block diagram is shown in Figure 2 and is divided into two main parts.
(1)
The typical scenario generation method for the ultra-short-term predicted errors of PV power presented in the first part. This part serves as the foundation for the stochastic optimization of energy storage. The purpose of this part is to use several typical scenarios of the ultra-short-term prediction as inputs to provide a reference for the charging and discharging of the energy storage system and to regulate the state of charge. In this part, the time-divided probability distribution models of ultra-short-term predicted error for each sampling moment are established. Then, by sampling each distribution model and connecting the sampled values of each moment into a power curve as a scenario, a large number of scenarios are created. Several typical scenarios and their probability of occurrence are obtained by scenario reduction.
(2)
The second part is the stochastic optimization method for energy storage systems. Firstly, a state of charge self-regulation model is proposed, and the typical scenarios are taken as inputs of the model to calculate the expected value of SoC in the prediction cycle and updated at each moment. Secondly, an optimal configuration model of the energy storage system is developed, which is based on the SoC self-regulation outcome and takes into account the investment cost and the lifetime of the energy storage. Finally, the model is solved to obtain the optimal results for the ESS configuration.

3. Ultra-Short-Term Predicted Error Scenarios of PV Power

Stochastic programming is a branch of programming theory that can be used to investigate decision problems containing uncertainty factors. This paper studies the optimization configuration method for energy storage systems based on the expected value model in stochastic programming theory. The main principle is that the uncertainty problem is transformed into a deterministic problem to be solved by using several typical scenarios and their corresponding probabilities of occurrence as inputs to the configuration model. In this section, the created method of typical scenarios of ultra-short-term predicted errors is investigated. To create a large number of scenarios by sampling, a probability distribution model of PV power predicted errors must be built. Then, many typical scenarios are obtained by reducing a large number of scenarios.

3.1. Time-Divided Probability Distribution Models

In this paper, the probability distribution model is applied to study the stochastic planning of PV-ES power stations. If a uniform model is created for the probability distribution of predicted errors at all times, the sampling data will have too large an error. Take PV power as an example, the PV power is high in the noon but low in the morning and evening and its predicted error is not the same. However, when sampling a uniform model, the sampling value at 7:00 may be identical to the sampling value at 12:00. Therefore, it is necessary to build the probability distribution models of the ultra-short-term predicted error for different periods.
For the ultra-short-term prediction of PV power generation, the prediction cycle is the next 4 h with a sampling time of 15 min and updated every 15 min. The prediction cycle is also the SoC self-regulating cycle. The rolling prediction diagram is shown in Figure 3. Unlike the day-ahead prediction, there are several ultra-short-term prediction cycles per day, and the predicted error of PV power at each moment of each cycle obeys different probability distributions, i.e., each cycle has 16 probability distribution models.
In this paper, non-parametric kernel density estimation (NPKDE) is used to model the time-divided probability distribution of the ultra-short-term predicted errors of PV power. Assuming x 1 , x 2 , , x n (i.e., ultra-short-term predicted errors) are n sample points with the independent identical distribution F, its probability density function is f. The kernel density estimation is expressed as follows:
f ^ l ( x ) = 1 n h l i = 1 n K x x i h l
where h l is the bandwidth at the l -th moment, n is the number of samples, and K is the kernel function.
K u = 1 2 π e u 2 2
Based on the above non-parametric kernel density estimation, probability distributions can be modeled independently for each of the 16 moments in a number of prediction cycles throughout the day.

3.2. Scenario Generation and Reduction

Based on the established probability distribution model, scenarios of ultra-short-term predicted errors can be generated by sampling, where the so-called scenario is a predicted error curve consisting of 16 sampled values.
(1)
Scenario generation
Take time t as an example, the probability distribution models of t + 1 ~ t + 1 6 are sampled to generate scenarios. A large number of initial scenarios are created after N times of sampling.
(2)
Scenario reduction
If large-scale scenarios are directly substituted into the optimization model, the computation time will be very long, which is not only affect the system’s ability to respond to scheduling commands in time, but also make finding a compromise solution among a large number of scenarios impossible. The principle of stochastic optimization based on multiple scenarios is to transform an uncertain problem into a deterministic one. Large-scale scenarios are reduced to several typical scenarios, from which their corresponding probabilities can be calculated. Backward elimination [26] and fast forward selection [27] are two scenario reduction methods that are outside the topic of this work and will not be discussed in depth in this section.
After scenario reduction, k typical scenarios of PV predicted errors can be created. The following scenarios can be obtained using them plus the ultra-short-term predicted PV power P ^ P V , t + 1 , P ^ P V , t + 2 , , P ^ P V , t + 16 :
P ^ P V , t + 1 + P e , 1 , t + 1 , P ^ P V , t + 2 + P e , 1 , t + 2 , , P ^ P V , t + 16 + P e , 1 , t + 16 P ^ P V , t + 1 + P e , 2 , t + 1 , P ^ P V , t + 2 + P e , 2 , t + 2 , , P ^ P V , t + 16 + P e , 2 , t + 16 P ^ P V , t + 1 + P e , k , t + 1 , P ^ P V , t + 2 + P e , k , t + 2 , , P ^ P V , t + 16 + P e , k , t + 16
These scenarios have the probabilities of occurrence of ξ 1 , ξ 2 , , ξ k . P ^ P V , t represents the predicted value of PV power at the time t , P e , i , t represents the predicted error at the time t in the i -th scenario of PV, and ξ i represents the probability of occurrence of the i -th scenario.

4. Stochastic Optimization Method for Energy Storage System

Due to weather conditions, PV power is volatile and intermittent, and this uncertainty might have an impact on the optimal configuration of the energy storage system, causing the PV-ES combined system to fail to operate under optimal conditions. We built the PV’s probability distribution model in Section 2 based on the principles of statistics. The large-scale scenarios with uncertainty are created by sampling the probability distribution model. The PV’s large-scale scenarios are reduced to several typical discrete scenarios, converting a complex uncertainty optimization problem into many deterministic optimization problems. Then the several typical discrete scenarios are taken as inputs of the expected value model. The expected value model is a branch of stochastic optimization methods that is based on typical scenarios and their probabilities of occurrence. Stochastic optimization of energy storage systems can reduce the impact of the uncertainty of PV on the optimal configuration results, improve the efficiency of the storage system utilization, and reduce the PV abandonment rate.
By sampling and combining the ultra-short-term probability distribution models established above for PV power generation, a large number of PV power generation scenarios can be generated and then reduced to a small number of representative typical scenarios. The operation of the PV-ES combined system is based on these typical ultra-short-term predicted scenarios. In this section, a self-regulating model for the state of charge of the energy storage battery based on multiple scenarios is constructed. The charge and discharge power of the energy storage system are calculated according to the predicted values of PV power during the ultra-short-term prediction cycle. The objective is to maximize the expected interest of the PV-ES combined system, and the state of charge of the battery is regulated according to the charge and discharge power. Based on the operation results of the PV-ES system, a stochastic optimal configuration model of the energy storage system based on multiple scenarios is established.

4.1. State of Charge Self-Regulation Model

In Section 2, the ultra-short-term predicted error scenario for PV power is considered, with the goal of applying it to this section of the state of charge self-regulation model, i.e., the control strategy of the energy storage system. By regulating the SoC for a short period in the future, the battery’s problems caused by a shortage of energy can be mitigated. By implementing this control strategy at every moment, the effect of postponing the degradation of the battery’s life and improving the overall system economy is achieved.

4.1.1. Objective Function

The revenue of the PV-ES combined system is equal to the revenue of selling electricity to the grid minus the cost of degradation of the batteries and the cost of penalties imposed on the plant.
max f ¯ = f ¯ s f ¯ D f ¯ p
where, f ¯ s is the revenue of selling electricity to the grid, f ¯ D is the cost of degradation of the batteries, f ¯ p is the cost of penalties imposed on the plant.
(1)
Revenue of selling electricity to the grid
This section establishes an expected value model for the revenue of selling power, which is the sum of the revenue of selling power of each typical scenario multiplied by the probability of occurrence.
f ¯ s = i = 1 k ξ i t = 1 τ c s , t P ^ P V _ E S , i , t       = i = 1 k ξ i t = 1 τ c s , t P ^ P V , t + P e , i , t + P ^ E S , i , t Δ t
where, ξ i is the scenario’s occurrence probabilities, c s , t is the electricity price of selling power to the grid by the PV-ES combined system, P ^ P V _ E S , i , t is the predicted power of the PV-ES combined system, P ^ E S , i , t is the charging and discharging power of the ES during the prediction cycle, k is the number of scenario, and τ is the combination of the current moment and the prediction cycle, that is 17 sampling times.
(2)
Cost of battery’s degradation
Each charge and discharge of the battery will cause degradation in the cycle life. The expected value of the cost of degradation is modeled as:
f ¯ D = C E E E S , N i = 1 k ξ i λ ^   τ
where C E is the unit cost of the energy storage battery, E E S , N is the rated capacity of the energy storage system and λ ^   τ is the cycle life degradation rate of the battery over the predicted period τ .
(3)
Penalty cost for PV-ES system
The PV-ES system is grid penalized by the grid company when the generated power does not meet the grid’s dispatch instructions. When the power generated by the station exceeds the grid’s dispatch power, it can be consumed by an active power consumption device. The expected value of the penalty cost is modeled as:
f ¯ p = i = 1 k ξ i t = 1 τ f p , t
f p , t = c p , t P r e f , t P ^ P V _ E S , t Δ t , P ^ P V _ E S , t < P r e f , t 0 ,                                                                               P ^ P V _ E S , t P r e f , t
where, f p , t is the penalty cost at time t , c p , t is the penalty cost per unit of power, P r e f , t is the reference value that is the dispatched power from the grid dispatch center.

4.1.2. Operation Constraints

The following constraints need to be met during the operation of a PV-ES combined system.
(1)
Charging and discharging power constraints of ESS
The converter of the energy storage system has a rated power. In this paper, the rated power is assumed as the maximum charging and discharging power. The charging and discharging power should be bigger than the negative rated power and smaller than the positive rated power. The constraint can be expressed as:
P E S , N P ^ E S , t P E S , N
The charging power of ESS should be smaller than the PV power.
P ^ E S , t P P V , t
(2)
SoC constraints of battery
The SoC of the battery should be bigger than the minimum SoC and smaller than the maximum SoC. The calculation equation of the SoC is shown in Equation (12). The calculation equation is the linear discrete model of the Volterra model in [18], which we made some necessary changes. Owing to the difference between the charging and discharging process, the calculation equations are different.
S o C min S o C ^ t S o C max
S o C ^ t + 1 = S o C ^ t η c h P ^ E S , t Δ t E E S , N , C h a r g i n g ,             P E S , t < 0 S o C ^ t P ^ E S , t Δ t η d i s c h E E S , N , D i s c h a r g i n g ,             P E S , t > 0
where, P E S , N is the rated power of the converter, S o C ^ t are the SoC of the battery, S O C min and S O C max are the minimum and maximum SoC of the battery, η c h and η d i s c h are charging and discharging efficiency respectively.
In this section, the unknown variables are P ^ E S , i , t , in which t represents the current moment and the prediction cycle, that is 17 sampling times. The feasible region of P ^ E S , i , t is defined by Equations (10)–(13).

4.1.3. Battery Cycle Life Degradation Model

The role of energy storage in a PV-ES system is to cooperate with PV power generation in order to stay in line with the dispatching power. However, the energy storage and state of charge may change at any time throughout the mediation process. When energy storage needs to discharge, the energy storage may appear to be undercharged, or when energy storage needs to charge, the state of charge has reached its maximum allowable range.
The depth of charge and discharge, ambient temperature, and many other factors will all affect the battery’s cycle life. For the depth of charge and discharge, as the depth of charge and discharge grows, the battery’s cycle life will be lowered. This paper adopts the lead-acid battery life model in [14,28], and the relationship between battery cycle life and depth of discharge is:
L B = 3278 D 4 5 D 3 + 12,823 D 2 14,122 D + 5112
In the literature [14,28], the number of charges and discharges at different depths was equated to the number of full charges and discharges using the rain flow counting method. This was used to estimate the battery’s cycle life. In the i -th cycle, the number of times that the battery is charged and discharged once equivalent to a full charge and discharge is:
L B , e q , i = L B D N L B D i
The degradation rate of the battery’s cycle life is:
λ n = L B , e q / L B D N × 100 % = i = 1 n L B D N L B D i / L B D N × 100 %
where, D is the discharged depth of the battery, where the discharged depth of the battery is determined by the rain flow counting method in literatures [14,28] and will not be repeated in this paper.
L B is the number of cycle.
D N = 1 means the battery is fully discharged, D i is the discharged depth of the i -th cycle of the battery, and L B , e q is the total number of equivalent battery cycles.
When λ n = 100 % , the battery reaches retirement condition.

4.2. Optimization Configuration Model of Energy Storage System

The optimization configuration objective is to minimize the cost or maximize the revenue. The optimization objective function is the revenue of selling electricity minus the investment cost of the energy storage system, the cost of energy storage battery degradation and the penalty cost.
max F = F s F i n v F D F p
where, F s is the revenue of selling electricity from PV-ES combined system to the grid of one day, F i n v the investment cost converted to one-day, F D is the cost of cyclic life degradation loss of batteries of 1 day, F p is the penalty cost of 1 day.
The energy storage system cost consists of the battery’s cost and converter’s cost. The expected value model of the investment cost converted to 1 day is:
F i n v = i = 1 I ξ i C P P E S , N , i + C E E E S , N , i / γ
where, the γ is conversion coefficient that converters the whole investment cost to 1-day cost. P E S , N , i and E E S , N , i are the rated power and energy of the ESS.
In the SoC self-regulation model described above, the scenario is the power curve of PV generation over a predicted period, which is updated on a rolling prediction at each moment. The energy storage system optimal configuration model is different, in that the scenario is a power curve made up of the results of the SoC self-regulation.
The revenue of selling electricity from PV-ES combined system to the grid is:
F s = i = 1 I ξ i t = 1 T c s , t P P V _ E S , t , i Δ t         = i = 1 I ξ i t = 1 T c s , t P P V , t , i + P E S , t , i Δ t
where, c s , t is the electricity price of selling power to the grid by the PV-ES combined system, P P V _ E S , t is the output power of the PV-ES combined system, and P E S , t is the charge and discharge power of the energy storage.
The cost of cyclic life degradation of batteries is:
F D = i = 1 I ξ i C E E E S , N , i λ T
where, C E is the unit cost of the energy storage battery, E E S , N , i is the rated capacity of the energy storage system and λ T is the cycle life degradation rate of battery over time T .
The penalty cost for the PV-ES system is modeled as:
F p = i = 1 I ξ i t = 1 T F p , t , i
F p , t = c p , t P r e f , t P P V _ E S , t Δ t , P P V _ E S , t < P r e f , t 0 ,                                                                             P P V _ E S , t P r e f , t
where, c p , t is the unit penalty cost, P r e f , t is the dispatched grid-connected power of the PV-ES (reference value).
The above optimization model is still subject to the constraints in Section 4.1.2. In this section, the unknown variables are P E S , i , t , in which t represents the sampling times of the whole day. The feasible region of P E S , i , t is defined by the Equations (10)–(13). Furthermore, it is assumed in this paper that the energy storage batteries are charged and discharged with equal energy throughout 1 day, thus maintaining the same initial state of the storage batteries each day. This paper solves stochastic optimization models for energy storage systems using the genetic algorithm (GA). Its theory and steps are very well developed and they are not included in this paper.

5. The Results and Analysis

This paper uses the data of the generation power and ultra-short-term predicted power of a PV station in Qinghai province, China for the analysis. The station’s installed capacity is 9 MW. The analysis is divided into two parts. The first part analyzes and compares the time-divided probability distribution models of ultra-short-term predicted errors based on actual data. The second part analyzes the state of charge self-regulation strategy and the optimal configuration results of the energy storage system.

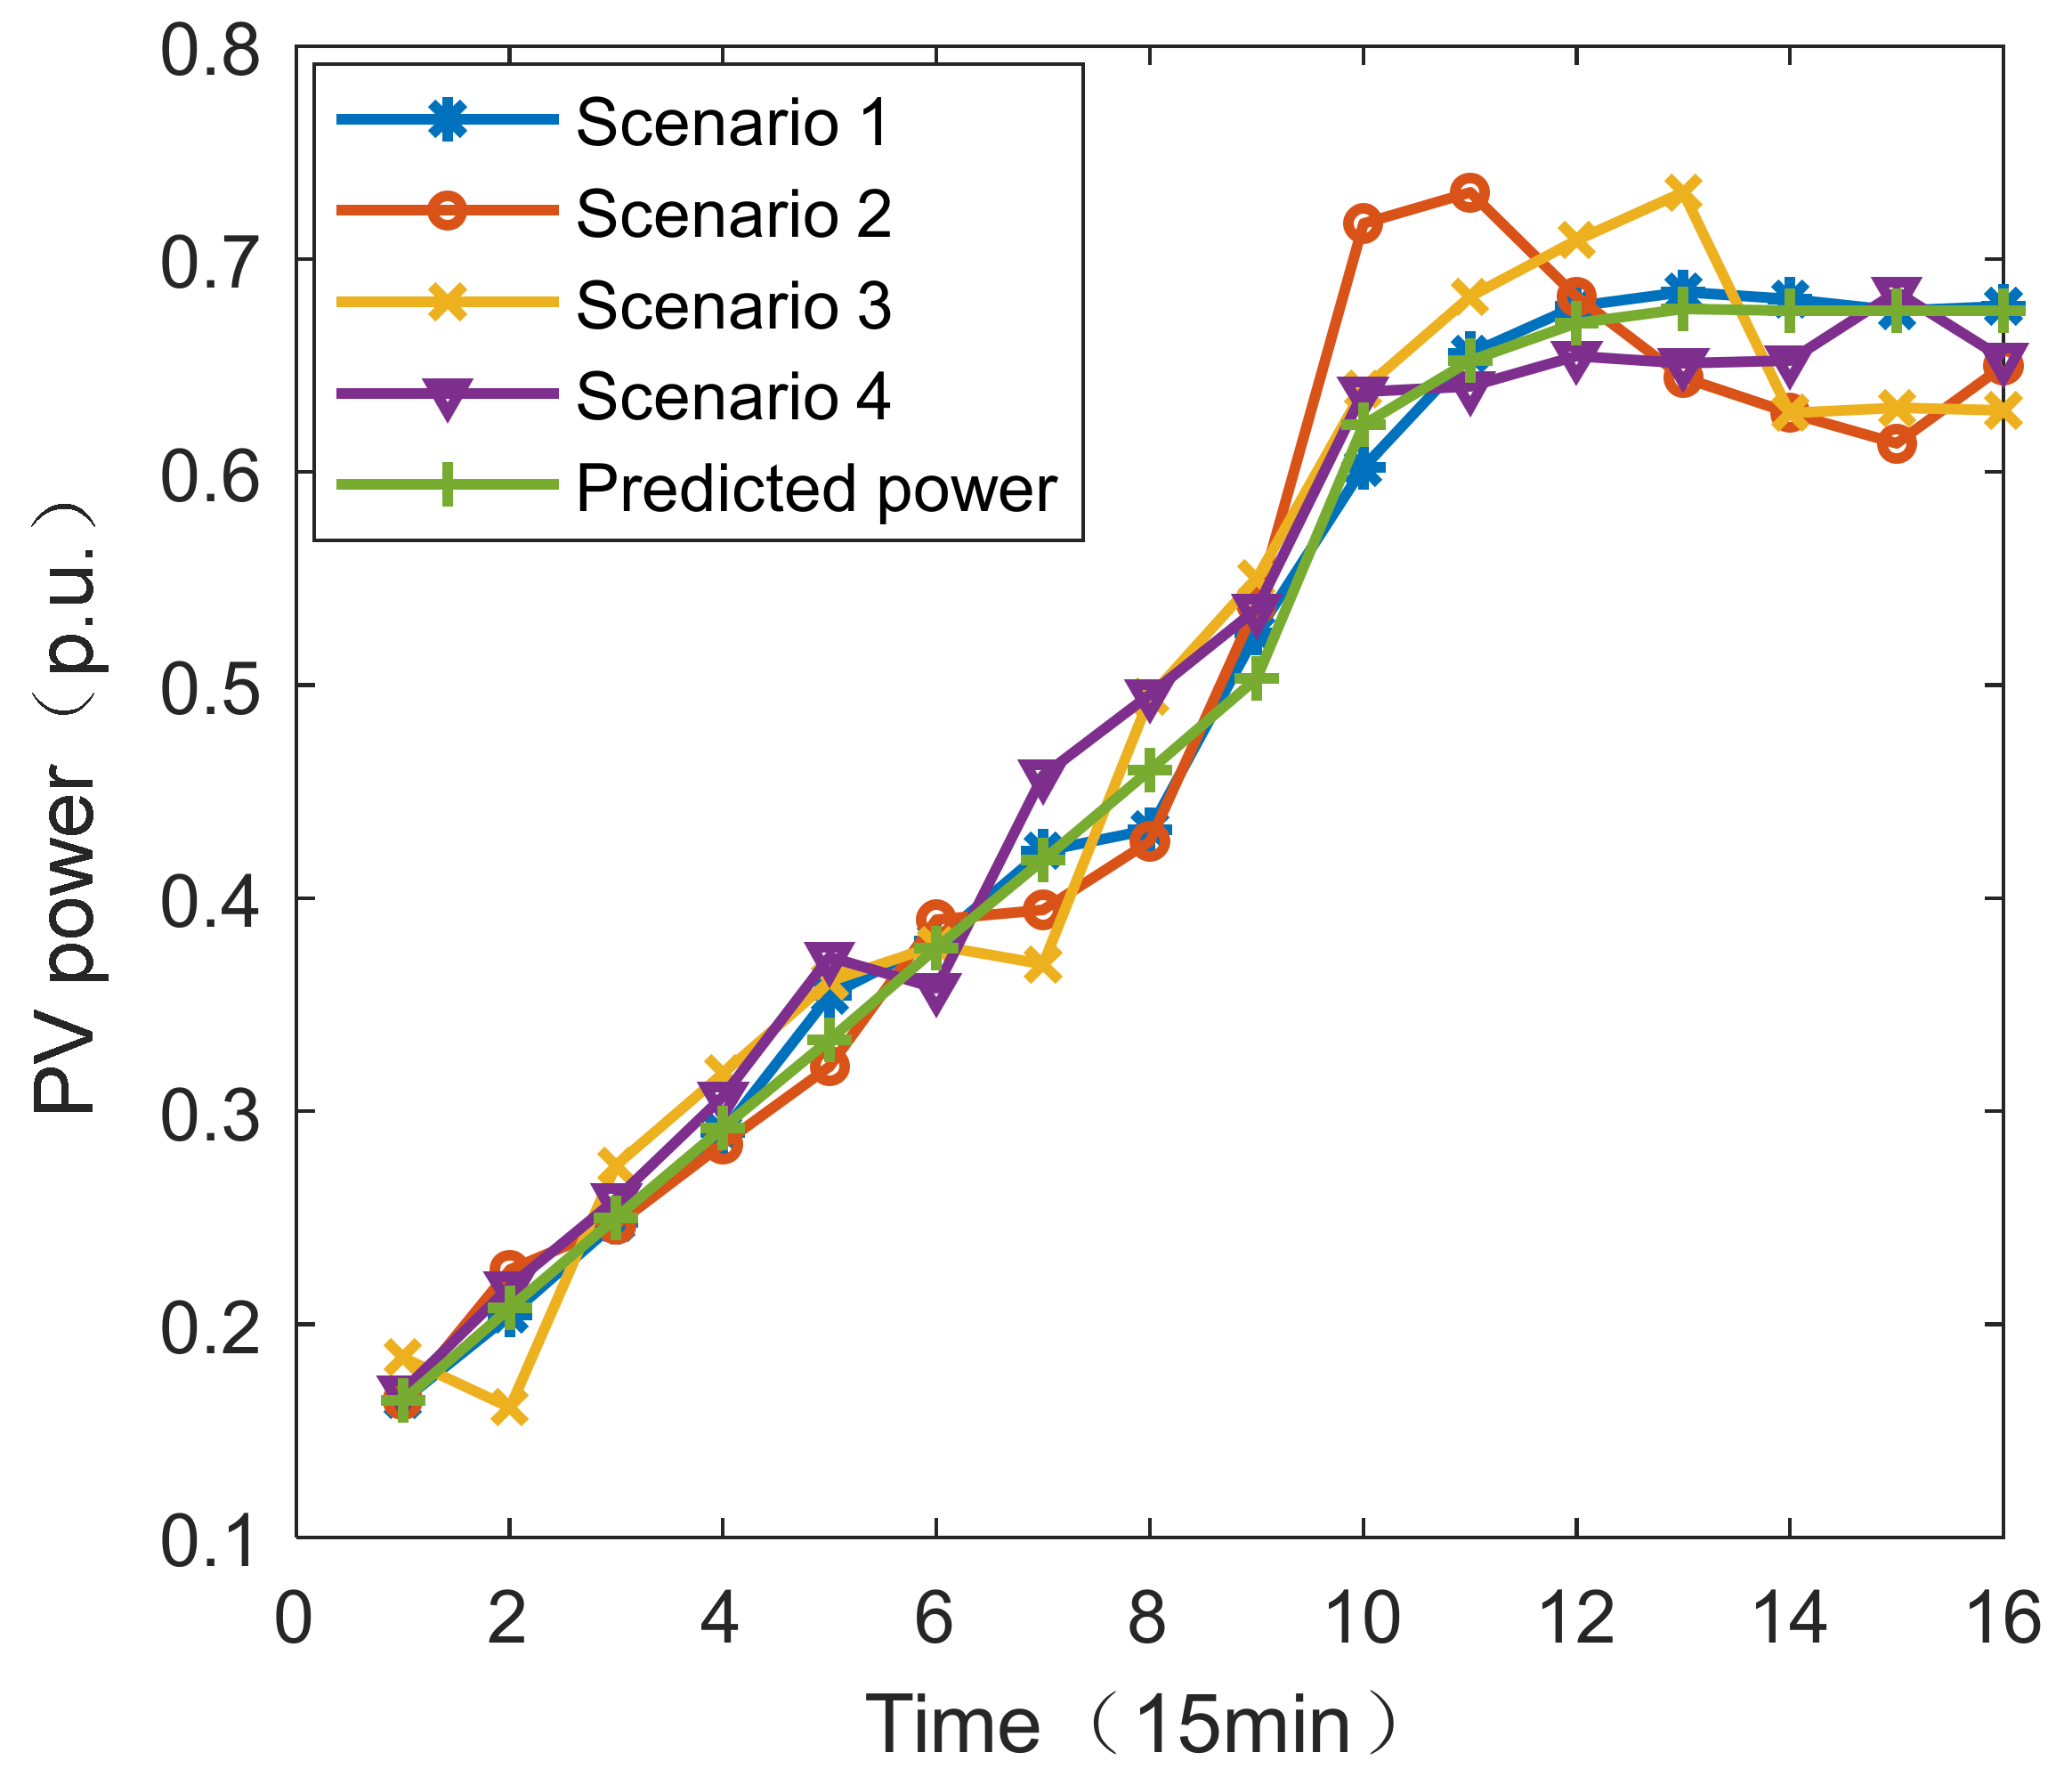
5.1. Analysis of Ultra-Short-Term PV Predicted Error Scenarios

This section first analyses the probability distribution model for the ultra-short-term predicted error of PV power in Section 2.1. The MATLAB 9.4 (Natick, MA, USA) is used in this paper. In MATLAB R2018a, the code is edited in order to calculate and analyze. As shown in Figure 4, the probability distribution models for two different periods are illustrated. The histogram of the original data is shown by the blue bar, which corresponds to the frequency on the left vertical axis. The probability density distribution curve fitted to the original data is shown by the red curve, which corresponds to the probability density on the right vertical axis.
After modeling the predicted errors for 9:00 and 10:00, the probability distribution models for the two periods in Figure 4a,b are clearly different. Furthermore, for each period, the fitting effect of the normal distribution is the least, the t-distributions and kernel density distributions have similar fitting effect. The root means square error (RMSE) of the fitting probability distribution curve for the t-distribution is 15.61% higher than that of the kernel density distribution. This proves that the fitting effect of NPKDE is better than the other two models.
Table 1 shows the bandwidth of kernel density distributions of the predicted errors at different times within a prediction cycle. As can be seen in the table, the bandwidth values for two adjacent periods in each row are similar, and the bandwidth values for longer intervals are more different, which is consistent with the qualitative analysis of the probability distribution model in Section 2.1.
Scenarios of the PV power predicted errors in the predicted period can be obtained by sampling the probability distribution models. The generated scenarios are statistically significant only if the number of scenarios is sufficiently large. However, when the number of the scenarios is too large, the calculation time will be too long, which adversely affects the scheduling of the PV-ES combined system. Therefore, a scenario reduction method is needed to reduce the large-scale scenarios to a few representative scenarios, to transform the uncertainty problem into several deterministic problems. Taking the predicted period of 9:00–12:45 as an example, Figure 5 depicts several typical PV power scenarios after the reduction, and their corresponding probabilities are 45.72%, 21.71%, 22.70% and 9.87% respectively.

5.2. Stochastic Optimization Method Analysis

5.2.1. State of Charge (SoC) Self-Regulation Analysis

This section analyzes the dynamic self-regulation of the SoC based on a multi-scenario approach. The basis is the typical scenarios of PV power in a future predicted cycle (16 sampling points). The four typical scenarios are used as the input of the SoC self-regulation model in Section 3.1. We assume that the rated power and capacity of ESS are 450 kW and 1800 kWh, respectively, the initial value of the SoC is 0.5, and the range of the SoC is [0.1, 0.9]. The GA in the optimization tool of MATLAB R2018a is used in this paper to calculate. The Table 2 shows the PV module’s parameters. The currency used in the paper is the Chinese yuan (CNY, ¥). For this kind of PV cell, it is about 550 ¥. For the ESS, we used the Lead-acid battery as the case in this paper. The battery’s unit cost is 600 ¥/kWh. The converter’s unit cost is 1000 ¥/kWh.
Figure 6 and Figure 7 depict the output power of the PV-ES system and SoC of the battery under different scenarios, respectively. Scenario 1 is similar to the predicted scenario, with low charge and discharge power and SoC staying around 0.5. The other three scenarios have power levels that range between above and below the predicted power (the power commanded by the dispatch center). The energy storage system will charge or discharge accordingly, and the SoC value will increase or decrease correspondingly. In practice, this process is repeated at each sampling moment, thus achieving the effect of rolling SoC self-regulation.
Over this predicted period, the revenue of the PV-ES combined system is calculated as shown in Table 3, and the unit is the yuan (¥). The revenues of three scenario’s schemes are compared. Scheme 1: the scenarios are generated by the probability distribution models of PV power predicted error developed in this paper. Scheme 2: the scenarios are generated by the error probability distribution model obeying a normal distribution N (0.0031, 0.0436). Scheme 3: there is only one deterministic scenario that is assumed as the PV’s predicted power.
In the two schemes, although the expected value of revenue obtained from the expected value model is not the highest, the model takes into account predicted information of different scenarios. For the PV-ES station, it is beneficial to predict the SoC more accurately in a future cycle. For the grid, the accuracy of the output power of the PV-ES power station can ensure the safety and stability of the grid operation.
Without considering stochastic optimization based on multiple typical scenarios, the operational revenue using the deterministic optimization model is 12,023.32 yuan, in which only the predicted power curve is used as the deterministic scenario. The expected revenue of the PV-ES system for Scheme 1 is 5.9% higher than that of Scheme 2 and 13.26% higher than that of Scheme 3, which demonstrates the advantages of the scenario generation approach in this paper. The revenue difference between each scenario of Scheme 1 is also smaller, and Scheme 1 is also closer to the actual operating case of 13,102.26 yuan. The operating results indicate that the SoC self-regulation effect of Scheme 1 is better, and the SoC self-regulation based on the stochastic optimization method in this paper is the best.

5.2.2. Analysis of the Optimization Configuration

The results of the SoC self-regulation were obtained by simulating the operation of the PV-ES combined system over a predicted cycle in Section 5.2.1. The operation of the PV-ES combined system is based on rolling repetition of the above calculations, and the stochastic optimal configuration of the energy storage system takes into account a longer time scale (1 year) to ensure configuration accuracy. The self-regulation results of the SoC will vary at different predicted periods. The extreme examples of SoC exceeding the limitation may occur, but the probability of such examples will be reduced by the control strategy proposed in this paper. The cycle life degradation cost of the energy storage battery is one part of the objective function. By applying the SoC self-regulation control strategy at each cycle, the cycle life degradation cost will be reduced, resulting in an economic improvement of the PV-ES system.
This section analyses the results of the optimal configuration of the energy storage system. Figure 8 shows the process of solving the optimal model, where the cost of the vertical axes is the negative of the revenue. The number of iterations varies for each scenario, but they all finally settle to a fixed value. According to 10 times calculations, the average iteration times for four scenarios are 3.288 s, 7.839 s, 4.252 s and 5.440 s, respectively. The battery’s cycle life for four scenarios are 3125, 2941, 3225 and 2125 cycles, respectively. The expected value of battery’s cycle life is 3107 cycles. The final revenues are shown in Table 4, where the revenues of Scheme 1 are all higher than those of Scheme 2. It can be observed that using the scenarios generated by the method of this paper as the basis can obtain better configuration results.
Without considering the stochastic optimization method, the revenue obtained with deterministic optimization Scheme 3 is 36,443.21 yuan. The expected revenue of Scheme 1 is 8.86% higher than that of Scheme 2, and 16.87% higher than that of Scheme 3, indicating that the economics of the proposed method in this paper is better. The optimal configurations of the energy storage system for the Scheme 1 and Scheme 2 are P E S , N = 318.72   kW , E E S , N = 752.67   kWh , and P E S , N = 2162.19   kW , E E S , N = 6758.21   kWh respectively. The stochastic optimization method proposed in this paper can be used to maximize the benefit of PV-ES combines system and minimize the energy storage power and capacity.
The sensitivity of revenue to the change of battery cost is analyzed, as shown in Figure 9. Although it is not linear owing to the GA’s limitation, we can see that the overall revenue decreases with the increase of unit cost. With the development of battery technology, the cost of a battery will continue to decline. The sensitivity analysis can also provide a reference for the optimal configuration of optical storage in the future.

6. Conclusions

This paper investigated the stochastic optimization configuration method for the energy storage system in a PV-ES combined system. The time-divided probability distribution models of the ultra-short-term predicted error of PV power are proposed in this paper, which makes the sampling data more similar to the real data’s statistical pattern features. Based on the multi-scenario stochastic optimization method, an energy storage system configuration model that considers the SoC self-regulation is established. The main conclusions of this paper are as follows:
(1)
The fitting error of the proposed time-divided probability distribution model based on the non-parametric kernel density estimation is 15.61% lower than that of the t-distribution. The bandwidth of the distributions obeyed by different periods differed and the fitting effect was more in line with the statistical features of the original data.
(2)
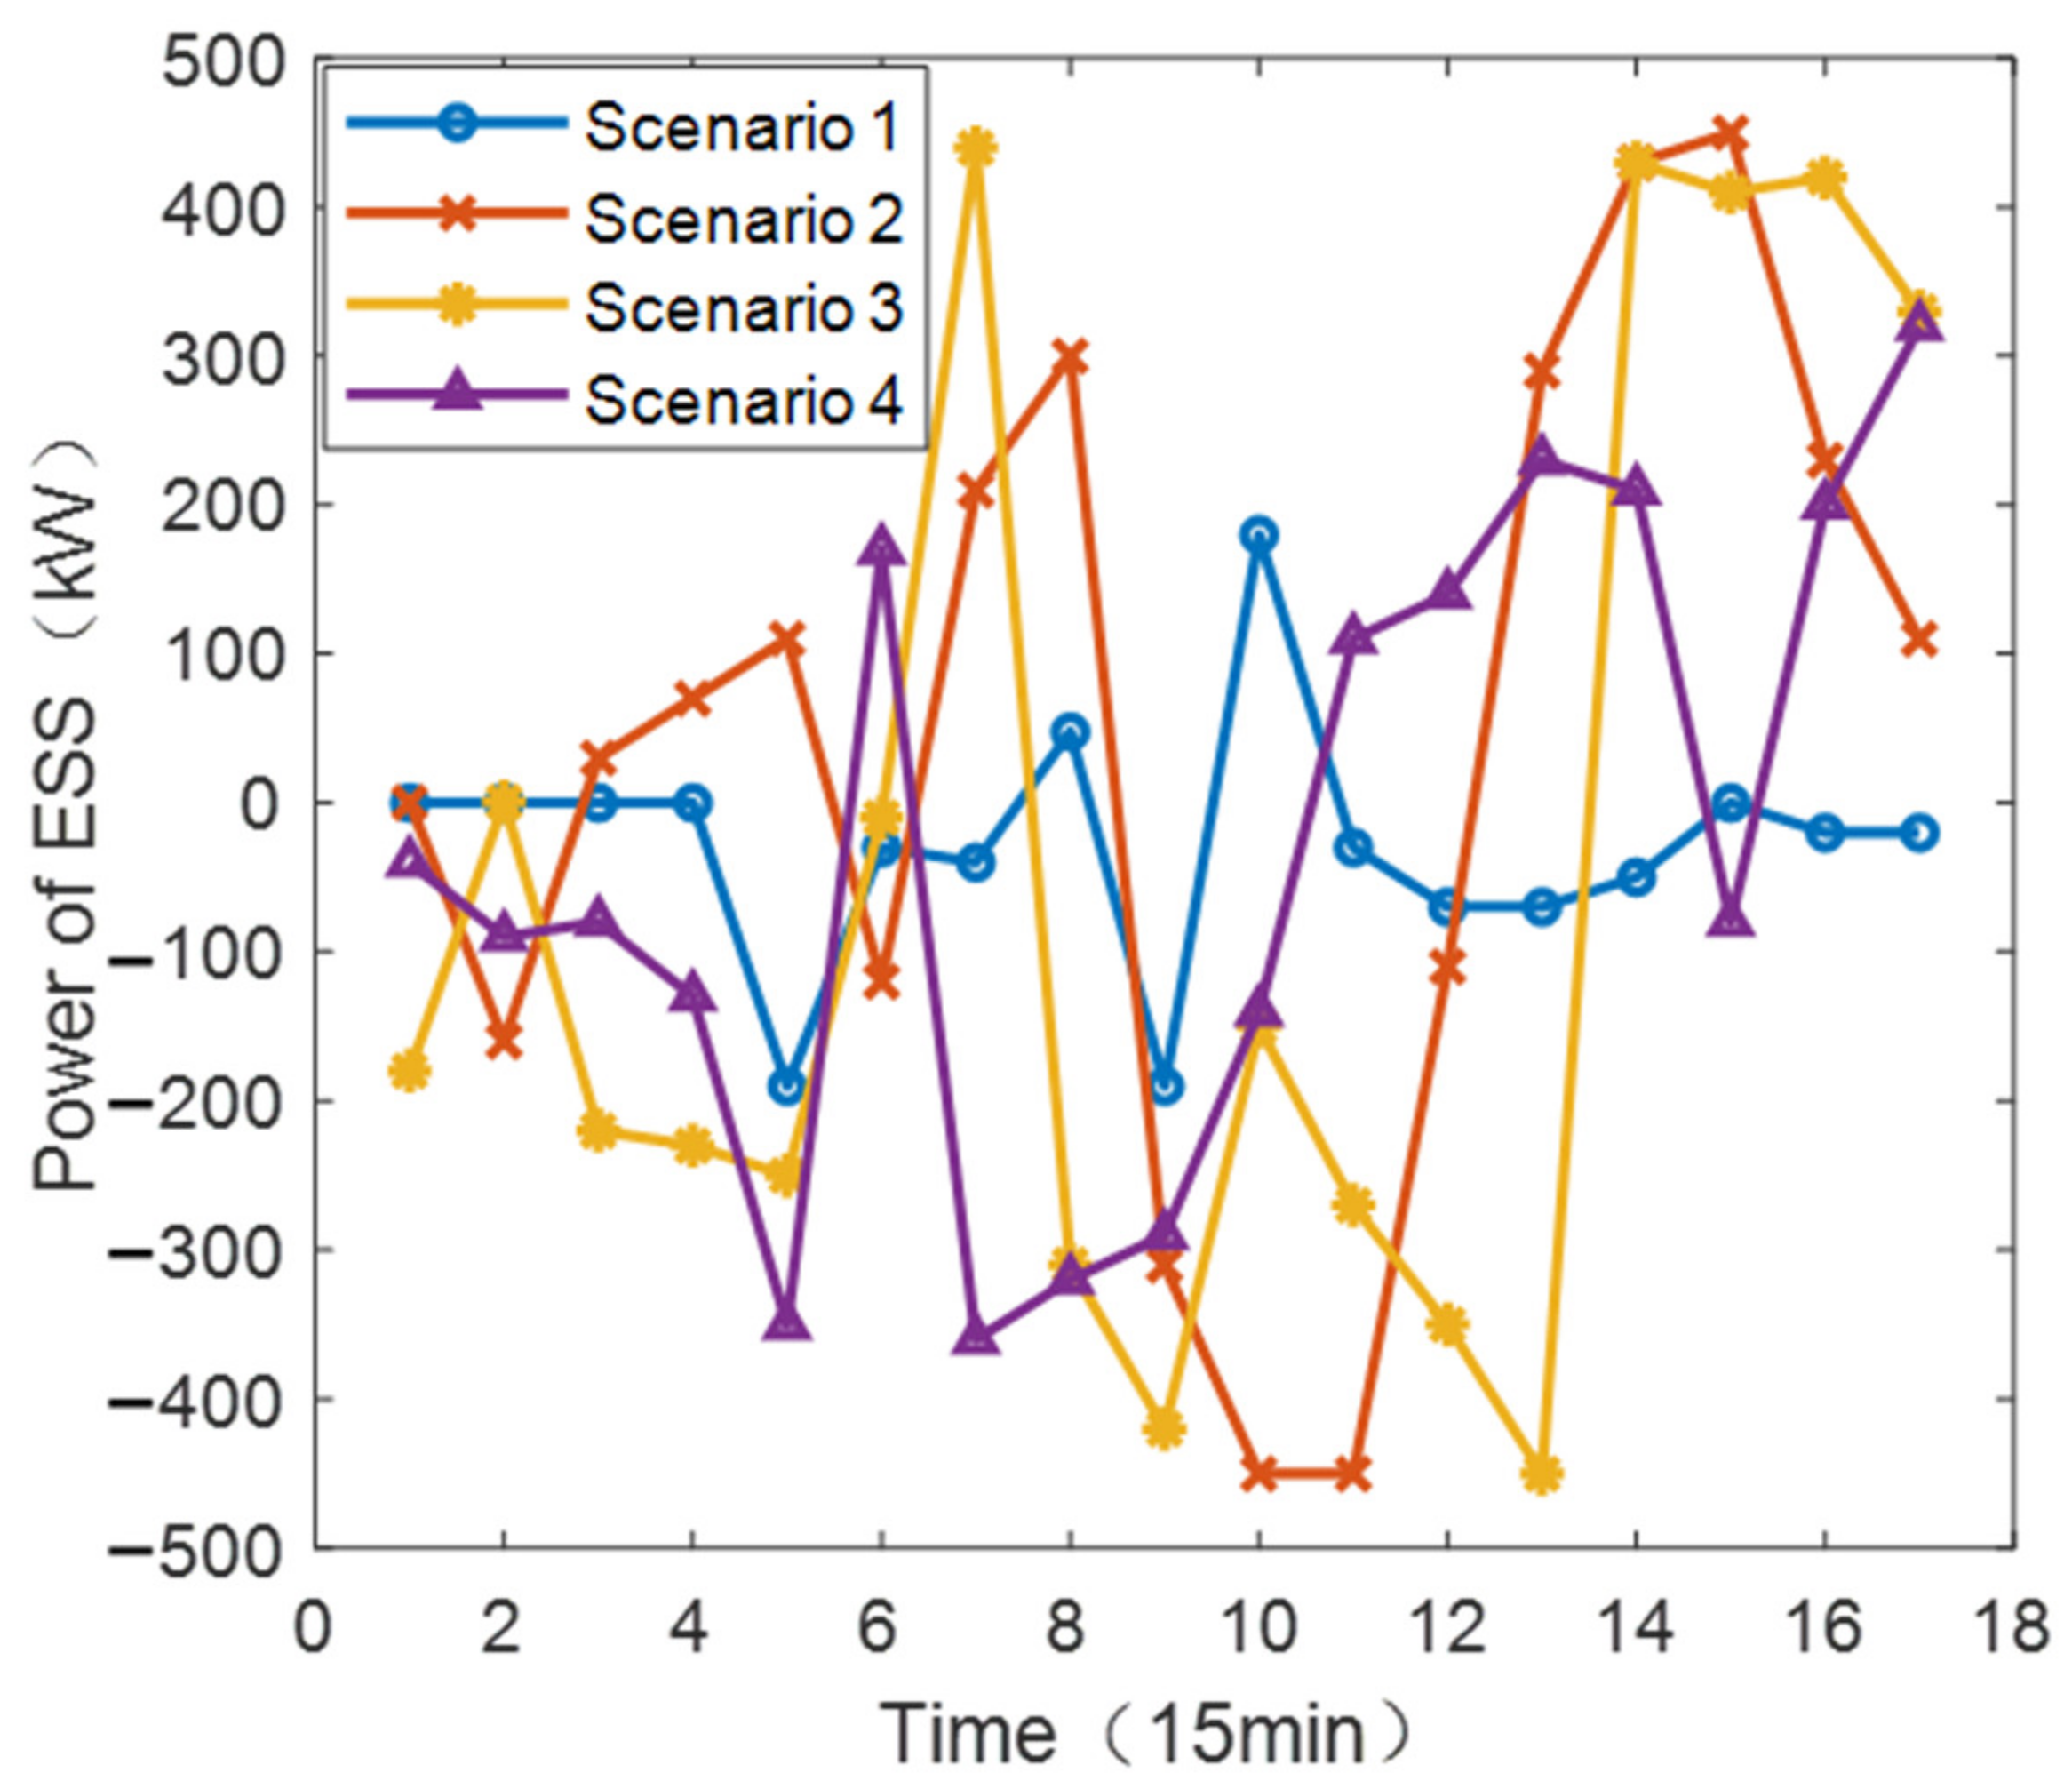
The ultra-short-term prediction scenarios are different, which makes the operation of the energy storage system and the SoC curves different. Scenarios generated based on different schemes affect the revenue of the self-regulating model of SoC. The stochastic optimization method proposed in this paper has 5.9% higher revenue than Scheme 2 and 13.26% higher than the deterministic method. This shows the superiority of SoC self-regulation control strategy.
(3)
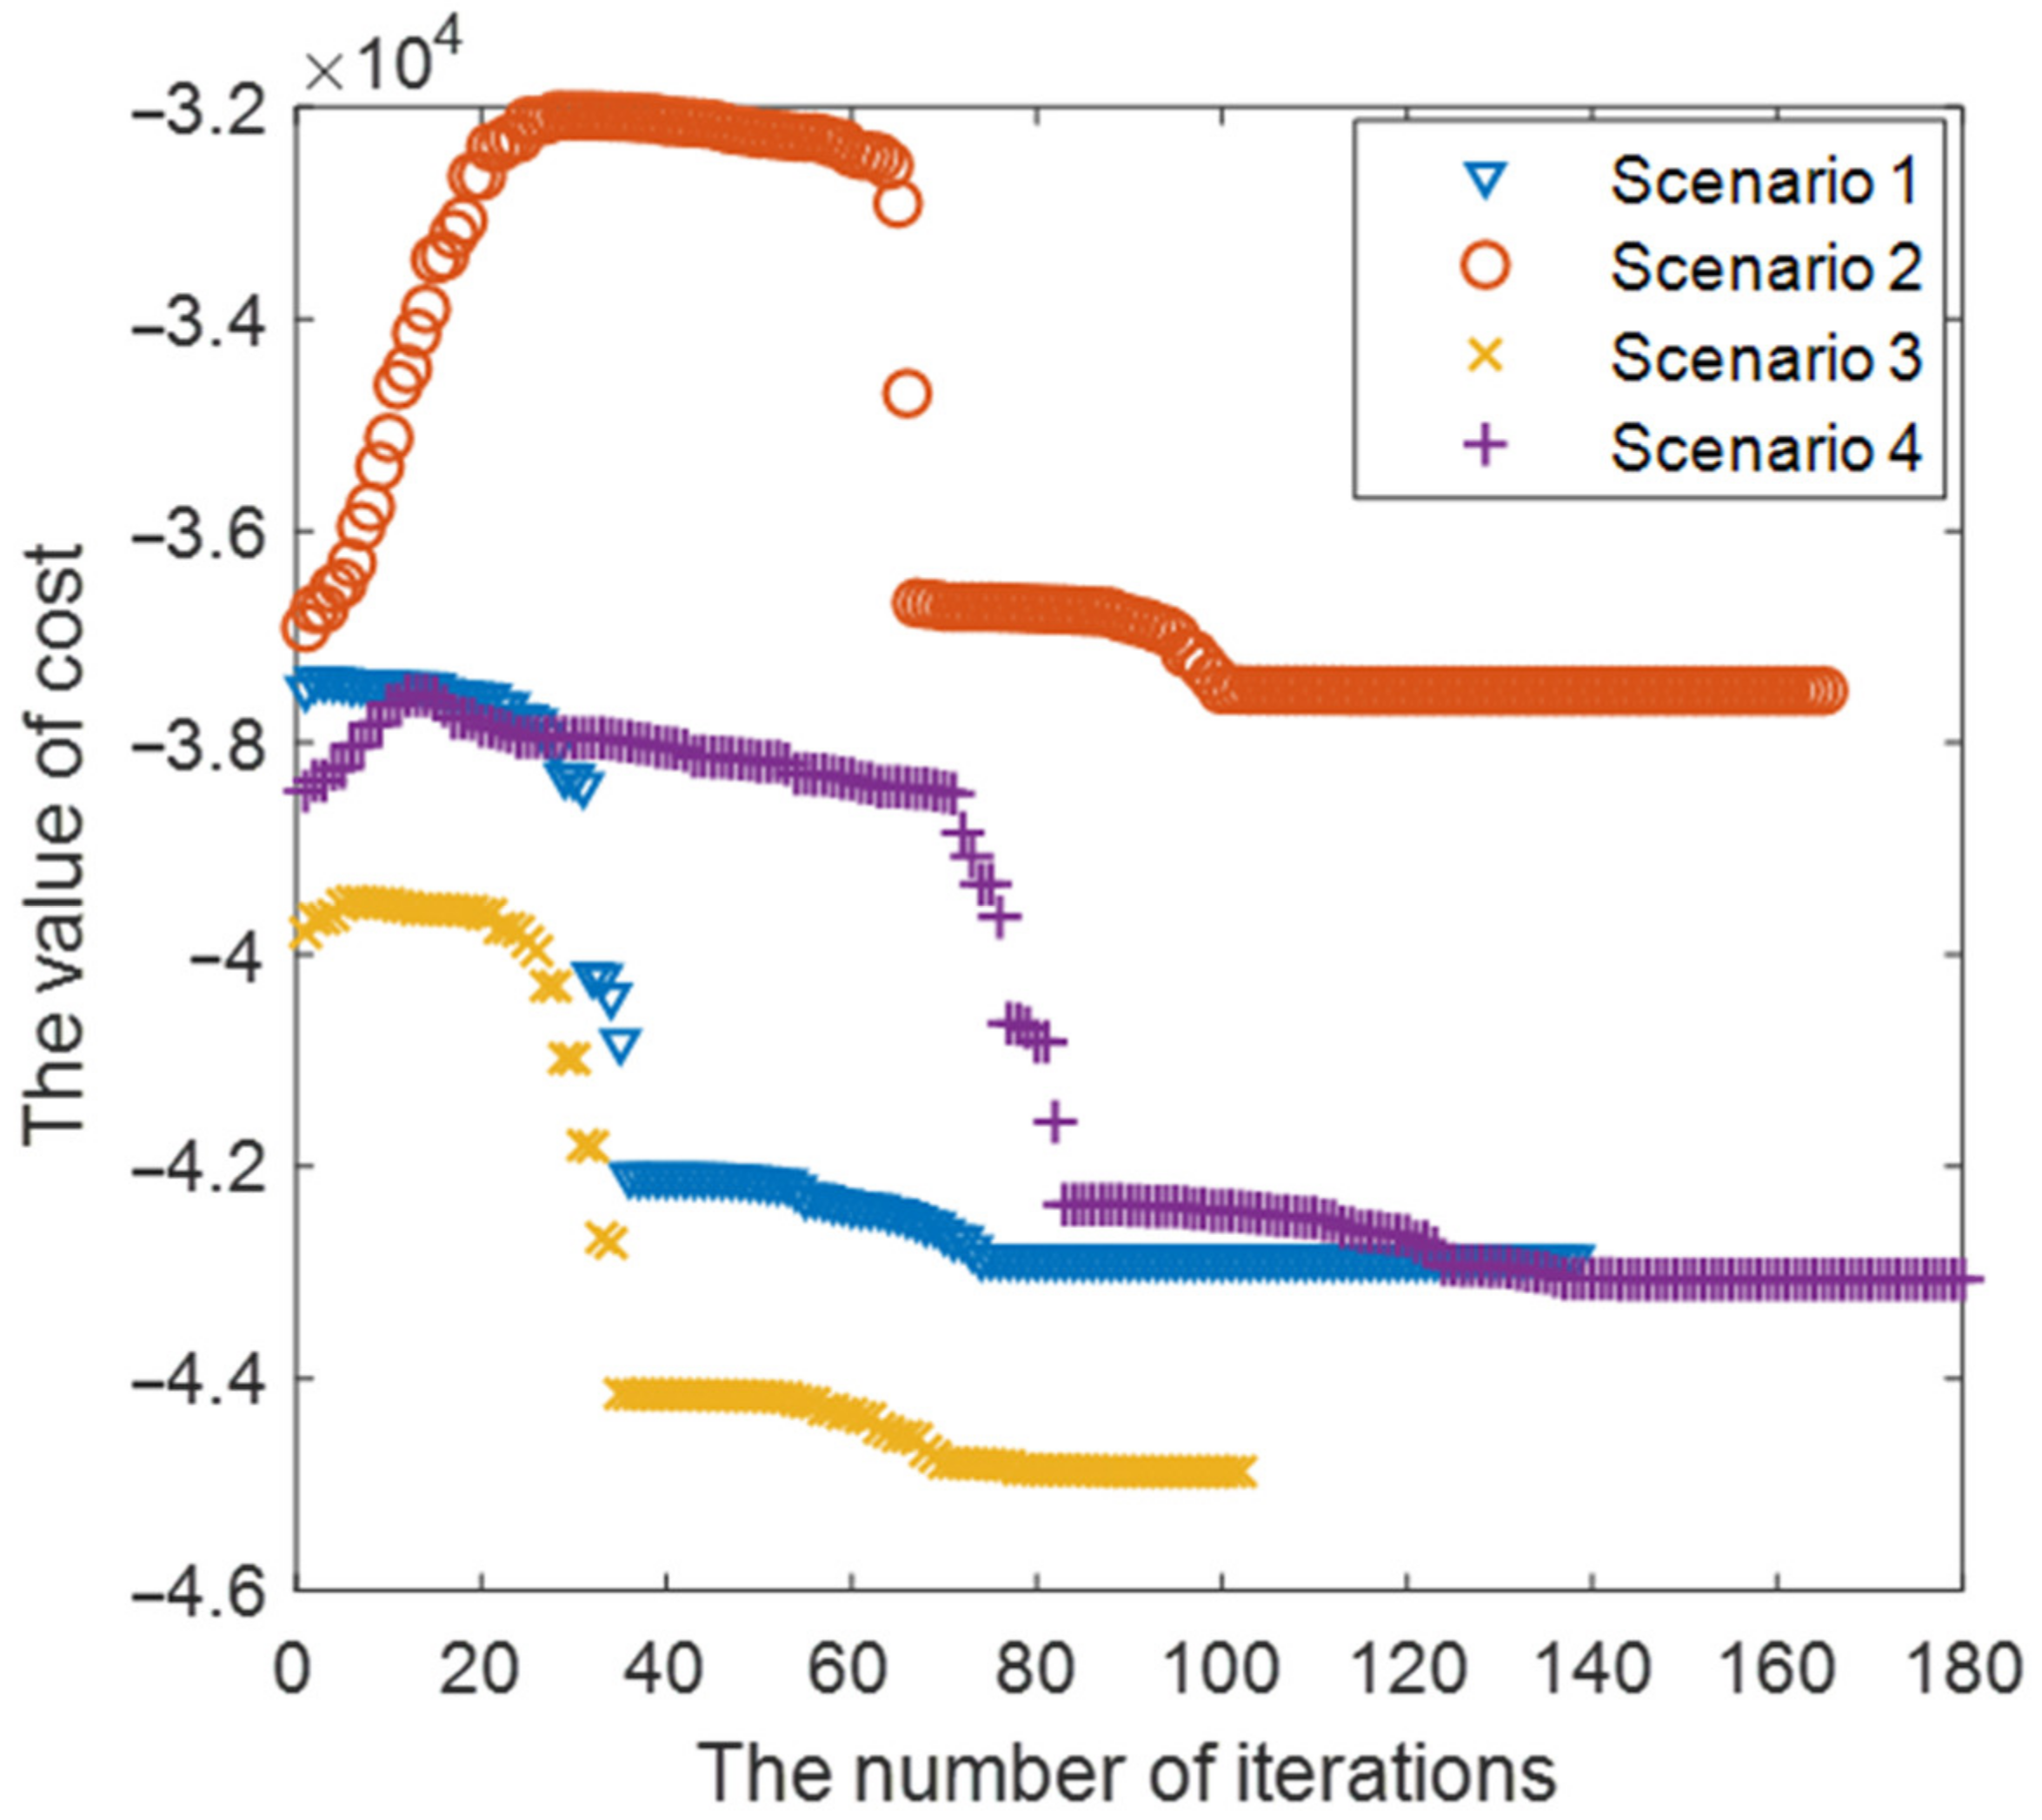
The optimal configuration result is different for different scenarios. The expected revenue of the optimal configuration model based on the stochastic optimization method proposed in this paper is 8.86% higher than that of Scheme 2, and 16.87% higher than without considering the stochastic optimization method. This proves the proposed stochastic optimization configuration method is of great significance to improve the economy.
The scenario generation method is the basis of stochastic optimization. The accuracy of the generated scenario may affect the results of stochastic optimization. This paper studied the time-divided probability distribution model, which improves the effect of stochastic optimization. In the future, it is necessary to continue to study the accuracy of the probability distribution model and the impact of their time correlation on stochastic optimization. The research in this paper can supply theory and application support to the operation and planning of PV-ES combined power stations. In future research, we will consider many different types of energy storage batteries and wind-PV-ES combined systems.

Author Contributions

Conceptualization, D.Z., Y.M., J.L.; methodology, D.Z., Y.M.; software, D.Z., Y.M., J.L.; validation, D.Z., Y.M., J.L.; formal analysis, S.J., Y.C., L.W.; investigation, S.J., Y.C., L.W.; resources, D.Z., Y.M., J.L., S.J.; data curation, D.Z., Y.M.; writing—original draft preparation, D.Z., Y.M., J.L.; writing—review and editing, D.Z., Y.M., J.L., S.J., Y.C., L.W., Y.Z., M.L.; visualization, D.Z., Y.M.; supervision, Y.Z., M.L.; project administration, Y.Z., M.L.; funding acquisition, Y.Z., M.L. All authors have read and agreed to the published version of the manuscript.

Funding

This work is supported partially by the National Natural Science Foundation of China (Grant nos. 71974055 and 51772096), Project Supported by Science and Technology Project of SGCC (SGJX0000KXJS1900321), Beijing Science and Technology Project (Z181100005118002), Par-Eu Scholars Program, Science and Technology Beijing 100 Leading Talent Training Project, the Fundamental Research Funds for the Central Universities (2020FR002, 2020MS023, 2020MS028) and the NCEPU “Double First-Class” Program.

Institutional Review Board Statement

Not applicable.

Informed Consent Statement

Not applicable.

Data Availability Statement

The data presented in this study are available on request from the corresponding author. The data are not publicly available due to the project is not completed.

Conflicts of Interest

The authors declare that they have no known competing financial interests or personal relationships that could have appeared to influence the work reported in this paper.

Nomenclature and Variable

PVPhotovoltaic
ESEnergy storage
SoCState of charge
ESSEnergy storage system
P P V , t PV power
P E S , t Storage charging and discharging power
kNumber of scenario
h Bandwidth
n Number of samples
t Time step
ξ Scenario’s occurrence probability
P ^ P V , t Predicted value of PV power at time t
P e , i , t Predicted error at the time t
f ¯ s Tevenue of selling electricity to the grid
f ¯ D Cost of degradation of the batteries
f ¯ p Cost of penalties imposed on the plant
c s , t Electricity price of selling power to the grid by the PV-ES combined system
P ^ P V _ E S , i , t Predicted power of the PV-ES combined system
P ^ E S , i , t Charging and discharging power of the ES during the prediction cycle
τ Combination of the current moment and the prediction cycle
C E Unit cost of the energy storage battery
E E S , N Rated capacity of the energy storage system
λ ^   τ Cycle life degradation rate of the battery over the predicted period τ
f p , t Penalty cost at time t
c p , t Penalty cost per unit of power
P r e f , t Reference value
P E S , N Rated power of the converter
S o C t SoC of the battery
S O C min Minimum SoC of the battery
S O C max Maximum SoC of the battery
η c h Charging efficiency
η d i s c h Discharging efficiency
D i Discharged depth of the i-th cycle of the battery
L B Number of cycle
L B , e q Total number of equivalent battery cycles
F s Revenue of selling electricity from PV-ES Combined system to the grid of one day
F i n v Investment cost converted to one-day
F D Cost of cyclic life degradation loss of batteries of one day
F p Penalty cost of one day
γ Conversion coefficient that converters the whole investment cost to one-day cost
P E S , N , i Rated power of the ESS
E E S , N , i Energy of the ESS
λ T Cycle life degradation rate of battery over time T

References

  1. Guney, M.S. Solar power and application methods. Renew. Sustain. Energy Rev. 2016, 57, 776–785. [Google Scholar] [CrossRef]
  2. Lee, Y.H.; Jeong, I.W. An Assessment of the Optimal Capacity and an Economic Evaluation of a Sustainable Photovoltaic Energy System in Korea. Sustainability 2021, 13, 12264. [Google Scholar] [CrossRef]
  3. Hossain, S.; Alharbi, A.G.; Islam, K.Z. Techno-Economic Analysis of the Hybrid Solar PV/H/Fuel Cell Based Supply Scheme for Green Mobile Communication. Sustainability 2021, 13, 12508. [Google Scholar] [CrossRef]
  4. Lu, Q.; Yu, H.; Zhao, K.; Leng, Y.; Hou, J.; Xie, P. Residential demand response considering distributed PV consumption: A model based on China’s PV policy. Energy 2019, 172, 443–456. [Google Scholar] [CrossRef]
  5. Shivashankar, S.; Mekhilef, S.; Mokhlis, H.; Karimi, M. Mitigating methods of power fluctuation of photovoltaic (PV) sources—A review. Renew. Sustain. Energy Rev. 2016, 59, 1170–1184. [Google Scholar] [CrossRef]
  6. Aneke, M.; Wang, M. Energy storage technologies and real life applications—A state of the art review. Appl. Energy 2016, 179, 350–377. [Google Scholar] [CrossRef] [Green Version]
  7. Xu, Z.; Feng, J.; Yan, X. Economic analysis of energy storage multi-business models in the electricity market environment. IOP Conf. Ser. Earth Environ. Sci. 2021, 634, 012059. [Google Scholar] [CrossRef]
  8. Fu, A.; Zhang, F.; Zhang, L.; Liang, J.; Xu, Z. Capacity Optimization Strategy of Energy Storage System for Power Grid with High Penetration of Photovoltaic Considering Limited Smoothing of Photovoltaic Ramping Power. Autom. Electr. Power Syst. 2018, 42, 53–61. (In Chinese) [Google Scholar] [CrossRef]
  9. Li, B.; Shen, H.; Tang, Y.; Wang, H. Impacts of Energy Storage Capacity Configuration of HPWS to Active Power Characteristics and Its Relevant Indices. Power Syst. Technol. 2011, 10, 579–600. (In Chinese) [Google Scholar] [CrossRef]
  10. Jahromi, A.A.; Majzoobi, A.; Khodaei, A.; Bahramirad, S.; Zhang, L.; Paaso, A.; Lelic, M.; Flinn, D. Battery Energy Storage Requirements for Mitigating PV Output Fluctuations. In Proceedings of the 2018 IEEE PES Innovative Smart Grid Technologies Conference Europe (ISGT-Europe), Sarajevo, Bosnia and Herzegovina, 21–25 October 2018. [Google Scholar] [CrossRef]
  11. Jamroen, C.; Usaratniwart, E.; Sirisukprasert, S. PV power smoothing strategy based on HELES using energy storage system application: A simulation analysis in microgrids. IET Renew. Power Gener. 2019, 13, 2298–2308. [Google Scholar] [CrossRef]
  12. Nazir, M.S.; Abdalla, A.N.; Wang, Y.; Chu, Z.; Jie, J.; Tian, P.; Jiang, M.; Khan, I.; Sanjeevikumar, P.; Tang, Y. Optimization configuration of energy storage capacity based on the microgrid reliable output power. J. Energy Storage 2020, 32, 101866. [Google Scholar] [CrossRef]
  13. Sidorov, D.; Tao, Q.; Muftahov, I.; Zhukov, A.; Karamov, D.; Dreglea, A.; Liu, F. Energy balancing using charge/discharge storages control and load forecasts in a renewable-energy-based grids. Chin. Control Conf. CCC 2019, 2019, 6865–6870. [Google Scholar] [CrossRef] [Green Version]
  14. Zou, H.; Tao, J.; Elsayed, S.K.; Elattar, E.E.; Almalaq, A.; Mohamed, M.A. Stochastic multi-carrier energy management in the smart islands using reinforcement learning and unscented transform. Int. J. Electr. Power Energy Syst. 2021, 130, 106988. [Google Scholar] [CrossRef]
  15. Tremblay, O.; Dessaint, L.A. Experimental validation of a battery dynamic model for EV applications. World Electr. Veh. J. 2009, 2, 930–939. [Google Scholar] [CrossRef] [Green Version]
  16. Alam, M.J.E.; Saha, T.K. Cycle-life degradation assessment of Battery Energy Storage Systems caused by solar PV variability. In Proceedings of the 2016 IEEE Power and Energy Society General Meeting (PESGM), Boston, MA, USA, 17–21 July 2016. [Google Scholar] [CrossRef]
  17. Han, X.; Liang, Y.; Ai, Y.; Li, J. Economic evaluation of a PV combined energy storage charging station based on cost estimation of second-use batteries. Energy 2018, 165, 326–339. [Google Scholar] [CrossRef]
  18. Sidorov, D.; Muftahov, I.; Tomin, N.; Karamov, D.; Panasetsky, D.; Dreglea, A.; Liu, F.; Foley, A. A Dynamic Analysis of Energy Storage with Renewable and Diesel Generation Using Volterra Equations. IEEE Trans. Ind. Inform. 2020, 16, 3451–3459. [Google Scholar] [CrossRef] [Green Version]
  19. Gu, W.; Tang, Y.; Peng, S.; Wang, D.; Sheng, W.; Liu, K. Optimal configuration and analysis of combined cooling, heating, and power microgrid with thermal storage tank under uncertainty. J. Renew. Sustain. Energy 2015, 7, 013104. [Google Scholar] [CrossRef]
  20. Ma, X.Y.; Sun, Y.Z.; Fang, H.L.; Tian, Y. Scenario-based multiobjective decision-making of optimal access point for wind power transmission corridor in the load centers. IEEE Trans. Sustain. Energy 2013, 4, 229–239. [Google Scholar] [CrossRef]
  21. Niknam, T.; Azizipanah-Abarghooee, R.; Narimani, M.R. An efficient scenario-based stochastic programming framework for multi-objective optimal micro-grid operation. Appl. Energy 2012, 99, 455–470. [Google Scholar] [CrossRef]
  22. Mohammadi, S.; Soleymani, S.; Mozafari, B. Scenario-based stochastic operation management of MicroGrid including Wind, Photovoltaic, Micro-Turbine, Fuel Cell and Energy Storage Devices. Int. J. Electr. Power Energy Syst. 2014, 54, 525–535. [Google Scholar] [CrossRef]
  23. Yao, Z.; Wang, Z. Two-level Collaborative Optimal Allocation Method of Integrated Energy System Considering Wind and Solar Uncertainty. Power Syst. Technol. 2020, 44, 4521–4531. (In Chinese) [Google Scholar] [CrossRef]
  24. Yan, R.; Lu, Z.; Wang, J.; Chen, H.; Wang, J.; Yang, Y.; Huang, D. Stochastic multi-scenario optimization for a hybrid combined cooling, heating and power system considering multi-criteria. Energy Convers. Manag. 2021, 233, 113911. [Google Scholar] [CrossRef]
  25. Mohamed, M.A.; Almalaq, A.; Abdullah, H.M.; Alnowibet, K.A.; Alrasheedi, A.F.; Zaindin, M.S.A. A Distributed Stochastic Energy Management Framework Based-Fuzzy-PDMM for Smart Grids Considering Wind Park and Energy Storage Systems. IEEE Access 2021, 9, 46674–46685. [Google Scholar] [CrossRef]
  26. Gröwe-Kuska, N.; Heitsch, H.; Römisch, W. Scenario reduction and scenario tree construction for power management problems. In Proceedings of the 2003 IEEE Bologna Power Tech Conference Proceedings, Bologna, Italy, 23–26 June 2003. [Google Scholar] [CrossRef]
  27. Heitsch, H.; Römisch, W. Scenario reduction algorithms in stochastic programming. Comput. Optim. Appl. 2003, 24, 187–206. [Google Scholar] [CrossRef]
  28. Han, X.; Chen, C.; Ji, T.; Ma, H. Capacity optimal modeling of hybrid energy storage systems considering battery life. Zhongguo Dianji Gongcheng Xuebao/Proc. Chin. Soc. Electr. Eng. 2013, 33, 91–97. (In Chinese) [Google Scholar] [CrossRef]
Figure 1. Structure of photovoltaic-energy storage (PV-ES) combined system. (n1 and n2 are number of series and parallel PV array; m1 and m2 are number of series and parallel battery.)
Sustainability 14 00553 g001
Figure 2. Block diagram of the optimization configuration method.
Sustainability 14 00553 g002
Figure 3. Rolling predicted diagram.
Sustainability 14 00553 g003
Figure 4. Distribution of ultra-short-term predicted error of PV power. (a) 9:00. (b) 10:00.
Sustainability 14 00553 g004aSustainability 14 00553 g004b
Figure 5. PV power scenarios.
Sustainability 14 00553 g005
Figure 6. Output power of energy storage system under different scenarios.
Sustainability 14 00553 g006
Figure 7. SoC of energy storage system under different scenarios.
Sustainability 14 00553 g007
Figure 8. Solution process of optimal configuration of energy storage under different scenarios.
Sustainability 14 00553 g008
Figure 9. The expected revenue in a different battery’s unit cost.
Sustainability 14 00553 g009
Table 1. Bandwidth of kernel density distribution of different times.
Time9:009:159:309:4510:0010:1510:3010:45
Bandwidth0.00700.00840.01120.01220.01340.01390.01560.0165
Time11:0011:1511:3011:4512:0012:1512:3012:45
Bandwidth0.01120.01280.01390.01730.01510.01760.01870.0220
Table 2. The PV module’s parameters.
ParameterValue
Maximum power (Pmax)310 W
Open circuit voltage (Voc)45 V
Maximum power voltage (Vmp)37 V
Short circuit current (Isc)8.8 A
Maximum power current (Imp)8.38 A
Maximum series fuse rating20 A
Table 3. Operation income of PV-ES combined power station.
Scheme 1 (¥)Scheme 2 (¥)
Expected value13,617.3912,854.77
Scenario 113,405.9314,310.93
Scenario 213,256.2712,217.82
Scenario 314,118.5210,887.97
Scenario 414,238.6612,034.02
Table 4. Comprehensive income of optical storage station.
Scheme 1 (¥)Scheme 2 (¥)
Expected value42,592.4039,127.04
Scenario 142,865.7439,415.28
Scenario 237,509.7235,656.07
Scenario 344,876.4342,031.51
Scenario 443,063.2738,746.59
Publisher’s Note: MDPI stays neutral with regard to jurisdictional claims in published maps and institutional affiliations.

