1. Introduction
The COVID-19 pandemic showed many countries’ low preparedness for such crisis events [
1]. Decisions had to be made during conditions of significant uncertainty regarding several factors, including the case fatality rate [
2], the infectiousness and spread of the virus, and the real number of asymptomatic cases [
3]. Risk mitigation measures such as vaccines were initially missing [
4]. Even after the emergence of vaccines, issues such as uneven rollouts, uncertainties regarding their effect on infectivity and spread, and the lack of reliable information about other policy measures’ effectiveness made estimations on how to protect society from the spread of the virus or how to reduce the vulnerability quite challenging. In choosing how to respond to the COVID-19 outbreak, decision-makers were informed by expert advice and uncertain quantitative evidence [
5], by evaluations of the health system capacity, by the national and global public debates on the issue [
6], and by socio-behavioural insights concerning the expected public compliance with more or less restrictive policy measures. However, in deciding which policy measures to adopt, many countries behaved in uncoordinated manners, with several inconsistencies appearing in the disaster risk handling of the COVID-19 pandemic; for instance, different measures were often undertaken in bordering countries or regions with similar 14 day notification rates, and decisions to impose lockdowns were often not determined by the number of confirmed cases alone. Furthermore, decisions on various nonpharmaceutical measures were undertaken to avoid fatalities in the short term, but the same measures might produce indirect long-term societal damages to society due to economic recession, reduced access to education, restricted movement, or restricted access to healthcare to non-COVID-19 patients [
7]. Many measures limit societal freedom and have a wide range of various costs, potentially increasing the burden of disease in the long term. The consequences of such inconsistencies and limited assessments of policy measures’ impacts are, to a large extent, still unforeseeable. While studies on COVID-19 have discussed risk assessments and domain-specific impact assessments, the problem of how to evaluate various containment measures for policymaking, which includes both cross-sectorial impacts and stakeholder consultations, remains largely unsolved and often politicised.
In this paper, we apply a framework for elaborated decision making under uncertainty about the current and future pandemics, which includes epidemiological estimates and socioeconomic factors in a multicriteria and multistakeholder analysis of the pandemic handling in Jordan. This decision-making methodology can be used in handling the current or future challenges of pandemic situations, to facilitate management and mitigation of similar crises in the future, in any region. It also provides recommendations for the assessment and evaluation of different scenarios and their impacts. Moreover, it can also be used for designing strategic communication in the public sphere and facilitating discussions about various policies, alternatives, and trade-offs under conditions of significant uncertainty.
Our framework includes the following:
- ◦
A multicriteria model, based on a demography-based model for contagion rate and socioeconomic impact estimates and utilising surrogate weights for efficiency;
- ◦
A cocreation framework, where relevant stakeholder groups (policymakers, private sector, decision-makers, academia, civil society, banks, and local community representatives) can evaluate available mitigation measures of choice against the different criteria according to stakeholder preferences;
- ◦
A balanced set of sustainability criteria based on literature reviews and stakeholder’s judgments;
- ◦
A policy recommendation on how an emergency process also for future events can be designed in a publicly acceptable way with the potential for “triple wins” concerning catastrophic events, sustainable development, and social protection in a broader sense.
The framework was first applied in Romania during Q3 and Q4 of 2020 [
8] and then adapted to Jordan to attest and refine our method to accommodate any context-specific relevant data and stakeholders into COVID-19 decision-making responses and mitigation activities. This includes establishing a set of criteria and alternative mitigation measures that could be adopted locally, value estimates on the chosen criteria including modelling the epidemiologic evolution in every alternative scenario, and socioeconomic estimates for several criteria. For our demonstration of how the framework can be applied in any region, we used a simplified process by which to obtain socioeconomic impact assessments, which can at any point be refined by decision-makers using more comprehensive instruments and data. Then, we used a cocreation framework where we obtained stakeholder evaluations on criteria and their weights. These were then aggregated and evaluated in the decision analysis software tool Helision (
https://helision.com/, accessed on 19 December 2021). Input from stakeholders was essential for developing compromise-oriented policy solutions for management and mitigation of similar risks in the future, achieving a greater level of acceptance and legitimacy, as well as facilitating and improving implementation processes of various risk mitigation measures. Defining and interpreting public interest involves well-known problems, and there are several imperfections present in public decision-making processes. The process adopted in this study was basically as follow:
Form an adequate group of stakeholders relevant for the decision process;
Identify options for relevant criteria and sub-criteria;
Discuss criteria and sub-criteria with the stakeholders in various formats (questionnaires, interviews, workshops, etc.);
Collect stakeholder feedback on criteria and sub-criteria;
Discuss the ranking of each criterion and sub-criterion with the stakeholders;
Collect stakeholder feedback on the rankings;
Valuate the options under the respective criteria and define value functions;
Calculate the overall values on the basis of criteria weights and policy values.
Such a process yields some relevant concepts to be pursued in a policy formation and provides constraints on public decision-makers’ discretion in their definition of the public interest, with the main objective being to make sure that the public interest is captured from an aggregation of stakeholder preferences on criteria and weights. Each of the steps in the process normally requires a variety of techniques and deliberations. While the type of stakeholder group inclusion used in this work is far from exclusive, it is a way of rapidly reaching a level of understanding for the problem structure and constitutes a basis for decision making. It, thus, provided (i) an overview of stakeholder preferences for the policy formation work process, and (ii) formed an information and action basis that was understood and accepted by a majority of the participants (see, e.g., [
9]).
The resulting integrated multistakeholder and multicriteria framework can be used for better emergency preparedness for the COVID-19 pandemic, as well as for future catastrophe scenarios. We recognise that both socioeconomic conditions and medical healthcare capabilities may vary greatly, which will affect the feasibility of certain policy measures in specific regions, as well as affect the quality of data. Therefore, the use of any framework must be adapted to the situation of the country or region studied; for example, the Global Health Security Index can provide data on national and regional detection, responses, and medical capabilities, yielding a baseline when considering mitigation measures. The propagation of SARS-CoV-2 also emphasises that the model must be used flexibly and adapted to the region at hand. However, policy measures need to be based as much as possible on sufficient estimates of a certain situation, including epidemiological modelling and comprehensive analysis of costs, as well as on the extent to which various policy measures can play a role. Because of the significant variety of factors involved, decision frameworks should be able to manage uncertainties, perceptions, their causes, and various preference structures.
2. Literature Review
The typical studies investigating interventions against pandemics focus on specific performance aspects, usually being restricted to a solitary situation and rarely intended to unequivocally consider the innate vulnerabilities in both results from simulations and situational probabilities. Our framework using more dynamic multicriteria decision analysis approaches has previously been used to synthesise outcome predictions and stakeholder preferences into decision recommendations [
10].
Measures to reduce the spread of the SARS-CoV-2 virus have been informed by various epidemiologic risk assessments made by the World Health Organization (WHO), by various centres of disease control and prevention in Europe, as well as the United States, and by various consultants and trusted parties [
11]. These evaluations set up scenarios beginning with the quantity of affirmed infections in a country, with each scenario containing a progression of suggestions on control measures to reduce the spread of the virus. The reliability of such assessments depends on how accurate the models of various risk mitigation measures are and, of course, on the input data they are using. Many epidemiologic models are not calibrated according to relevant factors such as demographics, age groups, and their interaction patterns. Their presumptions are additionally that there is no adjustment of conduct by people and that preventive measures are set up at one explicit point in time. Then, at that timepoint, an adjustment is made utilising the noticed number of fatalities and appraisals of the time intervals between infection and demise and the infection fatality hazard. It is likewise presumed that the general impact of preventive measures is known. The impacts are assessed from the noticed increased doubling time after preventive measures are set up. Notwithstanding, the predictions are exceptionally sensitive to the doubling times with and without preventive actions, just as to, for example, the reproduction number, yet less sensitive to the assessments utilised for time adjustments: noticed number of fatalities, the average time between infection and demise, and the infection casualty hazard [
12]. Furthermore, there is limited evidence in currently used models [
13] on how each individual policy measure reduces the rate of transmissibility.
For instance, [
14] claimed that “
the incremental effect of adding another restrictive measure is only minimal and must be contrasted with the unintended negative effects that accompany it”. Combining case quarantine with other public health measures has been shown to be more effective than only relying on quarantine. There is also evidence that contact tracing together with some other measures increases the impact of the latter [
15]. For instance, contact tracing together with public disclosure of the location of active cases could lower the fatalities, while reducing the economic cost by 50% compared to a full lockdown [
16]. An example seems to be the comparatively cheap measure of wearing face masks to diminish contagiousness when consistency in wearing is high, simultaneously significantly decreasing both the loss of life and the financial effects [
17]. Be that as it may, how powerful is it to close schools, close boundaries, suspend or lessen national and global travel [
18], or restrict some workplace activities? To what extent do such measures lower the rate of transmissibility and do the benefits of implementing them outweigh the costs? Lastly, given that some measures can only be implemented temporarily (such as lockdowns, closures of various economic sectors), by what amount can a nation develop its medical services during the restriction time frame?
In addition to increasing healthcare and treatment optimisation efforts, nonpharmaceutical measures are gradually layered, from lower-cost measures (improving personal hygiene by washing hands, disinfecting surfaces, and wearing masks) to isolating individuals with confirmed infections. The virus ultimately leads to more costly social distancing measures. Countries have adopted different methods to decide which policy measures to adopt and when to implement them. Although some countries (Japan, Taiwan, Iran) avoided adopting more radical social distancing measures, the main approach in many countries was to choose more extreme social distancing measures. In fact, the dominant approach was to opt for stronger social distancing measures (Austria, Italy, Romania, Hungary, Denmark, etc.), ranging from case quarantine and bans of public gatherings to partial or full societal lockdowns, closing schools, many workplaces, and public transport, as well as limiting citizen movement. Interestingly, Taiwan, despite its proximity to China, had one of the lowest stringency levels [
19] as they mostly focused on tracing and isolating measures. Taiwan’s previous experience with the 2003 SARS outbreak might explain a series of quick decisions involving voyager screening and swift distribution of face masks, hand sanitisers, and thermometers [
20].
Jordan was one of the first countries in the world which imposed a full lockdown on 14 March 2020. The COVID-19 pandemic risk mitigation measures included drug measures and case isolation, individual defensive measures (remaining at home, hand washing, respiratory manners, cleaning oftentimes contacted surfaces every day, wearing mouth and nose covers in the form of masks), as well as the defence-first order with different imposed measurement, with social distancing measures and restrictions on mobility such as school closures and restaurants and large shopping centres closing. People could only go out of their homes for their basic needs. The nationwide curfew lasted during the period from 18 March 2020 until 29 April 2020. On 29 April 2020 and until 6 June 2020, the government of Jordan announced a partial lockdown with extensive telework where it was possible. The movement between various regions of Jordan was restricted. This lockdown in Jordan heavily affected its economy. The daily workers were affected the most, followed by employees of the private sector. During the summer, the number of COVID-19 cases declined; however, they started to increase sharply again in September 2020. The government of Jordan reacted with a full lockdown on Fridays and the introduction of e-learning in universities and schools, restrictions that eased up in early February 2021 only to be resumed 1 month later due to the rising number of cases. During this period, all socioeconomic sectors in Jordan became affected including education, political, economic, social, religious, and health sectors [
21].
By the size of the population, Jordan ranks 11th in the Arab world, with 10,806,000 people, out of which more than half are under 24 years old and around 3.6% are over 65 years old. Life expectancy at birth is estimated at 74.5 years, with 10.5 mean years of schooling [
22]. In what concerns emergency preparedness and response planning, Jordan has a GHS index score of 12.5, given the lack of a public health emergency response plan to address communicable diseases with pandemic potential, aside from influenza [
23]. While it lacks emergency operations centres, it does have good risk communication (score 100.0) and good access to communications infrastructure, using various platforms to inform the public in case of an emergency. With low financing (16.7), however, healthcare access has a score of 32.3, and the health capacity in clinics, hospitals, and community care centres is similarly limited (37.4). In 2020, Jordan had an INFORM Risk score of 4.6, with serious risks posed to vulnerable groups, particularly refugees (7.8), and an increased risk posed by the lack of institutional coping capacity (5.6).
In early 2020, an assessment of Jordan’s detection and response capacity to COVID-19 was conducted by the government, with the support of the World Health Organisation, which served as a basis for the National Preparedness and Response Plan (NPRP). This is being implemented through the COVID-19 Emergency Response Project partly funded by the World Bank Group, primarily aiming to increase medical infrastructure capacity and to train key staff in infection and prevention control. The project’s outputs, as funding provisions stipulate, are in line with WHO guidelines for combating COVID-19 and are meant to strengthen the country’s resilience to future pandemic scenarios as well. Among the critical gaps observed in the NPRP are “
country-level coordination planning and monitoring, and risk communication and community engagement”, addressed in the project through the “
provision of on-time data and information for guiding decision-making response and mitigation activities” (Part 1.1) and supporting “
community mobilisation and participation in prevention and control measures” (Part 1.3) [
24]. To date, the Stakeholder Engagement Plan (SEP) [
25] only includes information dissemination and awareness campaigns, targeted at the various affected and interested parties, as well as for the vulnerable groups including refugees, elderly people, or illiterate persons. There are, however, no provisions related to stakeholder consultations for decision making on mitigation measures, although cocreation in risk management and governance has shown that eliciting societal preferences increases community participation and adoption of key prevention behaviours. Furthermore, it is still unclear whether suppression strategies effectively reduce the spread and mortality rates in the medium and long term; in July 2021, Jordan’s number of COVID-19 deaths per 100,000 population was 97.96 [
26], with a 1.3% case fatality rate following two main pandemic ‘waves’, one in November 2020 and one in March–April 2021.
Our analysis compares the effectiveness of various mitigation scenarios, taking into consideration both epidemiologic and socioeconomic data for the period March 2020–January 2021. Data were collected from various sources including, but not limited to, the database of the Ministry of Health and the World Bank, as well as economic data on GDP and other economic parameters from the Department of Statistics.
3. Research Methodology
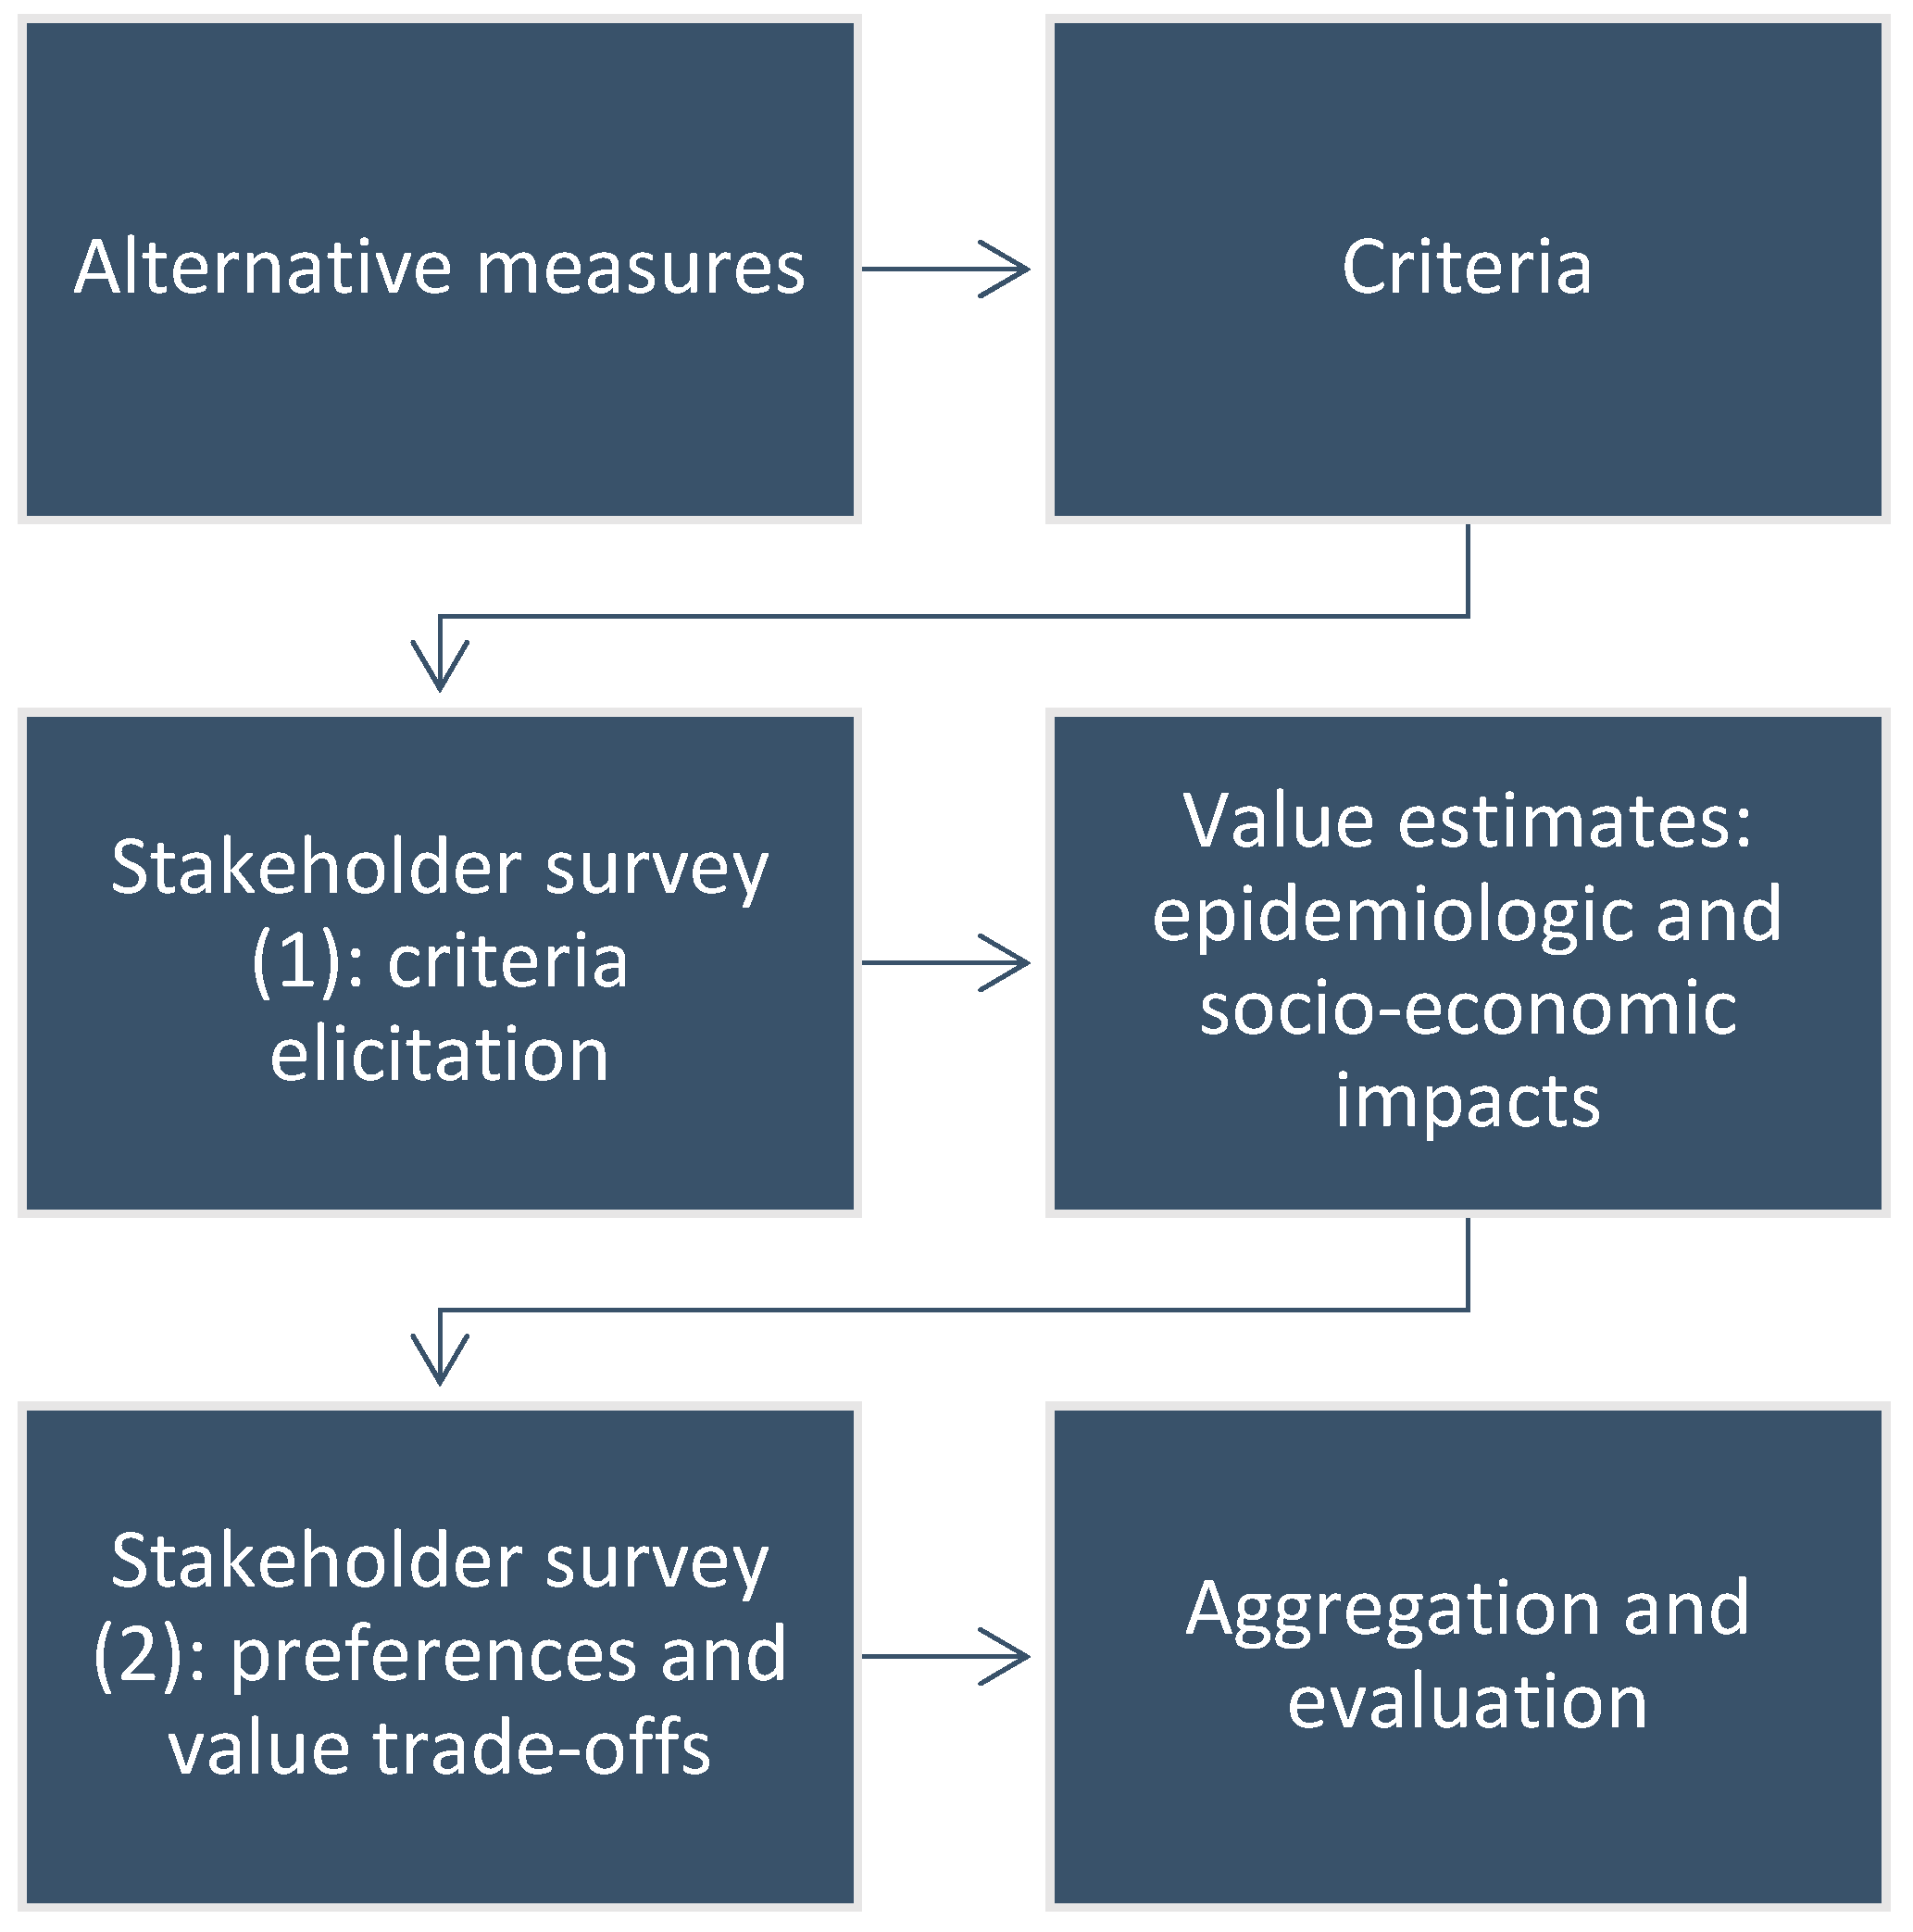
When applied to the mitigation of COVID-19, the method’s components can be divided into (i) cocreation preference measuring components, (ii) impact assessment components, including epidemiological and socioeconomic values, and (iii) aggregation and analysis components. This means that, relative to possible mitigation measures, we model the actual spread of key healthcare aspects and their impact on the population, taking into account demographical and regional conditions, and estimating the impact of policy measures from other perspectives, mainly socioeconomic ones. It is important to note that suitable support tools are being used in the deliberation process, including the structuring of decision-making situations and providing information about possible policy measures and standards. These processes are best put in place in advance as part of a disaster prevention plan and decision-making mechanism, rather than conceived in an emergency when there might be little time for applying a more elaborate and time-consuming decision apparatus.
Our methodology can be summarised in the following flowchart, each step of the workflow being detailed in subsections below (see
Figure 1):
3.1. Alternative Measures
The short-, medium-, and long-haul socioeconomic costs related to mitigation measures should be discussed and taken into consideration when gauging their estimated benefits. To showcase how these impacts could be included in the decision-making process on pandemic response, we use a more high-level perspective and single out four classes of policy measures to compare. Since a detailed analysis of all sectors is beyond the scope of this paper, we evaluate the different effects of these policy measures, both epidemiologically and socio-economically, by looking at their different consequences on criteria such as education, human development, and mental health, and wellbeing.
For our application, we used the following scenarios of COVID-19 risk mitigation and policy measures in Jordan:
Level 1: An epidemic that has not been alleviated—a scenario where no action is taken except drug policy measures and case isolation.
Level 2: Level 1 + public communication to strengthen hygiene and personal protection, and local countermeasures (close schools and workplaces when multiple cases are observed) in line with the influenza epidemic.
Level 3: Level 2 + personal protection measures (stay at home when sick, wash hands often, breathing etiquette, cleaning frequently touched surfaces every day, wear masks), along with moderate social distancing measures (banning large public gatherings, work from home as much as possible, recommendations to maintain social distancing).
Level 4: Level 3 + lockdown: enforced distancing measures and mobility restrictions, where schools and public areas closed down, and citizens are allowed to go outside only for basic necessities and work.
3.2. Criteria
A large number of techniques for examining and assessing selection problems involving multiple stakeholders and criteria have been developed during the last many years. A fundamental part here is a well-defined set of criteria, under which the different alternatives of action are evaluated. The conceivable policy measures to be considered are assessed under each criterion, and the importance among the different criteria is typically represented by criteria weights. Contingent upon the public discussions and plan, country advancement, partners’ needs, and information accessibility, the following rule set was utilised as a premise:
Health aspects: (A1) direct fatalities; (A2) indirect fatalities; (A2.1) changes to adult social care; (A2.2) impacts of social distancing and economic deprivation; (A3) mental health; (A4) universal healthcare access;
Economic impact: (B1) GDP growth; (B2) unemployment; (B3) country development; (B3.1) Human Development Index; (B3.2) Democracy Index;
Education: (C1) number of school days lost; (C2) educational inequalities; (C3) risk of school dropout;
Wellbeing: (D1) quality of life; (D1.1) emotional impact; (D1.2) violence against women; (D2) community mobility, among others, a set that could be expanded after literature surveys and information elicited from stakeholder groups. The criteria were set up after checking the media for pandemic reactions between February and September 2020 in Jordan, as well as after a series of exploration studies of scientific and grey literature on COVID-19.
We used a subset of criteria (see
Figure 2) for which value estimates could be made, given the data availability, which was validated through stakeholder consultations, as described below.
3.3. Risk Handling
Although COVID-19 is a recent phenomenon, scientific inquiry into the risk management of various aspects of handling the pandemic in society has been underway almost from the inception of the pandemic. For example, ref. [
27] reviewed 24 early papers on different aspects of COVID-19 pandemic risk management ranging from virus testing schemes to early national responses. The concept of risk itself is not unproblematic. Aven and Renn [
28] noted that there is no commonly accepted definition of risk and listed 10 widespread suggested definitions. They divided them into two groups: risk being expressed by probabilities leading to expected values and risk being expressed as uncertainties regarding events. To this can be added uncertainties regarding the modelling elements themselves. Our methodology uses the former group of definitions and uses at its core a decision analytic tool which can model events in event trees. One underlying idea is to deploy mitigation measures promptly while not having the planned policies violate some tolerable level of effectiveness measured through several different metrics. Thus, the approach conforms reasonably well to the “as low as reasonably practicable” principle (ALARP) [
29]. How such event trees can be combined with an MCDM model is described in [
30]. An event tree contains a root node (the decision node), a set of probability nodes, and consequence nodes (outcomes). The probability nodes are assigned probability distributions representing the uncertainties in the decision situation. When an alternative
Ai is chosen, there is a probability
pij that an event will occur that leads either to a subsequent event (with, say, probability
pijk) or a consequence. The consequences are assigned values
vijk on a designated scale, with different scales for different criteria. For a suggestion on monetary measurement scales and methods in measuring financial risks using net present values, see [
31]. The event trees can then be added to a criteria hierarchy, yielding a model which is evaluated using Equation (2).
There is also another possibility for modelling risk in our methodology, this one likewise adhering to an expected value definition of risk. The risk expressions are divided into probabilities residing in an epidemic model (see
Section 3.4.1) and values residing in an MCDA model (see
Section 3.4.2). The latter approach is described below.
3.4. Value Estimates
Since estimations of COVID-19 cases and fatalities were the main triggers of the emergency and resulting adoptions of various mitigation measures, we utilised a variety of the SEIR (susceptible, exposed, infected, recovered) model. Such models are standard to address the spread of infection in a population where individuals are divided into sections on the basis of their resistance status. We applied an SEIR model for modelling the impacts of different risk reduction measures. This model incorporates country-explicit data, for example, population size separated into age clusters, morbidities in the population per age cluster, current quantities of affirmed cases each day, partitioned per age cluster, and case seriousness. The simulations of the policy successes in containing the infection spread were conducted using AnyLogic 8. The outcomes should be considered against a benchmark for the clinical capacity of each nation (no. of intensive care unit beds, ventilators, drugs, testing limits).
For socioeconomic estimates on the chosen criteria, we collected data from official statistics, indices, economic monitors, and forecasts, as well as scientific and grey literature on the impact of the pandemic in Jordan.
3.4.1. Epidemiologic Estimates
As to epidemiological information, SEIR models are regularly used to represent the spread of sickness in a populace. Individuals are divided into three (or four) categories (susceptible (S), exposed (E), infected (I), and recovered (R)), as well as deaths (D) in certain models. In these models, a set of coupled differential equations oversees the streams between the various categories as time goes by: individuals becoming infected go from S to I, and individuals who recuperate (or bite the dust) go from I to R. System dynamics is a common selection for simulation models involving transmission processes since the method assumes an all-encompassing approach and spotlights which parts in the system influence one another via positive or negative feedback loops [
32,
33]. A common SEIR model operates on the following parameters: mortality, spread rate, recovery rate, mean time of infection, rate of movement from exposed category to infectious category, and the mean period of latency, as well as the basic reproduction rate R0 [
34].
During planning for intervention measures against outbreaks of pandemics, various computer-based support tools are commonly used. The Swedish National Board of Health and Welfare (
Socialstyrelsen) has supported the development of a decision support system to be used in parallel with the MicroSim model which is an individual-based, total-population model [
35]. Some requirements for tools of this kind are that they should support different scenario analyses and be easy to adapt and run. Precise forecast models are typically essential to produce acceptable forecasts on time. In recent years, many simulation tools have emerged such as AnyLogic, allowing quick usage of generic SEIR modelling that was used in recent studies, such as studies of the earlier coronaviruses SARS-CoV and MERS-CoV, and the Zika virus [
36,
37]. There are, thus, a huge number of epidemiological models around, but there are nevertheless quite strong reasons to keep as much as possible as simple as possible. The more input parameters we have, the more diffuse everything becomes if we cannot make them local due to the already enormous state space. One big challenge is rather to get realistic input data; there are many uncertain parameters with COVID-19 and models more complex than the training and validation data ought to be used very sparingly as bases for decision.
For the simulation below, the input parameters are detailed in
Appendix A. The results from the basic assumptions are provided in the figures below. This is, however, based on an incomplete dataset that must be adjusted and adapted to different regions, particularly since SARS-CoV-2 is displaying a more “regional” pattern than, e.g., a seasonal influenza. The particular conditions in Jordan cannot be compared in a simple way and the micro and meso perspectives should play an important role in this case.
The simulations of the effects and outcomes of respective measures in reducing the infection spread in Jordan were conducted using AnyLogic 8, in light of a dataset that ought to be modified and adjusted to various locales. The model uses the Jordanian populace separated into three age clusters: 0–24, 25–64, and 65 years of age or more, as indicated by public profiles (see
Appendix A). The number of days from being infected to becoming infectious was, on average, 5.1 days and the time staying infectious was 5.0 days. The model was fitted against the everyday number of detailed cases per age cluster until 30 January 2021, as reported by the Ministry of Health in Jordan [
38]. Until the end of January 2021, 4304 deaths from COVID-19 and 311,481 cases of infected people were recorded. The 14-day incidence rate at the beginning of February was 6.12, much lower than in the previous weeks. An infectivity parameter, a relative contact decrease, and the extent of unreported cases were adjusted for each age cluster. Unreported cases were thought to be less contagious than reported ones, taking into account that these have milder effects. The contact profile changed three times during the simulation, using two periods with various infectivity and rate of unreported cases. This standard scenario was then used to compute the outcomes of different mitigation strategies.
The outcomes from the four policies with their suppositions are given in
Figure 3,
Figure 4,
Figure 5 and
Figure 6, where the results from 1 January 2020 to 31 December 2021 are displayed along with the genuine data reported in 30 January 2021. Since our case study utilises values assessing the effect of different strategic policy measures for 2020, in assessing direct fatalities, we added the unreported infections in a single year for levels 1–4 using a fatality ratio of 0.23.
In the
Figure 3,
Figure 4,
Figure 5 and
Figure 6 above, the red graphs show the positive cases occurring each day, and the blue graphs show the unreported cases.
Because of the uncertainties involved in the parameters of the simulations, we utilised a 10% uncertainty span when representing the fatalities as seen in the figure captions.
3.4.2. Socioeconomic Estimates
All schools, kindergartens, and universities (private and public) were closed from 15 March until 22 June for the spring semester of the academic year 2019/2020, impacting 2.37 million students. Schools moved to distance learning, televised lessons started to be broadcasted nationally, and digital platforms were established to facilitate access to educational content and a new learning management system. The Ministry of Education announced the launch of the Darsak platform, an online education platform set up to host the new televised lesson content in Arabic by lesson targeting grades 1 to 12. The summer semester of the academic year 2019/2020 also shifted to distance learning. Around 30 days were lost from the previous academic year, due to the introduction of an electronic education system for distance learning and teachers’ union strikes [
39,
40,
41].
At the beginning of the academic year 2020/2021, all students went to school while taking into consideration all safety instructions existing on 1 September 2020. Then, schools that registered COVID-19 cases were closed and taught through e-learning methods. After that, the pandemic risk management rules were issued to stop the education process at schools physically, with all students except for grades 1, 2, 3, and 12 moving to distance learning. If there was any confirmed case of COVID-19 in a school, then this school changed to distance learning for 14 days. Starting from 16 October 2020, all schools shifted officially to distance learning for all grades. Moreover, universities moved to distance learning except for practical laboratories and clinical faculties. The beginning of the semester was postponed for 14 days, from 27 September 2020 to 11 October of the same year.
The closures of schools brought a risk of an increased learning inequality and dropouts of pupils. According to the results of a survey run by the Ministry of Education, only 30% of students nationwide had access to the televised materials, while only 70% of students were able to access the educational materials online via the official educational platforms. The majority of refugees reside in urban areas, where over 85% are living below the poverty line. The policy measures taken to mitigate the pandemic are likely to exacerbate already existing educational inequalities.
Thus, we calculated, in terms of school days lost, that 30 days were lost in 2020 for 2.37 million students and 110 days were lost for at least 30% of the students, i.e., those who did not have access to online education.
Jordan’s human development index value in 2020 was 0.729 [
42]. Since this depends on education indicators, as well as on GDP, for which reliable estimates were not available at the time of our evaluations, we took into consideration the country’s risk class (medium) in the INFORM Global Risk Index 2021, where there is an increased risk in socioeconomic vulnerability (3.6), especially with regard to vulnerable groups (7.8). We estimate, therefore, that human development is most severely impacted by the highest stringency levels (Level 4), followed by Levels 3 and 2 where we estimate a moderate impact, with the lowest impact on this indicator being estimated for policy measures that do not include social distancing (Level 1).
In what concerns mental health, we assumed the levels of incidence increase on the basis of reports on mental health for Level 4 (the real-life measures in Jordan) [
43,
44]: 79% of female Jordanians and 70% of male Jordanians reported their mental health being affected during the pandemic; 72.4% of the respondents to a national survey reported increased anxiety, irritability, and anger, 67.5% reported sadness and depression, and 62.5% reported fear. The respondents asked for a cancelation of the curfew. We assume that the more stringent the policy measures are, particularly in reducing social mobility, the more the impact on mental health increases. Therefore, for Levels 1 and 2, the percentage of acute mental health cases due to COVID-19 decreases gradually for both genders [
45].
The values used in the evaluations are provided in
Table 1.
3.5. Cocreation Process: Stakeholder Rankings
In policymaking processes, consulting stakeholder groups is, in general, important for collecting their needs and views and for anchoring the decisions made. When choosing mitigation measures, it is important to weigh decisions made against political costs of implementing sometimes unpopular measures affecting social mobility, interaction, or work organisation. Not least in emergencies, a broader decision-making process could ensure that the responsibility for the outcomes is distributed among several actors, thus lowering the political costs. Stakeholder consultations should preferably be structured using models from the area of decision analysis to elicit preference structures and gather preferential data from several stakeholders [
46].
For the cocreation process in Jordan, we used two web surveys using Google Forms, which were sent in November 2020 and January–February 2021. The first survey aimed at obtaining stakeholders’ input on the relevant criteria to be considered for the pandemic management in Jordan, with the first question asking them to provide a criterion they considered of importance, aside from those that were discussed in the public sphere (health, education, financial aspects, and wellbeing). A limited number of respondents (10: two from government, six from academia, one from the private sector, and one from a nongovernmental organisation) filled out the questionnaire. The criteria added by them were mental health for community (three responses), health system capacity and well-trained staff (matters which are not variables depending on social distancing measures, but rather offer a benchmark for the healthcare system coping capacity), social life (two responses), and financial aspects and wellbeing. These responses were consistent with the criteria we identified during our desk research.
After estimating the impacts of every scenario under consideration, for every criterion, a second survey was sent, this time with a higher response rate; we collected 78 responses, of which 44 came from the education and research sector, 14 came from the private sector, 10 came from the government, eight came from the healthcare system, and two came from the nongovernmental sector. Respondents were given our impact estimates for four criteria, and, for each criterion, they were asked to rank the policy measures according to their estimated effects. After seeing the impact estimates and ranking the measures, the stakeholders were asked again to rank the criteria according to their perception of the relative importance, on a scale from 1 to 10.
3.6. Computation
For the decision-making mechanism in our proposal, we use a multi-attribute decision and risk assessment method, able to handle incomplete information. The origin of the software is from our previous work on assessing decision situations using weakly specified costs/values, probabilities, and criteria weights, as well as from non-numerical assessments of these components. To avoid aggregation problems concerning the distributions of belief in the weakly specified data, we employ higher-order belief distributions for better separation of the various scenarios. The quality of the data and the actual situations in the regions can be very different; hence, there could be great uncertainty inherent in the source material to be taken into account, which is why we must be able to utilise the available data to the largest possible extent. To circumvent some of these problems, we propose a new decision analytic method based on the extent of belief obtained regarding the different parts of the analysis. In the analysis, we take the whole possible range of the criteria weights, probabilities, and values into account, and we present how conceivable it is that an alternative outweighed the other ones, thus providing a measure of the resilience of the output of the analysis. These calculations become very complex; thus, we use a software tool for the analyses. This tool allows for the aforementioned inherent inaccuracy in the input data. The tool contains patented algorithms and has a record of having been used successfully in many different decision scenarios, notably large-scale energy planning [
47], financial risks [
48], allocation planning [
10], demining [
49], gold mining [
50], and many others [
51].
In the proposed method for analysing decisions, the preferences of societal stakeholder groups form the basis for discussing and handling potential conflicts. Then, representative or place-holding weights (called surrogates) were found to be useful, but since the input data may nevertheless be uncertain and surrogate weights are still approximations of the preferences involved, we also use interval output and distributions of the beliefs over those intervals [
52,
53].
The multilinear decision problems are analysed using the imprecise information available. Below, we show some of the calculation details of the analyses. In general, multilinear optimisation problems are usually difficult to solve. There have been many attempts in the literature to address these classes of problems, such as using simplex-based methods or different formulations of active sets. Other methods use linear complementarity as their basis. All of these methods have their respective advantages, but when having information of an imprecise nature and using different types of sensitivity analyses, they are not entirely suitable. The high-level approach of our proposed method yields long sequences of nonlinear sets of equations to solve rapidly. Thus, the decision analytic core solver is based on algorithms designed specifically for these problems [
54]. Below, the main principles are discussed from a conceptual point of view.
3.6.1. Rankings
Several articles of ours have argued for alternative ways to treat rankings in a computationally viable way, often using surrogate criteria weights. This resulted in a cardinal ranking method (CAR), which we have shown is more powerful than its counterparts such as SMART, AHP, and many others (see [
55] for an overview). Below, we discuss some of the ideas behind CAR using the notation and outline from [
53].
Assume a decision problem with N criteria and a user-supplied ordering of them, in the form of a notation between the criteria, as well as the policy measures in question, such as in , where the symbol ‘>i’ denotes the strength in rankings between criteria and policy measures in such a way that ‘>1′ corresponds to the standard common ordinal ranking symbol ‘>’. Then, a suggested translation could be the following:
>0 Equally important (“as good as”),
>1 Slightly more important (“slightly better than”),
>2 More important (“better than”),
>3 Much more important (“much better than”).
Then, the ordering ., can be rewritten as an ordering containing only the traditional ranking symbols ‘=’ and ‘>’ by introducing extra variables x(ki) such that
corresponds to ,
corresponds to ,
corresponds to ,
…
corresponds to .
This transformation spans a new space constrained by the new orderings. The indexing of the criteria ranking is obtained by assigning an index number to each position in the complete ordering, starting with the most important position as index number 1. Each criterion i then obtains a position p(i) ∈ {1, …, Q}, where Q is the total number of index positions. For each pair of adjacent criteria ci and ci+1, whenever , we have si = | p(i+1) − p(i) |. The number p(i) representing criterion i, thus, represents the importance of that criterion as assessed by the decision-maker.
The CAR surrogate weights are then obtained using the following formula (from [
49]):
The transformation of mitigation value orderings is made analogously. In summary, the process constitutes of the following:
Rank the alternatives from the worst to the best outcome under the criteria. The strength is expressed as ‘>i’ symbols.
Rank the importance of the criteria from the least to the most important. The strength is again expressed as ‘>i’ symbols.
The final value of the alternatives in the decision situation is obtained by multiplying the belief distribution of the weight simplex with the belief distribution of each alternative’s expected value simplex.
3.6.2. Evaluation Method
To cater to the imprecision and uncertainties in the input data, we use interval representations in the form of random variables, taking these inherent uncertainties into account. The general expected value of action
Ai is then defined as
given the belief distributions over random variables
w,
p, and
v. To evaluate this expression and, thus, arrive at an analysis of the decision situation, we employ methods from [
41], especially the calculations of the two operators. The addition operator is handled by ordinary convolution, i.e., if
h is the distribution over a sum
z =
x +
y whose components have distributions
f(
x) and
g(
y), then
h(z) is
The multiplication operator is treated analogously. Using the same assumptions as above, if
h is the distribution over a product
z =
x·y, h(
z) is found by letting
where
G is a primitive function to
g,
Γz = {(
x,
y) |
x∙
y ≤
z}, and 0 ≤
z ≤ 1. Then,
h(z) is the corresponding density function.
This way, the products in Equation (2) are calculated, and the summations of the products are then carried out by the abovementioned convolution of two densities. This combination of operators computes the distribution over the expected utility according to Equation (2).
These calculations form the groundwork of a detailed analysis of how well each decision alternative or strategy fares compared to the others, as well as provide the information necessary for carrying out a sensitivity analysis of the results. In the analyses, all mitigation measures can be analysed for all criteria, together with how likely it would be for a strategy to overshadow all the others in terms of weighted expected value, i.e., providing a resilience measure of the stability of the final output ranking of the alternatives or strategies under consideration.
4. Results: Data Aggregation and Evaluation
The data aggregation in the Jordanian case was made after the survey was completed. The respondents graded the measures L1–L4 under the respective criteria. The corresponding CAR values and weights were then calculated. The average values of the responses were calculated together with the limit intervals used for the analysis. The limits used for the analysis were the average values ± their respective standard deviations to take into account the uncertainty spread of the input data. Needless to say, these intervals could be widened if desired, but one standard deviation seems to give a reasonably adequate representation of the uncertainties involved. The aggregated values were then used in the analysis as in a structured multicriteria problem, but with the data spread also taken into consideration.
The multistakeholder multicriteria decision problem was again evaluated using this background information by the method described above in
Section 3.6 using Helision. The results of our case study are provided in
Figure 7.
Roughly speaking, longer bars denote better policy measures. The figure also shows to what extent the respective criteria affect the final result, which is based on the weighted averages of the respective policy measures, as well as the uncertainties involved. Furthermore, the confidence in the ranking of each pair of policy measures is colour-marked to the right. A yellow box means that the ranking between the policies at the intersection of a row and a column has 75–90% confidence, which is rather high. For example, it is 83% certain that policy L3 is better than policy L1. This means that the input values have to be changed significantly for the order to change. The meaning of a green square is that the corresponding confidence is greater than 90%. We can see at the intersection of L3 and L2 that L3 is superior to L2 with a confidence of 92%. A black box signifies, in the same way, that there is a less significant difference between the policy measures. In summary, we can see that Level 3 seems to be the best strategy to use in Jordan, with moderate confidence, followed by Level 1, Level 2, and Level 4 in that order.
The result is, of course, sensitive to the input data. If we, for instance, contrary to the results of the stakeholder process, would consider a ranking of the criteria where human development is more important than school days lost, which is more important than mental health and wellbeing, which is more important than direct fatalities, we would get the result in
Figure 8. The ranking remains unchanged, but the differences are generally lower. There is an 11% decrease in the belief that L3 is better than L1, for example, compared to
Figure 7.
Figure 8 is only provided as a demonstration of a sensitivity analysis since
Figure 7 is truer to the actual stakeholder data.
5. Discussion
In this paper, we applied a policy-formation and decision-making method for mitigating crises, such as the current COVID-19 pandemic, involving significant uncertainty. In particular, we used surrogate weights for efficient elicitation and representation of user preferences. The framework can include epidemiological estimations and socioeconomic factors in a multicriteria multistakeholder context and can be used in handling the current or future challenges of pandemic situations, to facilitate management and mitigation of similar crises in the future, in any region. It also provides recommendations for the assessment and evaluation of different scenarios and their impacts. These recommendations could be also used more generally on change-induced hazards, as well as assess the potential outcomes of different scenarios on hazards.
The framework was first applied in Romania during Q3 and Q4 of 2020 and then adapted to the Jordan context. We used stakeholder consultations through in-depth web surveys, which were refined as more data became available. This included establishing a set of criteria and alternative mitigation measures that could be adapted, value estimates on the chosen criteria including modelling the epidemiologic evolution in every alternative scenario, and socioeconomic estimates for several criteria. Input from stakeholders was essential for developing compromise-oriented policy solutions for management and mitigation of similar risks in the future, achieving a greater level of acceptance and legitimacy, as well as facilitated and improved implementation processes of various risk mitigation measures.
For the decision-making mechanism in our proposal, we used a multi-attribute decision method, able to handle incomplete information. The origin of the software is from our previous work on assessing decision situations using weakly specified costs/values, probabilities, and criteria weights, as well as from non-numerical assessments of these components. To avoid aggregation problems concerning the distributions of belief in the weakly specified data, we employ higher-order belief distributions for better separation of the various scenarios. In the analyses, we take the whole possible range of the criteria weights, probabilities, and values into account, and we present how conceivable it is that an alternative outweighed the other ones, thus providing a measure of resilience of the output of the analysis.
Since the results of our application show that containment measures associated with Level 4 in this paper, imposing a lockdown, constitute the poorest choice for Jordan given the data we had available, similar exclusion processes can be performed by decision-makers who aim to pursue optimal strategies. Results that render high confidence levels in the evaluations can inform the local decisional process and reduce the number of alternatives to be considered in managing the pandemic.


 ,
, 


