Article

Does High Spatial Density Imply High Population Density? Spatial Mechanism of Population Density Distribution Based on Population–Space Imbalance

1
School of Architecture, Southeast University, Nanjing 210096, China
2
School of Landscape Architecture, Nanjing Forestry University, Nanjing 210037, China
*
Author to whom correspondence should be addressed.
Sustainability 2022, 14(10), 5776; https://doi.org/10.3390/su14105776
Submission received: 13 April 2022 / Revised: 29 April 2022 / Accepted: 9 May 2022 / Published: 10 May 2022

Abstract

:
Numerous studies have suggested a positive correlation between spatial and population densities. However, few have systematically conducted quantitative analysis and deciphered the detailed correlation in block scale. Here, we construct a population–space correlation algorithm to quantify and compare the correlation between mobile phone signalling data and vector spatial data and identify blocks with uneven population density. We analyse the influences of various urban spatial characteristics on population density and the distribution characteristics of the identified city blocks. Changzhou City, China, was selected as the study case. The results indicate that (1) population density distribution is unbalanced only when spatial density exceeds a critical value, reflecting the level and sphere of influence of blocks with varying spatial densities; (2) low population density distribution is concentrated in the zonal space, along the boundary between primary and secondary urban centres; (3) spatial characteristics affecting population density distribution vary with the type of block, and the green landscape’s attractiveness is reduced. Our study provides a novel perspective on quantifying the link between urban form and population distribution. It can help decision-makers and planners in accurately recommending urban intervention in population density distribution by adjusting the spatial morphology and promoting rational use of urban public resources.

1. Introduction

Population density is universally regarded as a yardstick for the urban planning level and an important evaluation criterion for urban development and spatial balance [1]; therefore, governments and society regard population density as a matter of concern. Since construction land is becoming increasingly scarce, many governments have adopted a high-density spatial development model to address population density’s rapid growth [2,3], and there is growing evidence of a significant positive correlation between spatial density and cities’ population density [4,5]. In this study, ‘population density’ refers to the population density in the activity space of an urban block; ‘activity space’ refers to the main space for population activities in a city, including indoor space and outdoor public space [6]. In addition, the population density also reflects the urban vitality to a certain extent. Urban vitality here refers to the change in frequency of population flow in the block and the attraction of the block to the population [7]. Therefore, research on population density can play a reference role in improving urban vitality.
Follow-up surveys of population density reveal a population–space imbalance in cities. In most cases, population density in blocks with the same function is directly proportional to spatial density, slightly fluctuating around the average [8,9]; however, there are also blocks with population density significantly above or below average. These are particularly common in high-density urban areas [10] (see Figure 1). The ‘block’ mentioned in this paper refers to the closed space surrounded by roads. It is the basic unit of urban space and is usually considered the smallest unit of a census in population flow research [11].
This study posits that high spatial density in blocks is universally beneficial to increasing population density, but differences in spatial characteristics (e.g., location, accessibility, and landscape) and their impact on population behaviours (e.g., living, education, and work) affect population density distribution, resulting in a significant population–space imbalance in some blocks [12]. When government decision makers and planners plan the distribution and quantity of facilities in the block, their judgment is based on the daily population density in that block, and the population density is calculated according to the spatial density [13]. Population–Space imbalance will cause their judgment to deviate based on the population density in the block; thus, they are unable to accurately judge the demand quantity of public service facilities and the distribution of the traffic network system according to the construction density of space [14,15]. This may lead to social problems (e.g., aggravated supply–demand imbalance of public facilities, local traffic congestion, and insufficient support services), thus restricting urban sustainability [16,17].
To effectively address unbalanced population density distribution, it is necessary to identify the factors that affect it and how it is affected. Many previous studies adopted a macroeconomic, social, or environmental perspective on a regional or urban scale; existing studies focus on how population density distribution is affected and propose effective measures to regulate population density distribution based on the concept of sustainability [18,19,20]. However, few studies have employed a spatial perspective, particularly a micro perspective of blocks. Block-scale space is the basic arena for population activities and urban development and constrains the development of urban elements (e.g., roads, locations, landscape, and functions), thereby affecting population density distribution [21].
Given existing studies’ deficiencies, this study examines how population density distribution is affected by urban spatial characteristics from a meso or micro perspective. The study investigates the following questions: (1) What are the characteristics of blocks with unbalanced population density distribution, and how can these blocks be identified through big data and algorithms? (2) In addition to the influence of location, traffic, and other factors, how are the blocks with unbalanced population density distributed in space? Can we find the spatial distribution law of this imbalance? (3) What spatial characteristics in the city will affect the distribution of population density? How do these characteristics interact and affect the flow of people?
China is a densely populated country, where each city’s central urban areas are high-density. Using smartphone signalling data and spatial vector data, we conducted data coupling and empirical analysis to further examine how urban spatial characteristics affect population density distribution, aiming to provide methodological suggestions for intervention in and regulation of urban population density distribution from a spatial perspective, thus promoting rational use of urban resources.
The rest of this paper is divided into five sections. In Section 2, we introduce the main factors that affect population density distribution and the composition of urban spatial characteristics. In Section 3, we discuss the chosen case study as well as the data and research methods used. In Section 4, we discover the inherent correlation and principles of urban spatial characteristics and population density distribution. In Section 5, on the basis of our findings, we explore how urban spatial characteristics affect population density distribution and the policy implications of this study. In Section 6, we summarise the key findings and contributions of this study.

2. Literature Review and Working Hypotheses

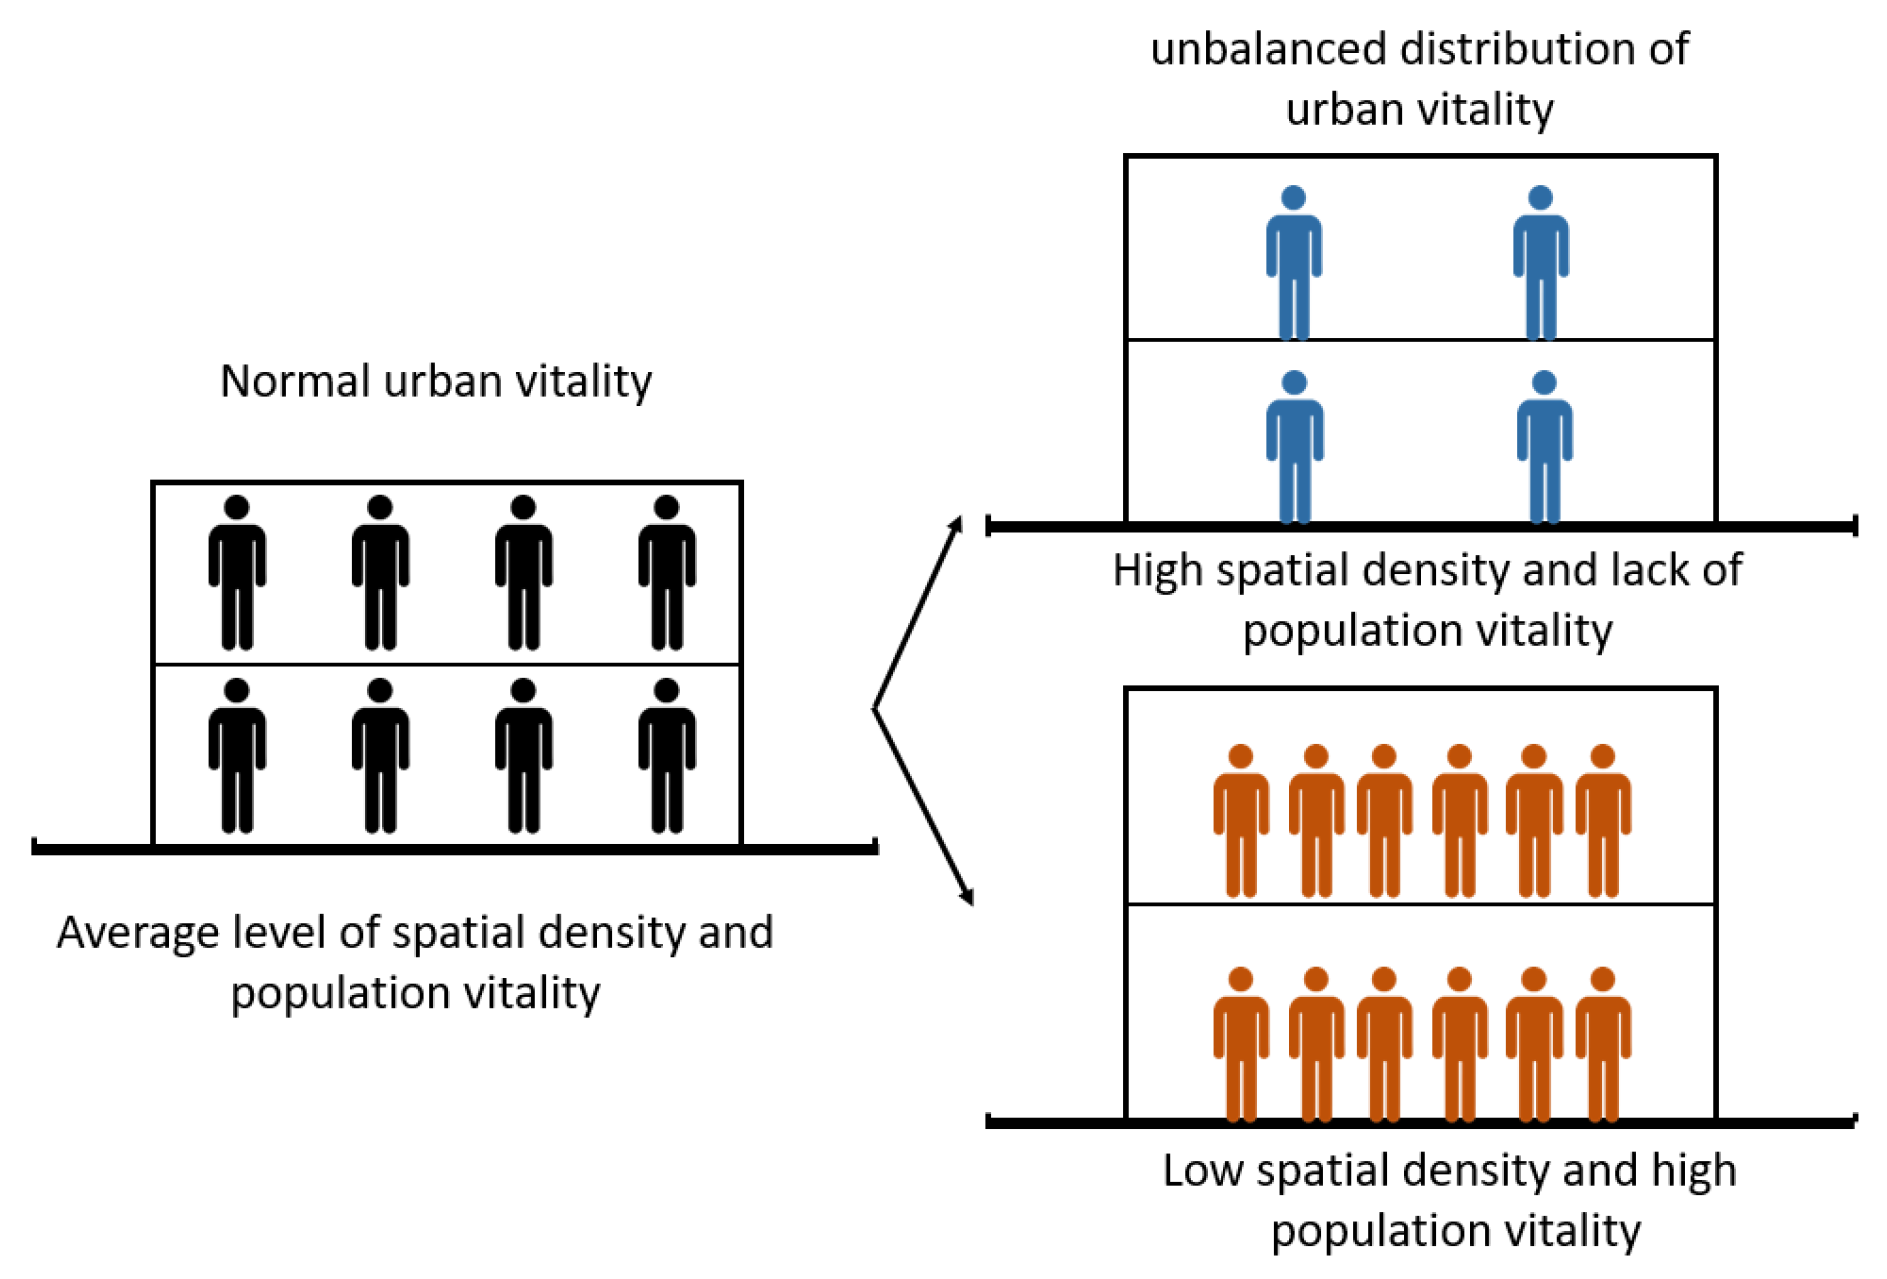
2.1. The Examination of Unbalanced Population Density Distribution

The focus and progress of studies on unbalanced population density distribution vary by country. In North America, related studies focus on the unbalanced distribution of socially disadvantaged groups. For example, Ariste [22] and Masuda et al. [23] analysed the impact of environmental health problems on the distribution of disadvantaged groups and their social causes (e.g., public facilities). Canales and Frank analysed US population distribution and found that an ageing population unbalances the urban working population distribution; they argued that the working population distribution could be balanced through an appropriate immigration policy.
Compared with North America, South American countries show more concern for the unbalanced distribution of the immigrant population. For example, Vinuela investigated cross-regional movement (e.g., across urban agglomerations or neighbouring countries) and the unbalanced distribution of the Spanish immigrant population [20]. Bauer analysed agglomeration and dispersion characteristics of the Mexican immigrant population and summarised the influence of social externalities on the unbalanced population density distribution [24]. In addition, unbalanced population density distribution related to slow population growth is an issue of common concern in studies of South American countries. Highly targeted policies are implemented to improve socio-economic development [25,26].
Similarly, studies of European countries also focus on immigrant populations. For example, unbalanced population density distribution is related to European countries’ wage and unemployment standards [27], Bulgaria’s migration and population policies [28], and Spanish urban economies’ structural changes [29].
By contrast, studies of Asian countries focus more on unbalanced population density distribution in the process of urbanisation, as well as consequent urban and social problems. For example, Diwakar found that the unbalanced distribution of population density in India is caused by an urban development gap in the urbanisation process [30]. By analysing the movement of Chinese populations since 1978, Duan found that unbalanced population density distribution exists in China’s urbanisation process, which will further widen the economic development gap between eastern and western China [31]. Based on a horizontal comparison of cities with different development levels, Lee found that the economic and land development gap between South Korean cities results in an unbalanced distribution of population density [4].
The focus on unbalanced population density distribution varies across cities in different regions worldwide, depending on their actual condition and needs. Overall, academia has provided due attention to the imbalance in population movement between cities and unbalanced regional distributions of population density (e.g., in urban agglomerations or neighbouring countries) but has scarcely studied unbalanced population density distribution inside cities [32]. Hence, it is necessary to further examine by what factors and how population density distribution is affected.

2.2. Main Influencing Factors of Population Density Distribution and Related Study Trends

In the era of big data, the quantitative distribution of population density has become a hot topic in urban sustainability and planning [33]. A review of existing studies shows that regional differences in economic level, social development, and ecological environment can primarily account for unbalanced population density distribution. Economic factors include economic development, employment level, regional wages, and hedonic price of labour [31,34,35]. The impact of social development factors on population density distribution is more complex; in addition to government interventions (e.g., social demographic policy and national immigration policy) [25,28], population density distribution is also affected by major social events, cultural backgrounds, political stability, and social fairness [18,29,36,37]. Ecological factors (e.g., ecological vulnerability or sensitivity, hydrological condition, and geological condition) can also affect a population’s spatial selection [38,39]. At the same time, location is also an important factor affecting the distribution of population density. Relevant research on location theory shows that the location and maximum migration length of important facilities such as commerce, entertainment, and sports will influence the distribution of population density [40,41]. Moreover, for residential and community blocks, the difference in location and surrounding land use distribution will also lead to the deviation of population density distribution [42].
A few studies focused on the impact of urban space on population density distribution. Wu and Meijers examined the correlation between population density distribution and the overall urban layout of central systems [43,44]; Li analysed problems arising from unbalanced Taiwanese population density distribution and proposed a design approach to urban hierarchy [45]; in analysing urban public resources’ spatial structure and spatial distribution, Zhu proposed a spatial ‘rebalancing’ strategy to address the growth and unbalanced distribution of population density [46]; Chi analysed the impact of urban structure and time on population distribution and proposed a complex and practical procedure to address unbalanced population density distribution [47]. Existing studies of urban space focus on urban structures on a relatively large scale and from a regional perspective, sharing a similar entry point with related studies conducted from macro-regional perspectives (e.g., economic, social, and environmental perspectives). The characteristic differences in various factors (e.g., urban structure, economic, and social factors) are more significant on a relatively large scale, thus helping to identify the factors that account for the unbalanced distribution of population density.
However, urban structure and urban spatial characteristics are not equivalent. Internal elements of urban space (e.g., spatial density, morphological scale, business function, and location) also reflect urban spatial characteristics, or rather, refined spatial characteristics on a smaller scale (i.e., block scale). In the last five years, researchers have investigated the impact of these spatial characteristics on population density distribution. Lee and Xia demonstrated both a significant positive autocorrelation and local mismatch between spatial density and population density, where the local mismatch is related to the type of land use, urban location, and time period [4,5]. Zhang demonstrated that the agglomeration scale and educational spatial morphology intensity affect population density distribution [48]. Zhao analysed population distribution characteristics in Shenyang and found an unbalanced distribution of population density in cities and further found that it was closely related to the distribution of infrastructure and functional diversity around the neighbourhoods [49].

2.3. Composition and Indicators of Spatial Characteristics

Urban spatial characteristics have different connotations and constituent elements depending on perspective. For example, regional spatial characteristics usually include the distribution pattern of cities and urban spatial networks within a region [24,29], and spatial characteristics from the macro-scale perspective of cities usually include the structure, overall layout, and central system of the city [40,41]. This study analyses the influence of spatial characteristics on population density distribution at the more accurate research scale of city blocks, thus requiring us to determine the elements of spatial characteristics from the perspective of blocks.
From this perspective, the spatial characteristics are those of the external and internal environments of the blocks [50]. The spatial characteristics of the external environment of blocks refer to the spatial relationships between a block and its surrounding environments, such as location, transport, and other networks [51,52]. Among recent studies, Jan et al. discussed the impact of block-level public centres and their degree of centrality in urban population activity [53]. Zhang et al. found that transport network accessibility and types of public services can affect population flows [54]. Mao et al. demonstrated that road network accessibility has a significant positive correlation with population density within blocks [55]. As a result, this study selected three indicators that are strongly correlated with population density, namely location centrality, functional diversity, and accessibility, to conduct further research. Similarly, the spatial characteristics of the internal environment of blocks include factors such as form, facilities, and boundaries [56]. In recent literature, Mousavi et al. found using a crowd prediction model that the density and compactness of blocks can affect population distribution [57]. Ratti et al. found using location-based services data that the quality of a landscape can affect the activity and behaviour of crowds [58]. Zhang et al. demonstrated that block-scale intensification affects population density distribution [48]. Wang et al. discovered that a compact spatial form is more likely to lead to a concentrated population distribution [59]. Therefore, this study selected three indicators that are closely correlated to population distribution, namely scale intensiveness, morphological compactness, and landscape quality, to conduct further research.
For the current study, we selected six indicators (locational centrality, functional diversity, accessibility, scale intensiveness, morphological compactness, and landscape quality) on two layers (external environmental conditions and internal spatial characteristics). See Table 1.

2.4. Existing Characteristics and Shortcomings of Research

Existing studies of unbalanced population density distribution focused on the imbalance across different countries, regions, or cities and identified the main factors affecting population density distribution, which include the regional perspective economic level, social development, and ecological environment.
Few studies have investigated the impact of spatial characteristics (particularly urban structure) within a city on population density distribution. However, urban structure is also a macro-level influencing factor and cannot fully represent the specific spatial characteristics within a city. From a block perspective (a higher analytical prevision), spatial characteristics within a city are also reflected by locational centrality, functional diversity, accessibility, scale intensiveness, morphological compactness, and landscape quality. These characteristics are the basic spatial carriers of people’s daily behaviours, have a direct influence on those behaviours and on population density distribution, and can be directly and effectively managed and adjusted by the authorities concerned [60]. By using a city’s spatial characteristics as an entry point, this study examines how they affect population density distribution. The study findings are significant for developing interventions for population density distribution in each city and employing rational use of urban resources.

3. Materials and Methods

3.1. Study Area and Data Acquisition

3.1.1. Study Area

China has a high population density and some of the highest density cities and regions in the world. The central urban area of Changzhou is located in the plain area along the east coast of China (Figure 2 and Figure 3). It has a subtropical climate and is the densest area of high-density cities in China. Similar to most high-density cities in China, Changzhou is influenced by Chinese Taoism and Confucian culture; thus, it is representative of culture, climate, and terrain. Additionally, similar to the development process in other high-density areas, the influences of location, economy, and population migration, among others, led to a gradual increase in the centralisation and density of Changzhou, causing the building coverage ratio to exceed 50% and population density to exceed 10,000 people/km2. This is typical of high-density areas in China [61]. During this process, however, as the population concentrated in the centre and land space became increasingly sparse, a population–space imbalance appeared in the centre of Changzhou, which led to social problems such as imbalanced public service facilities and traffic congestion. This is a common scenario experienced by most high-density areas in China during the course of urbanisation [31]. It is also typical of high-density areas around the world, such as Birmingham in the United States, Seoul and Busan in South Korea, and Goa and Tamil Nadu in India. All of them are developing into high-density spaces and are suffering from population–space imbalances due to population loss, locational differences, and other factors [4,62,63]. The development processes and problems of these cities or regions have similarities with the central urban area of Changzhou, which is why Changzhou was chosen as a case study.
Calculate the population density and spatial density of each block, in which the unit of population density is ‘person/hectare’ and the unit of spatial density is ’10,000 m2/hectare’ (see Figure 3). The kernel density superposition between population density and spatial density reveals that the degree of coupling between population density and spatial density is relatively high in the centre but declines in peripheral areas, indicating an emerging unbalanced distribution of population density (Figure 4).

3.1.2. Data Sources and Preprocessing

The study’s population density data comprise data from mobile phone subscribers of China’s largest telecommunications operator across all of Changzhou, which represents an approximate 70% share of Changzhou’s entire mobile phone market. The remaining 30% of the data come from other operators; however, there is no difference in age, income, culture, and location. Nevertheless, there are coordinate differences between data from different operators. If all data are included in the study, there will be a discrepancy in population positioning, which will affect the accuracy of the study. Therefore, the remaining 30% of data will not be used.
The data set contains personal signalling data (e.g., encrypted mobile terminal identity, time of signalling, code of base station connected to the mobile phone at the time of signalling, and latitude-longitude coordinates of the mobile phone), and mobile base station data (e.g., base station code and latitude-longitude coordinates). In order to prevent effects from a subscriber being within multiple base stations’ service areas during the same period, the base station with the longest cumulative period of stay per hour was used as the primary serving base station during the period, and the statistical data were measured on an hourly basis (see Table 2). The data set covers 24 days in 2017, including 15 typical working days (Wednesday or Thursday), six typical weekends (Saturday or Sunday), and three typical holiday or festival days. These samples cover 12 months of the year, including different weather and temperature characteristics, and the 24 samples are relatively balanced in time intervals. Therefore, they will not be selected as samples for two consecutive days for representativeness. The data were provided by 15,800 mobile base stations and involved 3,450,000 mobile phone subscribers.
The study’s urban space data came from vector topographic maps, which were calibrated, corrected, and updated by the investigators after a field survey. The vector topographic maps contain 10,664 blocks in Changzhou, the functional type of each block, 120,591 buildings, road axes at different levels, and the natural boundary environment (see Table 3).

3.2. Methodology

We first determined appropriate calculation methods according to the conceptual characteristics of population density and spatial density; conducted correlation analysis to identify the functional types of blocks with a strong correlation between population density and spatial density; created an equation to calculate the population–space correlation; identified specific blocks with unbalanced population density among the blocks of the above functional types; analysed the degree of coupling between such blocks and spatial density, spatial indicators, and spatial distribution; and finally, discussed the spatial mechanism of population density distribution (see Figure 5). Through high-precision population positioning data and building data to accurately calculate the population density and spatial density of each block, Shi has proven the effectiveness of this method, especially the accuracy of population density calculation results, which has been greater than 80% [16]. At the same time, Edwards and Xu also adopted similar methods to screen the research objects through the correlation coefficient and constructed the algorithm model to study the population distribution [64,65].

3.2.1. Population Density and Spatial Density Indicators

For mobile signalling data, the number of mobile subscribers was calculated on a base station basis. The radiation scope of a base station is universally larger than the area of a block. Therefore, the conventional method for cleaning mobile signalling data by gridding and spatial interpolation [58,66,67] will cause a certain imbalance in the study results. We used the space transformation method for meso- and micro-scale mobile signalling data to calculate the population density according to the area of activity space [18], thus improving the calculation accuracy of population density in each block. The equation for population density is:
ρ c i = 1 A c i · A c i v j D v j A v j
where, c i denotes the block numbered i; v j denotes the mobile signalling cell numbered j (A signalling cell is a faceted service area around the centre of a base station in a mobile communications network.);   ρ c i denotes the population density of the activity space of c i (unit: persons/ha); A c i denotes the area of c i ; D v j denotes the average number of mobile subscribers within v j (As the number of mobile subscribers within a signalling cell is constantly changing during one day, we measured the number of mobile subscribers per hour within each block, calculating the average number of mobile subscribers within each block during each of the 24 hours in a day.) (equal to population in this study); A v j denotes the area of the activity space of v j ; A c i v j denotes the area of activity space within the overlapping area between c i and v j .
In this study, spatial density refers to the total floor area of buildings per unit area within a block and reflects the intensity of spatial development. The equation for spatial density is:
ρ c i = 1 A c i · S b k F b k  
where, c i denotes the block numbered i; b k   denotes the building numbered k within c i ; ρ c i   denotes the spatial density of c i (unit: 10,000 m2/ha); A c i denotes the area of c i ; S b k   denotes the projected area of b k ; F b k   denotes the number of storeys of b k .

3.2.2. Classification Based on the Correlation between Population Density and Spatial Density

We used Pearson correlation coefficients to identify the types of blocks with a strong correlation between population density and spatial density; we used these types of blocks in the analyses and excluded the types of blocks with a weak correlation between them (e.g., industrial blocks and medical and health blocks). The population density difference between these types of blocks depends on the scale and grade of public facilities and types of services, and they are influenced by urban surroundings. Hence, these types of blocks were excluded. The Pearson correlation coefficient is calculated as follows:
r x y = i = 1 n x i x ¯ y i y ¯ i = 1 n x i x ¯ 2 y i y ¯ 2  
where, x ¯ = 1 n i = 1 n x i and   y ¯ = 1 n i = 1 n y i . The value range of the coefficient r x y is from −1 to 1. If variables are positively correlated, the sign of the correlation coefficient is positive; if variables are negatively correlated, the sign of the correlation coefficient is negative.
As described in Table 4, the degree of correlation between population density and spatial density varies significantly across different types of land use. Educational research, commercial, business, general residential, and residential shanty blocks collectively account for more than 75% of total blocks and present a strong correlation between population density and spatial density. Other types of blocks are of no referential significance because they had low correlation coefficients or small quantities, so showing a significant correlation between population density and spatial density across them was not possible.

3.2.3. Identifying the Blocks with Unbalanced Population Density

After identifying different types of blocks, we further identified the types of blocks with unbalanced population density. We construct a population–space correlation algorithm to quantify the dispersion degree of population density within a certain spatial density range (spatial density ranges were separated at an interval of 0.2). Through the fluctuation curve of the population–space correlation, we determined the critical value of spatial density. Blocks with a spatial density above their critical value had unbalanced population density. The degree of population–space correlation was calculated as follows:
D = 1 ρ c ¯ 1 N 1 N ρ c i ρ c ¯ 2
where D is the correlation between population density and spatial density with a certain spatial density range; c i denotes the block numbered i within the spatial density range; N denotes the number of blocks within the spatial density range; ρ c ¯ denotes the average population density of all blocks within the spatial density range; ρ c i denotes the population density of c i .

4. Empirical Results

4.1. Correlation between Spatial Density and Population Density

The data clustering results showed a linear or exponential correlation between population density and spatial density among different types of blocks; the calculation results of the population–space correlation show that the unbalanced distribution of population density was more significant with increased spatial density (see Table 5). Moreover, when spatial density was greater than a certain critical value (the red line in Table 5), the unbalanced distribution of population density significantly increased.
This phenomenon was evident in commercial and general residential blocks. When the spatial density of commercial blocks was lower than 22,000 m2/ha or the spatial density of general residential blocks was lower than 30,000 m2/ha, population density overall was exponentially correlated with spatial density without any significant unbalanced population density distribution. When spatial density was above a critical value, unbalanced population density distribution significantly increased. Moreover, the critical value of spatial density varied across different types of blocks.

4.2. Distribution Principles of City Blocks with Uneven Population Density

We calculated the spatial density of high-density areas by kriging interpolation, converted the block surface elements into point elements, estimated the unknown points on the plane by the weighted average of known samples, and described the spatial distribution characteristics and discrete characteristics of block density. We found that spatial density was highest in the centre and decreased towards the peripheral zones to the medium- and high-density (see Figure 6a). Between the centre and peripheral zones, there was a transition zone of spatial density, which was located along the boundary between the urban primary and secondary centres, and presents a long and continuous morphology (see Figure 6b).
For example, commercial blocks with unbalanced population density were superimposed on spatial density, and the blocks were relatively scattered, showing no obvious regularity (see Figure 7a). Then, commercial blocks with significantly below-average population density were identified and superimposed on spatial density. More than 70% of such blocks were distributed within the transition zone (see Figure 7b and Figure 8), whereas only 25% and 3.57% of such blocks, respectively, were distributed in the high-density zone and medium- and high-density zone. Likewise, several other types of blocks were verified, and the above phenomenon was also present in business and general residential blocks with unbalanced population density. Among them, the population density in business blocks is significantly lower than the average, and 64% of the blocks are distributed in the transition zone. Generally, the vitality of residential block groups is significantly lower than the average level; 83% of the blocks are distributed in the transition zone and concentrated in the south of the city (see Figure 9 and Figure 10). By contrast, this phenomenon was not present in educational and shanty residential blocks because they are distributed in peripheral areas.
In summary, at the edge of urban areas with the highest intensity of urban construction (i.e., along the boundary between primary and secondary urban centres), there is zonal space with low population density, where commercial, business and general residential blocks have high spatial density but low population density, in sharp contrast with surrounding areas. This finding is consistent with the description of the distribution of population density in the urban shadow zone theory proposed by Zhang and Hu et al. [68,69].

4.3. Spatial Characteristics Affecting Population Density Distribution

We identified blocks with an unbalanced population density, selected from the blocks with significantly above-average and below-average population density, and calculated and compared their spatial characteristics (including locational centrality, functional diversity, accessibility, scale intensiveness, morphological compactness, and landscape). See Table 6.
We found that functional diversity and locational centrality are the main spatial characteristics accounting for unbalanced population density distribution in high-density urban areas. The effect of functional diversity was particularly significant; the more diverse the functional types within a block, the higher the population density within that block. This indicates that high functional diversity attracts more population but also reflects the unbalanced distribution of functions in high-density areas and types of businesses in blocks. Moreover, the main spatial characteristics varied with the type of block. Locational centrality was the dominant characteristic for commercial and residential blocks; functional diversity was the dominant characteristic for educational and business blocks. This reflects the difference in the sphere of influence and locational needs between different types of blocks.
In addition, in our traditional concept, residential blocks with location conditions such as waterfront and green space will be more inclined to such living space because of a better environment and landscape quality; thus, the population density of these blocks will be higher. In high-density urban areas, however, landscape quality advantages do not necessarily attract more population, and in residential blocks, the population density was negatively correlated with landscape quality.

5. Discussion

This study summarises the characteristics of unbalanced population density distribution and identifies how a city’s spatial features affect population density distribution (see Figure 11). We identified the types of blocks highly correlated with population density and spatial density and analysed the population behaviours in these types of blocks. The demand and selection preference for spatial characteristics vary among different population behaviours. When the spatial characteristics of a block meet certain conditions, population behaviours are differentiated, resulting in a deviation in population density in some blocks.
Hence, it is necessary to focus on the following three questions: (1) unbalanced population density is conditional; why is population density distribution unbalanced when the spatial density exceeds a critical value? (2) Why are urban areas with low population density distributed zonally? The solutions to the three questions will offer policy suggestions. (3) The influence of different spatial characteristics on population density is differentiated; what do people prefer in space selection?

5.1. Influence of Spatial Density on Population Density Distribution

As mentioned in Section 4.1, unbalanced population density is particularly significant among commercial and residential blocks when their spatial density exceeds a critical value. As demonstrated by the two types of blocks, this study analysed how spatial density affects population density distribution.
Of 305 commercial blocks, we selected typical commercial blocks for analysis (see Table 7). The critical value of spatial density (22,000 m2/ha) provides a demarcation line for building size and morphology. When spatial density is higher than the critical value, commercial complexes are dominant within these blocks, and building morphology is quite regular. When spatial density is lower than the critical value, small-sized pedestrian streets or scattered commercial clusters are dominant within these blocks.
However, the difference in urban morphology results from differences in the types of business and the effectiveness of public facilities between different blocks [70]. Commercial blocks with a spatial density above their critical value are usually large- and medium-sized commercial complexes or wholesale markets, which have diverse types of business and high service levels, serving the whole city or whole urban districts. Because of the difference in their functions, the business diversity significantly varies between them, resulting in a significant difference in their target customers [71]. For example, Galaxy Bay Computer Town and Changzhou Shopping Centre have similar locations and similar traffic and scale conditions. However, Galaxy Bay Computer Town serves only computer users, dealing in electronic products with low turnover and high returns; the Changzhou Shopping Centre serves more diverse customers, relying on diverse types of business and brand effects to attract the population [72]. However, commercial blocks with a spatial density below their critical value usually serve the nearby blocks around them and are characterised by an agglomeration of small shops and functional diversity, resulting in a similar type and quantity of target customers; therefore, unbalanced population density is not obvious.
The same is true for residential blocks. Most residential blocks with a spatial density above 30,000 m2/ha comprise high-rise buildings with at least 12 stories. If such residential blocks are scattered and surrounded by other types of blocks, their population density is higher. If they are clustered and constitute large residential clusters, insufficient supporting facilities (especially educational and commercial facilities) result in higher housing vacancy rates [73], thus reducing the overall population density. Most residential blocks with a spatial density below 30,000 m2/ha comprise old residential buildings with six or fewer stories. Such residential blocks were built early enough to have escaped the influence of certain government policies implemented later (e.g., low-rise commercial buildings are restricted on the street-facing side) [74], so commercial and residential buildings are mixed. Therefore, the population density differences between such blocks are small.
Critical spatial density values reflect the importance of blocks with varying spatial density in a city, the scope of their influence, and the diversity of their surroundings. When the spatial density of a block exceeds a certain critical value, its importance and scope of influence also increase, thus exacerbating unbalanced population density distribution. This finding corroborates Pawe’s survey results on population density in the Guwahati metropolitan area of India [75].

5.2. Formation of Zonal Space with Low Population Density

This study argues that zonal space with low population density is formed for three reasons. First, such space provides a vacuum space for citizens’ sense of identity. An urban primary centre within the zonal space is characterised by large size and high build-up rate and has an obviously higher primacy ratio and identifiability than other urban centres. These characteristics combine with internal landmark buildings (e.g., railway station, shopping mall, and municipal government buildings) so that the urban primary centre easily arouses citizens’ strong sense of identity, making it extremely attractive to consumer activities and public facilities [76]. The sub-centres (i.e., primary centres) outside the zonal space can also arouse citizens’ sense of identity because they can feel the change in population density, landscape, and functional structure in the sub-centres [77]. This also explains the reason for zonal distribution along the boundary between urban primary and secondary centres; in addition, this finding corroborates Zhao’s argument that the unbalanced distribution of population density is characterised by a circular layered structure [49].
Zonal space with low population density is also affected by both a diffusion and an agglomeration effect. An urban primary centre’s diffusion effect allows the peripheral areas to absorb the population density spillover from the urban primary centre; the agglomeration effect on peripheral areas allows population density to gather at growth points of the peripheral areas [76]. In high-density urban areas, each block is subject to the superimposed result of the positive and negative diffusion and agglomeration effects, resulting in a spillover effect [69]. Peripheral sub-centres are subject to a positive diffusion combined with a positive agglomeration effect. Zonal space is subject to a negative agglomeration effect combined with a negative diffusion effect, resulting in a negative spatial spillover effect [68,78] and a consequent insufficient population density.
Moreover, the formation of zonal space with low population density is also related to a service mode of public facilities, and each large public facility must be backed by logistical space that provides distribution services. These logistical services are agglomerated in zonal space, resulting in insufficient population density. This corroborates Hu’s hypothesis regarding the influence of urban service facilities’ spatial distribution on population density [69].

5.3. Population–Space Selection Preference in Different Types of Blocks

The influence of spatial characteristics on population density is similar between educational blocks and business blocks (see Table 6), indicating that people share a similar value orientation in choosing educational space and business space. There are two reasons for this: (1) the functions of educational and business blocks are relatively complete and independent and are similar in their sphere of influence [79]; (2) work and schooling are rigid demands, so these two types of blocks are usually people’s daily destinations on work days; in addition, they have similar functional orientations [80]. In China’s central urban areas’ development process, educational and business blocks are prone to develop into small-scale community-level living centres if spatial clusters with diverse types of business are formed around them [81], which makes them more attractive to the population. This explains why people prefer to select educational and business blocks with high functional diversity. Moreover, the morphological scale has a certain influence on people’s space selection preference; the larger the agglomeration scale, the weaker the ability to attract population and promote the development of surrounding functional facilities. This corroborates Zhang’s argument that educational blocks’ morphological agglomeration scale affects population density distribution, with this study finding that they are negatively correlated [48].
People first consider locational centrality when they choose commercial and residential blocks. This corroborates Xia’s argument that unbalanced population density distribution is related to the type, location, and functional diversity of blocks. In addition, this study further confirms that location has a more significant influence than functionality [5]. However, Xia’s study did not discuss the influence of landscape quality on people’s selection preferences. This study found that, contrary to the traditional concept, the landscape quality advantages in high-density areas are not sufficient to attract more population. This does not imply that people no longer prefer areas with high landscape quality when choosing residential and commercial space, but it reveals that landscape quality is no longer people’s primary concern for choosing space. People prefer to choose centrally located urban spaces with more diverse functions rather than urban spaces with more green land and higher landscape quality [82]. There are a few large parks and green zones with good landscape resources in the central area of Changzhou, but their accessibility is low owing to the poor layout of the road network. Instead, many accessible green zones are fragmented (e.g., street-side green land, green waterfront land, and residential green land) with an average size of less than one hectare and outdated facilities. This reflects a universal problem in high-density urban areas. When a high-density urban construction model is adopted, urban managers usually provide importance in constructing a large green space to promote ecological harmony [83]. Under the constraint of diverse factors (e.g., road width and cost of street-side renovation), fragmented green space is not sufficiently improved, thus reducing the attractiveness to people over time [84].

5.4. Policy Influence

This study’s findings provide a reference for urban development and regulating population density, along with high-quality development and renewal in high-density urban areas. The findings reveal how urban spatial characteristics affect population density distribution and have important implications for addressing the problems faced by rapidly developing cities. Although Chinese authorities have realised that the unbalanced distribution of population density results from multiple effects of diverse factors [15,43], economic measures (e.g., investment promotion, control of housing prices, and creating jobs) are still the most important methods for regulating population density distribution through urban planning and management [5,85]. High-density commercial complexes and office buildings, large scale comprehensive service facilities, and residential building clusters have sprung up around high-density areas. New urban or community centres have been built to encourage the population to work and live nearby rather than concentrating in urban centres. However, this decentralised and spatially-homogenised development model cannot prevent the unbalanced distribution of population density; unplanned and decentralised urban development under real urban conditions may cause social and environmental problems. The complex status of high-density urban areas suggests an urgent need to balance the attractiveness of different urban spaces to attract people from multiple perspectives (e.g., economic, social, environmental, and spatial perspectives) while rationally controlling the scale of urban development and the pattern of urban centres. This study’s findings provide a reference for spatial renewal in high-density areas and a basis for intervening in and regulating population density aspects (e.g., spatial density, function, road, morphology, and landscape) from the perspective of urban space.

5.5. Limitations

Population density is a real-time and dynamic process, which significantly varies in certain types of blocks across different periods. This study measured the average population density in a block over 24 h, so the results may contain certain errors, and some findings may be attributable to characteristics reflected by specific data. Moreover, the population data used in this study were cited from the signalling data provided by China’s largest mobile telecommunications operator, but such population data cannot reflect the density of all populations in the study region (e.g., people who do not use mobile phones, such as children and the elderly). In addition, some people have multiple mobile phones, which could affect the population density measures. Signalling positioning data are acquired from base stations, and it is not possible to accurately identify each mobile subscriber. Although we used the Thiessen polygon and interpolation methods to improve positioning accuracy [18], a certain degree of positioning error remains. In subsequent studies, we will employ a combination of mobile signalling data and high-accuracy positioning data of mobile APPs to calibrate the positioning data and improve positioning accuracy, further testing this study’s results.

6. Conclusions

In order to address the universal unbalanced distribution of population density in high-density urban areas, this study analysed mobile signalling data and spatial vector data to examine how a city’s spatial characteristics affect population density distribution. The key finding is that population density distribution is unbalanced only when spatial density exceeds a critical value, which reflects the importance of blocks with varying spatial density in a city, the scope of their influence, and the diversity of their surroundings. Further, a vacuum space for citizens’ sense of identity and public facilities and services is formed by the diffusion and agglomeration effects of urban centres at different levels. Consequently, a zonal space with low population density is formed along the boundary between primary and secondary urban centres. From a spatial perspective, the unbalanced distribution of population density is essentially a result of people’s space selection preferences. Functional diversity and locational centrality are the main spatial factors that account for the difference in population density in high-density urban areas. In addition, the attractiveness of the green landscape is diminishing for various reasons (e.g., insufficient road width and high cost of street-side renovation). The findings provide a novel perspective on quantifying the link between urban form and population distribution in high-density areas and a reference for intervening in and adjusting for population density distribution in different aspects (e.g., spatial density, function, and morphology) from the perspective of urban space, thus promoting rational use of urban public resources and urban sustainability.

Author Contributions

Conceptualisation, D.S. and W.X.; methodology, D.S.; software, W.X.; data curation, D.S.; validation, W.X.; formal analysis, D.S. and W.X.; investigation, D.S. and W.X.; writing-original draft preparation, D.S.; writing-review and editing, W.X.; visualisation, D.S.; supervision, W.X.; project administration, W.X.; funding acquisition, W.X. All authors have read and agreed to the published version of the manuscript.

Funding

This research was funded by The General Project of Philosophy and Social Science Research in Colleges and Universities in Jiangsu Province (Grant No. 2021SJA0143).

Institutional Review Board Statement

Not applicable.

Informed Consent Statement

Not applicable.

Data Availability Statement

The data presented in this study are available from China Mobile.

Acknowledgments

The authors are grateful to the three reviewers for their helpful comments.

Conflicts of Interest

The authors declare no conflict of interest.

References

  1. Yue, W.Z.; Chen, Y.; Thy, P.T.M.; Fan, P.L.; Liu, Y.; Zhang, W. Identifying urban vitality in metropolitan areas of developing countries from a comparative perspective: Ho Chi Minh City versus Shanghai. Sustain. Cities Soc. 2021, 65, 102609. [Google Scholar] [CrossRef]
  2. Small, K.A.; Song, S. Population and employment densities: Structure and change. J. Urban Econ. 1994, 36, 292–313. [Google Scholar] [CrossRef] [PubMed] [Green Version]
  3. Lessmann, C. Spatial inequality and development-Is there an inverted-U relationship? J. Dev. Econ. 2014, 106, 35–51. [Google Scholar] [CrossRef] [Green Version]
  4. Lee, H.; Kim, U.Y.; Lee, J. The impact of density of land use and spatial structure on urban vitality: Focused on comparing two new town; Bundang and Ilsan in metropolitan area of Korea. SH Urban Res. Insight 2014, 4, 47–56. [Google Scholar] [CrossRef]
  5. Xia, C.; Yeh, A.G.O.; Zhang, A. Analysing spatial relationships between urban land use intensity and urban vitality at street block level: A case study of five Chinese megacities. Landsc. Urban Plan 2020, 193, 103669. [Google Scholar] [CrossRef]
  6. Shi, Y.; Yang, J.Y. The Study of Spatiotemporal Behaviour density algorithm based on mobile phone signalling data. Chin. Landsc. Archit. 2019, 5, 102–106. [Google Scholar]
  7. Lan, F.; Gong, X.Y.; Da, H.L.; Wen, H.Z. How do population inflow and social infrastructure affect urban vitality? Evidence from 35 large- and medium-sized cities in China. Cities 2020, 100, 102454. [Google Scholar] [CrossRef]
  8. Clark, C. Urban population densities. J. R. Stat. Soc. 1951, 114, 490–496. [Google Scholar] [CrossRef]
  9. Wang, L.M. Research on configuration theory and method of man earth relationship system for PRED problem. Geogr. Res. 2002, 2, 38–44. [Google Scholar]
  10. Brennan, E.M.; Richardson, H.W. Asian megacity characteristics, problems, and policies. Int. Reg. Sci. Rev. 1989, 12, 117–129. [Google Scholar] [CrossRef]
  11. Jae-won, J.; Na, J.S. Comprehensive renewal plan of low-rise residential area using appropriate blocks for the implementation of urban block renewal project–Focusing on the case of Incheon Metropolitan City. J. Urban Des. Insitute Korea 2022, 23, 53–68. [Google Scholar]
  12. Luthi, A. Ecological limits to population growth. Schweiz. Z. Fur Volkswirtsch. Und Stat. 1989, 125, 461–472. [Google Scholar]
  13. Hu, W.X. Study on spatial agglomeration and diffusion in coastal urban dense areas. City Plann. Rev. 1998, 6, 22–29. [Google Scholar]
  14. Shi, Y.; Yang, J.Y.; Shen, P.Y. Revealing the correlation between population density and the spatial distribution of urban public service facilities with mobile phone data. ISPRS Int. J. Geo-Inf. 2020, 9, 38. [Google Scholar] [CrossRef] [Green Version]
  15. Liu, Y.S.; Zhao, P.J.; Liang, J.S. Study on urban vitality based on LBS data: A case of Beijing within 6th Ring Road. Areal Res. Dev. 2018, 37, 64–87. [Google Scholar]
  16. Chang, F.; Wang, L.; Ma, Y.; Yan, C.; Liu, H. Do urban public service facilities match population demand? Assessment based on community life circle. Prog. Geogr. 2021, 40, 607–619. [Google Scholar] [CrossRef]
  17. Szele, A.; Kisgyorgy, L. The vitality of traffic directions in road networks with recurrent congestion and its effect on road traffic design. In Proceedings of the Third International Conference on Traffic and Transport Engineering (CTTE), Tangier, Morocco, 27–28 May 2016; pp. 1012–1018. [Google Scholar]
  18. Gao, Y.P.; Xu, X.F.; Wei, Y. Analysis on the imbalance of population flow network during the Spring Festival travel rush in China in 2015. PLoS ONE 2021, 16, e0249520. [Google Scholar] [CrossRef]
  19. Zhang, F. Man-land relationship: Crisis, feature and thought on harmonisation. China Popul. Res. Environ 1993, 1, 9–14. [Google Scholar]
  20. Vinuela, A.; Posada, D.G.; Morollon, F.R. Determinants of immigrants’ concentration at local level in Spain: Why size and position still matter. Popul. Space Place 2019, 25, e2247. [Google Scholar] [CrossRef]
  21. Nie, X.J.; Zhang, Y.C.; Zhou, W.; Su, H.; Yang, T.T.; Li, X.H.; Lan, S.R. Research status and trend of urban space vitality comparative analysis of Chinese and English literature. J. Southwest Univ. Nat. Sci. Ed. 2021, 43, 147–155. [Google Scholar]
  22. Ariste, R. Availability of health workforce in urban and rural areas in relation to Canadian seniors. Int. J. Health Plann. Manag. 2019, 34, 510–520. [Google Scholar] [CrossRef] [PubMed]
  23. Masuda, J.R.; Zupancic, T.; Poland, B.; Cole, D.C. Environmental health and vulnerable populations in Canada: Mapping an integrated equity-focused research agenda. Can. Geogr.-Geogr. Can. 2008, 52, 427–450. [Google Scholar] [CrossRef]
  24. Bauer, T.; Epstein, G.; Gang, I.N. Herd effects or migration networks? The location choice of Mexican immigrants in the US. IZA Discuss. Pap. 2002, 551, 1–44. [Google Scholar]
  25. Bonaparte, H.M. Toward a population policy. Cuad. De Econ. Soc. 1982, 4, 77–95. [Google Scholar]
  26. Reboratti, C.A. Some considerations on population policy in Argentina. Cuad. Econ. Soc. 1982, 4, 45–55. [Google Scholar]
  27. Alogoskoufis, G.; Manning, A. Wage setting and unemployment persistence in Europe, Japan and the USA. Eur. Econ. Rev. 1998, 32, 698–706. [Google Scholar] [CrossRef]
  28. Geshev, G.; Tsekova, E.; Kalchev, I.; Spiridonova, I. The impact of migration on regional demography. Naselenie 1992, 5, 29–39. [Google Scholar]
  29. Alcala, C.M.; Moral-Pajares, E. Unbalanced distribution of the foreign population among the Spanish provinces: Determining factors. Rev. Estud. Reg. 2015, 103, 109–130. [Google Scholar]
  30. Diwakar, A. Processes and factors of metropolitanisation in India. Popul. Geogr. 1993, 15, 41–60. [Google Scholar]
  31. Duan, P.Z. Influence of China’s population flow in the change of regional disparity since 1978. China Popul. Res. Environ. 2008, 18, 27–33. [Google Scholar]
  32. Liu, Y.W.; Yan, Q.W.; Huang, S.; Jiang, C.L.; Jiang, L. Analysis on spatio-temporal dynamics of population distribution in Jiangsu. Sci. Survey. Mapp. 2015, 40, 30–35. [Google Scholar] [CrossRef]
  33. Liu, S.J.; Zhang, L.; Long, Y. Urban vitality area identification and pattern analysis from the perspective of time and space fusion. Sustainability 2019, 11, 4032. [Google Scholar] [CrossRef] [Green Version]
  34. Evans, A.W. The assumption of equilibrium in the analysis of migration and interregional differences—A review of some recent research. J. Reg. Sci. 1993, 30, 515–531. [Google Scholar] [CrossRef] [PubMed]
  35. Harrigan, F.J.; McGregor, P.G. Equilibrium and disequilibrium perspectives on regional labour migration. J. Reg. Sci. 1993, 33, 49–67. [Google Scholar] [CrossRef]
  36. Casado, M.; Molina, L.; Oyarzun, J. El analisis economico de los movimientos migratorios internacionales: Determinantes empiricos y nuevas propuestas de regulacion, Facultad de Ciencias Economicas y Empresariales de la UCM. Work. Pap. 2003, 7, 180–210. [Google Scholar]
  37. Mar, C. Los determinantes de los flujos migratorios internacionales: El caso espanol, 1995–2007. Princ. Estud. Econ. Politica 2009, 14, 49–68. [Google Scholar]
  38. Liu, J.S.; Chen, Y.G. GIS-based cellular automata models and researches on spatial complexity of man-land relationship. Geogr. Res. 2002, 21, 155–162. [Google Scholar]
  39. Li, X.J.; Wen, Y.Z.; Li, Y.Z.; Yang, H.M. High-quality development of the Yellow River Basin from a perspective of economic geography: Man-land and spatial coordination. Econ. Geogr. 2020, 40, 190–199. [Google Scholar]
  40. Minagawa, K.; Sumiyoshi, K. Studies on the optimal location of commerce-basic laws considering the distribution of population. Int. J. Prod. Econ. 1999, 60–61, 295–300. [Google Scholar] [CrossRef]
  41. Dorozhovets, M. Forward and inverse problems of Type A uncertainty evaluation. Measurement 2020, 165, 108072. [Google Scholar] [CrossRef]
  42. Yucong, H.; Haiwei, C.; Jian, O.; Lianhua, P.; Fengming, L. Land-Use Spatial Distribution Simulation and Traffic Demand Forecasting in New Town. J. South China Univ. Technol. Nat. Sci. Ed. 2014, 42, 27–34. [Google Scholar]
  43. Wu, Q.B.; Chen, Q.H. Population spatial change and urban spatial restructuring in Hangzhou from 2000 to 2010. City Plann. Rev. 2015, 39, 30–38. [Google Scholar]
  44. Meijers, E.J.; Burger, M. Spatial structure and productivity in US metropolitan areas. Environ. Plan A 2010, 42, 1383–1402. [Google Scholar] [CrossRef] [Green Version]
  45. Li, K.T. Population distribution and quality of life in the Taiwan area. Zi You Zhongguo Zhi Gong Ye 1983, 60, 17–31. [Google Scholar]
  46. Zhu, J.; He, B.J. Rebalance strategies for metropolitan area in the context of urban growth: Implications from Greater Sydney strategic planning 2056. Shanghai Urban Plan. Rev. 2017, 5, 83–89. [Google Scholar]
  47. Chi, G.Q.; Ventura, S.J. An integrated framework of population change: Influential factors, spatial dynamics, and temporal variation. Growth Change 2011, 42, 549–570. [Google Scholar] [CrossRef]
  48. Zhang, Z.C.; Luan, W.X.; Tian, C.; Su, M.; Li, Z.Y. Spatial distribution equilibrium and relationship between construction land expansion and basic education schools in Shanghai based on POI Data. Land 2021, 10, 1059. [Google Scholar] [CrossRef]
  49. Zhao, D.; Li, J.Y.; Yan, H.W.; Yin, H.Y.; Fu, Y.D.; Li, J.X. Spatial distribution characteristics of urban potential population in Shenyang City based on GIS and RS. Chin. J. Appl. Ecol. 2017, 28, 2697–2704. [Google Scholar]
  50. Lee, S.G.; Cho, I.S.; OHSEGYU. A Study on the planning characteristics of void spaces revealed in the external appearance of collective housings -focusing on the cases of collective housings in the architects working around the Netherlands. J. Archit. Inst. Korea 2014, 16, 11–20. [Google Scholar]
  51. Ma, B.; Jiang, J.; Xue, D.Q.; Li, M.; Cai, L. Spatial characteristics of historical and cultural block in the perspective of integration of subject and object:a case study of Xi’an Shuyuanmen. J. Shaanxi Normal Univ. 2018, 46, 102–109. [Google Scholar]
  52. Lee, J.H. A study on typology and property of the method of spatial composition in the block of street. J. Archit. Inst. Korea Plan Des. 2005, 21, 177–186. [Google Scholar]
  53. Jan, G.; Gemzoe, L. New City Spaces; Danish Architectural Press: Copenhagen, Denmark, 2000; ISBN 8774072552. [Google Scholar]
  54. Zhang, Z.B.; Pan, J.; Da, F.W. Population spatial structure evolution pattern and regulating pathway in Lanzhou City. Geogr. Res. 2012, 31, 2055–2068. [Google Scholar]
  55. Mao, Z.R.; Chen, X.K.; Xiang, Z.H.; Chen, Y.R. Research on the measurement and influencing factors of street vigour in historic districts: A case study of Wenming Street historic district in Kunming. SPE J. 2021, 4, 54–61. [Google Scholar]
  56. Jiang, C.J.; Gab-Geun, Y. Research on the design methods of historical and cultural blocks and public facilities -take Harbin Central Street for example. J. Humaniti. Soc. Sci. 2021, 12, 15–28. [Google Scholar]
  57. Mousavi, A.; Bunker, J.; Lee, J. Exploring socio-demographic and urban form indices in demand forecasting models to reflect spatial variations: Case study of childcare centres in Hobart, Australia. Buildings 2021, 11, 493. [Google Scholar] [CrossRef]
  58. Ratti, C.; Williams, S.; Frenchman, D.; Pulselli, R.M. Mobile landscapes: Using location data from cell phones for urban analysis. Environ. Plann. B Plann. Des. 2006, 33, 727. [Google Scholar] [CrossRef]
  59. Wang, H.J.; Li, X.Y.; Zhang, Z.L.; He, X.Y.; Chen, W.; Chen, Y.B.; Hu, J.B. Analysis on urban spatial expansion process in Shenyang City in 1979–2006. J. Appl. Ecol. 2008, 19, 2673–2679. [Google Scholar]
  60. Liu, L.B.; Peng, Z.H.; Wu, H.; Jiao, H.Z.; Yu, Y. Exploring urban spatial feature with dasymetric mapping based on mobile phone data and LUR-2SFCAe method. Sustainability 2018, 10, 2432. [Google Scholar] [CrossRef] [Green Version]
  61. Tian, G.J.; Jiang, J.; Yang, Z.F.; Zhang, Y.Q. The urban growth, size distribution and spatio-temporal dynamic pattern of the Yangtze River Delta megalopolitan region, China. Ecol. Modell. 2011, 222, 865–878. [Google Scholar] [CrossRef]
  62. Banerjee, A.; Saha, J. Population environment interface in urban India: A geographical analysis. Landsc. Ecol. Water Manag. 2014, 1, 147–163. [Google Scholar]
  63. Lafrombois, M.E.H.; Park, Y. The uneven shrinking city: Neighborhood demographic change and creative class planning in Birmingham, Alabama. Urban Geogr. 2021, 10, 4788. [Google Scholar] [CrossRef]
  64. Edwardes, M. Kendall Tau is Equal to the Correlation-Coefficient for the Be Distribution. J. South China Univ. Technol. Nat. Sci. Ed. Stat. Probab. Lett. 1993, 17, 415–419. [Google Scholar]
  65. Xu, W.C.; Ma, R.B.; Zhou, Y.Z.; Peng, S.G.; Hou, Y.H. Asymptotic properties of Pearson’s rank-variate correlation coefficient in bivariate normal model. Signal Process. 2015, 119, 190–202. [Google Scholar] [CrossRef]
  66. Pulselli, R.; Ramono, P.; Ratti, C.; Tiezzi, E. Computing urban mobile landscapes through monitoring population density based on cellphone chatting. Int. J. Des. Nat. Ecodyn. 2008, 3, 121–134. [Google Scholar]
  67. Louail, T.; Lenormand, M.; Ros, O.G.C.; Picornell, M.; Herranz, R.; Frias-Martinez, E.; Ramasco, J.J.; Barthelemy, M. From mobile phone data to the spatial structure of cities. Sci. Rep. 2014, 4, 5276. [Google Scholar] [CrossRef] [Green Version]
  68. Hu, X.Y.; Yang, J.Y. Spatial characteristics and boundary defining of shadow areas in public centre districts of megacities. J. Southeast Univ. Nat. Sci. Ed. 2014, 44, 1093–1098. [Google Scholar]
  69. Zhang, J.X.; Zhuang, L.D. Study on the evolution mechanism and countermeasures of metropolitan shadow area. J. Nanjing Univ. (Nat. Sci.) 2000, 6, 687–692. [Google Scholar]
  70. Frank, L.; Bradley, M.; Kavage, S.; Chapman, J.; Lawton, T.K. Urban form, travel time, and cost relationships with tour complexity and mode choice. Transportation 2008, 35, 37–54. [Google Scholar] [CrossRef]
  71. Ye, Y.; Li, D.; Liu, X.J. How block density and typology affect urban vitality: An exploratory analysis in Shenzhen, China. Urban Geogr. 2018, 39, 631–652. [Google Scholar] [CrossRef]
  72. Yi, Y.M.; Gim, T.H.T. What makes an old market sustainable? An empirical analysis on the economic and leisure performances of traditional retail markets in Seoul. Sustainability 2018, 10, 1779. [Google Scholar] [CrossRef] [Green Version]
  73. Gabriel, S.A.; Nothaft, F.E. Rental housing markets, the incidence and duration of vacancy, and the natural vacancy rate. J. Urban Econ. 2001, 49, 121–149. [Google Scholar] [CrossRef] [Green Version]
  74. Law of the People’s Republic of China on the Prevention and Control of Atmospheric Pollution. Available online: https://heinonline.org/HOL/LandingPage?handle=hein.journals/chinelgo37&div=39&id=&page= (accessed on 1 May 2014).
  75. Pawe, C.K.; Saikia, A. Decumbent development: Urban sprawl in the Guwahati Metropolitan Area, India. Singap. J. Trop. Geogr. 2020, 41, 226–247. [Google Scholar] [CrossRef]
  76. Yang, J.Y.; Hu, X.Y. Study on shadow area of city centres in circle-core structure mode. City Plann. Rev. 2012, 36, 26–33. [Google Scholar]
  77. Ou, G.L.; Zhou, M.; Zeng, Z.P.; He, Q.S.; Yin, C.H. Is there an equality in the spatial distribution of urban vitality: A case study of Wuhan in China. Open Geosci. 2021, 13, 469–481. [Google Scholar] [CrossRef]
  78. Ghaempanah, N.; Rahnamaei, M.T. Analysis success factors of the new cities establishment (case study: Pardisan town). Nexo Rev. Cient. 2021, 34, 1231–1242. [Google Scholar] [CrossRef]
  79. Kuang, W.H.; Du, G.M. Analysing urban population spatial distribution in Beijing Proper. J. Geo-Info Sci. 2011, 13, 506–512. [Google Scholar]
  80. Yigitcanlar, T.; Sarimin, M. Contributions of knowledge-based foundations of universities in knowledge city formation: A Malaysian case study. In Proceedings of the 2011 6th International Forum on Knowledge Asset Dynamics (IFKAD2011), Tampere, Finland, 15–17 June 2011; pp. 13–37. [Google Scholar]
  81. Xue, B.; Li, J.Z.; Xiao, X.; Xie, X.; Lu, C.P.; Ren, W.X.; Jiang, L. Overview of man-land relationship research based on POI data: Theory, method and application. Geogr. Geo-Info Sci. 2019, 35, 51–60. [Google Scholar]
  82. Rupasinghe, H.T.; Halwatura, R.U. Benefits of implementing vertical greening in tropical climates. Urban For. Urban Green. 2020, 53, 126708. [Google Scholar] [CrossRef]
  83. Yu, S.J.; Yuan, S.Q. Study on the spatial pattern of urban public green space based on GridsA case study of the main urban area of Fuzhou. J. Fujian Norm. Univ. Nat. Sci. 2011, 27, 88–94. [Google Scholar]
  84. Mu, B.; Liu, C.; Mu, T.; Xu, X.N.; Tian, G.H.; Zhang, Y.L.; Kim, G.W. Spatiotemporal fluctuations in urban park spatial vitality determined by on-site observation and behaviour mapping: A case study of three parks in Zhengzhou City, China. Urban For. Urban Green. 2021, 64, 127246. [Google Scholar] [CrossRef]
  85. Noh, S.C.; Park, J.H. Cafe and restaurant under my home: Predicting urban commercialisation through machine learning. Sustainability 2021, 13, 5699. [Google Scholar] [CrossRef]
Figure 1. Phenomenon of unbalanced distribution of population density.
Sustainability 14 05776 g001
Figure 2. Location of Changzhou and central urban area. Note: (a) Location of Changzhou; (b) Urban central area.
Sustainability 14 05776 g002
Figure 3. Population density and spatial density of each block. Note: (a) Population density; (b) Spatial density.
Sustainability 14 05776 g003
Figure 4. Comparison between population density and spatial density.
Sustainability 14 05776 g004
Figure 5. Framework diagram.
Sustainability 14 05776 g005
Figure 6. Spatial density in high-density zones. Note: (a) Krigin interpolation calculation for spatial density distribution and transition zone ditribution; (b) Types of zones by spatial density.
Sustainability 14 05776 g006
Figure 7. Spatial distribution of commercial blocks with unbalanced population density and commercial blocks with medium and low population density. Note: (a) Spatial distribution of commercial blocks with unbalanced population density; (b) Spatial distribution of commercial blocks with unbalanced medium and low population density.
Sustainability 14 05776 g007
Figure 8. Quantitative distribution of commercial blocks with unbalanced medium and low population density in three types of spatial zones.
Sustainability 14 05776 g008
Figure 9. Spatial distribution of business blocks with unbalanced medium and low population density.
Sustainability 14 05776 g009
Figure 10. Spatial distribution of general residential blocks with unbalanced medium and low population density.
Sustainability 14 05776 g010
Figure 11. How spatial characteristics affect population density distribution.
Sustainability 14 05776 g011
Table 1. Relevant indicators of spatial characteristics.
Characteristic IndicatorCalculation
Locational centrality C L I n = S k G k D n k 2 , where K denotes the number of city-level central areas in the measured city; G k denotes the total floor area of public facilities within the scope of city-level central areas; S k denotes the total area of blocks in the central area k; D n k denotes the straight-line distance between the spatial unit n and city-level central area k.
Functional diversity   L D I n = u = 1 U p u u = 1 U p u × ln ( p u u = 1 U p u ) , where p u denotes the block area of type u in the block n; U denotes the total number of block types within a block range.
Accessibility R A I n = L S , where L denotes the total length of road axes within a spatial unit; S denotes the total block area within a spatial unit.
Scale intensiveness B D I n = M S , where M denotes the total base area of all buildings within a spatial unit; S denotes the area of a spatial unit.
Morphological compactness P S I n = π S V , where S denotes the total block area within a spatial unit; V denotes the perimeter of all planar shapes within a spatial unit.
Landscape quality G C I n = E 500 m S 500 m , E denotes the green area in the buffer zone within a distance of 500 m from a spatial unit; S denotes the area of the buffer zone within a distance of 500 m from a spatial unit.
Table 2. Example of base station data sample.
StationLongitudeLatitude0:001:002:003:004:005:00
2,079,730,131120.0925131.51191184182184172182169
6:007:008:009:0010:0011:0012:0013:0014:00
190203240269309277297274273
15:0016:0017:0018:0019:0020:0021:0022:0023:00
277288242260254241223213210
Note: The time in the table corresponds to the number of mobile phones connected to the current base station per day.
Table 3. Urban spatial data content.
DatabaseData LayerContent
Data of urban spaceBlock layerThis layer contains block boundaries and block area.
Functional type layerThis layer contains the functional type and code of each block.
Building layerThis layer contains the base area of buildings, building stories, and building functions.
Road traffic layerThis layer contains road axes and stops or stations of urban public traffic.
National boundary environmentThis layer contains rivers, river systems and mountains.
Table 4. Analysis of correlation between population density and spatial density.
Functional Type of BlockCoefficient of Correlation between Population Density and Spatial DensityBlock QuantityBar Chart of Data
Administrative block0.264 *33 Sustainability 14 05776 i001
Educational block0.283 *64
Medical and health block0.13026
Sports block0.25112
Commercial block0.454 **305
Business block0.226 *126
Entertainment block0.217 *17
Utility block0.292 **14
High-grade residential block−0.027107
General residential block0.326 **386
Shanty residential block0.235 **144
Traffic block−0.128 **15
Industrial block0.15683
Note: ** denotes the significant correlation at 1% level (two-tailed test), and * denotes the significant correlation at 5% level.
Table 5. Population density distribution, spatial density, and degree of population–space correlation in different types of blocks.
Educational BlockCommercial BlockBusiness BlockGeneral Residential BlockShanty Residential Block
Distribution of population density and spatial density Sustainability 14 05776 i002 Sustainability 14 05776 i003 Sustainability 14 05776 i004 Sustainability 14 05776 i005 Sustainability 14 05776 i006
Degree of population–space correlation Sustainability 14 05776 i007 Sustainability 14 05776 i008 Sustainability 14 05776 i009 Sustainability 14 05776 i010 Sustainability 14 05776 i011
When spatial density is higher than 10,000 m2/ha, unbalanced distribution of population density is obvious.When spatial density is higher than 22,000 m2/ha, unbalanced distribution of population density is very obvious.When spatial density is higher than 10,000 m2/ha, unbalanced distribution of population density is obvious.When spatial density is higher than 30,000 m2/ha, unbalanced distribution of population density is obvious.When spatial density is higher than 4000 m2/ha, unbalanced distribution of population density is obvious.
Note: Sustainability 14 05776 i040 denotes the critical value of unbalanced distribution of population density.
Table 6. Spatial distribution and characteristics of blocks with unbalanced population density.
Educational Blocks with Unbalanced Population DensityCommercial Blocks with Unbalanced Population DensityBusiness Blocks with Unbalanced Population DensityGeneral Residential Blocks with Unbalanced Population DensityShanty Residential Blocks with Unbalanced Population Density
Distribution of blocks Sustainability 14 05776 i012 Sustainability 14 05776 i013 Sustainability 14 05776 i014 Sustainability 14 05776 i015 Sustainability 14 05776 i016
Spatial characteristics of blocks Sustainability 14 05776 i017 Sustainability 14 05776 i018 Sustainability 14 05776 i019 Sustainability 14 05776 i020 Sustainability 14 05776 i021
Note: Sustainability 14 05776 i041 denotes the spatial characteristics of the top 20 blocks in terms of the ratio of population density to spatial density; Sustainability 14 05776 i042 denotes the spatial characteristics of the bottom 20 blocks in terms of the ratio of population density to spatial density; A denotes the locational centrality of a block, B denotes the functional diversity of a block, C denotes the accessibility of a block, D denotes the scale intensiveness of a block, E denotes the morphological compactness of a block, and F denotes the landscape quality of a block.
Table 7. Typical morphology of commercial block when spatial density is above or below the critical value.
Spatial density
≥ Critical value
Sustainability 14 05776 i022 Sustainability 14 05776 i023 Sustainability 14 05776 i024 Sustainability 14 05776 i025 Sustainability 14 05776 i026 Sustainability 14 05776 i027 Sustainability 14 05776 i028 Sustainability 14 05776 i029 Sustainability 14 05776 i030
Spatial density
< Critical value
Sustainability 14 05776 i031 Sustainability 14 05776 i032 Sustainability 14 05776 i033 Sustainability 14 05776 i034 Sustainability 14 05776 i035 Sustainability 14 05776 i036 Sustainability 14 05776 i037 Sustainability 14 05776 i038 Sustainability 14 05776 i039
Publisher’s Note: MDPI stays neutral with regard to jurisdictional claims in published maps and institutional affiliations.

