Article

Decoupling Analysis of Net Carbon Emissions and Economic Growth of Marine Aquaculture

1
School of Management Science and Engineering, Shandong University of Finance and Economics, Jinan 250014, China
2
Institute of Marine Economy and Management, Shandong University of Finance and Economics, Jinan 250014, China
*
Author to whom correspondence should be addressed.
Sustainability 2022, 14(10), 5886; https://doi.org/10.3390/su14105886
Submission received: 5 April 2022 / Revised: 10 May 2022 / Accepted: 11 May 2022 / Published: 12 May 2022

Abstract

:
Decoupling carbon emissions from economic growth is the key for the sustainable development of developing countries. Based on the panel data of marine aquaculture in China from 2010 to 2019, this paper employs the Tapio decoupling index model to analyze the decoupling characteristics of net carbon emissions and the economic growth of marine aquaculture. The logarithmic average weight decomposition method (LMDI model) and Tapio decoupling effort index model are also introduced to explore the contribution of various areas, provinces, and factors to the decoupling of net carbon emissions and the economic growth of marine aquaculture. Empirical results show that: (1) Net carbon emissions have a decoupling trend from the economic growth of marine aquaculture, but there is a large regional difference. (2) Regarding the degree of decoupling efforts, it is much stronger in the eastern and southern ocean economic zones than that in the northern ocean economic zone. (3) In terms of the decoupling contributions of various factors, carbon emission intensity > aquaculture scale > aquaculture efficiency > aquaculture structure, but there is heterogeneity among the different regions. Among the reasons for the inter-regional differences, carbon emission intensity > aquaculture scale > aquaculture structure > aquaculture efficiency. A further redundancy efficiency analysis explains the source of the differences. On this basis, strategies are proposed to improve the efficiency of marine aquaculture, including the construction of a modern three-dimensional aquaculture system, the improvement of the market-oriented mechanism, and the establishment of a modern marine aquaculture economic system.

1. Introduction

With the world’s largest aquaculture area and production, marine aquaculture in China occupies an important position in the fishery economy and it is increasingly becoming an important part of the marine economy [1]. However, under the constraints of China’s double carbon goal, the decoupling of carbon emissions and the economy becomes fundamental to the sustainable development of marine aquaculture. Unfortunately, disorderly and unbridled offshore aquaculture not only exceeds the carrying capacity of marine ecosystems, but also leads to high carbon emissions caused by the diesel combustion and electricity consumption of fishing vessels in the process of marine aquaculture [2,3], which puts pressure on the marine environment and climate change [4,5,6]. Therefore, measuring whether economic growth occurs at the expense of environmental damage and judging whether there is a decoupling of economic growth and the carbon emissions of marine aquaculture, are urgent problems that need to be solved for sustainable economic development.
FOn the other hand, more and more scholars recognize the “blue carbon” value (including the economic value and ecological value generated by the carbon sink [7]) of marine aquaculture and the marine aquaculture industry has increasingly become a “carbon sink ground.” The comprehensive aquaculture of shellfish, algae, and marine pasture is also the process of the absorption, collection, storage, and buffering of CO2. It has the function of carbon sequestration and is an important part of the carbon cycle [8]. Therefore, in the marine aquaculture industry, the decoupling analysis of carbon emissions and economic growth should consider net carbon emissions instead of the traditional carbon emissions generated by human activities.
This also increases the complexity of the analysis of decoupling influencing factors. Factors related to human production activities and biological carbon sequestration characteristics are all involved, such as the energy intensity, the economic output effect, the size of the aquaculture scale, the reasonability of the aquaculture structure, and the level of aquaculture efficiency [9,10,11]. When we explore the decoupling relationship between net carbon emissions and economic growth, we should systematically consider these influencing factors and their contribution degrees. This will be helpful to enhance the ecological value of the marine aquaculture carbon sink and provide a better “decarbonization space” for the high-quality, sustainable development of the fishery and marine economy.
Our research has made several contributions. Firstly, we introduce the index of net carbon emissions to explore its decoupling relationship with the economic growth of marine aquaculture. This can offset a certain amount of carbon emissions compared with original researches [12]. Secondly, we explore the comprehensive driving effect of carbon emission intensity, economic structure, aquaculture efficiency, aquaculture scale, and aquaculture structure on net carbon emissions, which proposes a systematic analysis framework compared with the original research. Thirdly, we estimate the contributions of aquaculture scale, aquaculture efficiency, carbon emission intensity, and aquaculture structure to the decoupling of net carbon emissions from economic growth in different regions. This provides a basis for further management strategies.
The remainder of this paper is organized as follows: Section 2 reviews the relevant literature, Section 3 describes the research methods and data sources used in this paper, Section 4 analyzes the empirical results, and Section 5 presents the conclusions and discussion of this paper.

2. Literature Review

At present, there is little research on the relationship between carbon emissions and the economic growth of marine aquaculture; however, studies are relatively rich in marine fisheries. Therefore, this paper focused on combing the relevant literature on the relationship between fishery carbon emissions and fishery economic growth. Correctly handling the relationship between marine ecological protection and fishery economic development is the key to promoting the comprehensive and sustainable development of fisheries [13]. Therefore, the decoupling relationship between fishery carbon emissions and the fishery economy has been widely addressed by scholars.
The decoupling relationship between carbon emissions and the fishery economy is commonly determined by related research involved in marine environmental pollution and marine economic development [14,15]. Researchers divided the development states into four stages: no decoupling, relative decoupling, absolute decoupling, and zero carbon emissions [16]. Related researchers found that the growth of the fishery economy led to an increase in implied carbon emissions [17,18]; however, the relationship between fishery carbon emissions and the fishery economy is unstable. Although there is no evidence for a good decoupling state [19], the decoupling relationship has improved at present [20].
Other researchers point out that marine aquaculture not only produces carbon emissions but is also an important part of the “blue carbon” system [21]; however, whether its industrial attribute is a “carbon source” or a “carbon sink” is influenced by many factors. On the one hand, some factors will affect carbon emissions by reducing them, such as reducing the fishing volume (seasonal ban), implementing good fishery financial subsidies, infrastructure construction, and other government management decisions [22,23,24], as well as the aquaculture species structure, model, and engineering of a carbon sink increase in the aquaculture, fishery technology, and other aquaculture levels [25,26,27]. On the other hand, certain factors can affect carbon emissions by enhancing the carbon sink function of a marine aquaculture, such as the scale level of alga culture cost, the aquaculture method, resource input, aquaculture output, aquaculture structure, aquaculture species, etc. [28,29,30], and technical levels such as the aquaculture mode, fishery production technology level, etc. [31].
Therefore, the decoupling relationship between carbon emissions and the fishery economy should focus on the “net” emissions and the growth of the fishery economy from both sides, namely, carbon emissions and carbon sink. Unfortunately, there are relatively few studies from this point of view. In addition, studies on the influencing factors of marine aquaculture carbon emissions comprise theoretical analysis but lack systematic and empirical research on the nonlinear interaction of complex driving factors such as the aquaculture scale, aquaculture structure, and aquaculture efficiency, and ignore the contribution of various factors to the decoupling relationship between net carbon emissions and the economic growth of marine aquaculture.
In this paper, the Tapio decoupling index model is employed to analyze the decoupling characteristics of net carbon emissions and the economic growth of marine aquaculture at different levels. The LMDI model and Tapio decoupling effort index model are also introduced to discuss the contribution degree of sea areas, provinces, and various factors to the decoupling of net carbon emissions and the economic growth. Consequently, countermeasures and suggestions are proposed.

3. Materials and Methods

3.1. Methods

3.1.1. Accounting Method for Net Carbon Emissions of Marine Aquaculture

The net carbon emissions of marine aquaculture are calculated by the following three steps:
(1)
Calculation of the carbon emissions of marine aquaculture
Marine aquaculture carbon emissions mainly come from two sources: the first is the direct carbon emissions from the burning of fishing boat diesel fuel, and the second is the indirect emissions from marine aquaculture electricity consumption [25], including the power consumption of production links such as the oxygen supply to aquaculture ponds or factories. The direct and indirect carbon emissions can be calculated according to the carbon emissions coefficient of diesel consumption and electricity consumption (as shown in Table 1) (This was calculated according to the IPCC Guidelines for National Greenhouse Gas Inventories 2006 and the Reference Standard for Calculating Fuel Allowance for Domestic Motor Fishing Boats), and then, the total carbon emissions from the marine aquaculture can be obtained, as shown in Equation (1):
C E = C D + C I = P μ × θ 1 + S i ρ i × θ 2
where C E represents the total carbon emissions from marine aquaculture, C D represents direct carbon emissions, C I is indirect carbon emissions; P represents the power of the aquaculture fishing boat, S i denotes the area of category i marine aquaculture method, μ and ρ represent the corresponding energy consumption conversion coefficient; θ 1 is the carbon emissions coefficient of diesel oil, and θ 2 represents the carbon emissions coefficient of power.
(2)
Estimation of carbon sequestration in marine aquaculture
The amount of carbon sequestration in marine aquaculture mainly depends on the yield of shellfish and algae. In this paper, referring to the carbon sink accounting method of marine aquaculture of Ji and Wang [29], Zhang et al. [32], Shao et al. [33], and Sun et al. [34], shellfish can be divided into oysters, clams, scallops, mussels and other shellfish, and algae can be divided into kelp, undaria, laver, river hedge, and other algae. According to the China ocean carbon sink economic value accounting standard, the carbon sequestration of shellfish was estimated with the carbon comprehensive coefficient method. The specific calculation method is shown in Equation (2):
C S = C s h + C a l = m i α i + n k β k
where C S is the total carbon sequestration of marine aquaculture, C s h represents the amount of carbon sequestration of shellfish, C a l represents the amount of carbon sequestration of algae;   m i is the yield of variety i of shellfish,   n k represents the production of species k in algae; and α i and β k , respectively, are the carbon sink conversion coefficients corresponding to shellfish and algae species. Table 2 shows the carbon sink conversion coefficient of shellfish algae based on yield, dry/wet weight conversion coefficient, mass-specific gravity, carbon content, and other parameters.
(3)
Accounting of net carbon emissions from marine aquaculture
In this paper, the net carbon emissions refer to the difference between the carbon emissions and carbon sequestration of marine aquaculture, and the calculation formula can be expressed as Equation (3):
C N = C E C S = C D + C I C s h C a l = P μ × θ 1 + S j ρ j × θ 2 m i α i n k β k

3.1.2. Tapio Decoupling Index Model

The decoupling of carbon emissions refers to an idealized process in which the relationship between economic growth and the emission of greenhouse gases such as carbon dioxide and freon continues to weaken and even disappear [35]. Decoupling characteristics are generally analyzed by using the decoupling index model [36].
We constructed a decoupling model to analyze the decoupling characteristics of the net carbon emissions and economic growth of marine aquaculture, as shown in Equation (4):
e = C N / C N G O P / G O P = C N t + 1 C N t / C N t G O P t + 1 G O P t / G O P t = % C N % G O P
where e represents the decoupling elasticity, C N and G O P , respectively, represent the net carbon emissions from marine aquaculture and the total value of marine aquaculture production; C N and G O P , respectively, represent the changes in net carbon emissions from marine aquaculture and the total value of marine aquaculture production from year t to year t + 1 ; and % C N and % G O P , respectively, represent the rate of change in net carbon emissions from marine aquaculture and the total production value of marine aquaculture.
Tapio defined eight decoupling states according to the elasticity value of decoupling. Based on this, we classified eight decoupling states between the net carbon emissions and the economic growth of marine aquaculture, as shown in Table 3.
According to Table 3, this paper determined and analyzed the decoupling characteristics between net carbon emissions and the economic growth of marine aquaculture.

3.1.3. Tapio Decoupling Effort Index Analysis Model

The model in this section was used to objectively evaluate the degree of decoupling effort of each influencing factor and was divided into two steps: in step one, the LMDI index was used to decompose the net carbon emissions to determine its influencing factors. In step two, the decoupling effort index model was used to analyze the decoupling effort degree of each factor.
(1)
Decomposition of the LMDI index of net carbon emissions.
According to the Kaya identity [37], carbon emissions can be expressed as a function of energy emission intensity, energy consumption per unit of GDP, per capita GDP, and other factors. In this paper, based on the principle of the Kaya identity, the net carbon emissions from marine aquaculture are expressed as the identity relation of carbon emission intensity, aquaculture economic structure, aquaculture efficiency, aquaculture scale, and aquaculture structure, as shown in Equation (5):
C N = C E Q × Q G O P × G O P P × P M × M = C c i n t × C f s t r × C f e f f × C c s t r × C f s c a
where Q represents the output value of shellfish cultivation, P refers to the personnel engaged in marine aquaculture, M represents the marine aquaculture area; C c i n t , C f s t r , C f e f f , C c s t r and C f s c a , respectively, represent the carbon emission intensity, economic structure, efficiency, industrial structure, and scale of marine aquaculture.
We used the logarithmic average weight decomposition method (LMDI) proposed by Ang et al. [38] and the additional model to decompose the influencing factors of net carbon emissions from marine aquaculture, as shown in Equation (6):
C N = C N t + 1 C N t = C c i n t + C f s t r + C f e f f + C c s t r + C f s c a
In Equation (5), △ C N represents the total change effect of net carbon emissions from aquaculture, which can be decomposed into five factors: the carbon emission intensity effect (△ C c i n t ), aquaculture economic structure effect ( C f s t r ), aquaculture efficiency effect (△ C f e f f ), aquaculture industrial structure effect (△ C c s t r ), and aquaculture scale effect (△ C f s c a ). The specific calculation formula of each factor is shown in Equations (7)–(11):
C c i n t = L C N t + 1 , C N t * ln C c i n t t + 1 C c i n t t
C f s t r = L C N t + 1 , C N t * ln C f s t r t + 1 C f s t r t
C f e f f = L C N t + 1 , C N t * ln C f e f f t + 1 C f e f f t
C c s t r = L C N t + 1 , C N t * ln C c s t r t + 1 C c s t r t
C f s c a = L C N t + 1 , C N t * ln C f s c a t + 1 C f s c a t
where △ C c i n t , △ C f s c a , △ C f e f f , △ C c s t r and △ C f s t r , respectively, represent the changes in carbon emission intensity, aquaculture economic structure, aquaculture efficiency, aquaculture industrial structure, and aquaculture scale from year t to year t + 1 .
(2)
Tapio decoupling index.
Referring to Diakoulaki and Mandaraka [39], based on the decomposition results of the influencing factors of net carbon emissions from marine aquaculture (Equation (6)), we excluded the carbon emissions caused by the GOP increase in the process of marine aquaculture economic growth in the net carbon emissions, so as to evaluate the decoupling effort of various influencing factors more objectively. According to Equation (6) obtained by the LMDI model, the net carbon emissions effort of marine aquaculture (△ F c ) can be expressed as Equation (12):
F C = C N C f s t r = C c i n t + C f e f f + C c s t r + C f s c a
Based on this, the net carbon emissions effort index of marine aquaculture was constructed, as shown in Equation (13):
T = F C C f s t r = C c i n t C f s t r C f e f f C f s t r C c s t r C f s t r C f s c a C f s t r = T c i n t + T f e f f + T c s t r + T f s c a
In Equation (13),   T c i n t , T f e f f , T c s t r and T f s c a , respectively, represent the efforts of carbon emission intensity, aquaculture efficiency, aquaculture industry structure, and aquaculture scale effect on decoupling the net carbon emissions and the economic growth of marine aquaculture. T is the decoupling effort indicator. When T is less than or equal to 0, it indicates that these four factors do not contribute to the decoupling goal of economic growth and reduction of net carbon emissions but instead increase net carbon emissions and strive for no decoupling; when 0 is less than T and less than 1, it indicates that the carbon reduction efforts of these four factors are weaker than economic growth, and they are weak decoupling efforts. When T is greater than 1, it indicates that the carbon reduction efforts of these four factors are stronger than those of economic activities, and they are striving for strong decoupling.

3.2. Data Collection

The research object of this paper was nine provinces and autonomous regions in coastal areas. (Shanghai and Tianjin were excluded because their small scale of marine aquaculture, and the data in the statistical yearbook were mostly 0, therefore if compared with other provinces, there may have been large errors. In addition, owing to the availability and validity of data, Hong Kong, Macao and Taiwan were not included.) With reference to the Fourteenth Five-Year Plan for National Economic and Social Development of the People’s Republic of China and the Outline of Long-term Goals for 2035, nine coastal provinces and autonomous regions were divided into three marine economic zones, including the northern ocean economic zone (Liaoning, Shandong and Hebei), eastern ocean economic zone (Jiangsu and Zhejiang), and southern ocean economic zone (Fujian, Guangdong, Guangxi and Hainan).
This paper included the relevant data of marine aquaculture in nine coastal provinces from 2010 to 2019, all of which came from the China Fisheries Statistics Yearbook and China Fisheries Yearbook. In order to increase the comparability, the relevant economic data were converted into prices based on 2010.

4. Empirical Results and Analysis

4.1. Analysis of Decoupling Characteristics between Net Carbon Emissions and Economic Growth of Marine Aquaculture

4.1.1. Analysis of Overall Decoupling Characteristics

The Tapio decoupling index model was used to decouple the net carbon emissions and the economic growth of marine aquaculture in China, and the decoupling elasticity index of coastal areas from 2010 to 2019 was obtained, as shown in Figure 1.
As shown in Figure 1, on the whole, from 2010 to 2019, the net carbon emissions from marine aquaculture in China showed a decoupling state, with a changing trend of “weak decoupling–strong decoupling–recessive decoupling–strong decoupling–weak decoupling” with a small change range of the net carbon emissions and a large change range of the economic output value. At the beginning of the observation period, the net carbon emissions decreased while the economic growth of marine aquaculture increased, and the economic growth rate was faster. With the implementation of relevant measures to reduce emissions and increase the carbon sink in marine aquaculture, from 2012 to 2016, the net carbon emissions decreased, and the economic growth of marine aquaculture continued to grow. Its speed remained faster than that of net carbon emissions, which reached the ideal state of strong decoupling; however, from 2016 to 2017, both of them declined, with the net carbon emissions decreasing faster, and they reached the state of recessive decoupling. This may be due to the fact that, in 2015, the Central Committee of the Communist Party of China and the State Council issued the Overall Plan for the Reform of Ecological Civilization System, the marine carbon sink was brought to the national strategic level, and the new Environmental Protection Law was implemented. Various departments carried out in-depth special rectification work of marine aquaculture environments, which led to the negative impact on the development of the marine aquaculture economy, and the implementation of relevant policies and measures led to the decrease in net carbon emissions. Generally speaking, during the observation period, although the decoupling relationship between the net carbon emissions and economic development of marine aquaculture fluctuated slightly, it was in a relatively stable decoupling state in China.

4.1.2. Analysis of Decoupling Characteristics in Sub-Sea Area

We further analyzed the decoupling elasticity index of the net carbon emissions and economic growth of marine aquaculture in China’s three marine economic zones, and the specific results are shown in Table 4.
As shown in Table 4, in terms of sea areas, from 2010 to 2019, the decoupling relationship between the net carbon emissions and the economic growth of marine aquaculture in the northern ocean economic zone was relatively unstable and fluctuated greatly, showing a changing trend of “expanding negative decoupling–strong decoupling–recessive decoupling–weak negative decoupling–expanding negative decoupling”. After 2015, the decoupling state continued to deteriorate. Combined with the total effect of net carbon emissions mentioned above, this may be because the marine carbon sink was brought to the national strategic level in 2015 and the new Environmental Protection Law was implemented. Many illegal aquaculture seas were cleaned up and rectified, which led to changes in the aquaculture scale and structure that affected the economic growth of marine aquaculture and changes in carbon sequestration, which then led to the deterioration of the decoupling between them. The decoupling relationship between the net carbon emissions and the economic growth of marine aquaculture of the eastern ocean economic zone presented a changing process of “strong decoupling–recessive decoupling–strong decoupling–recessive connection” which indicated that the net carbon emissions of the eastern ocean economic zone were continuously decreasing but the economic growth of marine aquaculture was not stable. Combined with the influencing factors of the total effect of net carbon emissions, this may have been due to the unreasonable setting of the aquaculture scale and aquaculture structure in the eastern ocean economic zone after the implementation of the new Environmental Protection Law in 2015. There was a stable and strong decoupling between the net carbon emissions and the economic growth of marine aquaculture in the southern ocean economic zone, which indicated that the net carbon emissions of the southern ocean economic zone were decreasing continuously and the marine aquaculture economy was growing continuously, which was the ideal decoupling relationship between them. Generally speaking, during the observation period, the decoupling state between the net carbon emissions and the economic growth of marine aquaculture in the southern ocean economic zone was better than that in the eastern ocean economic zone, and the northern ocean economic zone was the worst. It is necessary to pay attention to the coordinated development of the economy and environmental protection, and to explore effective ways to reduce carbon emissions and increase the carbon sink.

4.1.3. Analysis of Decoupling Characteristics in Sub-Province

We further analyzed the decoupling elasticity index of the net carbon emissions and economic growth of marine aquaculture in nine coastal provinces, and the specific results are shown in Table 5.
In Table 5, it can be seen that in terms of province, Zhejiang, Fujian, Guangdong, and Guangxi decoupled net carbon emissions from the economic growth of marine aquaculture, which was basically consistent with the ranking of the total effect of net carbon emissions. This may have been due to the continuous reduction of net carbon emissions in these four provinces, while the changes in the aquaculture efficiency and scale that promoted the reduction of net carbon emissions also promoted the economic growth of marine aquaculture. The decoupling state in Liaoning changed greatly in the early stage of observation, alternating between the two decoupling states of “negative decoupling–decoupling” but gradually stabilized in the decoupling state after 2015. Therefore, Liaoning should focus on promoting the economic development of marine aquaculture while paying attention to carbon reduction and increasing the carbon sink. The decoupling state in Shandong gradually deteriorated, and it continued to show a negative decoupling state after 2015, therefore, Shandong should focus on environmental protection while ensuring economic growth and take corresponding measures to reduce net carbon emissions in a timely manner. The decoupling state between net carbon emissions and economic growth fluctuated greatly in Hebei, Hainan, and Jiangsu. Combined with the previous analysis of net carbon emissions and economic development, this may have been due to net carbon emissions remaining high and the economic growth fluctuating greatly. Therefore, all provinces should pay more attention to environmental protection while ensuring economic growth and promote the reduction of carbon and increase the carbon sink, so as to promote the efficient and low-carbon development of marine aquaculture.
In order to analyze the causes of the decoupling state differences between the net carbon emissions and economic growth of marine aquaculture in the nine provinces more intuitively, we analyzed them through a three-dimensional curve and contour map, as shown in Figure 2.
Figure 2a shows the three-dimensional graph of the decoupling states between the net carbon emissions and economic growth. It can be seen that the decoupling indices of the nine provinces were quite different, characterized by “low in the north and high in the south” that is, the decoupling indices of Liaoning, Hebei, and Shandong located in the northern ocean economic zone were far lower than those of the six provinces in the eastern and southern ocean economic zones. Combining Figure 2b,c to analyze the causes, it can be seen that for the northern ocean economic zone, the decoupling states between carbon emissions and economic growth, and between carbon sequestration and economic growth were relatively consistent with the decoupling state between the net carbon emissions and economic growth, which indicated that the high carbon emissions and insufficient carbon sequestration output were the reasons why the net carbon emissions and economic growth in the northern ocean economic zone could not be decoupled. For the eastern and southern ocean economic zones, the decoupling of carbon sequestration and economic growth was in good condition. Although it promoted the decoupling of the net carbon emissions and economic growth, it was difficult to offset the inhibition of carbon emissions (especially in Jiangsu and Hainan). Carbon emissions were the main reason for the decoupling in the eastern and southern ocean economic zones.

4.2. Decoupling Effort Index Analysis

4.2.1. Decomposition Analysis of Influencing Factors of Net Carbon Emissions from Marine Aquaculture

(1)
Decomposition analysis of factors influencing overall net carbon emissions.
According to the LMDI index decomposition model, the cumulative effect of net carbon emissions from the marine aquaculture in China was decomposed to analyze its influencing factors. The decomposition results are shown in Table 6.
It can be seen in Table 6 that, overall, during the observation year, the net carbon emissions from marine aquaculture in China showed a decreasing trend (as the net carbon emissions from marine aquaculture is a negative indicator, the lower the effect value, the better), with the obvious effects of reducing emissions and increasing the carbon sink, and the carbon emission intensity and aquaculture efficiency contributed the most to this trend. Except for a period from 2016 to 2017, the carbon emission intensity effect promoted an emissions reduction and carbon sink enhancement. In addition to 2012–2013, the aquaculture efficiency between observations contributed to reducing emissions and increasing the carbon sink. The role of economic structure effects in reducing emissions and increasing the carbon sink was characterized by stages, with net carbon emissions increasing from 2010 to 2014 and from 2017 to 2018, while from 2014 to 2017, it promoted an emissions reduction and carbon sink increase. The aquaculture scale effect benefited the reduction of net carbon emissions in the early stage of observation, but it increased the net carbon emissions in the later stage. The aquaculture structure effect had both positive and negative effects on the reduction of net carbon emissions. The above factors all contributed to the process of reducing emissions and increasing the carbon sink, and their direction and intensity of action showed a complex spatiotemporal heterogeneity.
(2)
Decomposition analysis of factors influencing the net carbon emissions in sub-sea area.
We further decomposed and analyzed the net carbon emissions of the three marine economic zones. The specific decomposition results are shown in Figure 3.
It can be seen in Figure 3 that, among the three marine economic zones, the total effect of the net carbon emissions from marine aquaculture in the northern ocean economic zone was weaker than that in the eastern and southern zones. The carbon emission intensity and aquaculture efficiency effects were important factors in promoting an emissions reduction and carbon sink increase in the three marine economic zones. The net carbon emissions of the northern ocean economic zone increased in 2010–2011 and 2018–2019, and the main factors restraining the reduction of net carbon emissions were economic structure, aquaculture structure, and aquaculture scale effect. In other observation years, the net carbon emissions decreased, mainly promoted by the carbon emission intensity effect and aquaculture efficiency effect. The net carbon emissions of the eastern and southern ocean economic zones in the observation years were both reduced, and both reductions were promoted by the effects of carbon emission intensity and aquaculture efficiency. The change in aquaculture scale promoted the reduction of net carbon emissions in the southern ocean economic zone, but inhibited it in the eastern ocean economic zone.
(3)
Decomposition analysis of factors influencing net carbon emissions in sub-province.
We further decomposed and analyzed the net carbon emissions of nine coastal provinces. The specific decomposition results are shown in Figure 4.
In Figure 4, it can be seen that, during 2010–2019, the changes in net carbon emissions from marine aquaculture in nine coastal provinces and autonomous regions were quite different, and the effects of the five factors were not quite the same. First, among the nine provinces and autonomous regions, Fujian and Guangxi had the best total net carbon emissions. In the observed years, the net carbon emissions were all in a decreasing state, and the carbon emission intensity, aquaculture efficiency, and aquaculture scale effects all played an extremely important role in promoting the reduction of net carbon emissions, but the economic structure and aquaculture structure effects promoted the increase in net carbon emissions instead. Second, Zhejiang and Liaoning had the best total net carbon emissions. Except for Zhejiang in 2010–2011 and Liaoning in 2010–2011 and 2012–2013, the net carbon emissions increased slightly in other years. In net carbon emissions reduction, both carbon emission intensity and aquaculture structure effect played a positive role in the two provinces, and the aquaculture efficiency effect in Zhejiang also played a positive role. Third, the total effect of net carbon emissions was relatively poor in Hebei, Shandong, and Guangdong, but most years also experienced a state of net carbon emissions reduction, and the increase in net carbon emissions in Hebei was mainly affected by aquaculture scale. At the same time, Shandong was mainly negatively affected by the economic structure and aquaculture structure effect, while Guangdong was mainly restrained by three factors: the economic structure, aquaculture scale, and aquaculture structure effect. Finally, the total effect of net carbon emissions was the worst in Hainan and Jiangsu. Although the total effect of net carbon emissions in these areas decreased in some years, the net carbon emissions increased in most observation years. The reason for this was that the increase in net carbon emissions in Hainan was inseparable from the five major factors, but the positive effects of aquaculture efficiency and economic structure on net carbon emissions reduction in 2017 and the carbon emission intensity and aquaculture scale effect in 2018 could not be ignored. Although the carbon emission intensity and scale effect of aquaculture in Jiangsu played a certain role in promoting the net carbon emissions reduction, it was difficult to offset the negative effects of economic structure, aquaculture efficiency and aquaculture structure effect.
To sum up, for the coastal areas of China, both the carbon emission intensity and the aquaculture efficiency effect played a positive role in the total net carbon emissions effect of marine aquaculture. In terms of sea areas, the carbon emission intensity and aquaculture efficiency effects played positive roles in the three marine economic zones, and the aquaculture scale effect in the southern ocean economic zone was also extremely obvious. Specific to the nine provinces, the carbon emission intensity effect promoted the total net carbon emissions effect of marine aquaculture. The aquaculture efficiency effect had a significant positive effect on the total net carbon emissions of seven provinces except for Liaoning and Jiangsu. The aquaculture scale effect promoted the total net carbon emissions effect of Fujian, Guangxi, Hainan, Jiangsu, and Shandong.

4.2.2. Analysis of Decoupling Effort Indicators

This section uses the decoupling effort index to analyze the efforts of the carbon emission intensity effect, aquaculture efficiency effect, aquaculture industrial structure effect, and aquaculture scale effect to decoupling the net carbon emissions and the economic growth of marine aquaculture. The results are shown in Table 7.
At the same time, according to the results in Table 7, Figure 5 more intuitively and comprehensively analyzes the efforts of the four factors to decouple the relationship between the net carbon emissions and economic growth of marine aquaculture.
(1)
Analysis of overall decoupling effort indicators.
In Table 7, it can be seen that, from 2010 to 2019, the four factors in China’s coastal areas made no efforts to decouple the relationship between net carbon emissions and economic growth. Combined with Figure 5, it can be seen that during 2010–2019, there was no effort to decoupling the relationship between the net carbon emissions and economic growth of marine aquaculture in the coastal areas of China. Although the carbon emission intensity and aquaculture scale effect made some decoupling efforts, they could not be offset by the inhibition of the aquaculture efficiency and aquaculture structure effect.
(2)
Analysis of decoupling effort indicators in the sub-sea area.
It can be seen in Table 7 that in terms of the sub-sea area, the northern ocean economic zone showed a weak decoupling effort, while the eastern and southern ocean economic zones showed strong decoupling efforts. Combined with Figure 5, it can be seen that there were differences in the decoupling efforts among the three marine economic zones. The decoupling efforts in the northern ocean economic zone were weak, and the decoupling efforts made by the carbon emission intensity effect contributed the most, followed by the aquaculture scale effect, while the aquaculture structure effect played an obstacle role. The east ocean economic zone made a strong decoupling effort, and the carbon emission intensity effect made the biggest contribution to the decoupling effort, followed by aquaculture efficiency and the aquaculture structure effect. The southern ocean economic zone made a strong decoupling effort, and the aquaculture scale effect contributed most to the decoupling effort, followed by the carbon emission intensity and the aquaculture structure effect.
(3)
Analysis of decoupling effort indicators in sub-province.
In Table 7, the province of Fujian, Guangxi, Hainan, Guangdong, and Liaoning made strong efforts for the decoupling of net carbon emissions and economic growth, with the effort indexes of 15.10, 3.18, 2.26, 1.95, and 1.18, respectively. Jiangsu made weak decoupling efforts for the decoupling of net carbon emissions and economic growth, with an effort index of 0.11; Hebei, Shandong, and Zhejiang showed no decoupling efforts.

4.3. Further Analysis

In order to deeply analyze the factors influencing the efforts to decouple the carbon emissions and economic growth of marine aquaculture in China, this section analyzes the redundant efficiency of the marine aquaculture area, labor force, economic output value, carbon sequestration, and pollutant emissions from 2010 to 2019, and the results are shown in Table 8.
In Table 8, it can be seen that the redundant efficiencies of the aquaculture area, labor force and CO 2 pollutant emissions were the main factors affecting the comprehensive efficiency, which was consistent with the previous analysis. Therefore, most provinces in the coastal areas should adapt to local conditions, develop marine aquaculture, and make timely allocation adjustments to different culture methods, such as ponds and factories, and to different culture areas, such as fish, shrimp, shellfish, and algae, to reduce direct and indirect emissions. At the same time, they should rationally allocate aquaculture personnel to improve labor efficiency. For Liaoning and Hainan, in addition to attending to the rational distribution of aquaculture area and labor force, adjusting the scale of different aquaculture methods and species, and improving the farming efficiency, they should also adjust the quantity and quality of shellfish species that produce a carbon sink in a timely manner and pay attention to the production efficiency of carbon sequestration.

5. Conclusions and Discussion
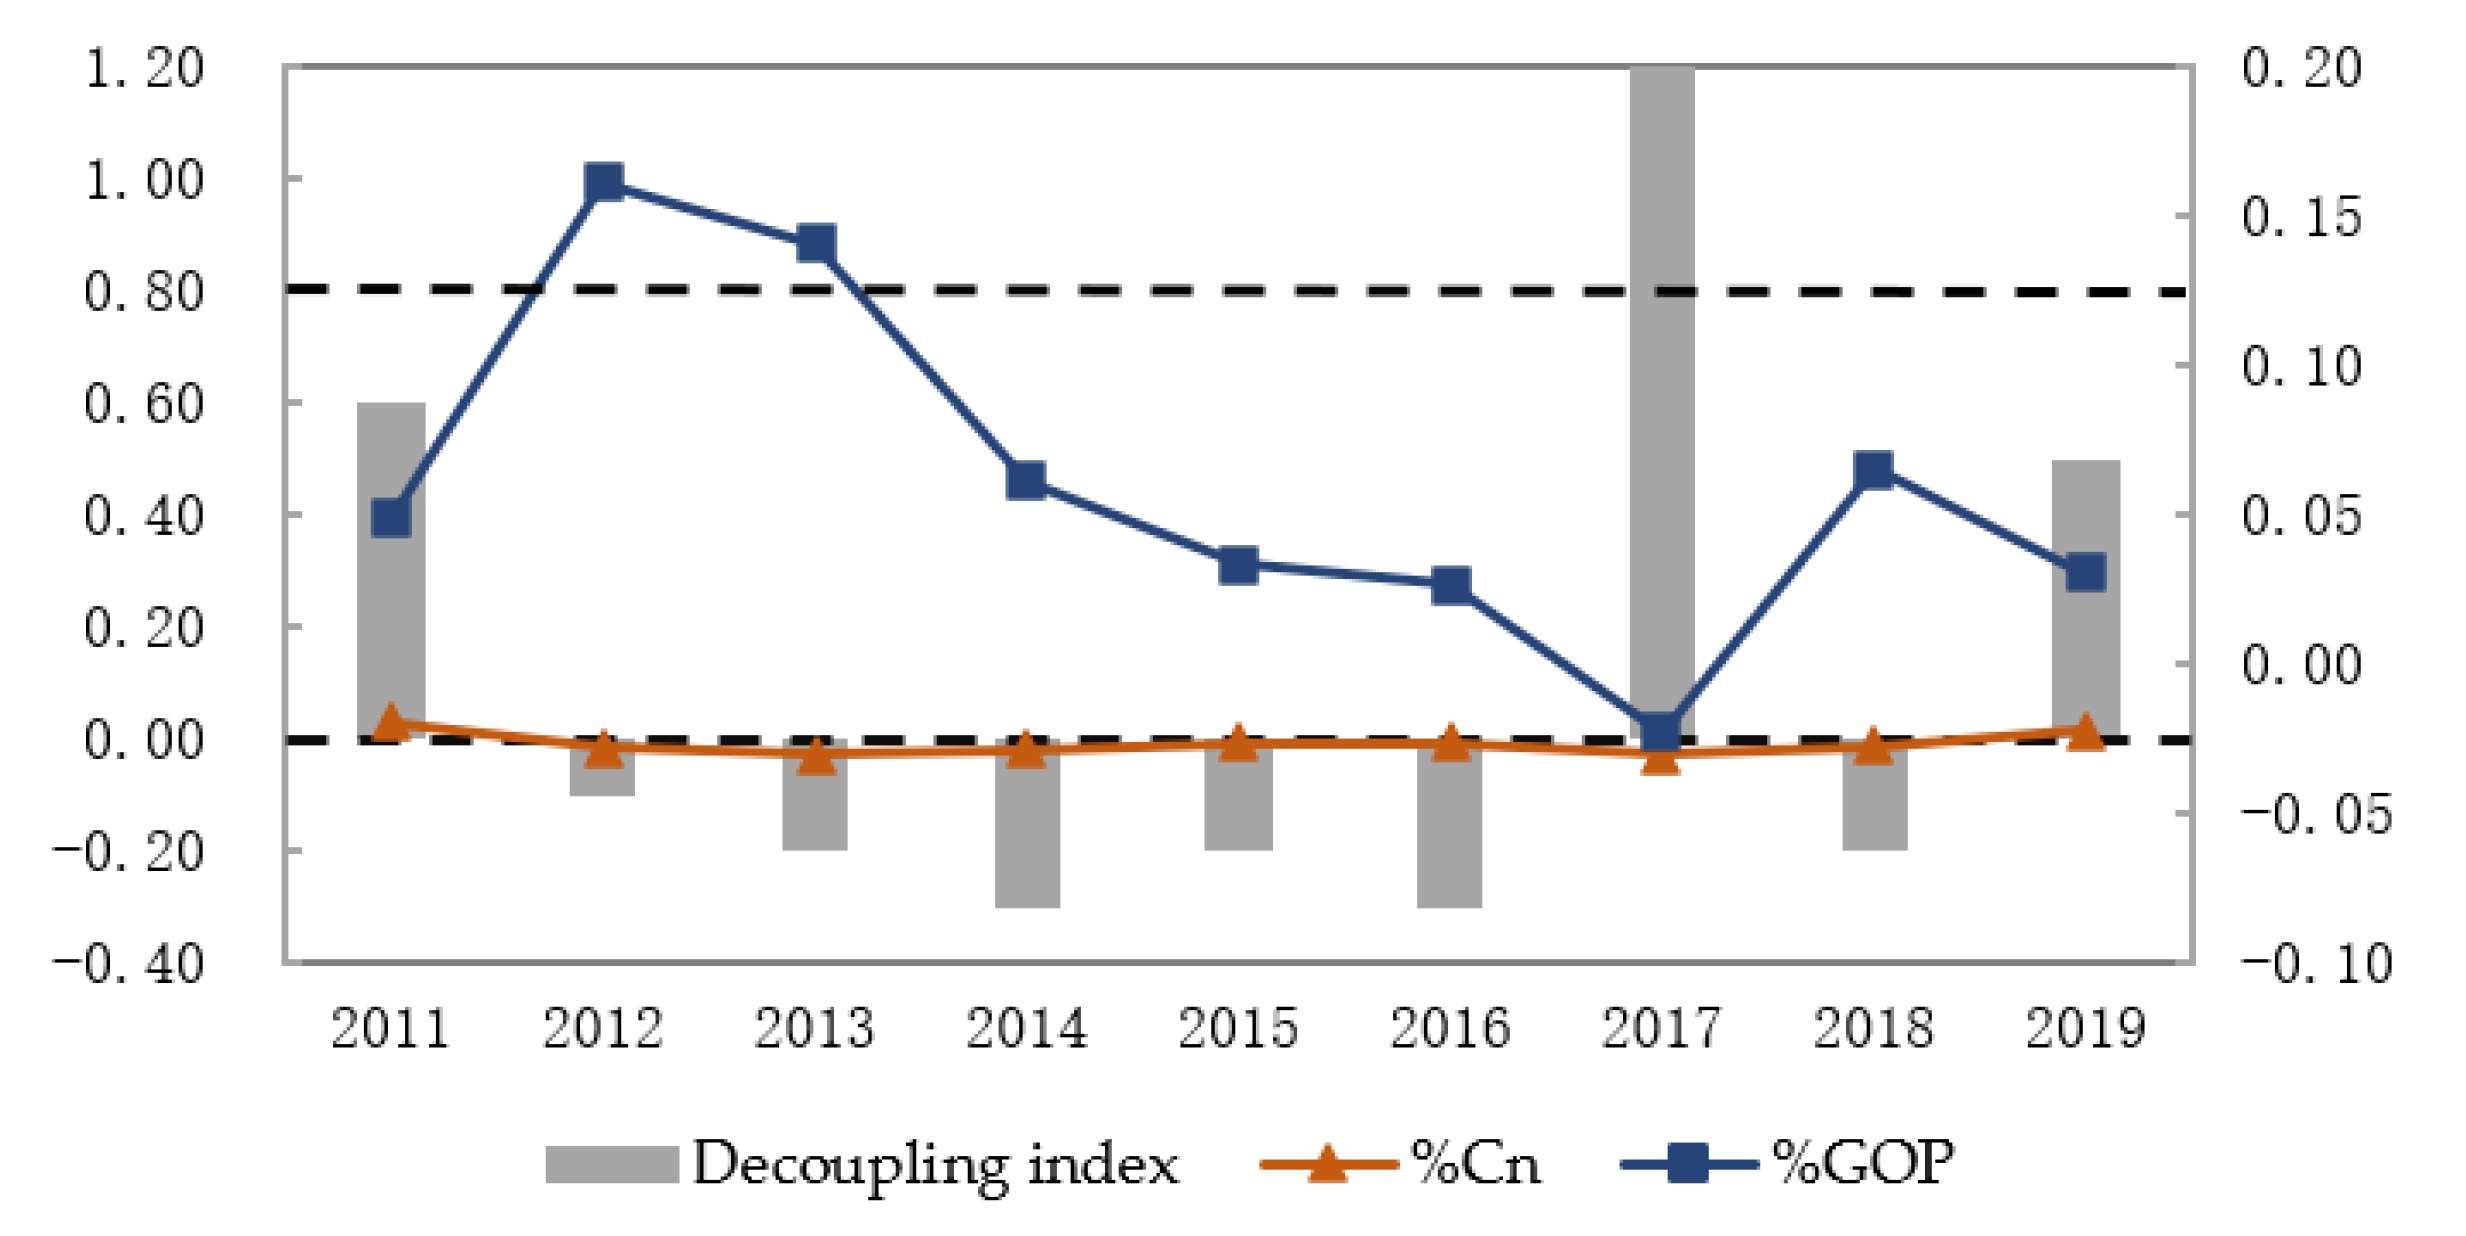
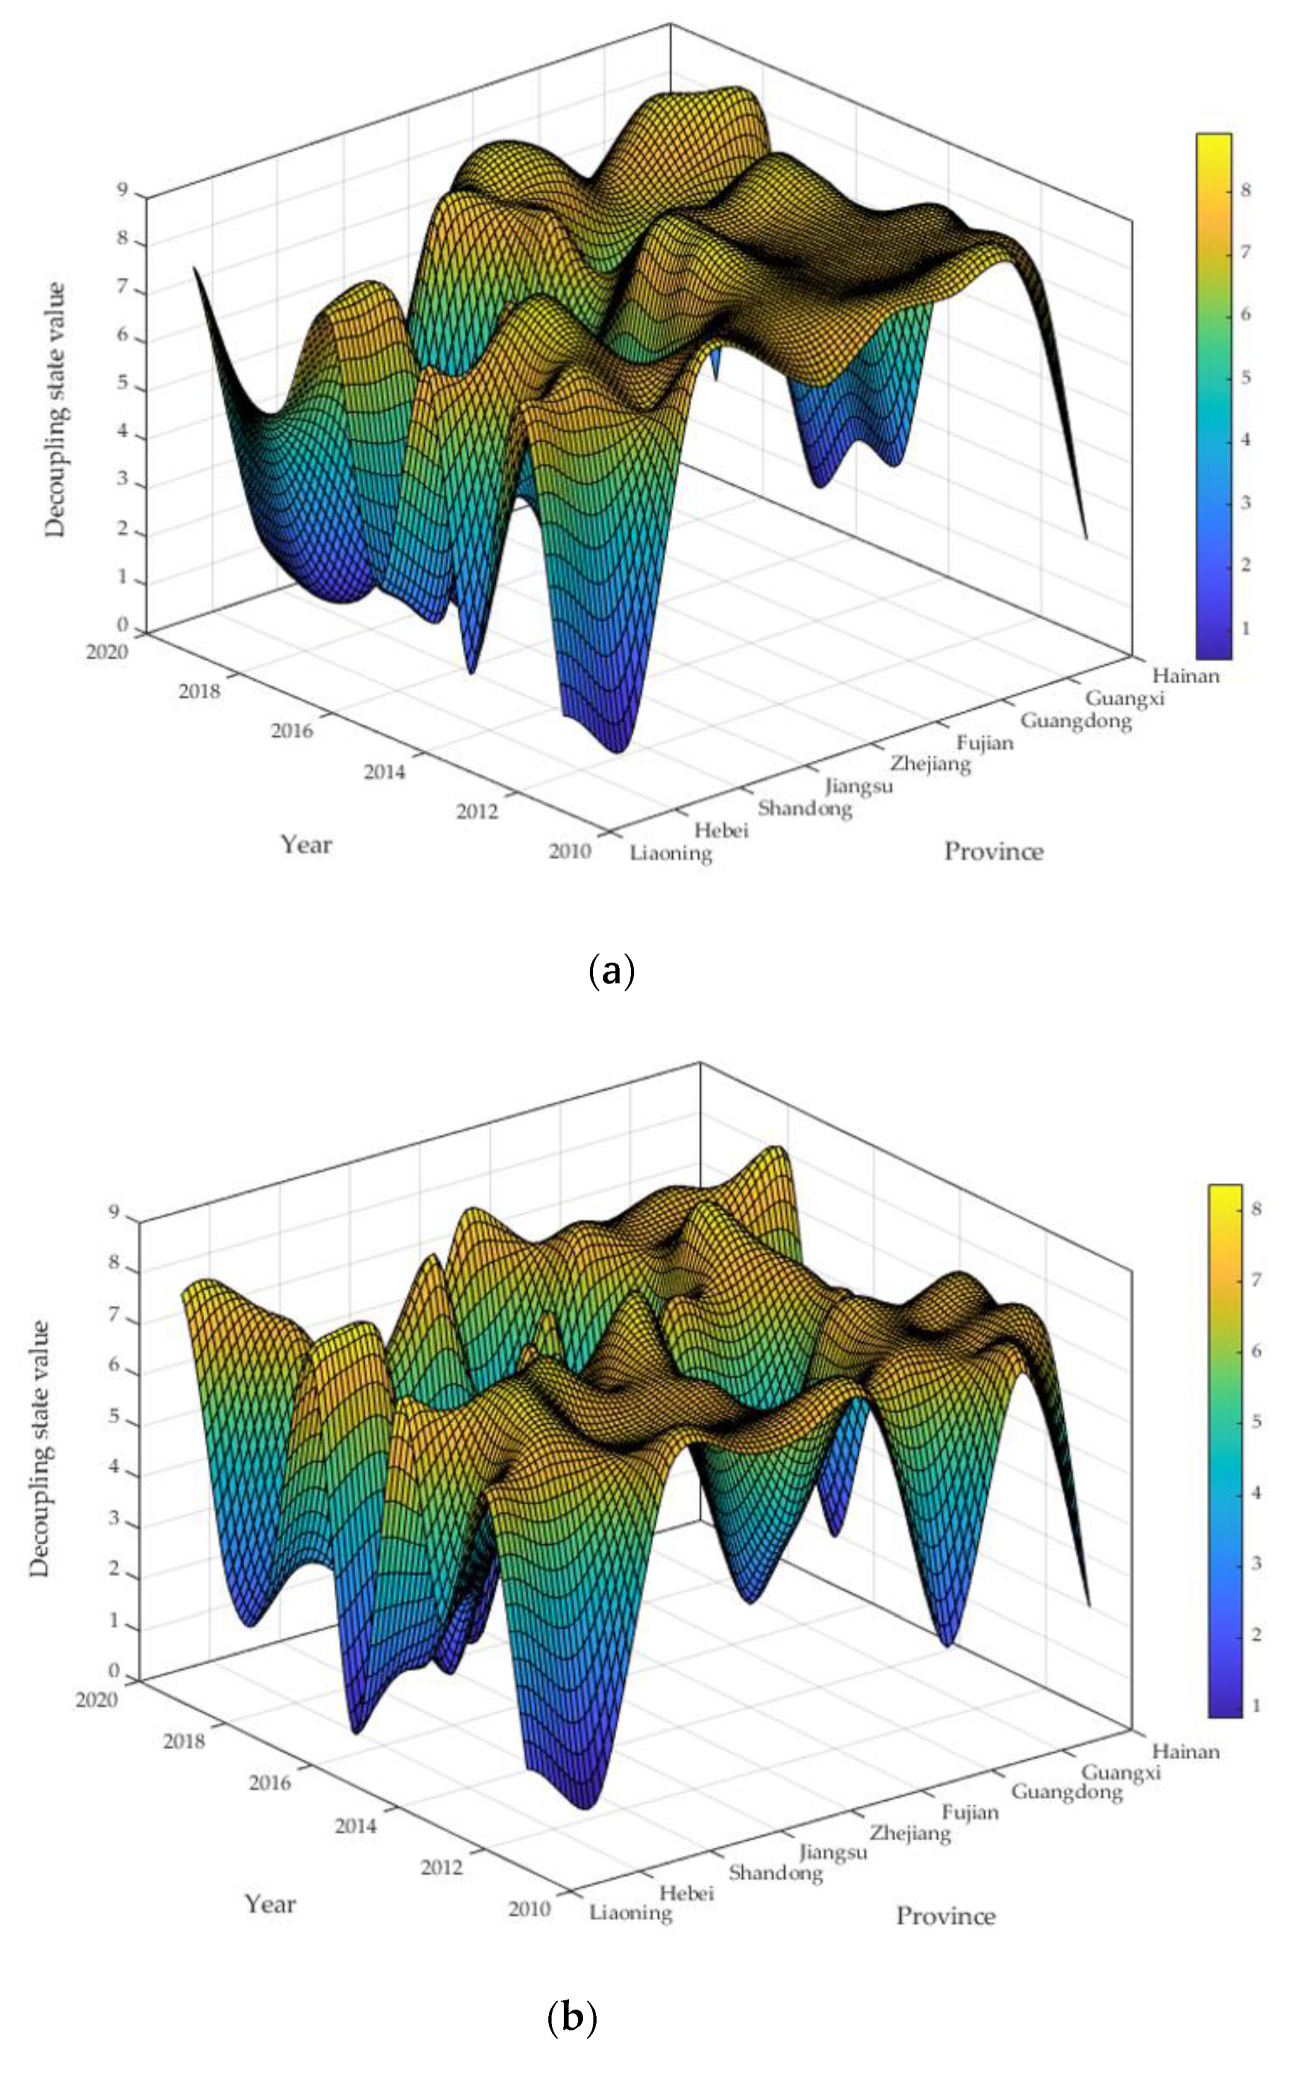
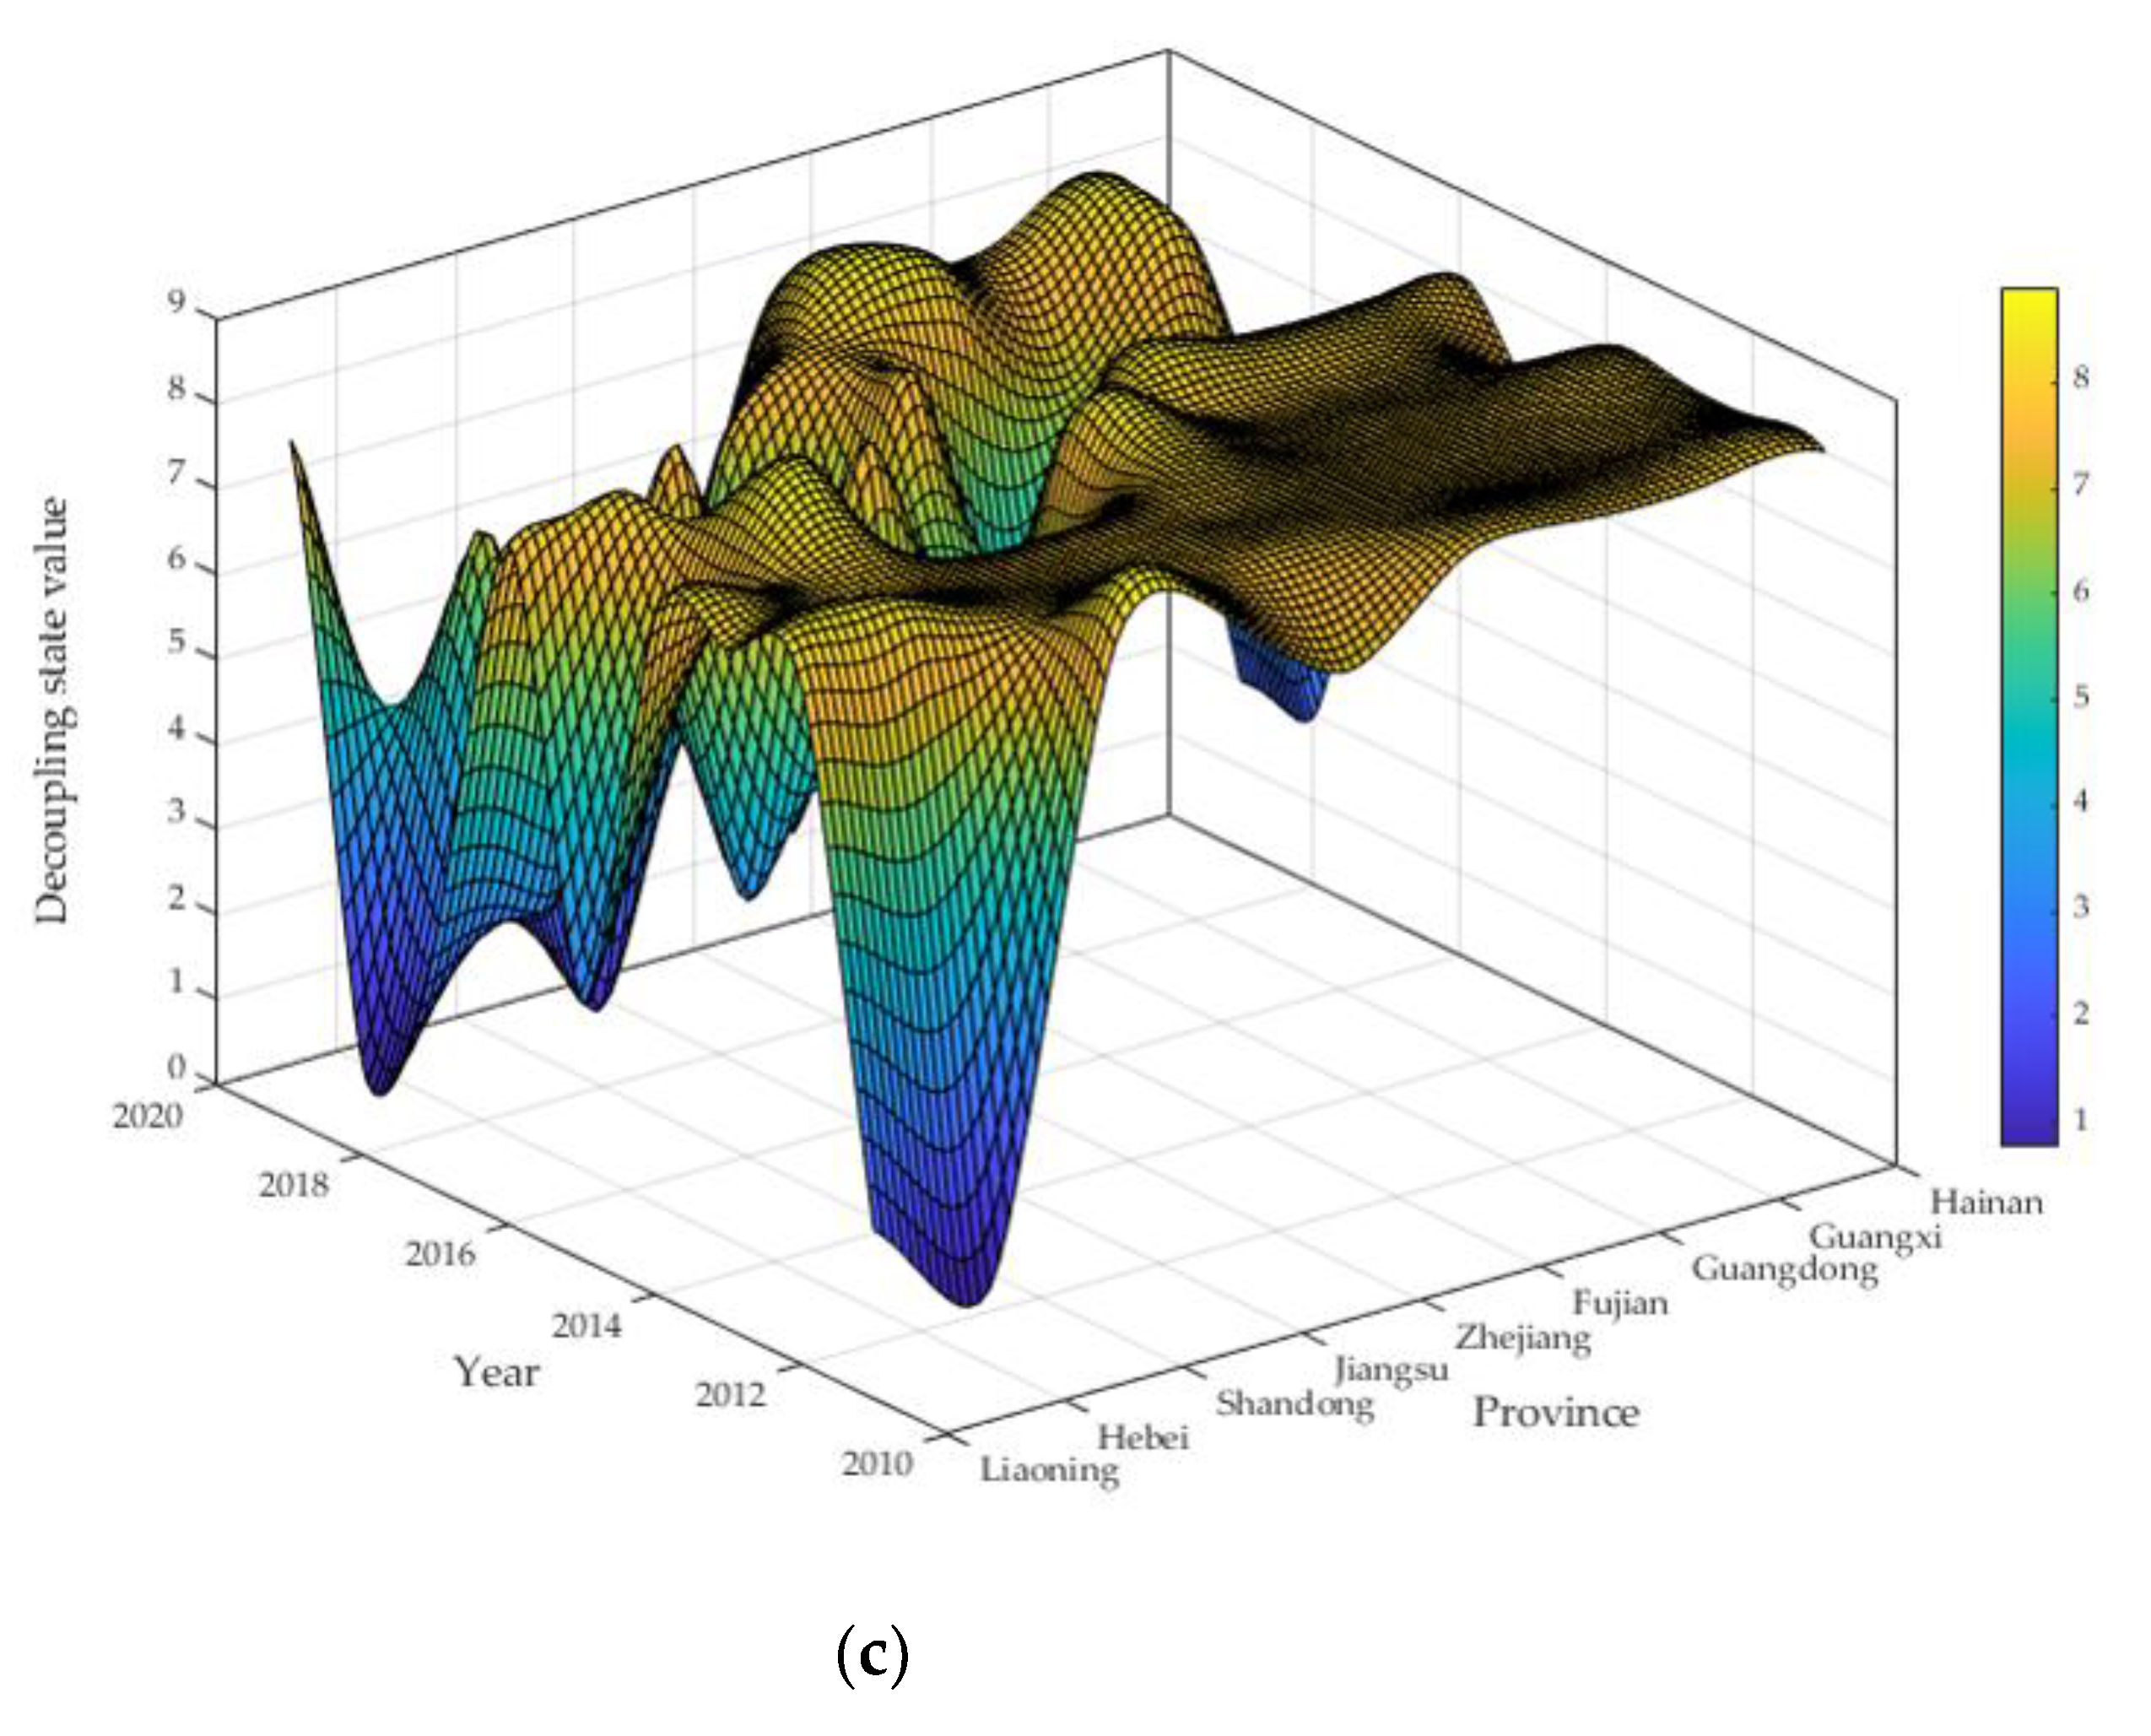
This paper studied the decoupling characteristics of net carbon emissions and economic growth. It estimated the decoupling effort degree in terms of various sea areas, provinces, and factors by using the LMDI index decomposition model and decoupling effort index model. It also explored the causes of the differences through a redundancy efficiency analysis. The results are as follows.
(1)
The relationship between the net carbon emissions and the economic growth of marine aquaculture generally shows a decoupling state (from Figure 1), but the decoupling relationships in different regions are different, which is similar to the findings of Kong (2021) [40]. In terms of sea areas, the southern ocean economic zone has the most ideal decoupling state, the trend of eastern ocean economic zone is “decoupling–coupling” while the northern ocean economic zone has the trend of “negative decoupling–decoupling–negative decoupling” (from Table 4). In terms of province, Zhejiang, Fujian, Guangdong, and Guangxi are in good decoupling states, while the decoupling status of Shandong continues to deteriorate (combined with Table 5 and Figure 2).
(2)
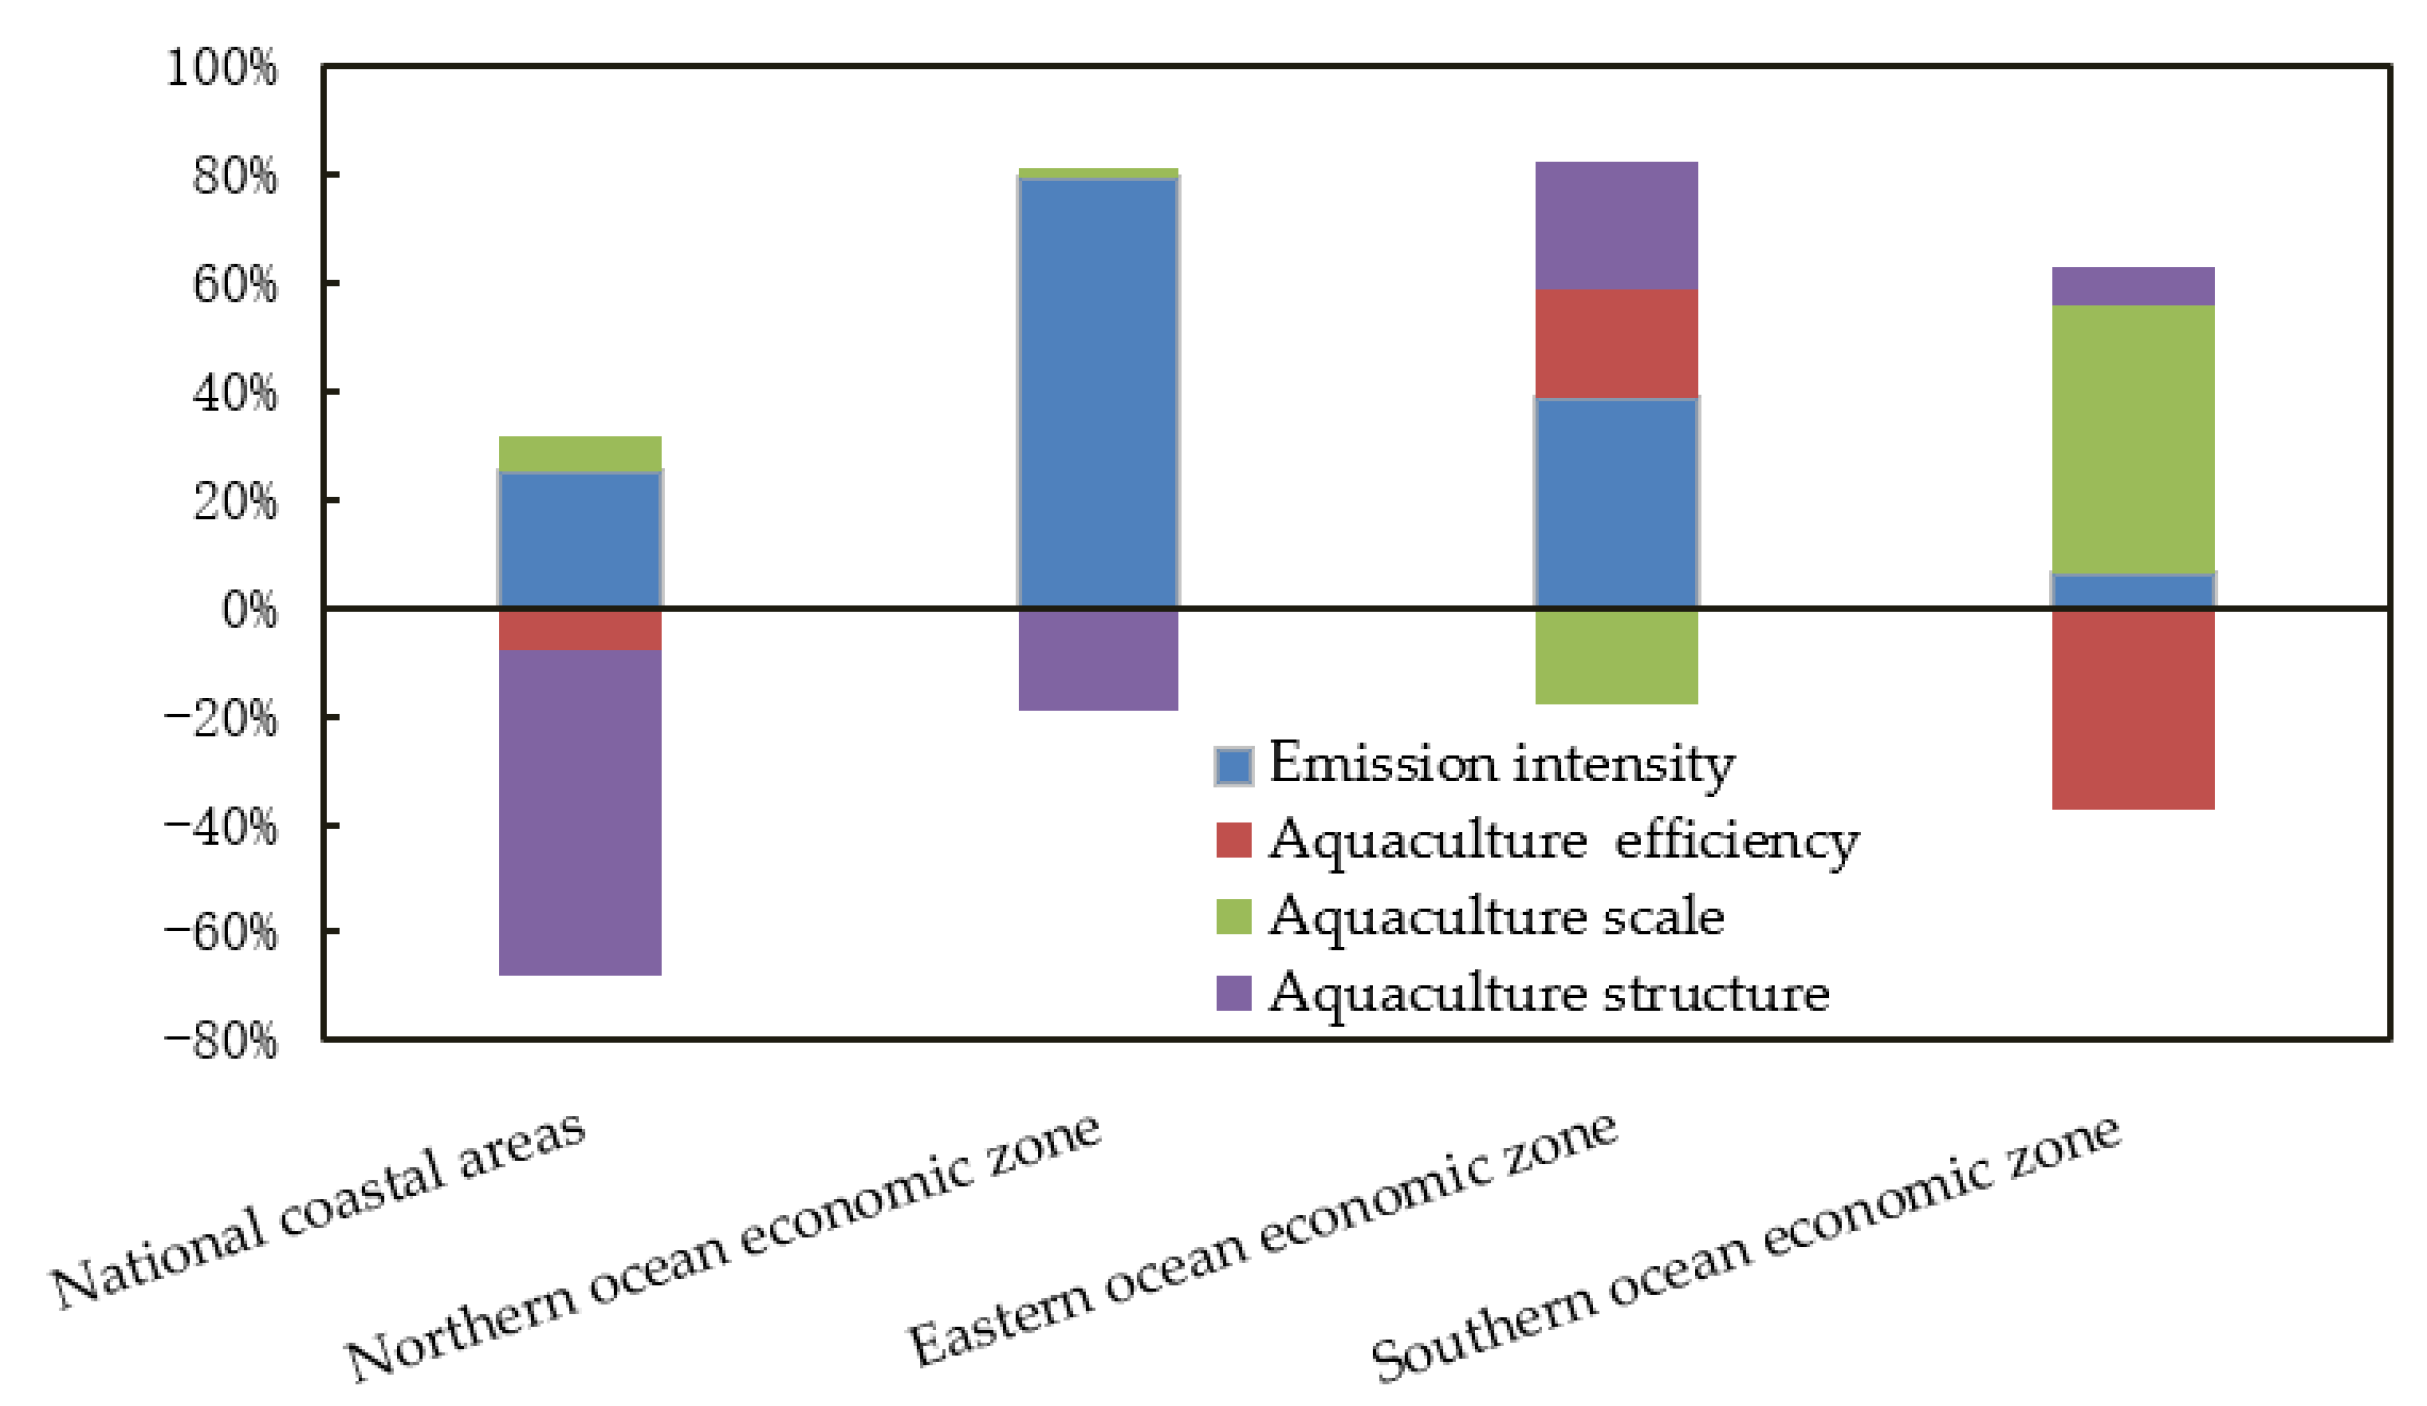
There is a big difference in the total net carbon emissions effects of marine aquaculture in China (from Table 6). In terms of sea areas, the total net carbon emissions effect of the northern ocean economic zone is weaker than those of the eastern and southern ocean economic zones (from Figure 3). In terms of province, Fujian and Guangxi have the best total net carbon emissions effects, while Hainan and Jiangsu have the worst total effects (from Figure 4).
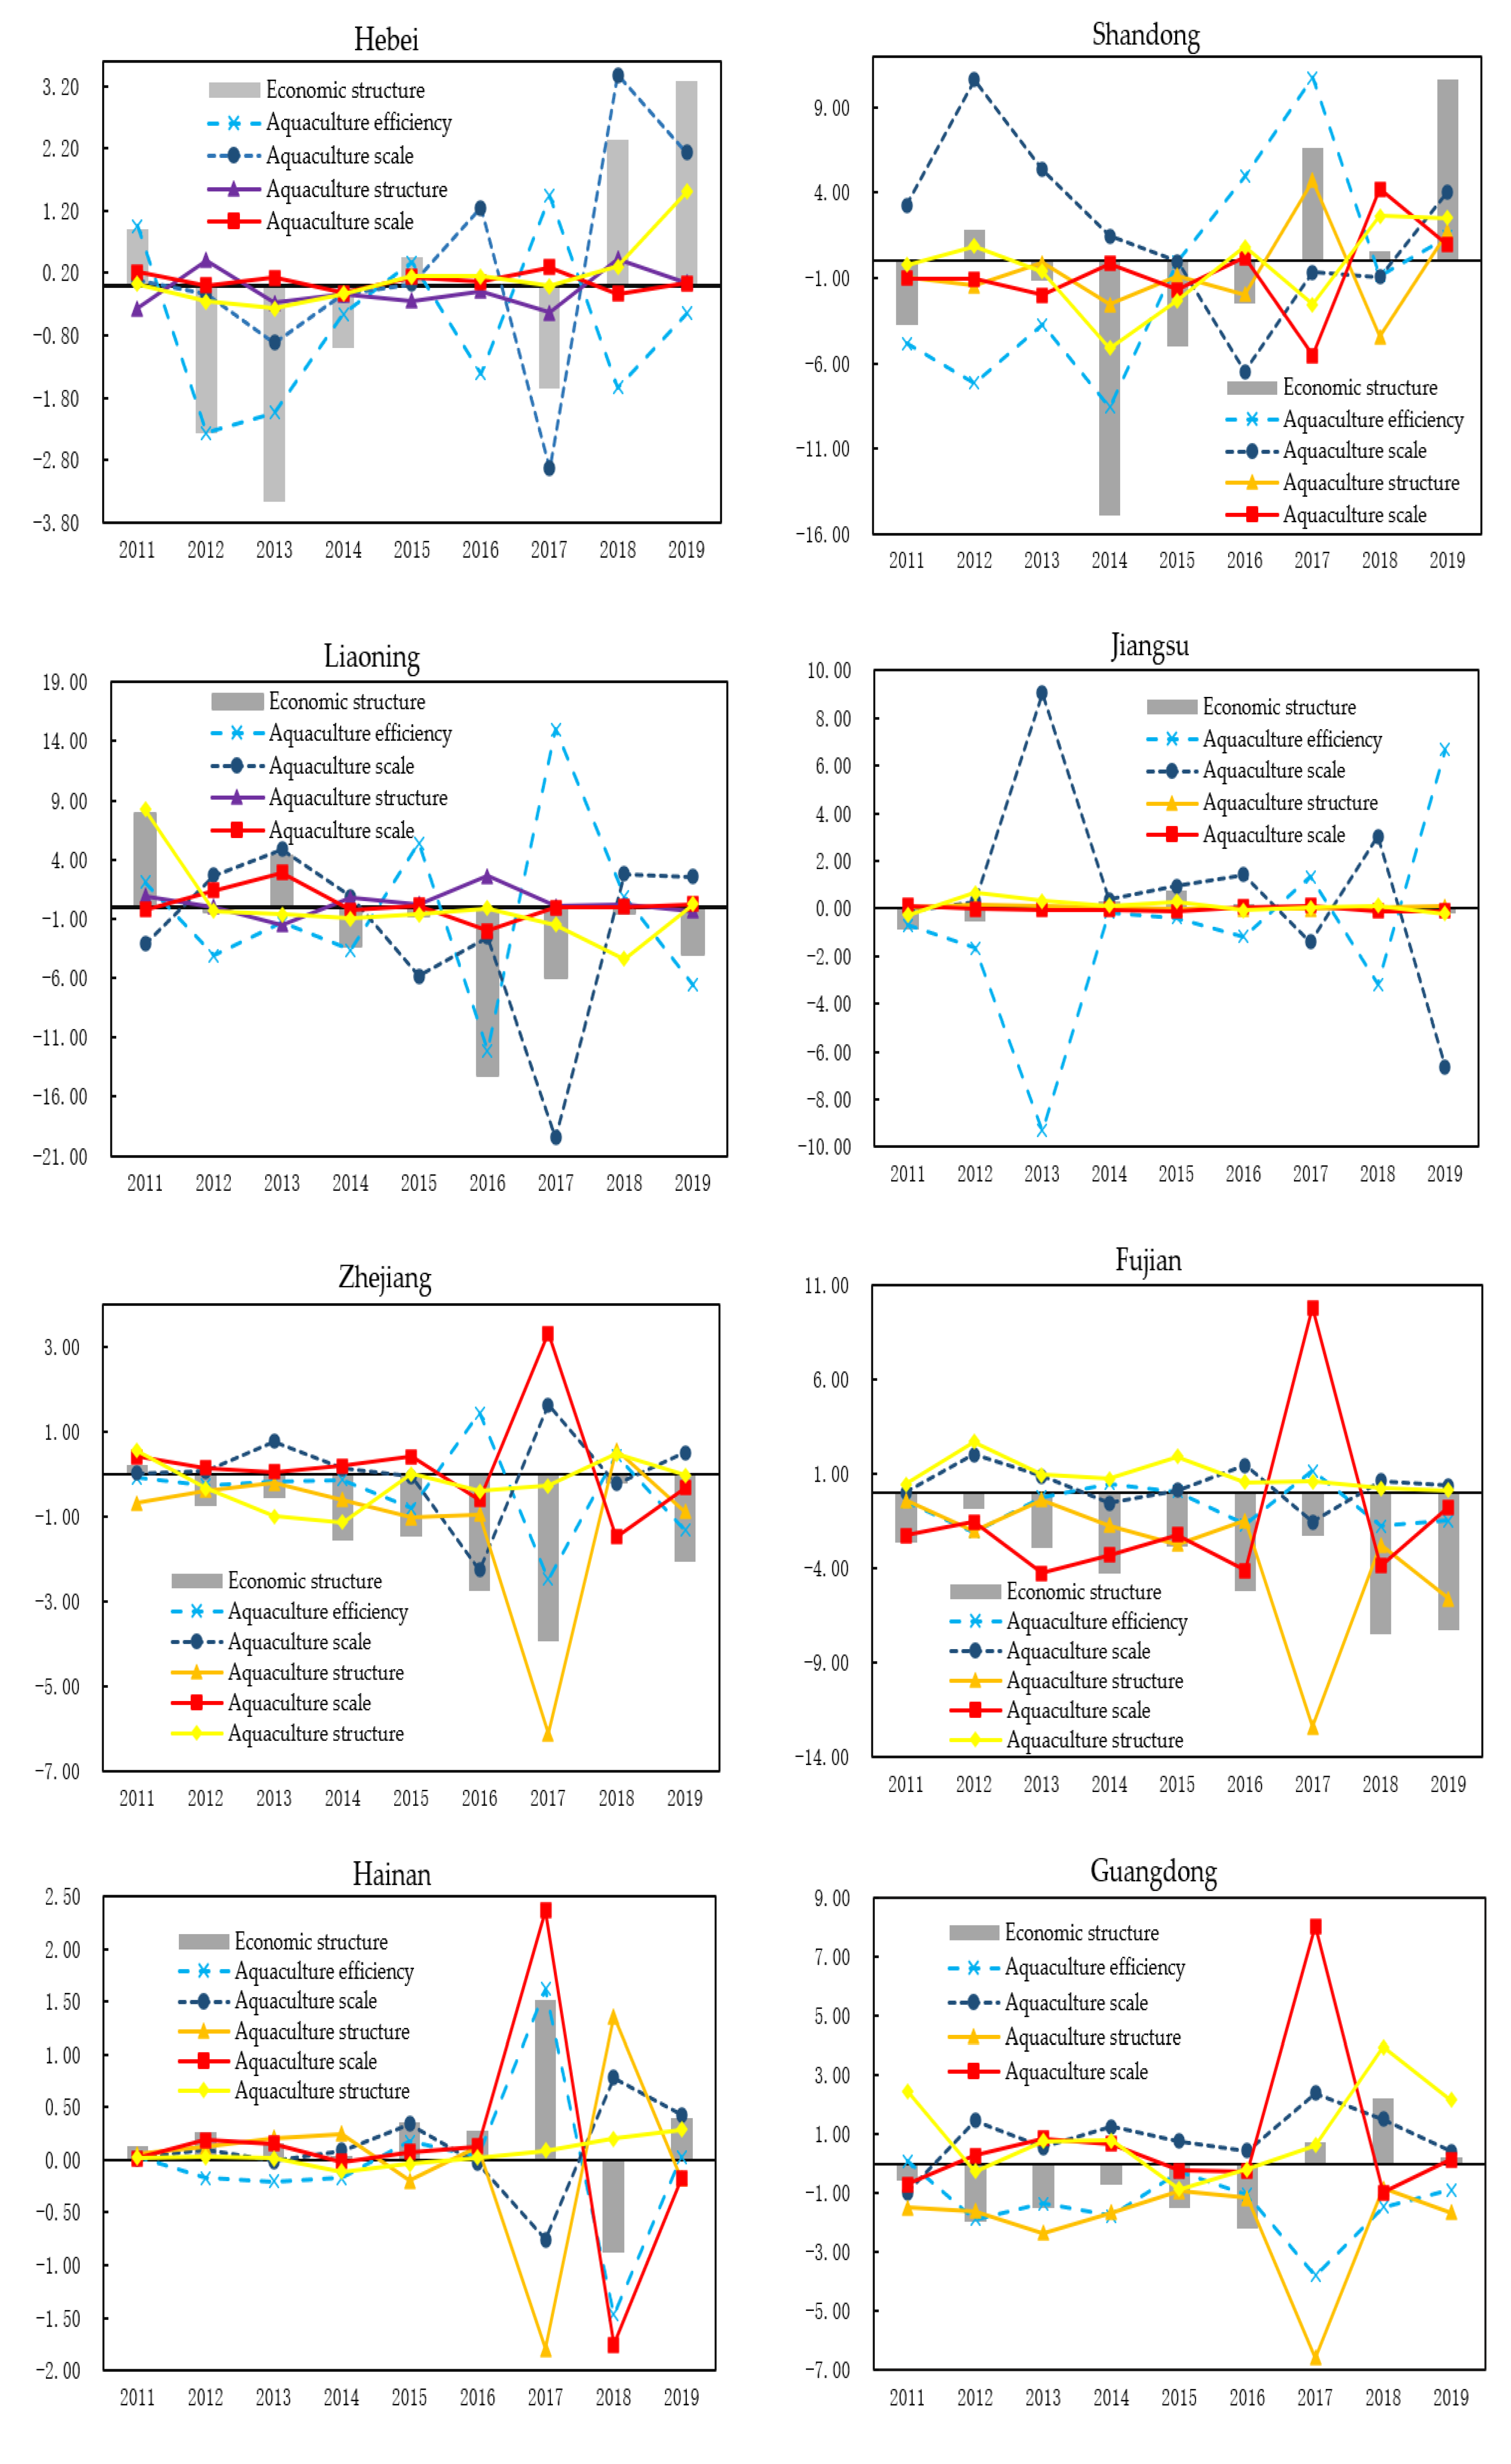
(3)
Based on the factors driving the net carbon emissions of marine and aquaculture, carbon emission intensity is the most important driving factor, which is very similar to the results of Wang and Wang [20]. Specific to the coastal areas of China, carbon emission intensity and aquaculture efficiency are the most important factors (from Table 6). In terms of sea areas, the carbon emission intensity and aquaculture efficiency effect are the main factors, and the aquaculture scale effect is also obvious in promoting the southern ocean economic zone (from Figure 3). In terms of provinces, carbon emission intensity, aquaculture efficiency, and aquaculture scale effect are the three most important driving factors. The carbon emission intensity effect makes the most significant contribution to the total net carbon emissions effect, and the aquaculture efficiency effect is better than the aquaculture scale effect (from Figure 4).
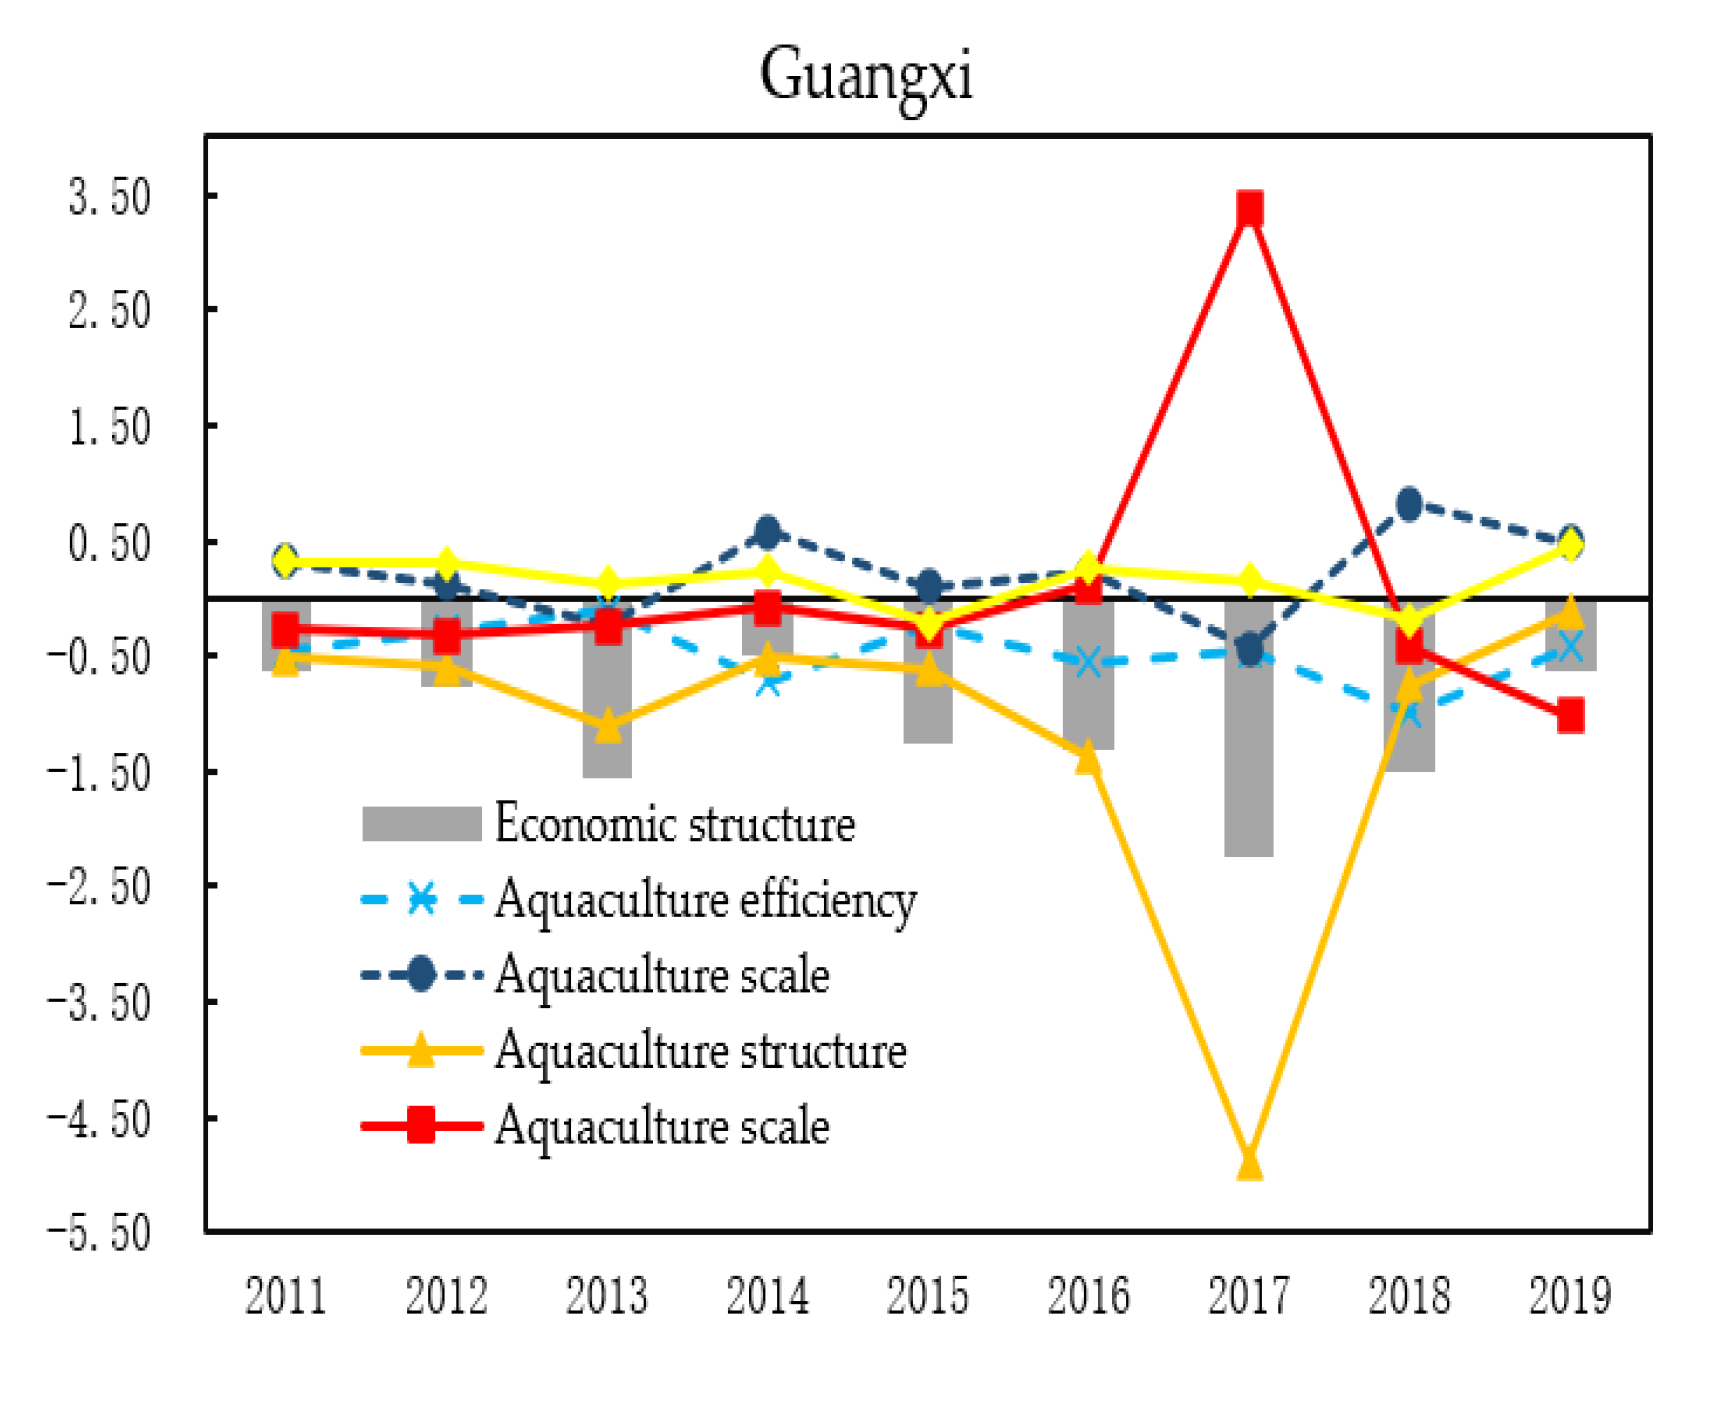
(4)
As for the degree of efforts to decouple the net carbon emissions from the economic growth of marine aquaculture, in terms of sea areas, the eastern and southern ocean economic zones make strong decoupling efforts, while the northern ocean economic zone makes weak decoupling efforts. In terms of province, Fujian (15.10), Guangxi (3.18), Hainan (2.26), Guangdong (1.95), and Liaoning (1.18) make strong decoupling efforts, while Shandong (−6.10), Hebei (−5.35), and Zhejiang (−0.17) make the weakest decoupling efforts. From the decoupling effort index of the net carbon emissions and economic growth of marine aquaculture, the order of efforts of various factors in different sea areas is carbon emission intensity > aquaculture scale > aquaculture structure > aquaculture efficiency (from Figure 5).
Based on the above conclusions, specific strategies are proposed for the high quality of marine aquaculture.
(1)
Strengthen regional cooperation and explore diversified ways to reduce emissions and increase the carbon sink. Because of the spatial correlation between regions, regional synergy should be included to promote an emissions reduction and carbon sink increase in marine aquaculture through diversified means. On the one hand, we should acknowledge the active and leading role of the government and other administrative departments in the formulation of relevant policies and regulations [41]. On the other hand, we can improve the pilot and market-oriented mechanism of carbon exchange trading in the fishery culture and encourage the development of carbon sink enhancement projects to promote the healthy development of the blue carbon industry.
(2)
Build a modern three-dimensional aquaculture system and adjust the scale of marine aquaculture according to local conditions. Based on the decoupling contribution degrees of various factors, the aquaculture scale plays an extremely important role. A reasonable aquaculture scale will promote the decoupling of net carbon emissions and economic growth (such as the southern ocean economic zone). China is rich in marine space resources, but there are still many shallow beaches that have not been used [21]. Owing to the heterogeneity of geographical locations and marine resources in various provinces, we should combine the local marine ecological–economic–social status, make full use of the advantages and advanced technologies, form the scale advantage of marine aquaculture with regional characteristics by establishing a modern three-dimensional aquaculture system, and maximize the economic benefits of marine aquaculture.
(3)
Vigorously develop green ecological aquaculture and continuously optimize the aquaculture structure. Judging by the contribution degrees of the decoupling efforts in sea areas, the contribution degree of aquaculture structure is insufficient or even reversed (such as the northern ocean economic zone), which may be related to the lack of diversity in marine aquaculture species and the low technical content of aquaculture methods in China [42]. Therefore, we should focus on new models and the extension of deep-sea pastures, increasing the proportion of green ecological aquaculture industries such as leisure fisheries, and continuously optimizing the marine aquaculture structure to promote marine aquaculture, so as to release more blue carbon space while reducing carbon.
(4)
Build a modern marine aquaculture economic system and improve aquaculture efficiency. According to the redundancy efficiency analysis results of various factors, the redundant efficiency of the aquaculture area and labor force are the most important factors affecting comprehensive efficiency, and the rational use of resource endowment is the key to improving the efficiency of marine aquaculture. Therefore, we should improve the efficiency and carbon sink function of marine aquaculture by building an intelligent marine resource management system and promoting multi-level integrated aquaculture, so as to lay the foundation for the sustainable development of marine aquaculture with high quality, high efficiency, and low carbon.
Because of the differences in economic development, technical means, and aquaculture varieties in different regions, the carbon sink coefficient of marine aquaculture may not be the same. A more accurate carbon sink coefficient estimate method based on the formation mechanism will be developed in the future. With the development of marine pastures, more typical marine pastures would be considered to study the green aquaculture model and its environmental and economic effects. These studies will be explored to improve the aquaculture efficiency.

Author Contributions

Conceptualization and methodology, H.G.; original draft preparation, Z.S.; data curation and display design, J.W. All authors have read and agreed to the published version of the manuscript.

Funding

This research was funded by “the Major Special Projects of National Social Science Fund”, China (Grant No. 19ZDA080).

Institutional Review Board Statement

Not applicable.

Informed Consent Statement

Not applicable.

Data Availability Statement

Not applicable.

Conflicts of Interest

The authors declare no conflict of interest.

References

  1. Liu, P.; Sun, P.; Song, H.J.; Wang, Z.X.; Li, R.X. Temporal and spatial variation characteristics of phytoplankton community in different aquaculture areas of Sanggou Bay. Prog. Mar. Sci. 2019, 37, 673–680. [Google Scholar]
  2. Hamdiyah, S.; Supriatna, J.; Prihanto, Y.; Adi, N.S.; Pranowo, W.S. Social and economic influences on CO2 emission from capture fisheries in West Java Province. IOP Conference Series: Earth and Environmental Science. IOP Publ. 2020, 530, 012026. [Google Scholar]
  3. Zhang, F.; Chen, Y.; Chen, Q.; Feng, Y.; Shang, Y.; Yang, X.; Gao, H.; Tian, C.; Li, J.; Zhang, G.; et al. Real-World Emission Factors of Gaseous and Particulate Pollutants from Marine Fishing Boats and Their Total Emissions in China. Environ. Sci. Technol. 2018, 52, 4910–4919. [Google Scholar] [CrossRef]
  4. Yang, H. Resource advantages of Yueqing Bay in Zhejiang Province and the treatment of contradictions in its development. Ocean Bull. 2003, 6, 49–55. [Google Scholar]
  5. Macusi, E.; Estor, D.E.; Borazon, E.; Santos, M. Environmental and Socioeconomic Impacts of Shrimp Farming in the Philippines: A Critical Analysis Using PRISMA. Sustainability 2022, 14, 2977. [Google Scholar] [CrossRef]
  6. Ouyang, X.G.; Lee, S.; Wang, W.Q. The ‘Perfect’ Conversion: Dramatic Increase in CO2 Efflux from Shellfish Ponds and Mangrove Conversion in China. Sustainability 2021, 13, 13163. [Google Scholar] [CrossRef]
  7. Li, X.; Li, Z.; Su, C.W.; Umar, M.; Shao, X.F. Exploring the asymmetric impact of economic policy uncertainty on China’s carbon emissions trading market price: Do different types of uncertainty matter? Technol. Forecast. Soc. Chang. 2022, 178, 121601. [Google Scholar] [CrossRef]
  8. Wang, Y.Y.; Guo, T.T.; Cheng, T.C.E.; Wang, N. Evolution of blue carbon trading of China’s marine ranching under the blue carbon special subsidy mechanism. Ocean Coast. Manag. 2022, 222, 106123. [Google Scholar] [CrossRef]
  9. Liu, K.; Bian, Y.; Wang, Y.Y.; Liu, G.C.; Zhang, Y.G. Study on marine carbon sequestration accounting and influencing factors of carbon emission in island areas—A case study of Changhai County, Liaoning Province. Resour. Dev. Mark. 2019, 35, 632–637. [Google Scholar]
  10. Zhang, Y.N. Impact of optimization of marine fishery industrial structure on carbon emission efficiency—Based on spatial econometric analysis of China’s coastal areas. Ocean Dev. Manag. 2021, 38, 3–15. [Google Scholar]
  11. Zhang, Y.; Ji, J.Y. Coupling relationship and driving factor decomposition of mariculture eco-economic system in China. Agric. Technol. Econ. 2020, 4, 94–106. [Google Scholar]
  12. Shao, G.L.; Liu, B.; Li, C. Assessment of carbon sink capacity of mariculture in China’s main sea areas and its impact effect—Based on the panel data of 9 coastal provinces in China. J. Ecol. 2019, 39, 2614–2625. [Google Scholar]
  13. Han, L.M.; Ren, G.Y.; Qin, H. The basic connotation and particularity of “three fisheries”. Agric. Econ. Issues 2007, 122, 93–96. [Google Scholar]
  14. Chen, J.; Wang, Y.; Song, M.; Zhao, R. Analyzing the decoupling relationship between marine economic growth and marine pollution in China. Ocean Eng. 2017, 137, 1–12. [Google Scholar] [CrossRef]
  15. Peng, D.; Yang, Q.; Yang, H.J.; Liu, H.; Zhu, Y.; Mu, Y. Analysis on the relationship between fisheries economic growth and marine environmental pollution in China’s coastal regions. Sci. Total Environ. 2020, 713, 136641. [Google Scholar] [CrossRef]
  16. Yue, D.D.; Wang, L.M. Research on the development path and stage division of low-carbon fisheries in China. J. Ocean Univ. China 2012, 9, 15–21. [Google Scholar]
  17. Li, C.; Li, H.Y.; Kong, H.Z.; Feng, W. Structural characteristics of implied carbon emissions in Chinese fishery production system and decomposition of driving factors. Resour. Sci. 2021, 43, 1166–1177. [Google Scholar]
  18. Zhang, J.W.; Dai, Y.; Su, C.W.; Kirikkaleli, D.; Umar, M. Intertemporal change in the effect of economic growth on carbon emission in China. Energy Environ. 2021, 32, 1207–1225. [Google Scholar] [CrossRef]
  19. Li, C.; Chi, P.; Shao, G.L. Research on the Response Relationship between China’s Offshore Fisheries Carbon emissions and Industry Economic Growth—An Empirical Analysis Based on Decoupling Theory and LMDI Decomposition. Sci. Technol. Manag. Res. 2016, 36, 233–237. [Google Scholar]
  20. Wang, Q.; Wang, S.S. Carbon emission and economic output of China’s marine fishery—A decoupling efforts analysis. Mar. Policy 2022, 135, 104831. [Google Scholar] [CrossRef]
  21. Zhang, J.H.; Liu, J.H.; Zhang, Y.Y.; Li, G. Ways to practice “negative marine emissions” in mariculture. J. Chin. Acad. Sci. 2021, 36, 252–258. [Google Scholar]
  22. Driscoll, J.; Tyedmers, P. Fuel use and greenhouse gas emission implications of fisheries management: The case of the new England Atlantic herring fishery. Mar. Policy 2010, 34, 353–359. [Google Scholar] [CrossRef]
  23. Machado, F.; Halmenschlager, V.; Abdallah, P.R.; Teixeira, G.; Sumaila, U.R. The relation between fishing subsidies and CO2 emissions in the fisheries sector. Ecol. Econ. 2021, 185, 107057. [Google Scholar] [CrossRef]
  24. Zhang, W.K.; Luo, Q.; Liu, S.Y. Is government regulation a push for corporate environmental performance? Evidence from China. Econ. Anal. Policy 2022, 74, 105–121. [Google Scholar] [CrossRef]
  25. Shao, G.L.; Kong, H.Z.; Yu, J.K.; Li, C. Decomposition of driving factors of carbon emissions from marine aquaculture in China based on LMDI method. Agric. Technol. Econ. 2015, 9, 119–128. [Google Scholar]
  26. Jiao, N.Z. Research and development of marine “negative emission” technology to support the national demand for “carbon neutralization”. J. Chin. Acad. Sci. 2021, 36, 179–187. [Google Scholar]
  27. Devi, M.S.; Xavier, K.; Singh, A.S.; Edwin, L.; Shenoy, L. Environmental pressure of active fishing method: A study on carbon emission by trawlers from north-west Indian coast. Mar. Policy 2021, 127, 104453. [Google Scholar] [CrossRef]
  28. Orr, J.C.; Sarmiento, J.L. Potential of marine macroalgae as a sink for CO2: Constraints from a 3-D general circulation model of the global ocean. Water Air Soil Pollut. 1992, 64, 405–421. [Google Scholar] [CrossRef]
  29. Ji, J.Y.; Wang, P.P. Measurement of carbon sequestration capacity of mariculture in China and decomposition of influencing factors. Mar. Environ. Sci. 2015, 34, 871–878. [Google Scholar]
  30. Yang, Y.F.; Luo, H.T.; Wang, Q.; He, Z.L.; Long, A.M. Large-scale cultivation of seaweed is an effective way to increase ocean carbon sink and solve offshore environmental problems. J. Chin. Acad. Sci. 2021, 36, 259–269. [Google Scholar]
  31. Zhang, X.X.; Zheng, S.; Yu, L.H. Measurement of green efficiency of China’s marine carbon sink fishery and its spatial spillover effect. China’s Rural Econ. 2020, 10, 91–110. [Google Scholar]
  32. Zhang, Y.Y.; Zhang, J.H.; Liang, Y.T. Formation process and mechanism of carbon sink in China’s offshore aquaculture environment. Chin. Sci. Earth Sci. 2017, 47, 1414–1424. [Google Scholar]
  33. Shao, G.L.; Kong, H.Z.; Li, C. Net carbon sink of mariculture in China and its coupling relationship with economy. Resour. Sci. 2019, 41, 277–288. [Google Scholar]
  34. Sun, K.; Cui, Q.Q.; Su, Z.X.; Wang, Y.N. Spatio-temporal evolution of economic value of carbon sink in mariculture in China and analysis of influencing factors. Geogr. Res. 2020, 39, 2508–2520. [Google Scholar]
  35. Zhou, L. Research on China’s Low-carbon Economic development Based on Tapio Model. Explor. Econ. Probl. 2019, 06, 185–190. [Google Scholar]
  36. Tapio, P. Towards a theory of decoupling: Degrees of decoupling in the EU and the case of road traffic in Finland between 1970 and 2001. Transp. Policy 2005, 12, 137–151. [Google Scholar] [CrossRef] [Green Version]
  37. Kaya, Y. Impact of Carbon Dioxide Emission on GNP Growth: Interpretation of Proposed Scenarios. In Paris: Presentation to the Energy and Industry Subgroup, Response Strategies Working Group; IPCC: Geneva, Switzerland, 1989. [Google Scholar]
  38. Ang, B.; Zhang, F.; Choi, K.H. Factorizing changes in energy and environmental indicators through decomposition. Energy 1998, 23, 489–495. [Google Scholar] [CrossRef]
  39. Diakoulaki, D.; Mandaraka, M. Decomposition analysis for assessing the progress in decoupling industrial growth from CO2 emissions in the EU manufacturing sector. Energy Econ. 2007, 29, 636–664. [Google Scholar] [CrossRef]
  40. Kong, F.Z.; Cui, W.L.; Xi, H.H. Spatial–temporal variation, decoupling effects and prediction of marine fishery based on modified ecological footprint model: Case study of 11 coastal provinces in China. Ecol. Indic. 2021, 132, 108271. [Google Scholar] [CrossRef]
  41. Zhang, W.; Meng, J.; Tian, X. Does de-capacity policy enhance the total factor productivity of China’s coal companies? A Regression Discontinuity design. Resour. Policy 2020, 68, 101741. [Google Scholar] [CrossRef]
  42. Qin, H.; Ye, C.C.; Zhang, Y. Study on the state evaluation of mariculture eco-economic system-taking Shandong Province as an example. Econ. Issues 2017, 113, 100–105. [Google Scholar]
Figure 1. Decoupling state of net carbon emissions and economic growth of marine aquaculture in coastal areas from 2010 to 2019.
Sustainability 14 05886 g001
Figure 2. Three-dimensional diagram of decoupling states between the net carbon emissions index and economic growth of marine aquaculture in nine provinces from 2010 to 2019: (a) three-dimensional diagram of decoupling state between the net carbon emissions and economic growth; (b) three-dimensional diagram of decoupling state between carbon emissions and economic growth; (c) three-dimensional diagram of decoupling between carbon sequestration and economic growth.
Sustainability 14 05886 g002aSustainability 14 05886 g002b
Figure 3. Cumulative effect diagram of net carbon emissions from marine aquaculture in three marine economic zones.
Sustainability 14 05886 g003
Figure 4. Cumulative effect diagram of net carbon emissions from marine aquaculture in nine coastal provinces.
Sustainability 14 05886 g004aSustainability 14 05886 g004b
Figure 5. Decoupling effort index of China’s coastal areas and three marine economic zone from 2010 to 2019.
Sustainability 14 05886 g005
Table 1. Conversion coefficient of energy consumption.
Energy CategoryEnergy Consumption Conversion
Coefficient (kg/kg Standard Coal)
AquacultureConversion Coefficient of Energy Consumption
Diesel0.5921Pond culture0.1495
Electric power0.6800Factory culture3.4977
Table 2. Carbon sink coefficient of shellfish.
ShellfishCarbon Sink Conversion Coefficient %AlgaeCarbon Sink Conversion Coefficient %
Oysters9.59Kelp6.24
Mussels10.93Wakame5.28
Scallops10.17Nori5.48
Clam6.40River hedge4.12
Other shellfish9.72Other algae5.55
Table 3. Decoupling of net carbon emissions and economic growth of marine aquaculture.
Decoupling State C N / C N G O P / G O P Decoupling   Elasticity   e MeaningDecoupling Status
DecouplingStrong decoupling < 0 > 0 e < 0 C N decline ,   G O P rise, the best state8
Weak decoupling > 0 > 0 0 e < 0.8 C N   and   G O P both   rise ,   and   G O P rises faster7
Recessive decoupling < 0 < 0 e > 1.2 C N   and   G O P both   decline ,   and   C N falls faster than GOP6
CouplingRecessive coupling < 0 < 0 0.8 e 1.2 C N   and   G O P both decline, the decline rate is the same5
Expansive coupling > 0 > 0 0.8 e 1.2 C N   and   G O P both rise, the growth rate is the same4
Negative decouplingWeak negativedecoupling < 0 < 0 0 e < 0.8 C N   and   G O P both   decline ,   and   the   growth   rate   of   C N   is   higher   than   G O P 3
Expanding negative decoupling > 0 > 0 e > 1.2 C N   and   G O P both   rise ,   and   the   growth   rate   of   C N is   higher   than   G O P 2
Strong negativedecoupling > 0 < 0 e < 0 C N rises ,   G O P declines, the worst state1
Table 4. Decoupling table of net carbon emissions and economic growth of marine aquaculture in the three marine economic zones from 2010 to 2019.
Region2010–20112011–20122012–20132013–20142014–20152015–20162016–20172017–20182018–2019
Northern288886322
Eastern888886885
Southern888888888
Note: Specific meanings of decoupling status numbers are shown in Table 3.
Table 5. Decoupling table of net carbon emissions and economic growth of marine aquaculture in nine coastal provinces from 2010 to 2019.
Region2010–20112011–20122012–20132013–20142014–20152015–20162016–20172017–20182018–2019
Hebei188828622
Liaoning282838668
Shandong878883212
Jiangsu887214183
Zhejiang788886888
Fujian888888688
Guangdong888888777
Guangxi888888688
Hainan277722182
Note: Specific meanings of decoupling status numbers are shown in Table 3.
Table 6. Effect decomposition of changes in net carbon emissions from marine aquaculture.
YearTotal Effect of Net Carbon EmissionsCarbon
Emission
Intensity Effect
Economic
Structure Effect
Aquaculture
Efficiency Effect
Aquaculture Scale EffectAquaculture Structure Effect
2010–20110.64−4.900.50−5.14−1.8612.04
2011–2012−5.65−20.5520.45−3.58−5.443.48
2012–2013−6.63−14.9117.850.61−9.78−0.40
2013–2014−25.96−16.754.40−8.160.78−6.23
2014–2015−11.32−1.34−0.41−5.69−1.05−2.83
2015–2016−27.74−14.36−4.73−24.4814.611.22
2016–2017−7.1311.05−10.33−13.589.11−3.39
2017–2018−5.61−16.6111.90−8.394.732.76
2018–20190.38−6.263.33−9.985.907.38
Average−9.89−9.404.77−8.711.891.56
Table 7. Decoupling effort indicators of net carbon emissions and economic growth of marine aquaculture from 2010 to 2019.
Region2010–20112011–20122012–20132013–20142014–20152015–20162016–20172017–20182018–2019Average
Hebei−9.98−15.15−2.79−6.13−15.321.040.440.31−0.54−5.35
Liaoning3.561.160.124.960.87−4.510.691.202.591.18
Shandong2.160.831.2111.22−81.730.6110.801.62−1.64−6.10
Northern−1.421.061.038.01−0.53−0.620.940.45−0.290.96
Jiangsu−7.202.940.990.170.230.861.051.030.970.11
Zhejiang−12.6911.481.7512.35−22.63−0.223.410.015.03−0.17
Eastern−7.105.651.053.812.38−0.4911.371.150.542.04
Fujian77.421.434.27−6.8422.684.53−0.4912.8120.0915.10
Guangdong0.422.343.631.552.935.950.70−0.470.491.95
Guangxi3.057.08−5.721.8714.436.89−4.112.862.323.18
Hainan−7.15−1.6114.050.53−0.059.323.002.140.072.26
Southern−7.101.824.895.515.924.66−4.513.306.282.31
Coastal areas−0.281.281.376.90−26.65−4.860.311.470.88−2.17
Table 8. Efficiency analysis of various factors in marine aquaculture from 2010 to 2019.
RegionRedundant EfficiencyComprehensive Efficiency
Aquaculture AreaLabor ForceIntermediate ConsumptionOutput ValueCarbon
Sequestration
CO 2 Emission
Hebei82.80%29.60%1.20%7.10%8.00%65.50%44.90%
Liaoning75.00%14.50%0.00%14.10%20.50%48.30%53.20%
Shandong62.70%12.10%6.80%2.30%5.00%45.50%61.60%
Northern73.50%18.73%2.67%7.83%11.17%53.10%53.23%
Jiangsu21.60%22.90%0.00%0.00%6.80%13.60%82.90%
Zhejiang56.60%65.20%3.20%1.90%1.50%30.30%62.90%
Eastern39.10%44.05%1.60%0.95%4.15%21.95%72.90%
Fujian4.80%4.20%0.00%0.10%0.00%0.50%98.20%
Guangdong50.40%67.40%5.00%1.10%13.40%19.90%64.60%
Guangxi30.90%60.20%5.20%10.00%0.00%19.00%71.40%
Hainan8.20%13.10%0.80%0.00%3.60%2.10%93.90%
Southern23.58%36.23%2.75%2.80%4.25%10.38%82.03%
Coastal areas43.67%32.13%2.47%4.07%6.53%27.19%70.40%
Publisher’s Note: MDPI stays neutral with regard to jurisdictional claims in published maps and institutional affiliations.

