
The Analysis of the Conceptual Framework of Green Port Implementation in Indonesia Using Circular Economy: The Case Study of Benoa Public and Fishing Terminals


Abstract
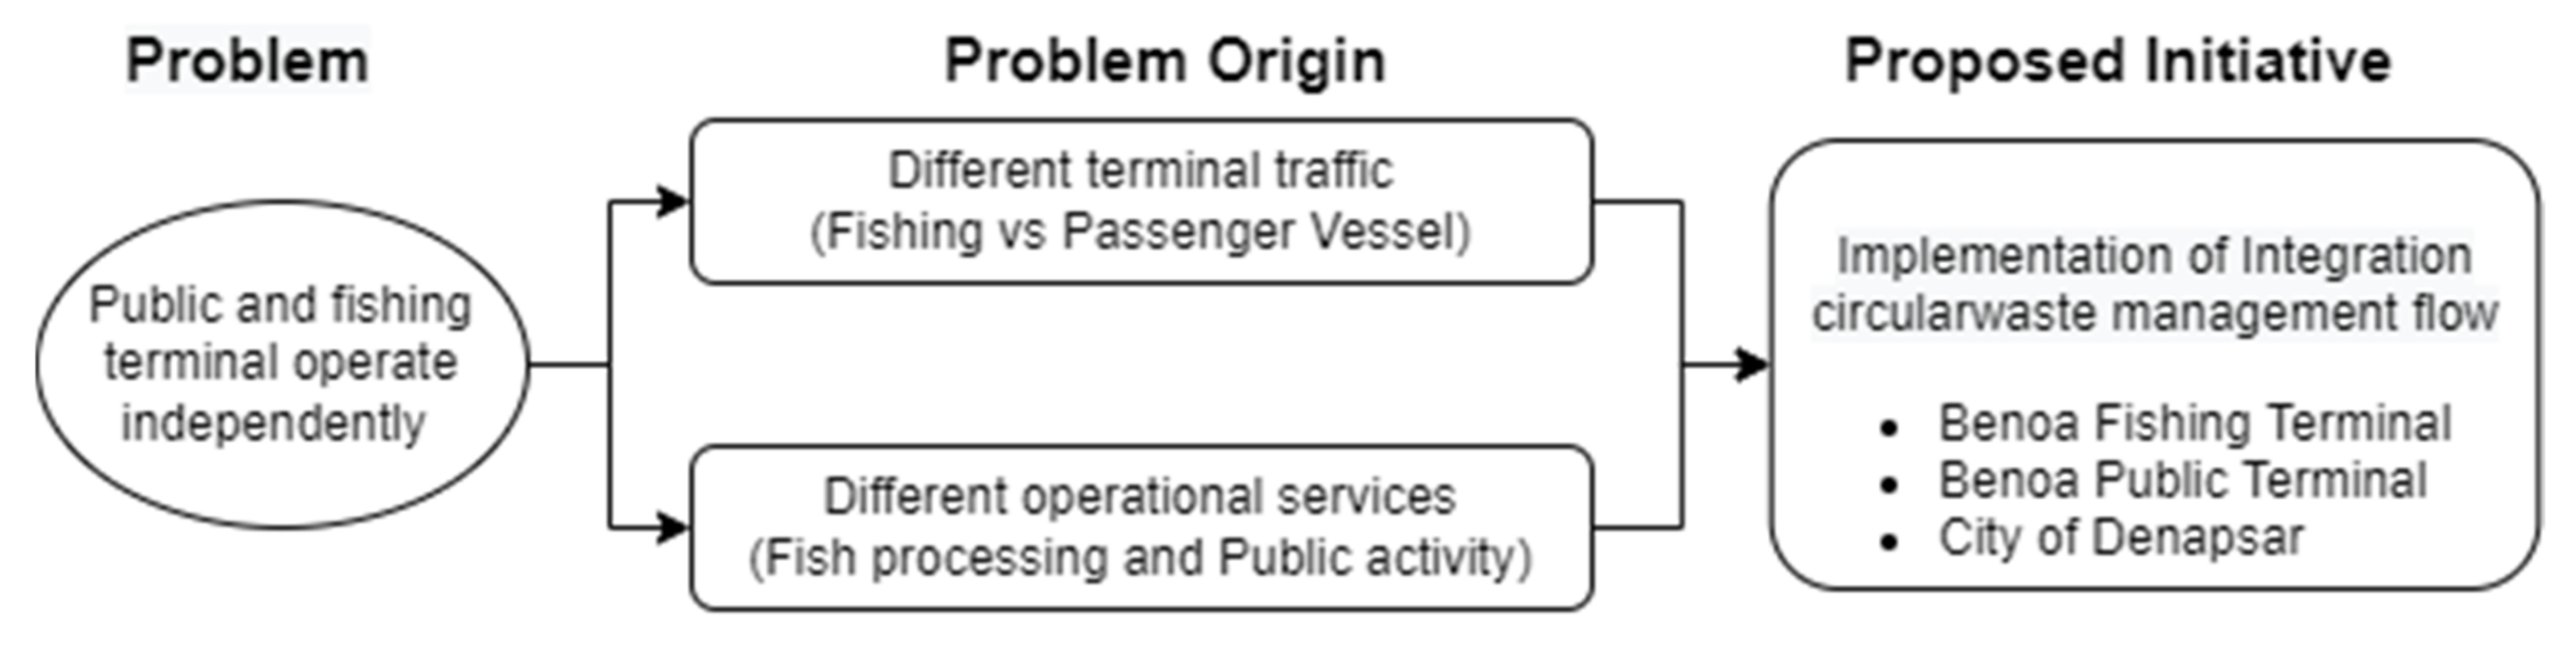
:1. Introduction
2. Case Study: Benoa Fishing Terminal
3. Literature Review
3.1. Circular Economy in Port and Fishery Aquaculture Waste
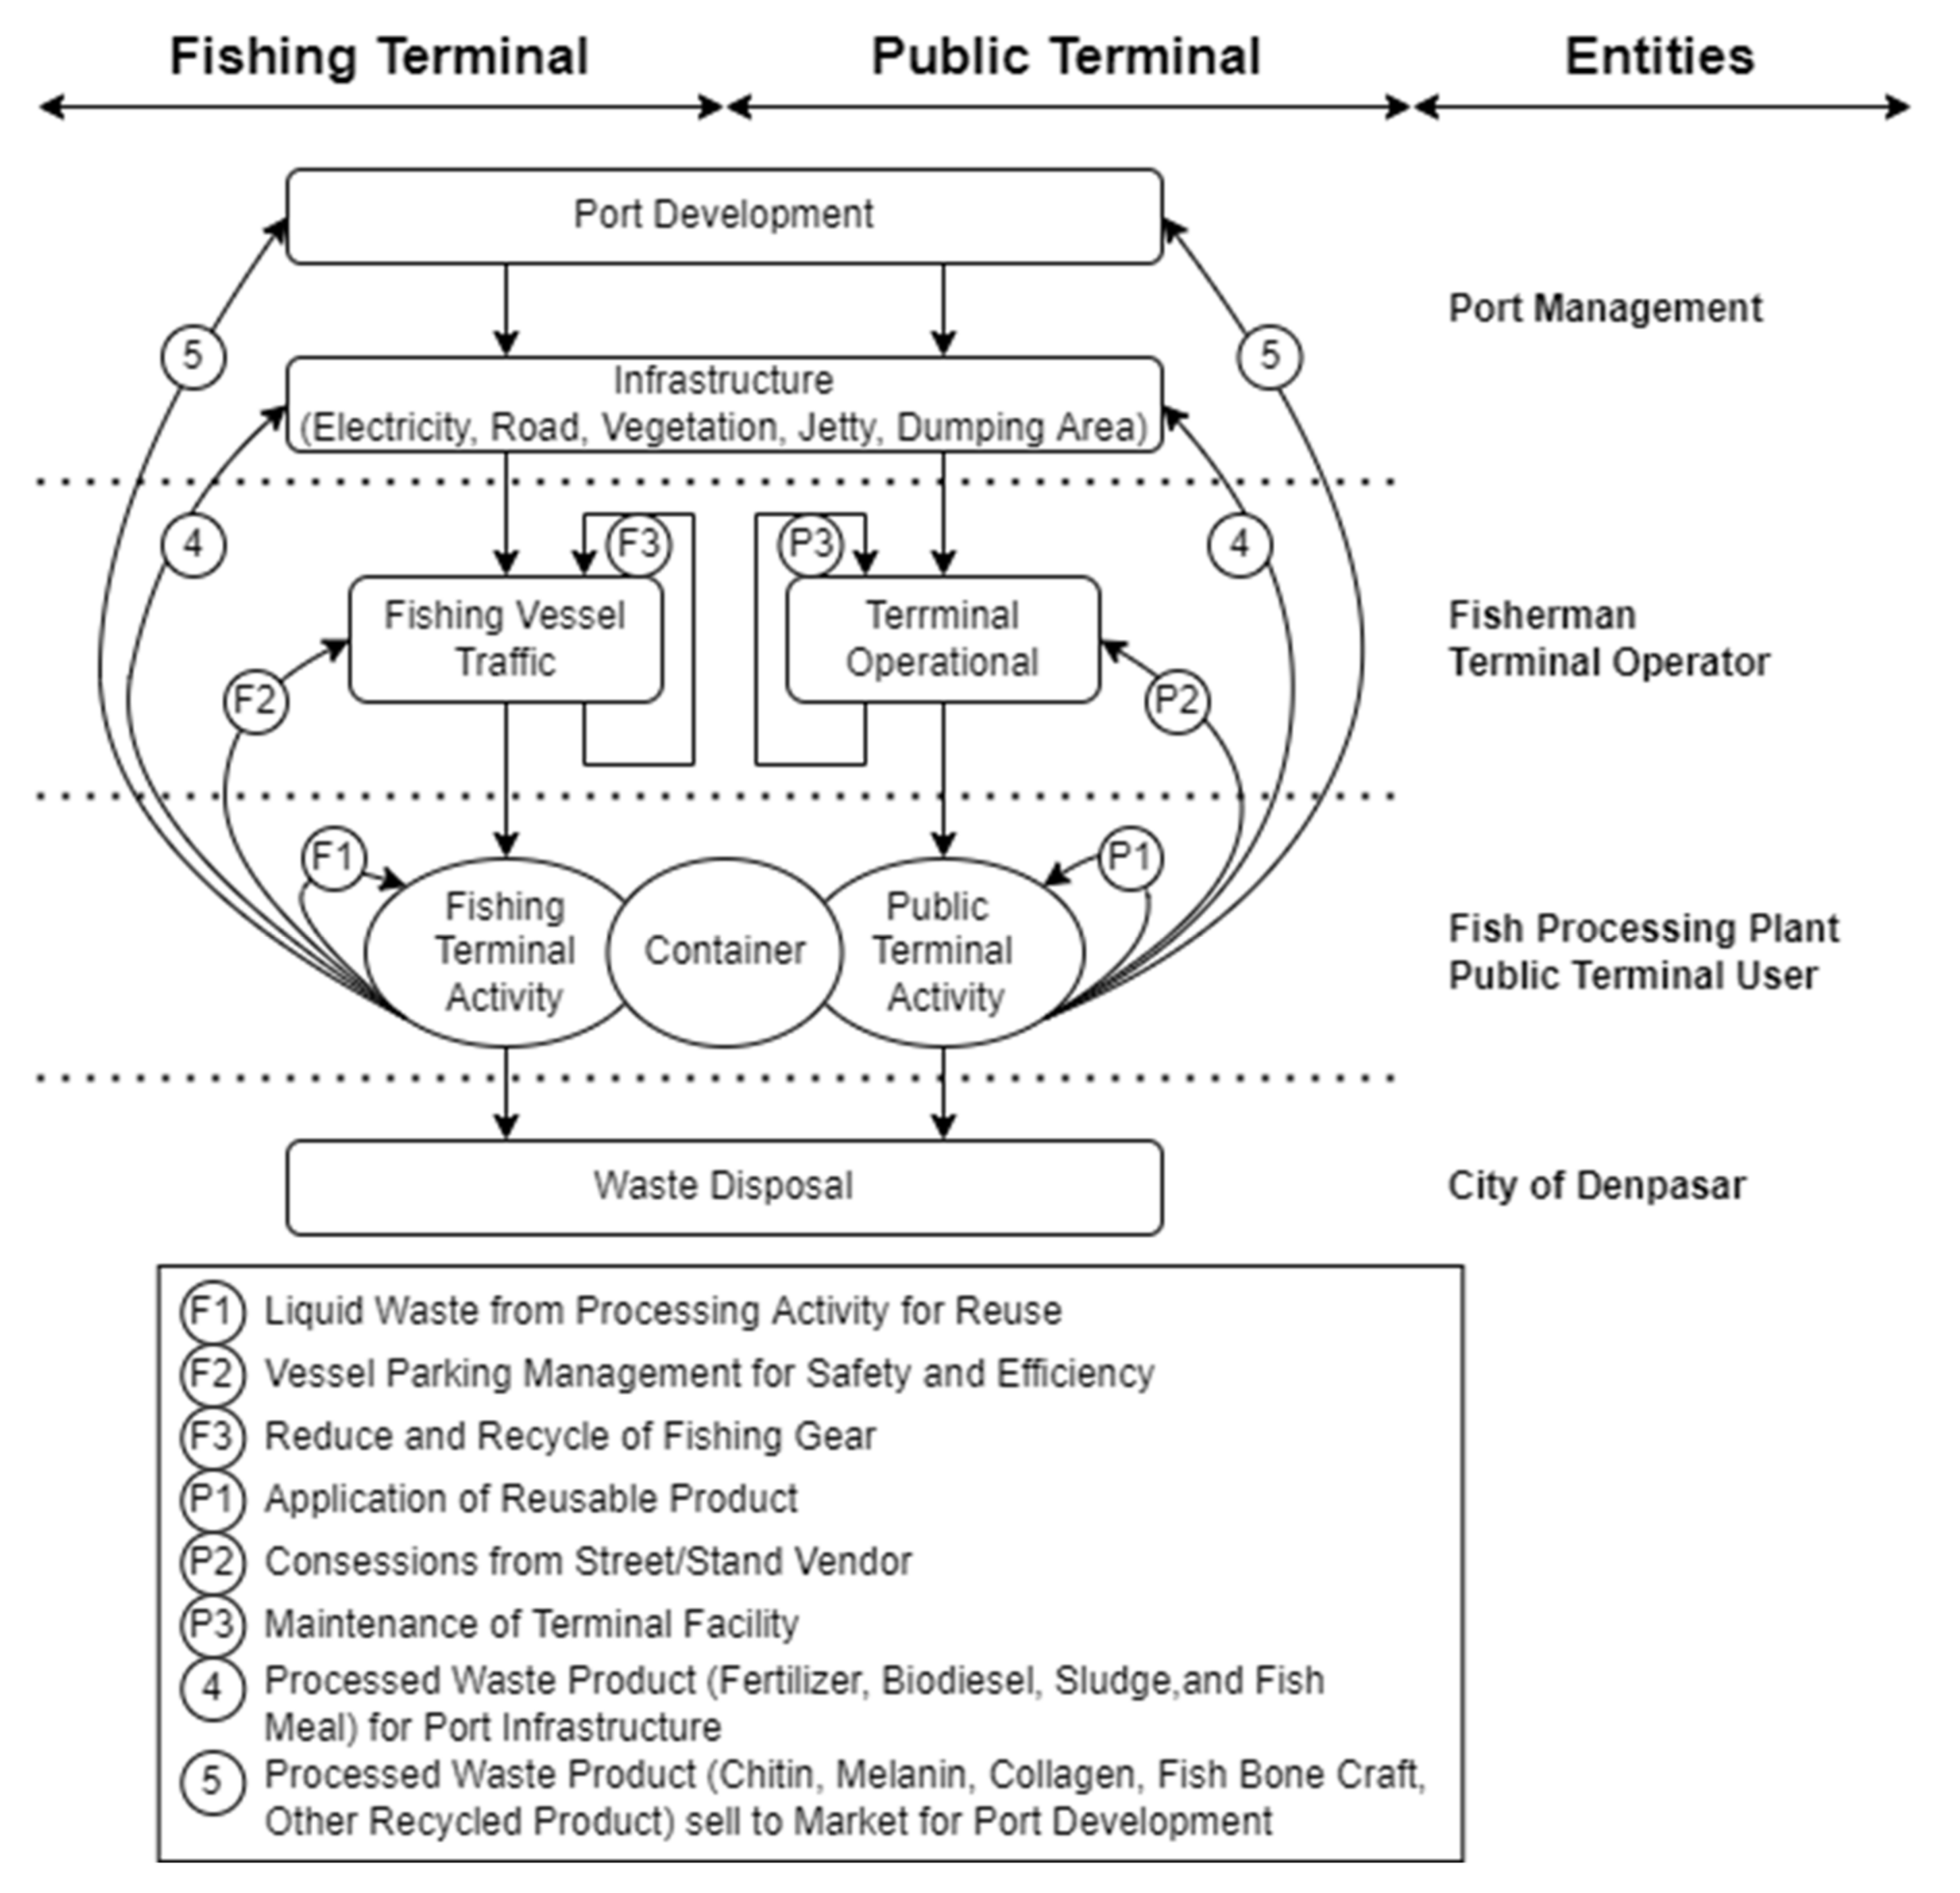
3.2. Framework of Circular Economy in the Public Terminal, Fishing Terminal, and City Authority
3.3. Waste Management Based Distribution Benefit Approach
3.4. Domestic Waste Management
3.5. Bilge Waste Management
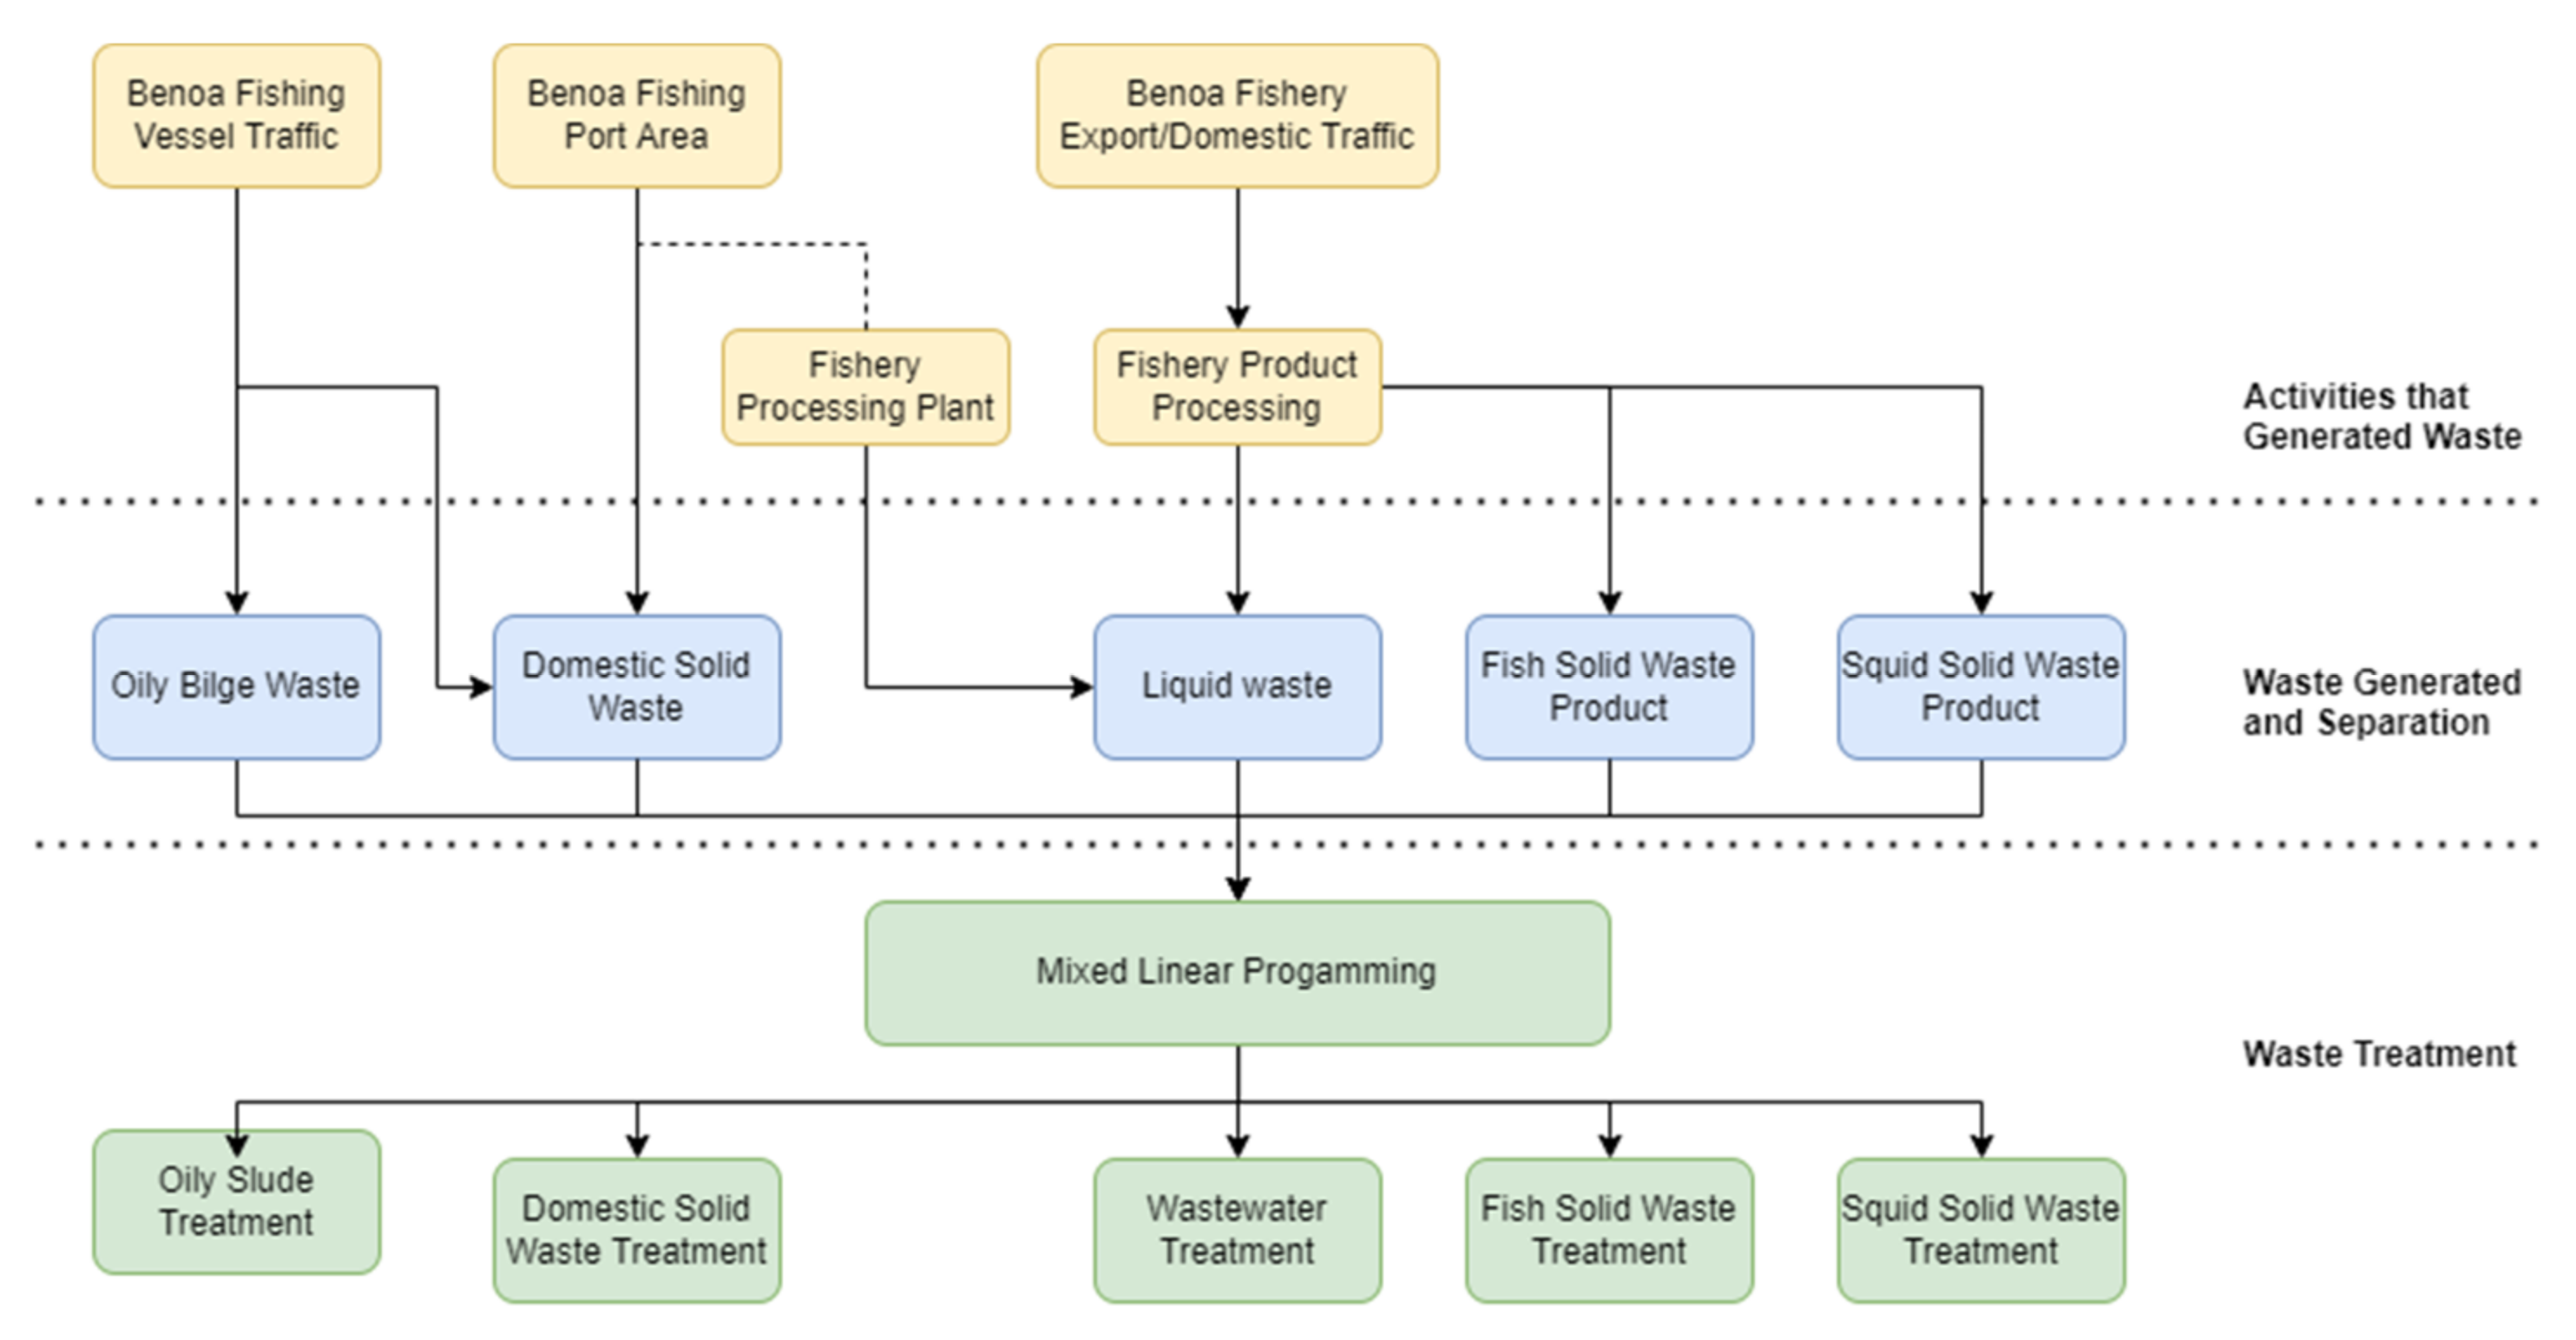
4. Methodologies
4.1. Waste-Generating Activities
4.1.1. Fishing Vessel Traffic at Benoa Fishing Terminal
4.1.2. Benoa Fishing Port Area
4.1.3. Benoa Fishery Export/Domestic Traffic
4.2. Waste Generated and Separation
4.2.1. Oily Bilge Waste
- OWi = Oily bilge waste generated by vessel size i per day (m3)
- Pi = Main engine ratin of vessel i (kW)
- Ti = Total voyage duration per vessel size i (days)
- Ni = Number of call vessel size i per week
4.2.2. Domestic Solid Waste
Domestic Solid Waste Generated from Vessel Traffic
- SWi = Solid waste generated by vessel size i per day (m3)
- CSW = Quantity of the solid waste generated per person per day: 3.06 kg/person/day
- Cri = Number of Crew per vessel size i (person)
- Ti = Total voyage duration per vessel size i (days)
- Ni = Number of call vessel size i per week
- = Solid waste density: 0.38958 ton/m3 [56]
Domestic Solid Waste Generated from Benoa Fishing Port Area
4.2.3. Liquid Waste
- LW1 = Liquid waste generated from fish processing activity per day
- CLW = Liquid waste generated per ton of product: 14.9 m3/ton
- Mj = Total traffic of product j per year (ton)
4.2.4. Fish and Squid Solid Waste Product
- SW = Total of solid waste generated by product j
- Mj,k = Total of traffic k per year of product j (ton)
- Cj = Percentage of by-product generated by product j
5. Result
5.1. The Waste from Benoa Fishing Vessel Traffic
5.2. Domestic Solid Waste from Benoa Fishing Port Area
5.3. Waste from Fish Processing Plant
6. Discussion
6.1. Benefit Distribution of Recycling Energy Based on Circular Economy
6.2. Waste Utilization Management
6.3. Practical Implications
- In order to achieve sustainable development, fishing ports and public ports may be integrated into operation and zones for handling ships and their cargo as long as the process of handling waste and processing fishery products becomes more efficient and productive.
- A circular economy may be used as a theoretical framework of factors determining Green Port implementation for fishing and public ports.
- The variety of handling waste due to the complexity of the types and trends of ship traffic including its cargoes, the type of cargo handled, and its solid and liquid waste have the potential to be a return benefit for fishing and public port operators in Benoa with the City of Denpasar.
7. Conclusions
Author Contributions
Funding
Data Availability Statement
Conflicts of Interest
References
- Bergqvist, R.; Monios, J. Green Ports in theory and practice. In Green Ports; Inland and Seaside Sustainable Transportation Strategies; Bergqvist, R., Monios, J., Eds.; Elsevier: Cambridge, MA, USA, 2019; pp. 1–17. [Google Scholar]
- Davarzani, H.; Fahimnia, B.; Bell, M.; Sarkis, J. Greening ports and maritime logistics. Transp. Res. Part D 2016, 48, 473–487. [Google Scholar] [CrossRef]
- Wellmer, F.W.; Becker-Platen, J.D. Sustainable development and the exploitation of mineral and energy resources: A review. Int. J. Earth Sci. 2002, 91, 723–745. [Google Scholar]
- Jawahir, I.; Bradley, R. Technological Elements of Circular Economy and the Principles of 6R-Based Closed-loop Material Flow in Sustainable Manufacturing. Procedia CIRP 2016, 40, 103–108. [Google Scholar] [CrossRef] [Green Version]
- Rashid, A.; Asif, F.M.A.; Krajnik, P.; Nicolescu, C.M. Resource conservative manufacturing. J. Clean. Prod. 2013, 57, 166–177. [Google Scholar] [CrossRef]
- Rizos, V.; Behrens, A.; Kafyeke, T.; Hirschnitz-Garbers, M.; Ioannou, A. The Circular Economy: Barriers and Opportunities for SMEs. In CEPS Working Documents; 2015; Available online: greengrowthknowledge.org (accessed on 25 March 2022).
- Mihelcic, J.R.; Crittenden, J.C.; Small, M.J.; Shonnard, D.R.; Hokanson, D.R.; Zhang, Q.; Chen, H.; Sorby, S.A.; James, V.U.; Sutherland, J.W.; et al. Sustainability science and engineering: The emergence of a new metadiscipline. Environ. Sci. Technol. 2003, 37, 5314–5324. [Google Scholar] [CrossRef]
- Pavlic, B.; Cepak, F.; Sucic, B.; Peckaj, M.; Kandus, B. Sustainable port infrastructure, practical implementation of the green port concept. Therm. Sci. 2014, 18, 935–948. [Google Scholar] [CrossRef] [Green Version]
- Satir, T.; Dogan-Saglamtimur, N. The Protection of Marine Aquatic Life: Green Port (EcoPort) Model inspired by Green Port Concept in Selected Ports from Turkey, Europe and the USA. Period. Eng. Nat. Sci. 2018, 6, 120–129. [Google Scholar] [CrossRef] [Green Version]
- Burdall, A.C.; Williamson, H.J. Ports into the Next Century; Ford, C.R., Ed.; Thomas Telford Limited: London, UK, 1991; pp. 247–259. [Google Scholar]
- Wang, L.; Wang, N. The Interaction Development between Port Cluster and City Based on Green Conception. In Proceedings of the International Conference on Transportation Engineering (ICTE), Chengdu, China, 22–24 July 2007. [Google Scholar]
- Anastasopoulou, D.; Kolios, S.; Stylios, C. How will Greek ports become will Green Ports? Geo-Eco-Marina 2011, 17, 73–80. [Google Scholar]
- Kirchherr, J.; Reike, D.; Hekkert, M. Conceptualizing the circular economy: An analysis of 114 definitions. Resour. Conserv. Recycl. 2017, 127, 221–232. [Google Scholar] [CrossRef]
- Arismayanti, N.K. Branding Strategy of Tourism in Bali Based on Cultures and Heritage. In Proceedings of the 8th International Science, Social Science, Engineering and Energy Conference, Pataya, Thailand, 15–17 March 2017. [Google Scholar]
- Kusuma, I.M.; Syafrudin; Yulianto, B. Utilization of Fish Waste Processing as Compost Raw Material in Tambak Lorok Market. E3S Web Conf. 2019, 125, 07004. [Google Scholar] [CrossRef]
- Guman, O.; Wegner-Kozlova, E. Waste management based on circular economy principles. E3S Web Conf. 2020, 177, 04014. [Google Scholar] [CrossRef]
- Kovačič Lukman, R.; Brglez, K.; Krajnc, D. A Conceptual Model for Measuring a Circular Economy of Seaports: A Case Study on Antwerp and Koper Ports. Sustainability 2022, 14, 3467. [Google Scholar] [CrossRef]
- Roberts, T.; Williams, I.; Preston, J.; Clarke, N.; Odum, M.; O’Gorman, S. A virtuous circle? Increasing local benefits from ports by adopting circular economy principles. Sustainability 2021, 13, 7079. [Google Scholar] [CrossRef]
- Sustainability and Circular Economy Approach in Port. Available online: https://unece.org/fileadmin/DAM/trans/doc/2020/sc3/04._CE_in_Ports_context_-__WMU_Ballini_F_UNECE.pdf (accessed on 28 March 2022).
- Carpenter, A.; Lozano, R.; Sammalisto, K.; Astner, L. Securing a port’s future through Circular Economy: Experiences from the Port of Gävle in contributing to sustainability. Mar. Pollut. Bull. 2018, 128, 539–547. [Google Scholar] [CrossRef]
- Haezendonck, E.; Van den Berghe, K. Patterns of Circular Transition: What Is the Circular Economy Maturity of Belgian Ports? Sustainability 2020, 12, 9269. [Google Scholar] [CrossRef]
- Gabitov, T.; Kurmanalieva, A.; Moldagaliyev, B.; Zatov, K.; Kilybayeva, S. Sustainable Development as a Priority of Contemporary Cultural Policy. Procedia-Soc. Behav. Sci. 2014, 140, 691–694. [Google Scholar] [CrossRef] [Green Version]
- Fraga-Corral, M.; Ronza, P.; Garcia-Oliveira, P.; Pereira, A.; Losada, A.; Prieto, M.; Quiroga, M.; Simal-Gandara, J. Aquaculture as a circular bio-economy model with Galicia as a study case: How to transform waste into revalorized by-products. Trends Food Sci. Technol. 2022, 119, 23–35. [Google Scholar] [CrossRef]
- Zilia, F.; Bacenetti, J.; Sugni, M.; Matarazzo, A.; Orsi, L. From Waste to Product: Circular Economy Applications from Sea Urchin. Sustainability 2021, 13, 5427. [Google Scholar] [CrossRef]
- Kusumowardani, N.; Tjahjono, B. Circular economy adoption in the aquafeed Manufacturing industry. Procedia CIRP 2020, 90, 43–48. [Google Scholar] [CrossRef]
- Borrello, M.; Pascucci, S.; Caracciolo, F.; Lombardi, A.; Cembalo, L. Consumers are willing to participate in circular business models: A practice theory perspective to food provisioning. J. Clean. Prod. 2020, 259, 121013. [Google Scholar] [CrossRef]
- Coello, N.; Montiel, E.; Concepcion, M.; Christen, P. Optimization of a culture medium containing fish silage for L-lysine production by Corynebacterium glutamicum. Bioresour. Technol. 2002, 85, 207–211. [Google Scholar] [CrossRef]
- Laufenberg, G.; Kunz, B.; Nystroem, M. Transformation of vegetable waste into value added products. Bioresour. Technol. 2003, 87, 167–198. [Google Scholar] [CrossRef]
- Kurniasih, S.D.; Soesilo, T.E.B.; Soemantojo, R. Pollutants of Fish Processing Industry and Assessment of its Waste Management by Wastewater Quality Standards. E3S Web Conf. 2018, 68, 03006. [Google Scholar] [CrossRef] [Green Version]
- Caruso, G. Fishery Wastes and By-products: A Resource to Be Valorised. J. Fish. Com. 2015, 9, 80–83. [Google Scholar]
- Vatria, B. Penanganan Limbah Hasil Perikanan. ResearchGate 2020. [Google Scholar] [CrossRef]
- Kristinsson, H.G.; Rasco, B.A. Fish protein hydrolysates: Production, biochemical, and functional properties. Crit. Rev. Food Sci. Nutr. 2000, 40, 43–81. [Google Scholar] [CrossRef]
- Ferdosh, S.; Sarker, Z.I.; Norulaini, N.; Oliveira, A.; Yunus, K.; Chowdury, A.J.; Akanda, J.; Omar, M. Quality of Tuna Fish Oils Extracted from Processing the By-Products of Three Species of Neritic Tuna Using Supercritical Carbon Dioxide. J. Food Process. Preserv. 2014, 39, 432–441. [Google Scholar] [CrossRef]
- Babbit, K.J. Intrinsic quality and species of North Pacific fish. In Making Profits Out of Seafood Wastes. In Proceedings of the International Conference on Fish By-Products, Anchorage, AK, USA, 25–27 April 1990; Keller, S., Ed.; University of Alaska Sea Grant: Fairbanks, AK, USA, 1990; pp. 39–43. [Google Scholar]
- Arvanitoyannis, I.S.; Kassaveti, A. Fish industry waste: Treatments, environmental impacts, current and potential uses. Int. J. Food Sci. Technol. 2007, 43, 726–745. [Google Scholar] [CrossRef]
- Rojas, C. Analysis of Economically and Environmentally Feasible Treatment for Giant Squid (Dosidicus gigas) Waste in Chile. Ph.D. Thesis, Graduate School of Life and Environmental Sciences, University of Tsukuba, Ibaraki, Japan, 2019. [Google Scholar]
- Joseph, J.; Prabhu, P.V.; Madhavan, P. Utilization of Squid Waste as Meal. Cochin 1987, 24, 41–43. [Google Scholar]
- Wang, F.R.; Xie, Z.G.; Ye, X.Q.; Deng, S.G.; Hu, Y.Q.; Guo, X.; Chen, S.G. Effectiveness of Treatment of Iron Deficiency Anemia in Rats woth Squid Ink MelaninFe. Food Funct. 2014, 5, 123–128. [Google Scholar] [CrossRef]
- Derby, C.D. Cephalopod Ink: Production, Chemistry, Functions and Applications. Mar. Drugs 2014, 12, 2700–2730. [Google Scholar] [CrossRef] [PubMed] [Green Version]
- Derby, C.D.; Kicklighter, C.E.; Johnson, P.M.; Zhang, X. Chemical Composition of Inks of Diverse Marine Molluscs Suggest Convert Chemical Defenses. Chem. Ecol. 2007, 33, 1105–1113. [Google Scholar] [CrossRef] [PubMed]
- Tolaimate, A.; Desbrieres, J.; Rhazi, M.; Alagui, A.; Vincendon, M.; Vottero, P. On the influence of deacetylation process on the physicochemical characteristics of chitosan from squid chitin. Polymer 2000, 41, 2463–2469. [Google Scholar] [CrossRef]
- Ibrahim, B. Kaji Ulang Sistem Pengolahan Limbah Cair Industri Hasil Perikanan Secara Biologis Dengan Lumpur Aktif. J. Teknol. Has. Perikan. 2005, 8, 31–40. [Google Scholar]
- Mohee, R.; Surroop, D.; Mudhoo, A.; Rughooputh, B.K. Inventory of Waste streams in an industrial port and planning for a port waste management system as per ISO14001. Ocean Coast. Manag. 2012, 61, 10–19. [Google Scholar] [CrossRef]
- Pereira, S.L.; Fontana, C.M.M.; Fontana, C.F.; Sakurai, C.A. Management of Port Solid Waste Framework. Int. J. Energy Environ. 2014, 8, 27–33. [Google Scholar]
- Butt, N. The impact of cruise ship generated waste on home ports and ports of call: A study of Southampton. Mar. Policy 2007, 31, 591–598. [Google Scholar] [CrossRef]
- Olson, P.H. Handling of waste in ports. Mar. Pollut. Bull. 1994, 29, 284–295. [Google Scholar] [CrossRef]
- Pérez, I.; González, M.M.; Jiménez, J.L. Size Matters? Evaluating the drivers of waste from ships at ports in Europe. Transp. Res. Part D 2017, 57, 403–412. [Google Scholar] [CrossRef]
- Peccia, J.; Westerhoff, P. We should expect more out of our sewage sludge. Environ. Sci. Technol. 2015, 49, 8271–8276. [Google Scholar] [CrossRef]
- Mesdaghinia, A.R.; Akhavan, M.P.; Vaezi, F.; Naddafi, K.; Moosavi, G.H. Waste Sludge Characteristics of a Wastewater Treatment Plant Compared with Environmental Standards. Iran. J. Public Health 2012, 33, 5–95. [Google Scholar]
- Hahn, W.J. High-temperature reprocessing of petroleum oily sludges. SPE Prod. Facil. 1994, 9, 179–182. [Google Scholar] [CrossRef]
- Ramaswamy, B.; Kar, D.; De, S. A study on recovery of oil from sludge containing oil using froth flotation. J. Environ. Manag. 2007, 85, 150–154. [Google Scholar] [CrossRef] [PubMed]
- Pędziwiatr, P. Aquaculture Waste Management. Acta Innov. 2017, 22, 20–29. [Google Scholar]
- Kim, K.-H.; Pal, R.; Ahn, J.-W.; Kim, Y.-H. Food decay and offensive odorants: A comparative analysis among three types of food. Waste Manag. 2009, 29, 1265–1273. [Google Scholar] [CrossRef]
- Understanding Waste Streams Treatment of Specific Waste. Available online: https://www.europarl.europa.eu/EPRS/EPRS-Briefing-564398-Understanding-waste-streams-FINAL.pdf (accessed on 10 February 2022).
- Natale, F.; Carvalho, N.; Paulrud, A. Defining small-scale fisheries in the EU on the basis of their operational range of activity The Swedish fleet as a case study. Fish. Res. 2015, 164, 286–292. [Google Scholar] [CrossRef]
- Ambariski, P.P.D.; Herumurti, W. Sistem Pengangkutan Sampah Berdasarkan Kapasitas Kendaraan Pengangkut dan Kondisi Kontainer Sampah di Surabaya Barat. J. Tek. ITS 2016, 5, D64–D69. [Google Scholar] [CrossRef] [Green Version]


| Ports | Existing Circular and Bio-Based Economy Clusters | Strategies |
|---|---|---|
| Rotterdam | Renewable energy clusters | Towards 2030 Rotterdam |
| Antwerp | E-waste and recycling | |
| Zeeland | Bio-park | Sustainable Development Strategy |
| Ghent | Bio-refinery, bio-park | |
| Amsterdam | Recycling | Vision 2030 and Circle city scan |
| Ostend | Recycle, recover | |
| Brussels | Recycling hub | |
| North Sea Port | Energy hub; reduce, recycle |
| Vessel Size | Crew Number (Person) | Voyage Duration (Days) | Call per Week | Engine Power (kW) |
|---|---|---|---|---|
| 0–30 GT | 5 | 53 | 8 | 123 |
| 31–60 GT | 7 | 102 | 10 | 200 |
| 61–200 GT | 7 | 102 | 26 | 460 |
| >200 GT | 16 | 136 | 2 | 700 |
| No | Building Name | Capacity (People) | Area (m2) | No | Building Name | Capacity (People) | Area (m2) |
|---|---|---|---|---|---|---|---|
| Existing Benoa Zone | Dumping 1 Zone | ||||||
| 1 | Passenger Terminal | 3040 | 9000 | A | Retail Area | 8062 | 9674 |
| 2 | Daily Cruise | 1914 | 2872 | B | Club House Area | ||
| 3 | Hall Daily Cruise | 5915 | 8873 | Lounge Entrance Club House | 381 | 1524 | |
| 4 | Yacht Terminal | 67 | 267 | Restaurant | 297 | 1947 | |
| 5 | Country’s Ship | 500 | 1024 | Café | 54 | 323 | |
| 6 | UMKM | 3000 | 30,260 | Private Inn Clubhouse | 153 | 1500 | |
| 7 | Foodcourt | 2522 | 5153 | Main Club House | 11,618 | 17,426 | |
| 8 | Monument Icon | 100 | 6030 | Lounge and Bar | 205 | 1231 | |
| 9 | Amphitheater | 10,000 | 15,845 | C | Sport Center Area | 2038 | 3975 |
| 10 | Mangrove Museum | 441 | 3537 | D | Fish Market Area | 3353 | 14,116 |
| 11 | Public Facility | 1026 | 2215 | E | Area Dry and Wet Berth | ||
| 12 | Terminal hop on hop off | 309 | 2060 | 1 | Dry berth | 5773 | |
| 2 | Wet berth | 10,450 | |||||
| Type | Main Engine Rating (kW) | Capacity (m3) |
|---|---|---|
| Capacity of Drain and Leakage Oil Tank | Up to 10,000 | 20 × D × P/106 |
| Above 10,000 | D × (0.2 + 7 × (P − 10,000)/106 | |
| Capacity of Bilge Water Holding Tank | Up to 1000 | 1.5 |
| 1000–20,000 | 1.5 + (P − 1000)/1500 | |
| Above 20,000 | 14.2 + 0.2 (P − 20,000)/1500 |
| Type | Frozen | General Processing | Canned | Pallet Fish/Fish Oil |
|---|---|---|---|---|
| Number of Facilities | 25 | 136 | 6 | 11 |
| Product processing (ton/day) | 725 | 983 | 161 | 325 |
| Water needed for processing (m3/day) | 11.25 | 15.17 | 868 | 3.09 |
| Wastewater generated (m3/day) | 10.83 | 14.62 | 858 | 3.07 |
| Number of liquid waste per ton product (m3) | 14.9 | 14.9 | 5.3 | 9.4 |
| No | Building Name | Area (m2) | Waste (m3) | No | Building Name | Area (m2) | Waste (m3) |
|---|---|---|---|---|---|---|---|
| Dumping 1 Zone | |||||||
| 1 | Passenger Terminal | 9000 | 3.6 | A | Retail Area | 9674 | 0.301 |
| 2 | Daily Cruise | 2872 | 1.148 | B | Club House Area | ||
| 3 | Hall Daily Cruise | 8873 | 3.549 | Lounge Entrance Club House | 1524 | 0.013 | |
| 4 | Yacht Terminal | 267 | 0.106 | Restaurant | 1947 | 0.01 | |
| 5 | Country’s Ship | 1024 | 4.09 | Café | 323 | 0.002 | |
| 6 | UMKM | 30,260 | 0.113 | Private Inn Clubhouse | 1500 | 0.099 | |
| 7 | Food-court | 5153 | 0.094 | Main Club House | 17,426 | 0.435 | |
| 8 | Monument Icon | 6030 | 0.003 | Lounge and Bar | 1231 | 0.007 | |
| 9 | Amphitheater | 15,845 | 0.375 | C | Sport Center Area | 3975 | 0.253 |
| 10 | Mangrove Museum | 3537 | 0.05 | D | Fish Market Area | 14,116 | 5.646 |
| 11 | Public Facility | 2215 | 0.037 | E | Area Dry Berth Wet Berth | 2.309 | |
| 12 | Terminal hop on hop off | 2060 | 0.012 | 1 | Dryberth | 4.18 | |
| 2 | Wetberth | ||||||
| Total Waste Generation from Existing Benoa Zone | 9.5 | Total Waste Generation from Dumping 1 Zone | 18.91 | ||||
| Product | Export and Domestic Traffic per Year (ton) | Solid Waste (m3) | Liquid Waste (m3) |
|---|---|---|---|
| Squid | 7325 | 4.415 | 299 |
| Tuna and Sardine | 11,517 | 4.417 | 470.1 |
| Total | 769.1 |
Publisher’s Note: MDPI stays neutral with regard to jurisdictional claims in published maps and institutional affiliations. |
© 2022 by the authors. Licensee MDPI, Basel, Switzerland. This article is an open access article distributed under the terms and conditions of the Creative Commons Attribution (CC BY) license (https://creativecommons.org/licenses/by/4.0/).
Share and Cite
Gurning, R.O.S.; Tangkau, D.I. The Analysis of the Conceptual Framework of Green Port Implementation in Indonesia Using Circular Economy: The Case Study of Benoa Public and Fishing Terminals. Sustainability 2022, 14, 6083. https://doi.org/10.3390/su14106083
Gurning ROS, Tangkau DI. The Analysis of the Conceptual Framework of Green Port Implementation in Indonesia Using Circular Economy: The Case Study of Benoa Public and Fishing Terminals. Sustainability. 2022; 14(10):6083. https://doi.org/10.3390/su14106083
Chicago/Turabian StyleGurning, Raja Oloan Saut, and Daniel Imanuel Tangkau. 2022. "The Analysis of the Conceptual Framework of Green Port Implementation in Indonesia Using Circular Economy: The Case Study of Benoa Public and Fishing Terminals" Sustainability 14, no. 10: 6083. https://doi.org/10.3390/su14106083