Article

Influence of Cerium and Nickel Co-Doping on ZnO Nanostructures for Electrochemical Behavior of H2O2 Sensing Applications

1
Department of Physics, Dharmapuram Gnanambigai Government Arts College for Women, Nagapattinam, Mayiladuthurai 609001, Tamil Nadu, India
2
Department of Mechanical Engineering, Yeungnam University, Gyeongsan 38541, Korea
3
Department of Physics, Sri Sarada Mahavidyalayam Arts and Science College for Women, Sarada Ashram, New Edaikkal, Ulundurpet 606107, Tamil Nadu, India
4
Department of Materials Science and Engineering, Hongik University, 2639-Sejong-ro, Jochiwon-eup, Sejong City 30016, Korea
*
Authors to whom correspondence should be addressed.
These authors contributed equally to this work.
Sustainability 2022, 14(10), 6353; https://doi.org/10.3390/su14106353
Submission received: 14 April 2022 / Revised: 20 May 2022 / Accepted: 20 May 2022 / Published: 23 May 2022

Abstract

:
The present paper reports facile synthesis by simple chemical precipitation method for Zinc Oxide (ZnO) nanoparticles with cerium (Ce) and nickel (Ni) co-doped ZnO nanocrystals. The different optimum conditions are analyzed in dual metallic (Ce/Ni) nanoparticles doped with ZnO nanoparticles. Successful incorporation of cerium and nickel is predicted with X-ray diffraction (XRD) and X-ray photoelectron spectroscopy (XPS). Additionally, optical effects were studied as-prepared active materials by UV-Visible reflectance (UV-Vis-DRS) and photoluminescence (PL) measurements at room temperature. In addition, morphology investigations of the scanning electron microscope (SEM) and transmission electron microscope (TEM) are conducted. The results of electrochemical studies reveal that the co-doped product exhibits a higher H2O2 sensing response, with 46.21 μA/μM.cm2 for Ce/Ni-doped ZnO, which can use potentially for future biomedical applications.

1. Introduction

In the recent past, materials on the nanoscale were the prime focus among researchers because of their unique physicochemical properties. ZnO is an II–IV semiconductor family with a wide bandgap of 3.34 eV [1]. The peculiar conductive, photocatalytic, piezoelectric and pyroelectric properties [2,3] of zinc oxide have made it a promising material in sensors [3,4], photovoltaic and solar cell [5,6] applications. Although numerous reports are available on doped ZnO nanostructures, there are few reports on co-doped ZnO nanocrystals [7,8,9,10,11,12,13,14,15]. In the current status, the exposure of hydrogen peroxide (H2O2) has gained immense significance as sensing hazards chemicals in food, bio-medical resources pharmaceuticals and the environment [16,17,18,19]. Moreover, cerium (Ce) and lanthanum (La) rare-earth metals doped ZnO nanostructures were detected the hazardous materials for biosensing applications [17,18,19,20,21,22,23]. Previously, few reports on ZnO nanostructures aimed at H2O2 monitoring from biological targets, such as glucose, lactose and io-logical thin film samples [24,25]. The fields of study about the H2O2 levels using metal oxide nanoparticles ZnO, and tin oxide (SnO2) to resolve toxic materials using electrochemical bio-sensing applications [26]. An essential assignment of Titrimetry, spectrophotometry, chemiluminescence and electrochemical methods are used and developed to detect the H2O2 [27,28]. These methods, however, have certain limitations, for example, reagents are more expensive, the analysis time is lengthy, and continuing stability is very poor [29]. However, the drawbacks are rectified by using the electrochemical approaches to the measurement of H2O2 sensing. In the field of electrochemical biosensor applications, compounds such as tin oxide (SnO2) [30], tungsten oxide (WO2) [31], copper oxide (CuO) [32], titanium dioxide (TiO2) [33], magnesium oxide (SnO2) [34], cuprous oxide (Cu2O) [35] and zinc oxide (ZnO) have demonstrated outstanding performance in the biosensor and bio-electronic sensor fields among those materials with promising behavior of metal-oxide semiconductors [36].
In this work, we report the preparation of a modified electrode of ZnO by co-doping ZnO with cerium and nickel in appropriate proportions via a facile chemical precipitation process. The personalized electrode is analyzed on behalf of its sensing activity against H2O2. From the obtained results, it is obvious that the modified electrode of ZnO shows higher sensor activity than bare ZnO.

2. Materials and Methods

2.1. Chemicals

Zinc acetate dihydrate [Zn(CH3COO)2*2H2O], cerium (III) chloride heptahydrate [(CeCl3)*7H2O], nickel nitrate hexahydrate [Ni(NO3)2.6H2O] and ammonium carbonate ((NH4)2CO3) are used as precursors. All the chemicals are analytical reagent grade with 99.9% purity (Sigma-Aldrich, St. Louis, MI, USA) and use without any additional purification. Sample preparation and dilutions were made of ultrapure de-ionized (DI) water.

2.2. Synthesis of Co-Doped ZnO Nanoparticles

For the typical preparations of cerium and nickel-doped ZnO, firstly zinc acetate [Zn(CH3COO)2*2H2O] weighed 5.49g and (0.5 mol/L) was dissolved in 50 mL of deionized (DI) water with vigorous stirring by a magnetic stirrer. Additionally, a 0.05 mol/L solution of cerium (III) chloride heptahydrate [(CeCl3)*7H2O], prepared in 20 mL solutions was mixed with the above the solution mixture. After 35 min, nickel nitrate hexahydrate [Ni(NO3)2*6H2O], at different molar concentrations (0.025, 0.05, 0.075, 0.1 and 0.125 mol/L) equipped in 20 mL aqueous solution was added slowly into the above mixture of solutions. Finally, 5.64 g (1 mol/L) of (NH4)2CO3 in 50 mL of DI water was added gradually to the above the mixture. The entire mixture of solutions was continuously magnetic stirrer and finally until a get precipitate sediment has appeared. The obtained solid dispersions were cleaned using DI water with ethanol repeated numbers until the clear white powder was obtained. The optimized as-prepared metallic composites were dried overnight at 80 °C. Finally, the product was treated in annealing at 500 °C for 2 h using a box furnace. The as-prepared powders were agate mortar grinding at Pure ZnO, ZnO: Ce (0.05 M): Ni (0.025 M), ZnO: Ce (0.05 M): Ni (0.05 M), ZnO: Ce (0.05 M): Ni (0.075 M), ZnO: Ce (0.05 M): Ni (0.1 M), ZnO: Ce (0.05 M): Ni (0.125 M). A comparable sample of pure ZnO nanocrystals was prepared under the same above experimental procedure using without the addition of Ce and Ni.

2.3. Material Analysis and Instrumentations

The crystalline phase and particle size of pure and co-doped ZnO electrocatalytic materials were analyzed by X-ray diffraction (XRD) measurement which was carried out at room temperature by using X’PERT-PRO, PANalytical diffractometer using Cu Kα radiation (λ = 1.5405 Å). The HP 5950A Hewlett-model X-ray photoelectron spectroscopy (XPS) was examined by binding energy levels and oxidation states of ZnO, Ce and Ni. The bandgap energy of the prepared samples to be confirmed by UV-Vis NIR spectrophotometer (model: Varian-Carry 5000) at the range of 200–800 nm wavelengths in the solid barium sulfate (BaSO4) calibrated reference sample was made for the baseline alteration. The optical emission of the samples was recorded with a photoluminescence (PL) spectrofluorometer (Jobin Yvon, Fluorolog–FL3-11). Surface analysis micro-nano structure of the synthesized samples was done by HITACHI S-4700 scanning electron microscope (SEM) and confirmed the depth nanostructures morphologies through JEOL-3010 transmission electron microscopy (TEM).

2.4. Electrochemical Measurements

Electrochemical applications of H2O2 sensing were carried out in a three-electrode cell set-up using a CHI-600D electrochemical workstation. The expectable three-electrode cell with a platinum wire was used as the counter electrode and Ag/AgCl (dripping wet with KCl) as the reference electrode. The as-prepared all kinds of doped and un-doped binary metal nanoparticles composites were drop-casting coating with modified and polished glassy carbon electrode (GCE) with dia 3 mm) used as the working electrodes. The catalytic capability of zinc oxide toward H2O2 reduction was employed to be evaluated by cyclic voltammetry (CV) and chronoamperometric (CA) techniques. The amperometric measurements mini magnetically stirred the constant electrolyte molar concentrations. All the kinds of electrochemical analyses were used in a phosphate buffer solution (PBS). In the direction to avoid the decomposition of H2O2, it was slowly mixed with the stock solution in PBS. The impedance analysis delivers details to find the resistance of the material.

3. Results and Discussion

3.1. Structural Analysis

In Figure 1a, we have presented the X-ray diffracted patterns of pure ZnO and Zn0.95_xCe4+0.05NixO (x = 0.025, 0.05, 0.075, 0.1 and 0.125 M). The observed XRD patterns reveal that the samples are the hexagonal assembly of the zinc oxide (JCPDS card No: 36-1451) [15]. However, the intensity of diffraction peaks starts to reduce in the sample with x ≤ 0.025 M. No extra diffraction patterns follow-on from Ni or Nickel oxide can be discerned, which demonstrates the complete dispersion of the dopant. Later than a suspicious view of the XRD patterns, we calculate that the diffraction angle positions depend sensitively on the Ni concentration as shown in Figure 1b.
The lattice parameters of the products started to increase nearly with increasing Ni content for the doping regions x ≤ 0.05 M. At x > 0.05, the lattice parameters of the products exhibit a non-monotonical varying tendency. For all the concentration of doping is in good agreement with the gained c/a values in this work. Further, the crystallite sizes estimated using Scherrer’s formula exhibit a significant decrease in Ni doping as shown in Table 1.

3.2. XPS Analysis

Figure 2a shows significant peaks binding energy levels of Zn, Ni, Ce, O and carbon identifies using the XPS spectra of co-doped zinc oxide with 0.075 M of nickel. The depth profile XPS survey spectra of Ce, Ni, Zn, C, and O classes are displayed in parts of Figure 2b–e, respectively. The XPS binding energy (BeV) slightly appears to carbon (C1s) peak is considering reference peak C1s (285 eV). The Zn-metallic binding energies are 2p3/2 and 2p1/2 corresponding to strong peaks present at 1020.19 and 1043.29 eV respectively, as shown in Figure 2b, Zn 2p1/2 with the peak centered binding energy levels at 1021 eV was due to the metallic oxide nanoparticles incorporated into ZnO in oxygen-deprived areas [22,23].
The intense peak of oxygen binding energy levels O1s at 528.88 eV was attributed to regions in ZnO shown in Figure 2c. Three peaks are identified in the Ce 3d spectrum (Figure 2d). Cerium (Ce4+) incorporated in zinc oxide, the binding energies state of 3d3/2 and 3d5/2, is seen at 901.3, 908, 917 eV, and 882.6, 888.9 and 898.8 eV, respectively [36]. As shown in Figure 2e, the nickel-based binding energy 2p3/2 is observed at 855.46 eV; however, the peak Zn 2p1/2 is positioned binding energy at 873.1 eV. This result indicates that Ni ions in the products may have a valence of 2+ [36].

3.3. Optical Properties

3.3.1. UV-Vis Reflectance Spectroscopy

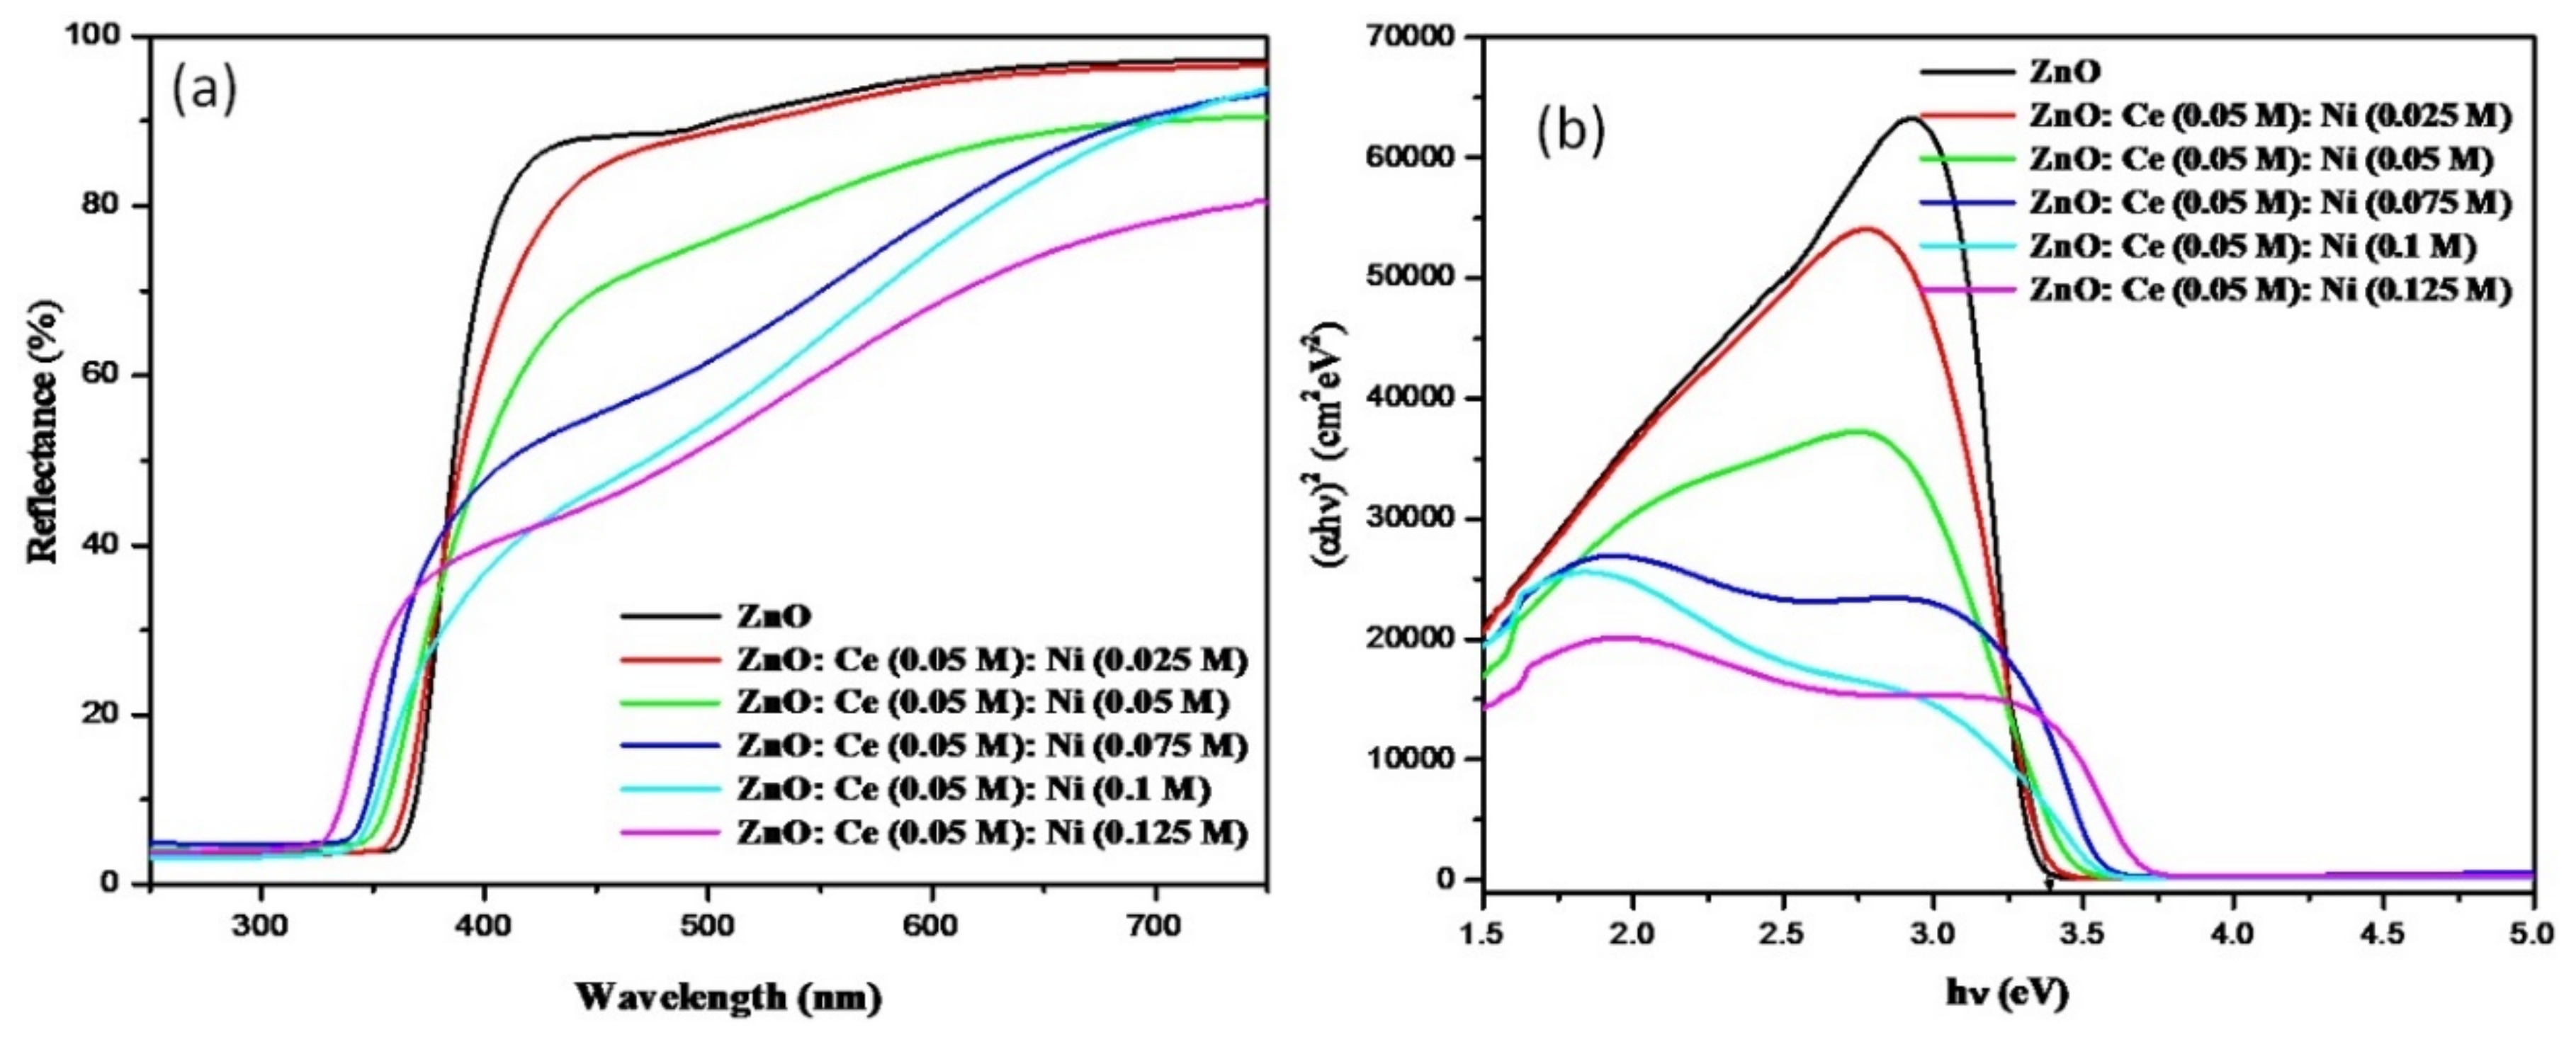
The UV-Vis spectroscopy was studied by the optical bandgap of the products between 250–750 nm. The intensity of reflectance decreases with the increase in Ni concentration. All the Ce and Ni-doped ZnO products were exhibit excellent optical properties in UV reflectance of 364–326 nm (Figure 3a). The pure ZnO and dual-metallic doped ZnO were estimated by extrapolation of the linear portion of (αhν)2 versus hν curve by using the Tauc plot relation [34]. From the plot, the bandgap values are 3.4 eV 3.43, 3.50, 3.58, 3.60 and 3.72 eV of ZnO, Ce/Ni-ZnO with, 0.025, 0.05, 0.075, 0.1 and 0.125 M of nickel ions, respectively (Figure 3b).
The optical band gap values were shown in gradually increase for all the concentrations of doping samples. The principle of the Moss–Burstein band filling effect can be explained by an increase in the carrier concentration for optical energy at a wide bandgap, which is related to n-type semiconductors materials.

3.3.2. Photoluminescence (PL) Analysis

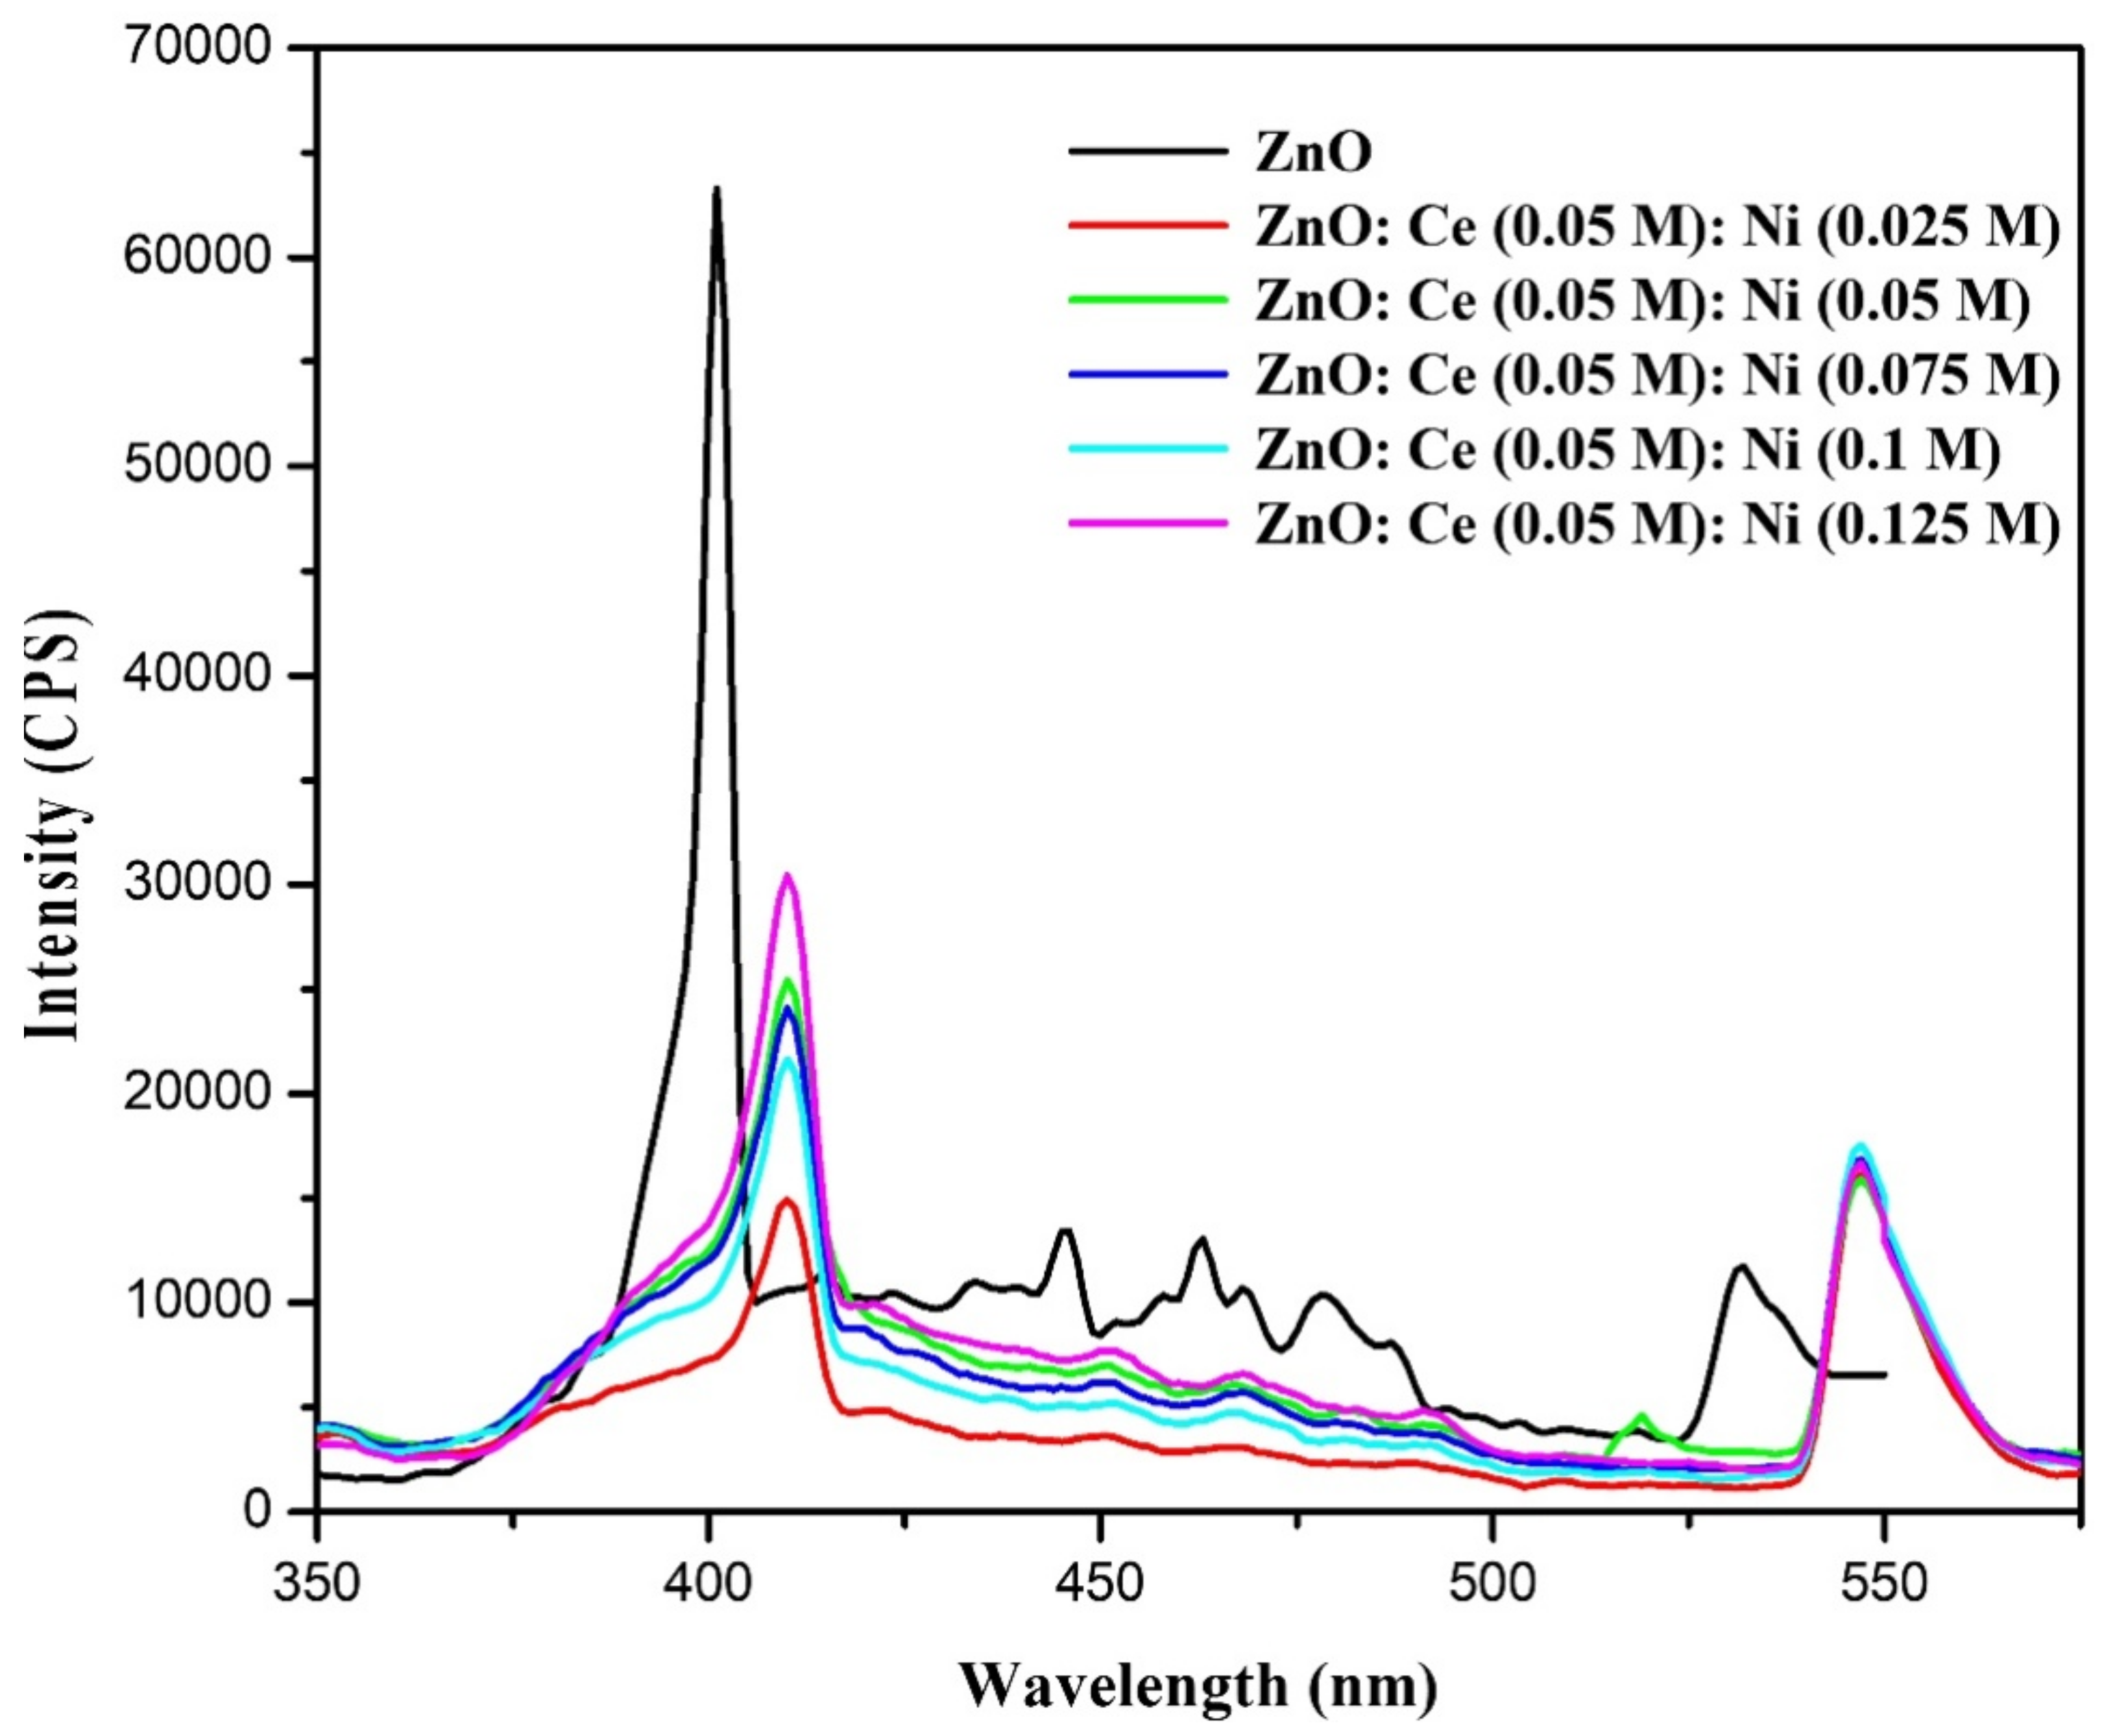
The optical emission and defect formation of Pure ZnO and Ce/Ni-doping zinc oxide were examined via PL measurements. An undoped and Ce/Ni-ZnO nanoparticles PL spectra are shown in Figure 4, pure ZnO exhibits a strong UV emission at 399 nm and four weak visible emissions at 443, 465, 480 and 526 nm, respectively.
The strong and narrow UV emission at 399 nm is recognized as the near band edge emission of ZnO, originating from the excitonic transitions among the electrons in the conduction bands and the holes in the valence bands [37]. However, all the ZnO and Ce/Ni-ZnO samples displayed only one in the UV region (410 nm) and the others in the visible region (545 nm), which can be attributed to the single-ionized oxygen vacancies [38]. It is observed that the UV emission peaks are red-shifted with intensity quenching following an increase in Ni content. The non-radiative recombination of excitons wavelengths can be credited to intensity quenching. Alternatively, all the co-doped products exhibit intense visible emission at 537 nm compared to undoped ZnO, signifying the doping-concentration dependable point defects muti peak PL emission ranging from blue region to red region identical co-existence of interstitial zinc (Zni) and zinc vacancy (VZn).

3.4. FT-IR Analysis

FT-IR spectra of pure ZnO compared to dual-doped ZnO nanoparticles are shown in Figure 5. IR transmittance peaks at around 428 cm−1 associated with the stretching bond, which confirms that the octahedral coordination shows the FT-IR spectrum of ZnO. On co-doping, stretching vibrations of ZnO were broadened and shifted to higher frequencies following increases in Ce, Ni dual-doping concentration in ZnO. The appreciable shifts in the frequency with nickel (Ni) doping concentration are caused by differences in the band lengths that occur when Ni2+ ions substitute into Zn2+ ions in the ZnO crystal lattice. The wide absorption band appearing at about 3431 and 1631 cm−1 could be ascribed to the O-H stretching, respectively. All the doped products exhibit few addition bands at around 1514, 1385, 1018 and 858 cm−1. The absorption band appearing at 1514 cm−1 was credited to CO2 for asymmetric stretching vibration. The existence of an absorption peak located at 1385 cm−1 is observed in ammonium ion angular distribution. A stretching vibration mode of C=C and O-C-O bonds in acetate ions absorption band at around 1018 cm−1. Additionally, 854 cm−1 may be ascribed to the C-H bending plane’s broad and visible appearance.

3.5. Morphological Characterization

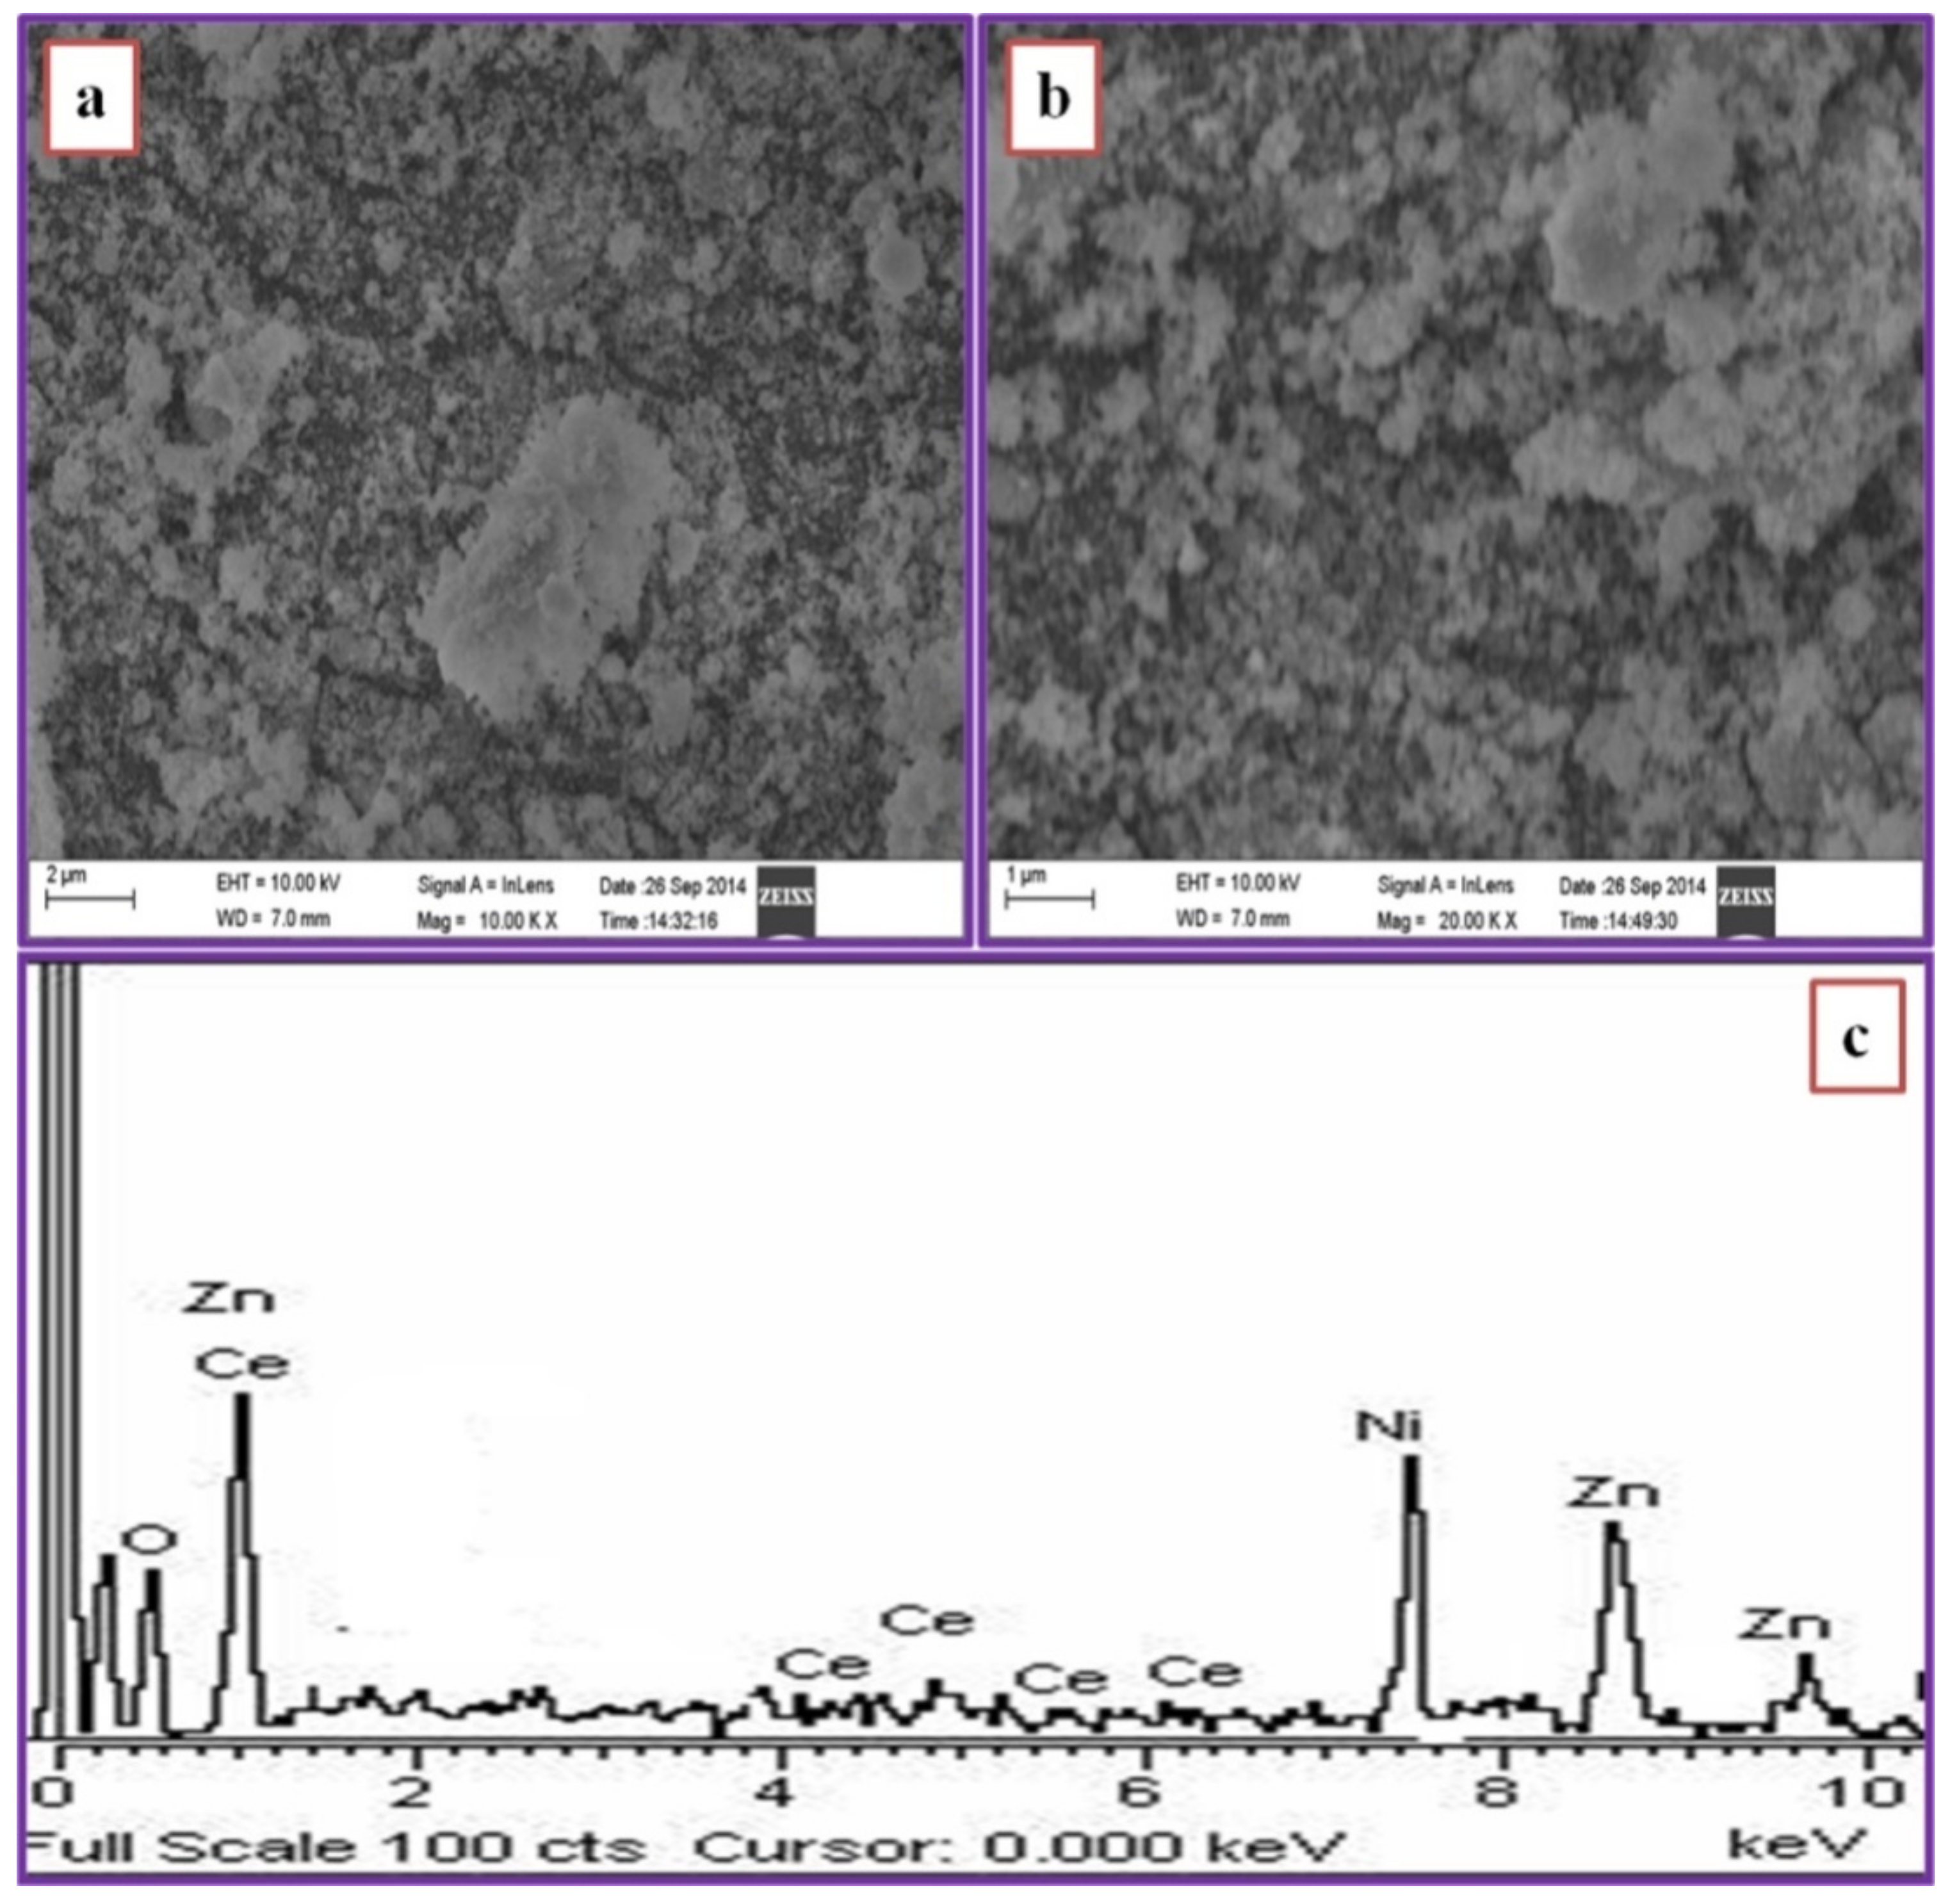
Figure 6a,b shows FE-SEM morphologies of the dual-doped ZnO with Ni concentration 0.075 M analyzed. The FE-SEM images reveal a densely populated spherical particle with a typical dia at <100 nm. The elemental composition indexed by EDX analysis confirms the presence of dopant ions cerium and nickel (Figure 6c).
To ascertain the high resolutions, morphological HR-TEM was recorded for pure ZnO and co-doping samples, Figure 7a shows the HR-TEM image of co-doped ZnO. As shown in the HR-TEM image, the structural patterns are identical to the undoped ZnO, revealing that the co-doping does not alter the actual hexagonal structure of ZnO. The TEM image of co-doped ZnO exhibits size in the range of 15–20 nm spherical particles with partially agglomerated (Figure 7b). The selected area diffracted patterns (SEAD) are distinct circular rings that show a co-doped ZnO pattern of a crystalline nature (Figure 7c).

3.6. Electrochemical Characterization

The electrochemical sensitivity of hydrogen-peroxide aims to apply as-prepared pure ZnO and co-doped Ce-Ni doped ZnO nanostructures as active electrode materials toward H2O2 sensing over the electro-reduction process. The electrochemical analysis of cyclic voltammetry (CVs) was recorded at various sweep rates of 50–500 mV/s with H2O2 in 2 mM C6N6FeK3 with a mixture of 0.5 M, KCl solution. From the CV curves, it is observed that a pair of redox peaks is clearly seen for all sweep rates, revealing the pseudocapacitance behavior.
Figure 8a,b presents the CV curvatures of pure ZnO and Ce/Ni- ZnO, the reduction of ZnO into Zn2+ reveals that cathodic peaks and the formation of ZnO demonstrate anodic peaks. The anodic and cathodic peaks were increased and, when increased the scan/sweep rate (mV/s) increased, the redox shape of the CV curves changed respectively. The Ce/Ni-ZnO electrode shows a higher peak current and high electrochemical active area, associated with undoped ZnO. Consequentially, the improvement of reaction kinetics and better electrode utilization resulted from the square root of sweep rate (mV/s)2, which is favorable in the H2O2 sensor applications for our doped-active materials. The peak current (Ip) increased linearly both in the anodic and cathodic directions (R2 = 0.99) (here, R2 is scan/sweep rate (mV/s)2), as indicated in Figure 8c.

3.7. Electrochemical Impedance Spectroscopy (EIS)

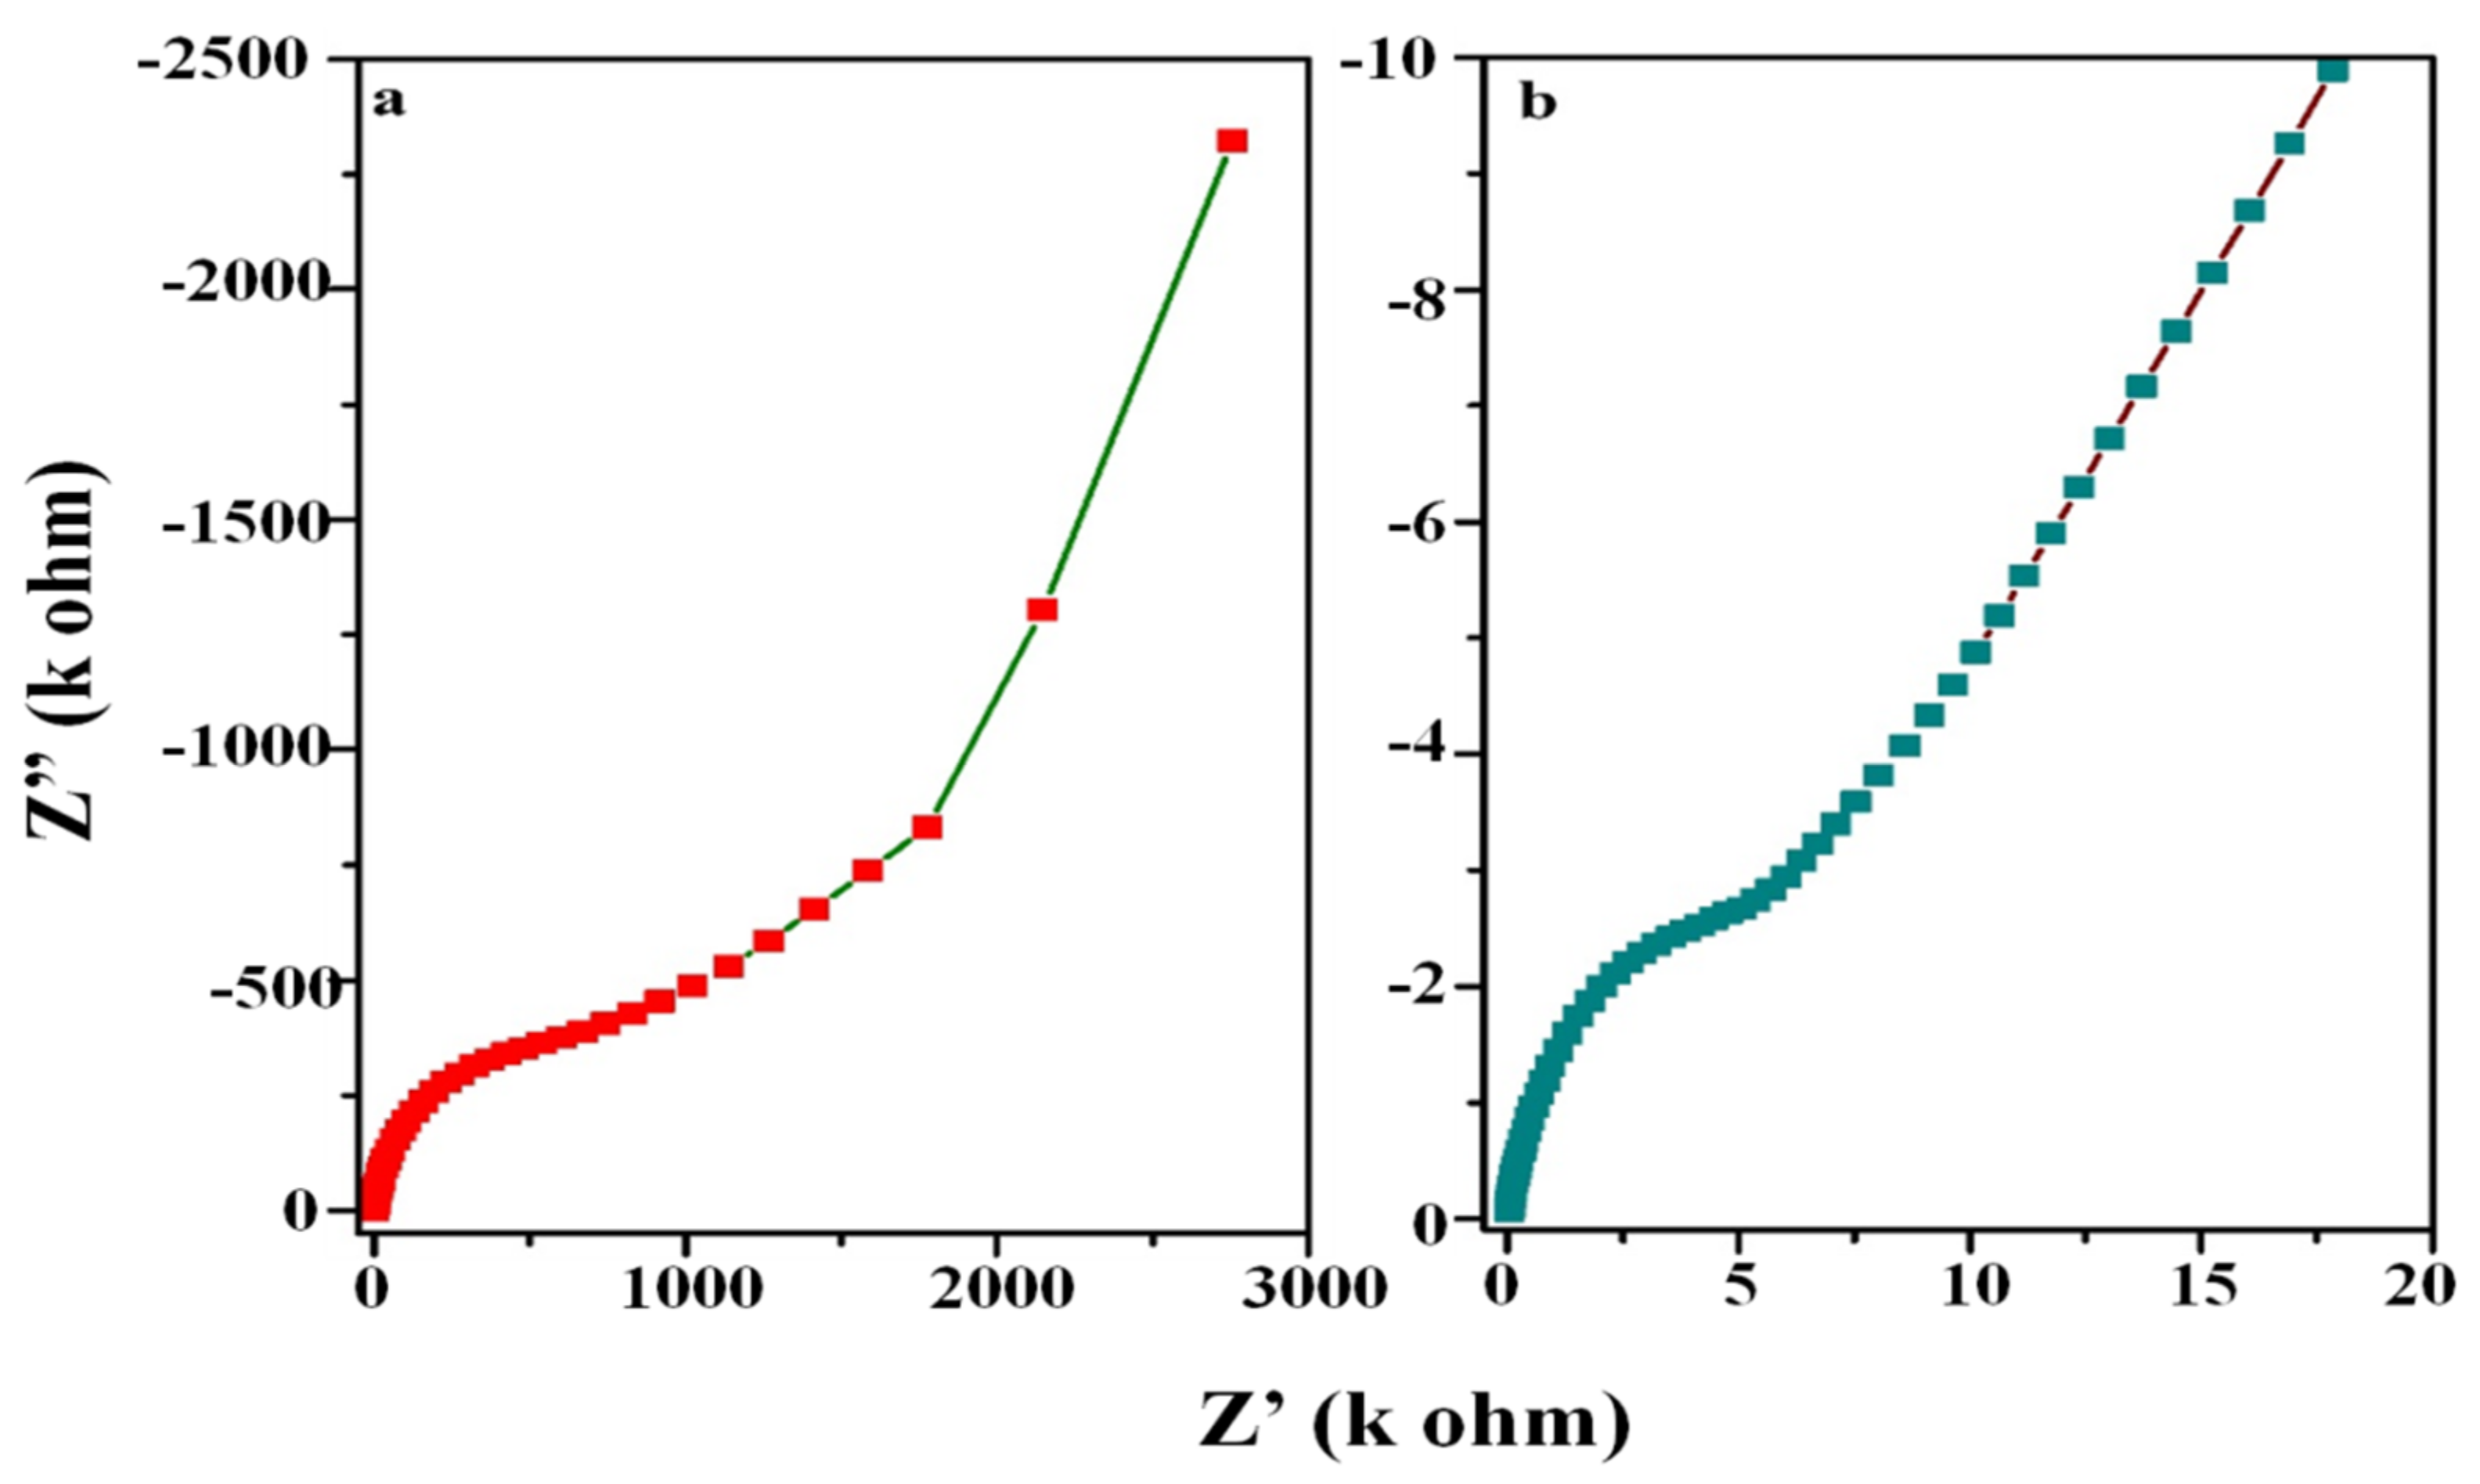
In order to ascertain the feasibility of the as-prepared duel-doped electrode for electrode active materials and electro-electrolyte charge transfer resistance (Rct) measurement, the electrochemical impedance spectra were recorded for both un-doped and co-doped electrodes of pure ZnO, as shown Figure 9a,b. The EIS spectra show both pure ZnO and Ce/Ni-doped ZnO electrodes in the high-frequency region at the semicircular arc and low-frequency straight line the Warburg impedance (WΩ). The measurement from the EIS spectrum is Rct-295 Ω, whereas it is reduced to Rct-6.25 Ω for active electrode materials of co-doped ZnO, suggesting it has low resistance and is a good potential candidate for electro-catalytic H2O2 sensing applications.

3.8. Electrochemical Performance of Bare and Ce/Ni-ZnOfor H2O2 Sensing

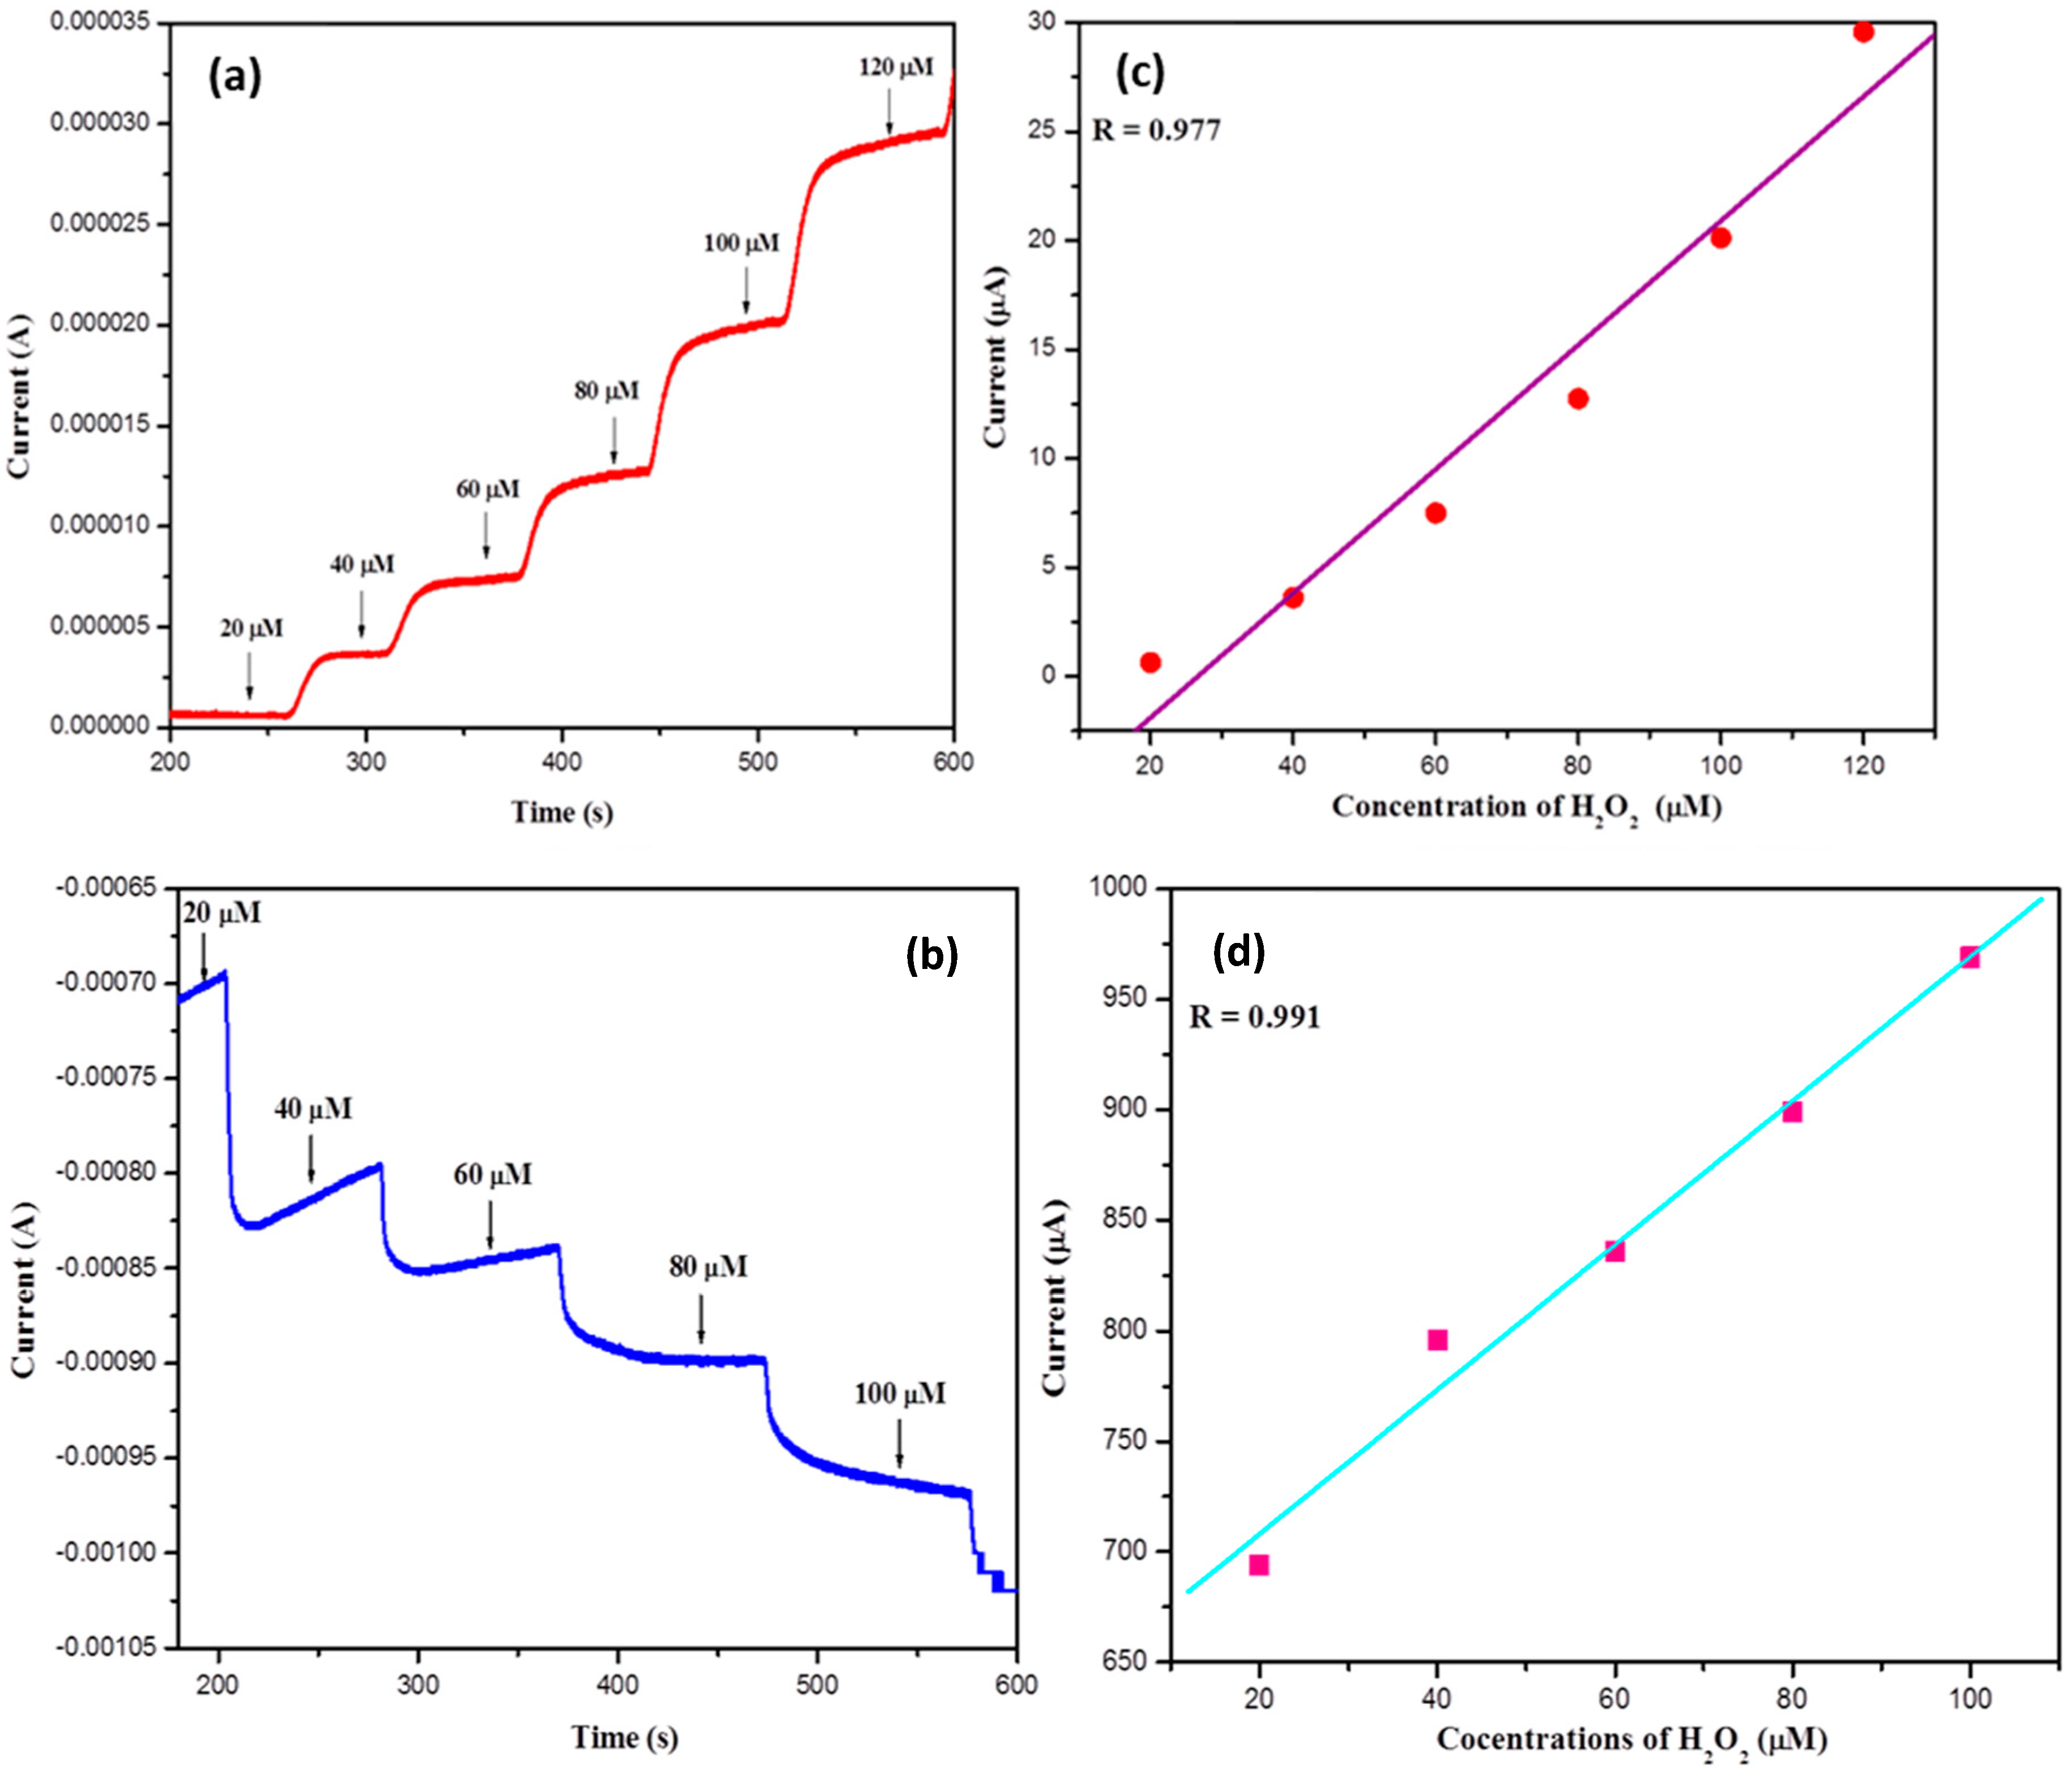
The electrocatalytic sensing of the amperometric detection method at various concentrations upon successive addition of H2O2 of the pure ZnO electrode and Ce/Ni-doped ZnO electrode were investigated, as shown in Figure 10a,b respectively. Figure 10 shows a rapid rise in step current upon the addition of H2O2, equally evident in un-doped and Ce/Ni-doped electrodes of ZnO. The calibration curves the cathodic current rise depending on the concentration of hydrogen peroxide in both the cases of electrodes, as shown in Figure 10c,d.
The amperometric current vs. time detection of H2O2 values at 0.979 and 0.991 are correlation coefficients of bare zinc oxide and Ce/Ni-doped ZnO electrodes, respectively. Based on the amperometric current indication ratio of 3.0 and pure ZnO and H2O2 sensor, these exhibit a detection with the border of 26.92 μM from the projected slope of the curve, and its sensitivity is 3.686 μA/μM.cm2. However, a finding perimeter of 15.89 μM is observed; in addition, H2O2 sensitivity is 46.21 μA/μM.cm2, corresponding to the Ce/Ni-ZnO materials. Many researchers have reported biosensing applications based on ZnO nanoparticles with a reduction of H2O2 [38,39].

4. Conclusions

We have successfully developed an electrocatalytic-amperometric detection technique for H2O2 sensor applications using pure ZnO and cerium and nickel co-doped ZnO nanoparticles. The electrocatalytic active materials were cerium and nickel-doped ZnO synthesized via a facile chemical precipitation technique, and their structural and morphological structures were analyzed. The XRD examination to find the wurtzite phase of zinc oxide confirms structural analysis for all concentrations of Ce and Ni incorporation. With an increase in nickel (Ni) concentration, the photo-luminescence spectrum of Ce/Ni-ZnO showed that the UV spectrum suppressed and improved defects related to the green emission region. The grain sizes decreased with co-doped samples showing the morphological analyses. Finally, we achieved a good current response amperometric (I) vs. time (s) detection of H2O2. In addition, the sensitivity is 46.21 μA/μM.cm2 and obtains the concentration range of 15.89 μM for the modified electrode of Ce/Ni-doped ZnO. The Ce/Ni-ZnO electrode gives higher sensory H2O2 detection activity than the pure ZnO. This result indicates that dual-doped ZnO nanostructures exhibit good response for future electrochemical sensing applications.

Author Contributions

First authors N.S. and V.T. equally contributed to the paper. N.S. and V.T. conceived the presented idea and processed the experimental data writing. K.M. and N.J. performed the analysis and drafted the manuscript with data collections. N.K. worked on the technical details, designed the figures, and wrote the manuscript. J.K., contributed to project administration and funding acquisition. D.C. contributed to conceptualization, investigation, writing, project administration, and funding acquisition. All authors have read and agreed to the published version of the manuscript.

Funding

This work has supported by the National Research Foundation of Korea (NRF) grant funded by the Korea government (MSIT) (No: 2022R1A2C1005357), and this research was funded by International Science & Business Belt support program, through the Korea Innovation Foundation funded by the Ministry of Science and ICT (No: 1711149716).

Institutional Review Board Statement

Not applicable.

Conflicts of Interest

The authors declare no conflict of interest.

References

  1. Hammad, T.M.; Salem, J.K. Synthesis and characterization of Mg-doped ZnO hollow spheres. J. Nanopart. Res. 2011, 13, 2205–2212. [Google Scholar] [CrossRef]
  2. Xu, C.X.; Sun, X.W.; Zhang, X.H.; Ke, L.; Chua, S.J. Photoluminescent properties of copper-doped zinc oxide nanowires. Nanotechnology 2004, 15, 856. [Google Scholar] [CrossRef]
  3. Klingshirn, C. ZnO: Material, Physics and Applications. ChemPhysChem 2007, 8, 782–803. [Google Scholar] [CrossRef] [PubMed]
  4. Wang, Z.L.; Song, J.H. Piezoelectric Nanogenerators Based on Zinc Oxide Nanowire Arrays. Science 2006, 312, 242. [Google Scholar] [CrossRef] [PubMed]
  5. Huang, G.J.; Wang, J.B.; Zhong, X.L.; Zhou, G.C.; Yan, H.L. Synthesis, structure, and room-temperature ferromagnetism of Ni-doped ZnO nanoparticles. J. Mater. Sci. 2007, 42, 6464–6468. [Google Scholar] [CrossRef]
  6. Chen, Y.; Ding, M.H.; Sun, S. Preparation and Characterization of ZnO Nanoparticles Supported on Amorphous SiO2. Nanomaterials 2017, 7, 217. [Google Scholar] [CrossRef] [Green Version]
  7. Seetha, M.; Bharathi, S.; Raj, A.D.; Mangalaraj, D.; Nataraj, D. Optical investigations on indium oxide nano-particles prepared through precipitation method. Mater. Charact. 2009, 60, 1578–1582. [Google Scholar] [CrossRef]
  8. Zhang, Z.Y.; Bao, C.G.; Yao, W.J.; Ma, S.Q.; Zhang, L.L.; Hou, S.Z. Influence of deposition temperature on the crystallinity of Al-doped ZnO thin films at glass substrates prepared by RF magnetron sputtering method. Superlattices Microstruct. 2011, 49, 644–653. [Google Scholar] [CrossRef]
  9. Gu, H.; Jiang, Y.; Yan, M. Defect-induced room temperature ferromagnetism in Fe and Na co-doped ZnO nanoparticles. J. Alloy. Compd. 2012, 521, 90. [Google Scholar] [CrossRef]
  10. Li, H.; Zhang, Z.; Huang, J.; Liu, R.; Wang, Q. Optical and structural analysis of rare earth and Li co-doped ZnO nanoparticles. J. Alloy. Compd. 2013, 550, 526. [Google Scholar] [CrossRef]
  11. Bai, Y.F.; Wang, Y.X.; Yang, K.; Zhang, X.R.; Song, Y.L. Enhanced upconverted photoluminescence in Er3+ and Yb3+ codopedZnO nanocrystals with and without Li+ ions. Opt. Commun. 2008, 281, 5448. [Google Scholar] [CrossRef]
  12. Lang, J.H.; Lia, X.; Yang, J.H.; Yang, L.L.; Zhang, Y.J.; Yan, Y.S.; Han, Q.; Wei, M.B.; Gao, M.; Liu, X.Y.; et al. Rapid synthesis and luminescence of the Eu3+, Er3+ co-doped ZnO quantum-dot chain via chemical precipitation. Appl. Surf. Sci. 2011, 257, 9574. [Google Scholar] [CrossRef]
  13. Tamilalagan, E.; Selvi, S.V.; Chen, S.-M.; Akilarasan, M.; Maheshwaran, S.; Chen, T.-W.; Al-Mohaimeed, A.M.; Al-Onazi, W.A.; Elshikh, M.S.; Liu, X. Fabrication of p-n Junction (Ni/Zn)O and Reduced Graphene Oxide (rGO) Nanocomposites for the Electrocatalysis of Analgesic Drug (Acetaminophen) Detection in Pharmaceutical and Biological Samples. J. Electrochem. Soc. 2021, 168, 036501. [Google Scholar] [CrossRef]
  14. Renganathan, V.; Balaji, R.; Chen, S.M.; Kogularasu, S.; Akilarasan, M. Bifunctional bimetallic heterojunction material based on Al2O3/ZnO micro flowers for electrochemical sensing and catalysis. Ecotoxicol. Environ. Saf. 2019, 176, 250–257. [Google Scholar] [CrossRef] [PubMed]
  15. Kogularasua, S.; Akilarasana, M.; Chena, S.-M.; Chena, T.-W.; Lou, B.-S. Urea-based morphological engineering of ZnO; for the biosensing enhancement towards dopamine and uric acid in food and biological samples. Mater. Chem. Phys. 2019, 227, 5–11. [Google Scholar] [CrossRef]
  16. D’Alessandro, A.; Coffetti, D.; Crotti, E.; Coppola, L.; Meoni, A.; Ubertini, F. Self-Sensing Properties of Green Alkali-Activated Binders with Carbon-Based Nanoinclusions. Sustainability 2020, 12, 9916. [Google Scholar] [CrossRef]
  17. Iqbal, J.; Liu, X.F.; Zhu, H.C.; Wu, Z.B.; Zhang, Y.; Yu, D.P.; Yu, R.H. Raman and highly ultraviolet red-sifted near band edge properties of LaCe co-doped ZnO nanoparticles. Acta Mater. 2009, 57, 4790. [Google Scholar] [CrossRef]
  18. Tana, W.K.; Razak, K.A.; Lockman, Z.; Kawamura, G.; Muto, H.; Matsuda, A. Photoluminescence properties of rod-like Ce-doped ZnO nanostructured films formed by hot-water treatment of sol-gel derived coating. Opt. Mater. 2013, 35, 1902. [Google Scholar] [CrossRef]
  19. Ri, K.H.; Wang, Y.B.; Zhou, W.L.; Gao, J.X.; Wang, X.J.; Yu, J. The structural properties of Al-doped ZnO films depending on the thickness and their effect on the electrical properties. Appl. Surf. Sci. 2011, 258, 1283. [Google Scholar] [CrossRef]
  20. Shin, B.K.; Lee, T.I.; Kar, J.P.; Lee, M.J.; Park, K.I.; Ahn, K.J.; Yeom, K.Y.; Cho, J.H.; Myoung, J.M. Effect of deposition power on structural and electrical properties of Al-doped ZnO films using pulsed direct-current magnetron sputtering with single cylindrical target. Mat. Sci. Semicon. Proc. 2011, 14, 23. [Google Scholar] [CrossRef]
  21. Lin, J.-C.; Peng, K.-C.; Yeh, T.-Y.; Lee, S.-L. On the Structure and Characterization of Al, Sc-Co-Doped ZnO-Films Varying with 0–2.37 wt.% Sc Contents. Thin Solid Film. 2009, 517, 4715. [Google Scholar] [CrossRef] [Green Version]
  22. Larachi, F.; Pierre, J.; Adnot, A.; Bernis, A. Ce 3d XPS study of composite CexMn1xO2 y wet oxidation catalysts. Appl. Surf. Sci. 2002, 195, 236. [Google Scholar] [CrossRef]
  23. Galtayries, A.; Blanco, G.; Cifredo, G.A.; Finol, D.; Gatica, J.M.; Pintado, J.M. XPS Analysis and Microstructural Characterization of a Ce/Tb Mixed Oxide Supported on a Lanthana-modified Transition Alumina. Surf. Interface Anal. 1999, 27, 941. [Google Scholar] [CrossRef]
  24. Wang, J.; Xu, M.; Zhao, R.; Chen, G. A highly sensitive H2O2 sensor based on zinc oxide nanorod arrays film sensing interface. Analyst 2010, 135, 1992–1996. [Google Scholar] [CrossRef] [PubMed]
  25. Liu, J.; Li, Y.; Huang, X.; Zhu, Z. Tin Oxide Nanorod Array-Based Electrochemical Hydrogen Peroxide Biosensor Biosens. Nanoscale Res. Lett. 2010, 5, 1177–1181. [Google Scholar] [CrossRef] [PubMed] [Green Version]
  26. Komazaki, Y.; Inoue, T.; Tanaka, S. Automated measurement system for H2O2 in the atmosphere by diffusion scrubber sampling and HPLC analysis of Ti(IV)-PAR-H2O2 complex. Analyst 2001, 5, 587–593. [Google Scholar] [CrossRef] [PubMed]
  27. Gao, P.; Liu, D. Facile synthesis of copper oxide nanostructures and their application in non-enzymatic hydrogen peroxide sensing. Sens. Actuators B Chem. 2015, 208, 346–354. [Google Scholar] [CrossRef]
  28. Sivalingam, D.; Gopalakrishnan, J.B.; Krishnan, U.M.; Madanagurusamy, S.; Rayappan, J.B.B. Nanostructured ZnO thin film for hydrogen peroxide sensing. Phys. E Low Dimens. Syst. Nanostruct. 2011, 43, 1804–1808. [Google Scholar] [CrossRef]
  29. Deng, Z.; Gong, Y.; Luo, Y.; Tian, Y. WO3 nanostructures facilitate electron transfer of enzyme: Application to detection of H2O2 with high selectivity. Biosens. Bioelectron. 2009, 24, 2465–2469. [Google Scholar] [CrossRef]
  30. Fratoddi, I.; Macagnano, A.; Battocchio, C.; Zampetti, E.; Venditti, I.; Russo, M.V.; Bearzotti, A. Platinum nanoparticles on electrospuntitania nanofibers as hydrogen sensing materials working at room temperature. Nanoscale 2014, 6, 9177–9184. [Google Scholar] [CrossRef]
  31. Zhao, J.; Qin, L.; Hao, Y.; Guo, Q.; Mu, F.; Yan, Z. Application of tubular tetrapod magnesium oxide in a biosensor for hydrogen peroxide. Microchim. Acta 2012, 178, 439–445. [Google Scholar] [CrossRef]
  32. Xu, F.; Deng, M.; Li, G.; Chen, S.; Wang, L. Electrochemical behavior of cuprous oxide-reduced graphene oxide nanocomposites and their application in nonenzymatic hydrogen peroxide sensing. Electrochim. Acta 2013, 88, 59–65. [Google Scholar] [CrossRef]
  33. Al-Hardan, N.H.; Jalar, A.; Hamid, M.A.A.; Keng, L.K.; Shamsudin, R.; Majlis, B.Y. The room-temperature sensing performance of ZnO nanorods for 2-methoxyethanol solvent. Sens. Actuators B Chem. 2014, 203, 223–228. [Google Scholar] [CrossRef]
  34. Kannadasan, N.; Shanmugam, N.; Cholan, S.; Sathishkumar, K.; Poonguzhali, R.; Viruthagiri, G. Synergistic effect of bimetal ions (Ce, Pb) incorporation on optical, structural, and sensory activity of ZnO nanocrystals. J. Solid State Electrochem. 2015, 19, 757–768. [Google Scholar] [CrossRef]
  35. Zhang, Y.; Bai, X.; Wang, X.; Shiu, K.-K.; Zhu, Y.; Jiang, H. Highly sensitive graphene–Pt nanocomposites amperometric biosensor and its application in living cell H2O2 detection. Anal. Chem. 2014, 86, 9459. [Google Scholar] [CrossRef]
  36. Xu, C.X.; Zhu, G.P.; Li, X.; Yang, Y.; Tan, S.T.; Sun, X.W.; Smith, T.A. Growth and spectra analysis of ZnO nanotubes. J. Appl. Phys. 2008, 103, 094303–094305. [Google Scholar] [CrossRef]
  37. Zheng, Y.; Wang, Z.; Peng, F.; Fu, L. Application of biosynthesized ZnO nanoparticles on an electrochemical H2O2 biosensor. Braz. J. Pharm. Sci. 2016, 52, 781–786. [Google Scholar] [CrossRef] [Green Version]
  38. Aydoğdu, G.; Zeybek, D.K.; Pekyardımcı, Ş.; Kılıç, E. A novel amperometric biosensor based on ZnO nanoparticles-modified carbon paste electrode for determination of glucose in human serum. Artif. Cells Nanomed. Biotechnol. 2013, 41, 332–338. [Google Scholar] [CrossRef]
  39. Zhu, X.; Yuri, I.; Gan, X.; Suzuki, I.; Li, G. Electrochemical study of the effect of nano-zinc oxide on microperoxidase and its application to more sensitive hydrogen peroxide biosensor preparation. Biosens. Bioelectron. 2007, 22, 1600–1604. [Google Scholar] [CrossRef]
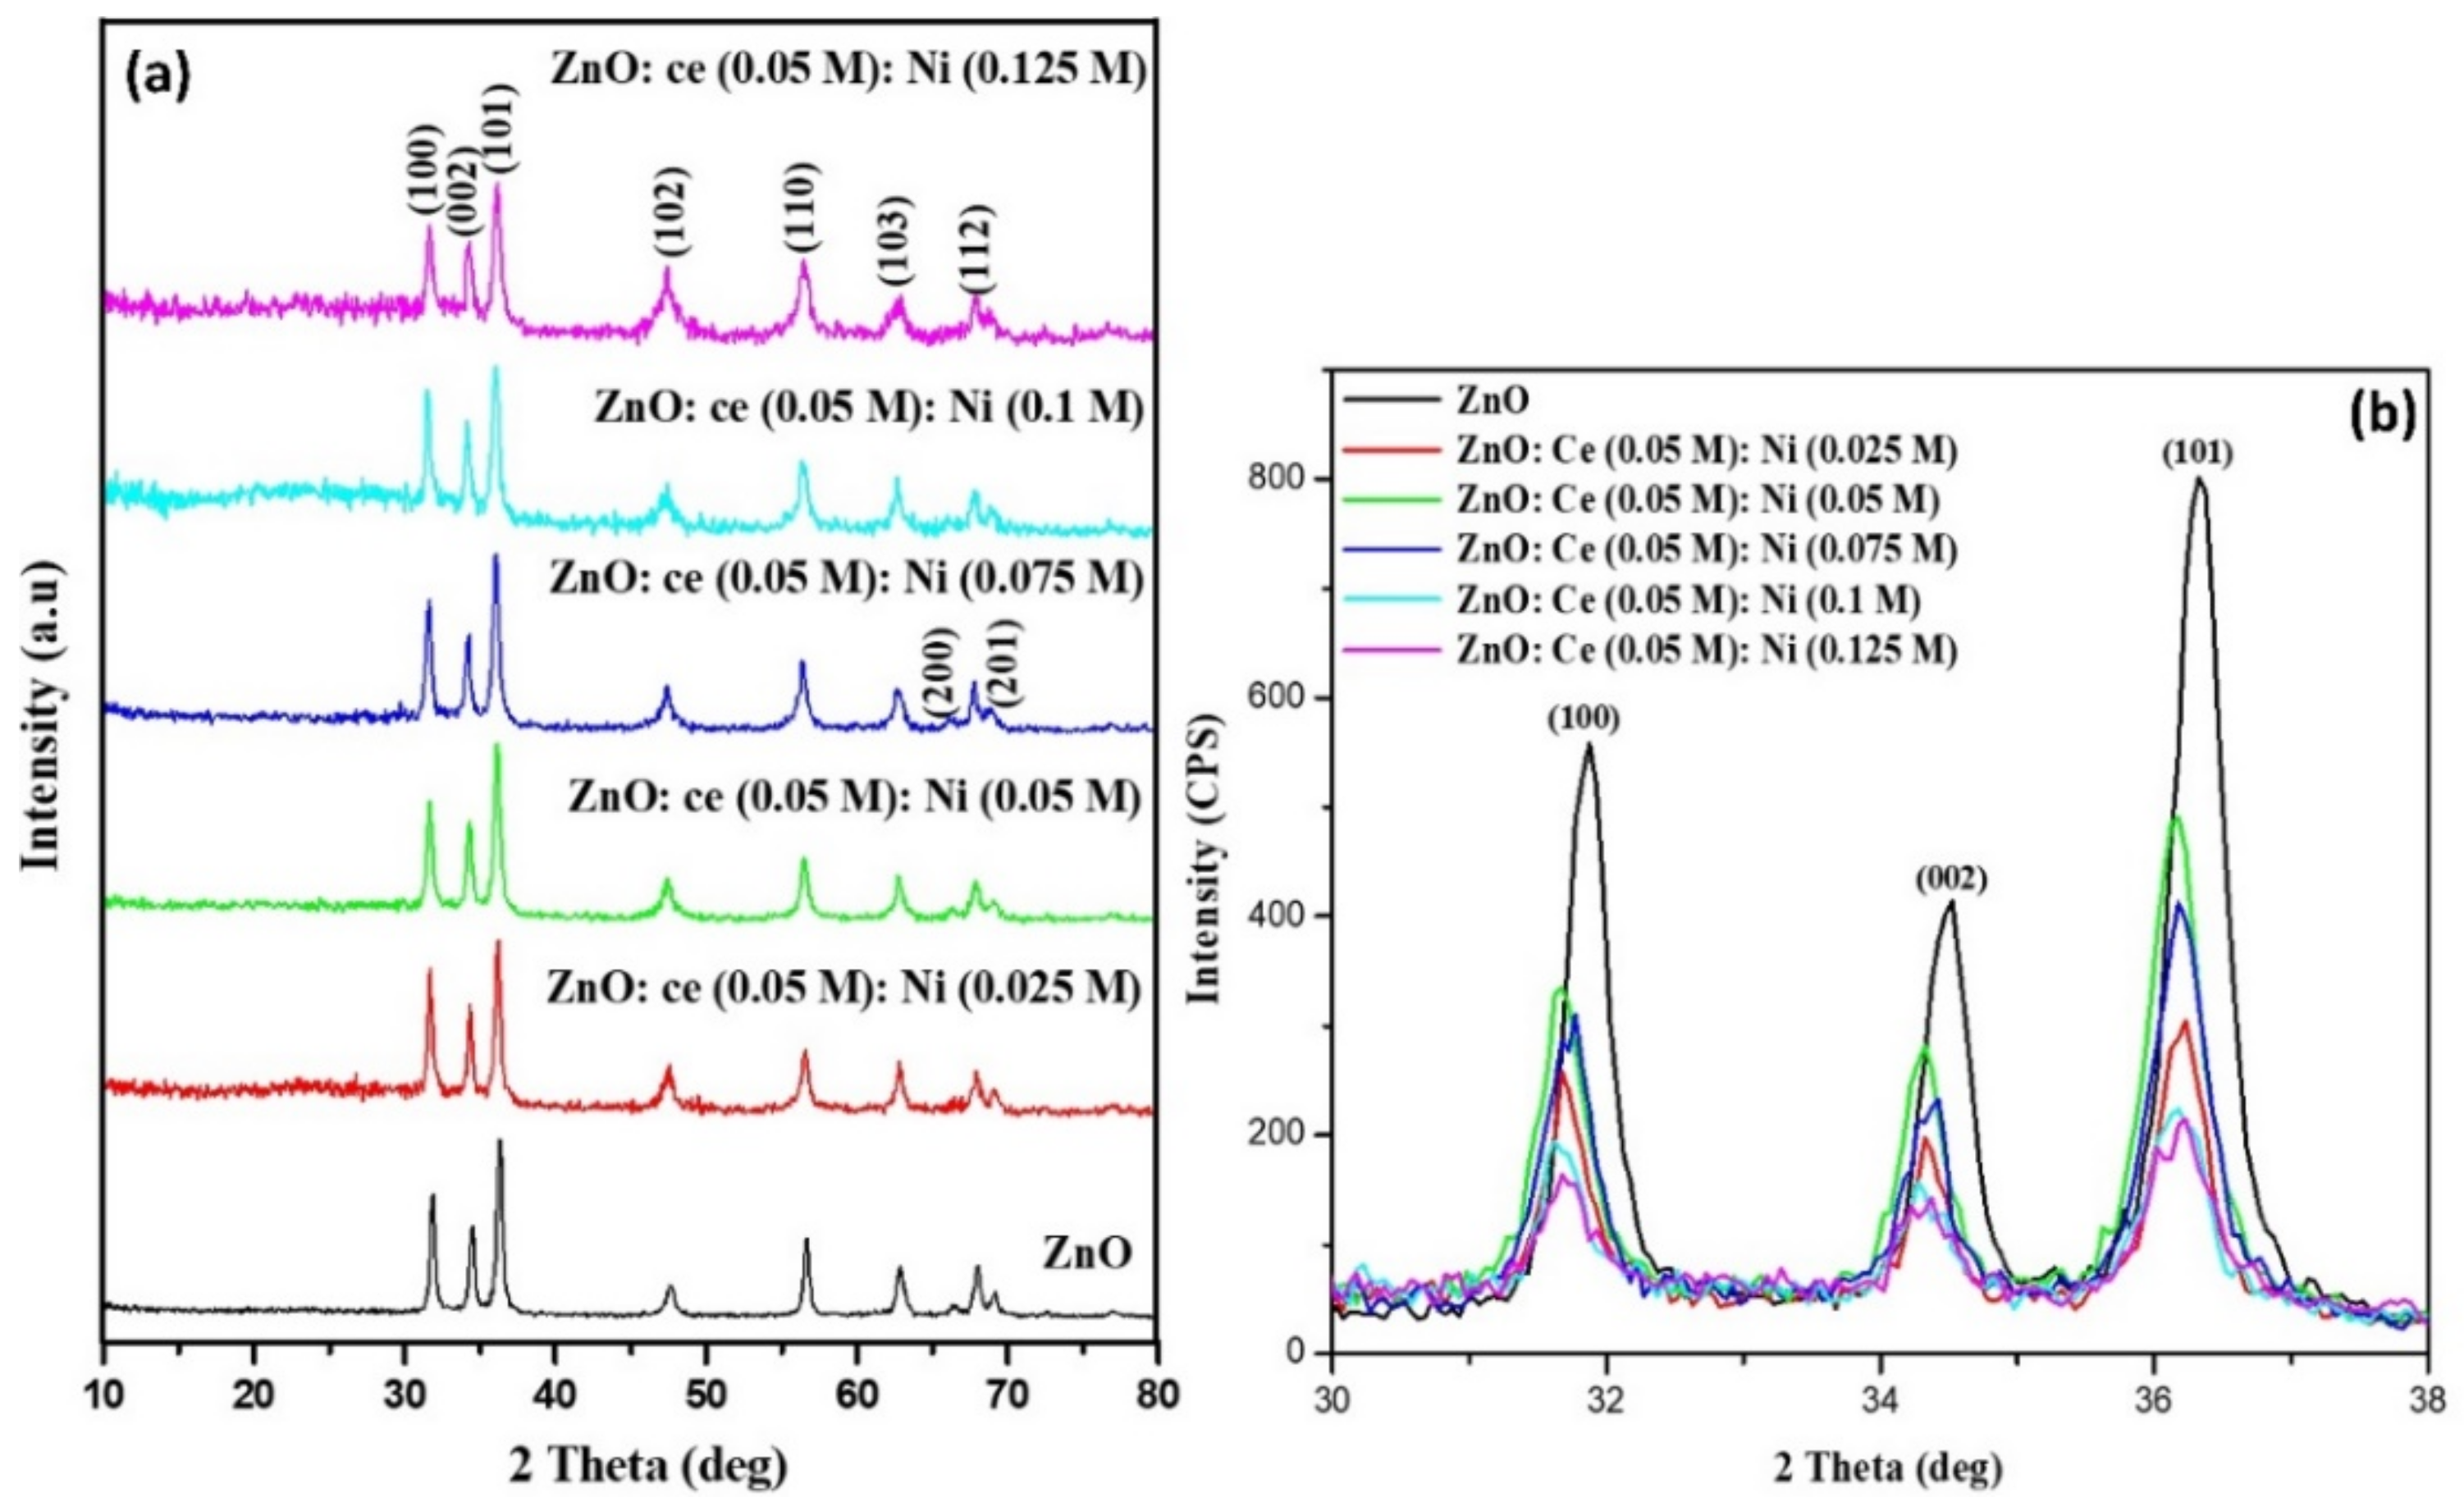
Figure 1. (a) XRD patterns (b) planes enlarged view of (100), (002) and (101) peaks of pure ZnO and Ce/Ni-ZnO nanoparticles.
Sustainability 14 06353 g001
Figure 2. (a) XPS overall survey spectrum of Ce/Ni-doped [Ce (0.05 M), Ni (0.075 M)] ZnO nanostructures; (be) XPS depth profile of binding energies of Zn 2p, Ce 3d, O1s, Ni 2p.
Sustainability 14 06353 g002
Figure 3. (a) UV-Vis-diffuse reflectance spectra and (b) curves of bandgap energy for pure Ce/Ni-ZnO.
Sustainability 14 06353 g003
Figure 4. PL emission spectrum of ZnO and Ce/Ni-ZnO nanostructures.
Sustainability 14 06353 g004
Figure 5. FT-IR spectra of pure and Ce/Ni-ZnO nanostructures.
Sustainability 14 06353 g005
Figure 6. (a,b) FE-SEM images of Ce/Ni-ZnO [Ce4+ (0.05 M) and Ni ions (0.075 M)] composite nanostructures, (c) corresponding EDX pattern.
Sustainability 14 06353 g006
Figure 7. (a) HR-TEM micrographs of Ce/NiZnO [Ce (0.05 M) and Ni (0.075 M)] nanostructures, (b) consistent HR-TEM images and (c) SAED pattern.
Sustainability 14 06353 g007
Figure 8. (a,b) Cyclic voltammetry curves of Ce/Ni-ZnO [Ce4+ 0.05 M] &Ni (0.075 M)] active electrodes in 2 mM, K3[Fe(CN)6] with 0.5 M KCl electrolyte solution at different sweep rates. (c) Plots for square root of sweep rate versus peak currents intended for oxidation and reduction.
Sustainability 14 06353 g008
Figure 9. (a,b) EIS spectra of ZnO and Ce/Ni-ZnO [Ce(0.05 M) and Ni(0.075 M)] electrode.
Sustainability 14 06353 g009
Figure 10. Amperometric mesurments for (a) undoped, (b) Ce/Ni-ZnO [Ce4+ (0.05 M) and Ni (0.075 M)] with H2O2 into 0.1 M of KCl, (c,d) consistent linear graph of sensing current (A) versus H2O2 concentrations.
Sustainability 14 06353 g010
Table 1. XRD derived parameters of undoped and co-doped ZnO nanoparticles.
SamplesParticle Size (nm)Lattice Parameters (Å)
a = bcc/a
ZnO243.2425.2041.604
ZnO: Ce (0.05 M): Ni (0.025 M)17.993.2575.2201.602
ZnO: Ce (0.05 M): Ni (0.05 M)16.863.2605.2271.603
ZnO: Ce (0.05 M): Ni (0.075 M)15.853.2565.2241.604
ZnO: Ce (0.05 M): Ni (0.1 M)14.643.2605.2261.603
ZnO: Ce (0.05 M): Ni (0.125 M)11.193.2565.2241.604
Publisher’s Note: MDPI stays neutral with regard to jurisdictional claims in published maps and institutional affiliations.