Abstract
Aviation hubs are pivotal intermediate nodes for connecting people around the world. However, there has been limited investigation on the competitive hub landscape in the China–Oceania market. Employing an updated Connectivity Utility Model, we examine the hub connections provided by hubs in mainland China, Hong Kong and Macau, other Asian countries and Oceania from quantity and quality dimensions between 1997 and 2019. The results indicate that the solid growth of mainland China and Oceania hubs suppress the development of Hong Kong and other Asian hubs. The major competitions of the mainland China and Oceanian hubs have shifted from competing with hubs outside their respective regions to competing with hubs within their regions, while the primary competitors of other Asian hubs have changed from competing with each other to competing with hubs outside their region. In the monopoly market, the Oceanian hubs have always enjoyed the greatest monopoly superiority. In the overlapping market, the dominance of Hong Kong and other Asian hubs in both the quantity and quality dimensions has been challenged by mainland China hubs. In a semiregulated operating environment shaped by China’s centralized government, the coordination between airlines, airports and governments is crucial for future hub construction.
1. Introduction
The continued eastward shift of the global economic center of gravity has been paralleled in the aviation industry, to which China is a primary contributor [1]. Oceania is an important component of China’s long-haul air transport market. According to statics released by IATA, the number of passengers in the China–Oceania market has increased from 1.15 million in 2010 to 4.91 million in 2019. Extensive studies have demonstrated a strong association between robust growth in demand and the substantial increase in international trade [2] and FDI [3]. This point of view is explained by the great achievements made in foreign economic and trade cooperation between China and Oceania’s market, with total imports and exports surging from 607,165 to 1,967,317, and foreign direct investment expanding from 58,619 to 172,579 between 1997 and 2019 [4].
In addition, a more liberalized regulation environment also exerts powerful effects upon the vigorous growth of air passengers [5,6]. Deregulation policies (e.g., relaxing or even removing restrictions on airline entry, capacity restrictions and route designation) have greatly promoted the improvement of airline operating efficiency and the fall in airfares, which has laid the cornerstone for expanding the market’s potential [7,8]. The liberalization process in the China–Oceania aviation market mirrors the Chinese government’s policy shift from a long-standing protectionist regime toward gradual deregulation after 2003 [9,10]. Up to 2020, China had signed air service agreements with nine countries in Oceania, among which Australia has the heaviest air passenger traffic. In 1997, China and Australia concluded a bilateral air service agreement; by 2016, the third and fourth freedom traffic rights between the two countries were fully liberalized. However, the air connections between China and other Oceanian countries are still restricted by navigable cities, capacity deployment, airline entry, etc., and the extent of air transport market liberalization remains low [11].
One of the prominent spatial effects of deregulation is the emergence of intermediate hubs as switch points [12,13]. Traditionally, competition between airports mainly occurrs in adjacent airports fighting for the passengers with the same origin or destination. Driven by economies of scale and density, more and more airlines widely have adopted hub-and-spoke networks to articulate and mediate spatial interaction between periphery nodes [12,14,15]. The transfer service derived from the hub airport brings about the second form of competition between airports, where distant airports in different regions strive for transfer traffic beyond their local markets [16]. The attractiveness of transfer options supplied by the hubs may be diluted in the short-haul market due to longer total travel time, while in the long-haul market, especially for those with few direct flights, alternative air routes are of great significance for passengers to reach their destinations [8,17]. Therefore, it is essential to pay special attention to hub competition in the long-haul market.
There has been a surge of interest in competition between Chinese hubs and foreign counterparts, but the studies dealing with hub competition in the China–Oceania market remains scarce. Fu et al. found that the number of weekly flights to North America from Japanese and Korean carriers were significantly higher compared with Chinese carriers in 2001, leading to the leakage of a large number of Chinese passengers to Tokyo and Seoul for transfer [7]. Piltz et al. confirmed the traditional European and Asian hubs were exposed to serious competition of being bypassed as Gulf airlines increase their global outreach by routing sixth-freedom traffic through Middle Eastern hubs [18]. Chang et al. examined the competitive position of the ten Asia hubs in different markets worldwide in 2016; the results revealed that Chinese hubs (e.g., Beijing, Shanghai and Guangzhou) were the best performers in the China–North America market but lagged behind other Asian hubs in other markets [19]. While indicating that Guangzhou has surpassed other hubs as a leader in delivering hub connections over the period from 2005 to 2016, Zhu et al. limited their scope to China and Australia and failed to identify the primary competitors for each hub and reveal the strengths and weaknesses of the hubs [20].
Within this context, this study provides a comprehensive overview of the changing roles of Chinese and foreign hubs in delivering connecting opportunities in the China–Oceania market. The research questions driving the study are as follows: (1) What changes have taken place in the competitive landscape of the hubs in delivering transfer flights between China and Oceania? (2) Who are the main competitors of each hub? (3) What are the competitive strengths and weaknesses of these hubs?
The remaining part of this study is organized as follows: Section 2 introduces the data and methodology. Section 3 is the empirical part, which outlines how competitive landscapes have changed in the China–Oceania market over the period from 1997 to 2019, explores the competitive profile between hubs located in different regions, identifies the main competitors of representative hubs and comprehensively evaluates the advantages and disadvantages of representative hubs. The last section offers conclusions and discusses policy implications.
2. Methodology and Data
2.1. Data
This paper explores the competitions of hubs in the China–Oceania market with data retrieved from OAG (the Official Airline Guide) for the third week of May in every other year between 1997 and 2019. In this study, the term ‘‘hub’’ is defined as any intermediate airport that can provide feasible one-stop flights connecting mainland China cities and Oceanian cities, including both transfer flights operated by the same airline (online transfers) or different airlines (interline transfers) (Figure 1). Meanwhile, for the hubs located in the MACs (multiple airport cities, e.g., Tokyo and Shanghai), their performance not only includes the hub connections provided by hubs themselves but also involve the interairport connections generated by the ground transfer within MACs. Despite some studies having confirmed that the location and capacity limitations of MACs place them in inferior positions when competing with other airports for hub roles, the huge OD flights provide sufficient feeder traffic for MACs to generate hub connections [21]. According to the lists of MACs in previous studies [22,23] and information of the city where the airport is located recorded by OAG, the MACs involved in this study include Beijing, Shanghai, Seoul, Tokyo, Taipei, Bangkok, Kuala Lumpur and Melbourne. Furthermore, to distinguish the competitiveness between hubs in different regions, we divided these hubs into 4 groups—mainland China hubs, Hong Kong and Macau hubs, other Asian hubs and Oceanian hubs.
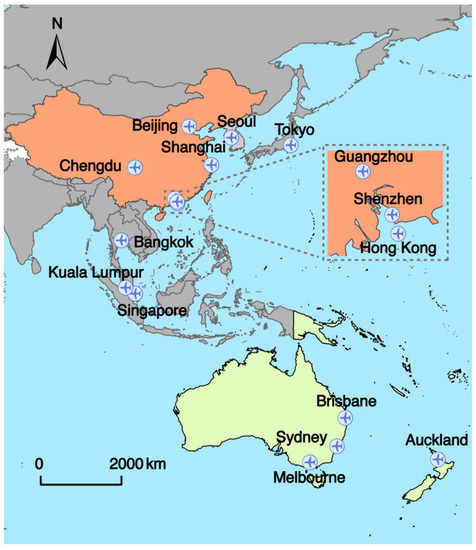
Figure 1.
The spatial distribution of major hubs in the China–Oceania market.
2.2. Methodology
Researchers employed different approaches to examine the competitiveness of hubs. Early studies tended to characterize the competitiveness of hubs through the use of indicators of magnitude (e.g., number of transfer passengers and destinations offered) [16,24,25], but such variables failed to reflect the spatial and temporal concentration required to precisely generate transfer connections in hubs [25]. Scholars widely introduced graph theory to describe the spatial topological structure of air transport networks in the 1990s [26]. However, some indexes adopted from traditional graph theory (such as α, β and γ, etc.) were limited by poor distinguishing capabilities [27]. Another set of indexes were employed in the same decade from economic theory (e.g., the Gini index, Herfindahl index and Theil index of entropy) to explore the spatial patterns of air transport [26]. However, these indicators are only effective in measuring simple or well-organized networks and are not applicable to evaluating the real-world network with a mixture of point to point and hub and spoke [28]. Breakthroughs in complex network theory in the late 1990s provided greater precision in recognising the topological structure of air transport networks, effectively addressing the limitations of the graph theory and concentration approaches in accurately identifying network features [29,30]. Extensive indexes (e.g., degree centrality, betweenness centrality) have been employed to examine the competitive position of hubs [31,32,33,34].
The temporal dimension of air transport networks became a growing concern for scholars in the late 1990s but did not receive due attention for a long period. Even the emerging complex network method only considered spatial configuration, ignoring the temporal coordination of air transport networks [35]. Dennis pioneered the notion that careful scheduling in hubs was crucial to maximize total connections [36]. Many researchers have since investigated the temporal configuration of air transport networks at hub airports through visualizing wave structures [37,38].
However, examining space and time constraints only removes infeasible hub connections. Danesi proposed that the services integrated into hubs are another key factor in efficient connections to be examined alongside spatial concentration and temporal coordination [39]. The convenience of generated connections determines how attractive the hubs are to passengers. Numerous subsequent models attempted to filter the feasible connections according to space (detour factor) and time constraints (minimum connecting time (MCT) and maximum acceptable connecting time (MACT)), and then further evaluated the quality with the following factors: equipment type, velocity, alliance relationship and airline type, etc. [20,40,41]. Therefore, the term “hub connectivity” was brought up to refer to the total number and quality of connecting flights available to passengers serviced via hubs [25,40,42,43].
This study updated the Connectivity Utility Model (ConUM) proposed by Zhu et al. [20] and Zhang et al. [41] to examine the hub performance in the China–Oceania market. Firstly, we refined the existing model by considering passenger preferences in discarding unattractive connections during the initial screening phase. Secondly, more service quality variables were incorporated to investigate the attractiveness of air connections to passengers. Thirdly, the availability of the updated ConUM mode was extended by considering the application scenarios of hubs located in MACs. Based on the core indicators obtained from the updated ConUM model, we further established an index system to evaluate the hub performance comprehensively.
2.2.1. The Updated Connectivity Utility Model
Quantity of Air Connections (QVC)
The quantity model is designed to discard infeasible hub connections by setting temporal and spatial constraints (Figure 2). Detour index () is the ratio between the total distance of two connected flights and the distance of a direct flight with the same origin and destination (O&D) [39], and the maximum acceptable detour index () is adopted to remove the obviously circuitous connections. In accordance with the survey results based on passenger booking data presented by Seredyński et al. [44], we set at different distance intervals according to its minimum values acceptable to 95% of passengers.
where , and represent the great-circle distance of flight from origin to transfer airport , flight from transfer airport to destination and direct flight from origin to destination , respectively.
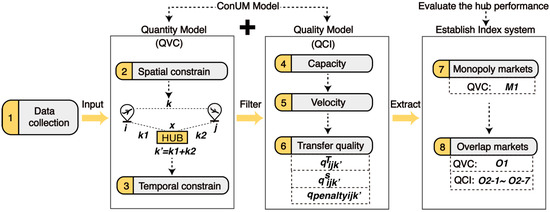
Figure 2.
The data flow chart of the methodology.
The temporal constraint is that hub connections are regarded as feasible only when the incoming and outgoing flights satisfy the and restrictions [45]. We divide into and according to whether it involves the interairport transfer in MACs. If the transfer only involves one hub, the is the shortest time required to complete the movement of passengers from an arriving flight to a departing flight at the same airport [44]. We retrieve from OAG, which publishes the in minutes for most airports. Missing data (such as Beijing Nanyuan Airport (NAY) and Qinhuangdao (SHP) in China and Bankstown Airport (BWU) in Australia) were replaced with the average for all airports (i.e., MCT of international-to-international and international-to-domestic connections were assigned to 60 min and 30 min, respectively). For the transfers that need to be completed across different hubs in MACs, the includes the waiting time for switching the transport (), the ground time access to the second airport () and the extra time spent at the second airport for repeated check-in and security inspection (). Moreover, we adopt the same to limit the longest waiting time tolerable to passengers whether it involves the interairport transfer or not [39]. Similar to the assignment rule of , we set at different distance intervals according to its minimum values acceptable to 95% of passengers [44].
where denotes the penalty of a 30 min result from waiting for the taxi/coach or buying the tickets to reach another hub within MACs; is the fastest driving time between two airports within MACs obtained through Google maps. Considering the unavailability of public transport to some airports on Google maps, we adopt the fastest driving time in minutes to filter out the feasible interairport connections. The equation is the time variable to adjust the changes in driving time related to the improvement of traffic conditions in year .We searched the driving time between hubs within MACs in May 2020 on Google maps. represents the time required for passengers to arrive early at the second airport for repeated check-in and security inspection. The values 100 min and 180 min are assigned, respectively, for domestic and international flights .
Quality of Air Connections (QCI)
After discarding infeasible connections, we calculate the quality index of each feasible connection (QCI) (Figure 2). The QCI of a direct connection is assigned a value of 1, and the QCI of hub connection, while involving transfer inconvenience and risks, is assigned a value lower than 1. The QCI of hub connections () is evaluated by considering the discounts for capacity (), velocity () and transfer quality ():
Capacity is strongly related to connection quality. Larger aircrafts carry more passengers and offer greater comfort [40]. is calculated as follows:
where refers to the lowest number of seats in the two flight segments and ; is set to 615 as a reference maximum passenger capacity. According to information provided by OAG, the 615-seat Airbus A380 carried by Emirates had the highest passenger capacity during the study period.
Velocity integrates time and distance into a single index. is given by:
where denotes the total time for completing the entire hub connection ; expresses the time spent on check-in and security inspection at the departure airport of the first segment . Similarly, we assume 100 min and 180 min for domestic and international flights, respectively; and measure the intervals between the scheduled arrival and departure time of flight and , respectively; represents the waiting time at the hub , which is calculated by comparing the difference between the departure time of flight and the arrival time of flight ; is the sum of the great-circle distances of flight () and flight (); is set to 850 km/h as a benchmark to evaluate the discount velocity.
The transfer quality () is also crucial in improving the passenger experience. We consider three impact factors of transfer quality: time (), service () and transfer penalty factor , such that:
is affected by the waiting time at the hub (). The should neither be too long nor too short. According to the interval of transit (), we utilize a discrete approach to distinguish the transit time quality, with 0.9, 0.6 and 0.3 used as the thresholds for excellent, good and poor connections, respectively.
The service quality is also determined by the relationship between the airlines operating the transfer flights, which incorporate two segments of itinerary. The transfer flights being carried out by the same airline and the same airline alliance are typically more convenient that by individual airlines without cooperation. Accordingly, hubs possessing more transfer flights from the same airline and airline alliance tend to be more attractive and competitive. Therefore, is assigned according to the carriers’ business models (full-service carriers (FSC) and low-cost carriers (LCC)) and whether the two airlines operating the two segments and belong to the same airline alliance (Table 1).

Table 1.
Rules for determining transfer service value ().
The is introduced to describe the disutility of transfer according to whether there are direct connections at the same date and whether the interairport connections are involved during the transfer. Generally, transfer flights are more attractive if the direct flights of the same O&D were not available. Furthermore, transfer flights occurring within the same hub are more attractive than those involving interairport transfer in MACs [45] (Table 2).
Table 2.
Rules for determining transfer penalty value ().
2.2.2. Index System to Evaluate Hub Performance
Based on indicators extracted from the updated ConUM model, we establish an index system to evaluate hub performance comprehensively (Table 3). According to whether only one or more hubs can provide transfer flights, we split the transfer city pairs connecting the mainland China cities and Oceanian cities into monopoly markets (M) and overlapping markets (O).
Table 3.
The index system for evaluating hub performance.
Due to the absence of competitors in the monopoly market, we investigated the competitiveness of hubs based on their numbers of monopoly transfer flights provided (M1). The higher the numbers of available monopoly transfer flights, the greater their competitiveness, which in this paper is termed as the monopoly superiority of hubs. In the overlapping market, we assess hub performance from both quantity and quality dimensions: in the quantity dimension, we calculate the numbers of overlapping transfer flights (O1); in the quality dimension, firstly, we employ QCI to reflect the overall quality performance of hubs (O2). Secondly, we establish 7 indicators to reveal the competitiveness of the hubs in three aspects—capacity (O2-1), velocity (O2-2) and transfer quality (from O2-3 to O2-7). The indicators concerning velocity and transfer quality are further calculated into shares to remove the impact of differences in the total number of overlapping transfer flights.
3. Results
Based on the distribution of calculated results and the development of China’s civil aviation industry over the past two decades, we split the evolution of hub performance in the China–Oceania market into Stage 1 (1997–2003), Stage 2 (2004–2011) and Stage 3 (2012–2019).
3.1. Tendencies in the Evolution of Hub Connections
Figure 3 displays the changing numbers of transfer hubs, transfer city pairs (the origin and destination combination connecting mainland China and Oceania through transfer hubs) and transfer flights in China–Oceania market between 1997 and 2019. In the early stage, there were 18 hubs providing the transfer service. In stage 1, the transfer city pairs expanded from 208 in 1997 to 248 in 2003, with only 40 new transit routes. The total number of flights channelling hubs increased by a relatively lower average, 8.57% per year. In stage 2, the hubs experienced a massive growth, the number of available hubs offering transfer connections increased from 21 to 27 over the period from 2005 and 2011, the city pairs being channelled through hubs nearly doubled (from 409 to 747) and the transfer flights showed an impressive average annual growth rate of 16.49%. In stage 3, the dramatic rising trend slightly slowed down. The hubs capable of supporting transit increased from 29 to 48, and the transfer city pair from 877 to 1859, but the growth speed of the generated transit flights was at a decreased rate of 12.18%, not as high as that of the previous stage.
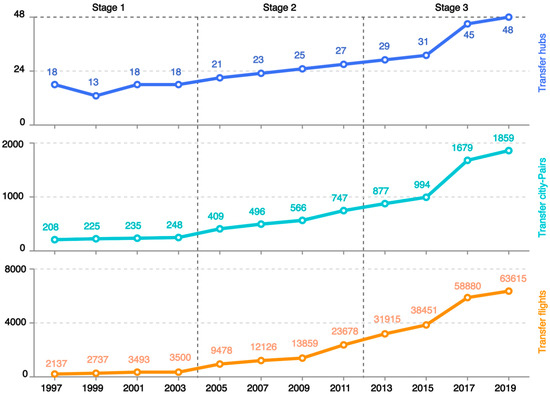
Figure 3.
The changing numbers of transfer hubs, transfer city pairs and transfer flights.
3.2. The Changing Market Shares of Hubs
Figure 4 depicts the changes in the market share offered by different regional hubs in the China–Oceania market. Driven by the constant growth of the mainland China and Oceanian hubs, the share of transfer flights offered by Hong Kong and other Asian hubs were continuous eroded.
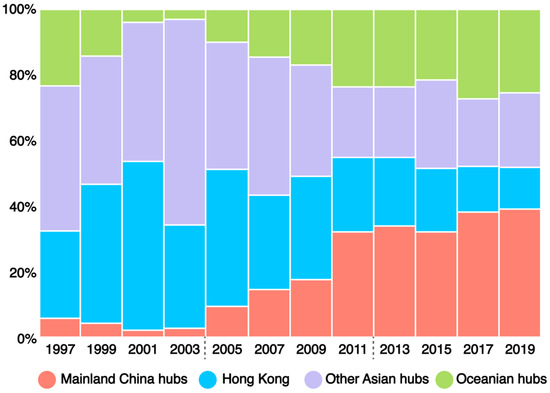
Figure 4.
The changing market shares of hubs located in different regions. Note: Since there are few transfer flights in Macau connecting mainland China and Australia, related analysis gives more attention to the intermediary role of Hong Kong.
In stage 1, the hub pattern was characterized by a clear “spindle shape” (large in the middle and small at both ends). Nearly half of the transfer flights were generated at Asian hubs during the period from 1997 to 2003. The share of transfer flights provided by Hong Kong increased sharply from 26.72% in 1997 to 51.39% in 2001 and fell to 31.43% due to the negative impact of the SARS epidemic in 2003, while the transfer flights offered by the hubs in mainland China and Oceania occupied lower shares, showing an obvious downward trend.
In stage 2, the remarkable growth of hubs located in mainland China and Oceania constantly cannibalized the market share of Hong Kong and other Asian hubs. The largest gains were recorded at hubs located in mainland China, with the share of connecting flights increasing sharply from 9.46% to 32.21%. Although the growth rate of the Oceanian hub was slightly slower than that of the mainland China hub, its market share jumped from 10.19% to 23.69%. The share of transfer flights channelled through Hong Kong and other Asian hubs decreased by 19.03% and 17.22%, respectively, compared with that of 2005.
In stage 3, the share of transfer flights offered by the hubs in mainland China continued to demonstrate solid growth (from 33.76% to 39.11%). Meanwhile, there was a dramatic increase in the proportion of transfer flights offered by Oceanian hubs, surpassing other hubs in Asia for the first time. Due to the continuous shrinking of transfer flights generated by Hong Kong and other Asian hubs, the “spindle-shaped” structure shifted to a “dumbbell-shaped” structure.
The specific performance of the hubs is the epitome of the above regional evolution tendency (Figure 5). As there are too many hubs providing transfer services in the China–Oceania market, the hubs located in a multiairport city were consolidated into the city level to simplify presentation results. For example, the total number of transfer flights in a city is the sum of transfer flights from airports within the MACs. Therefore, the hub role of a city in the follow-up empirical analysis represents the overall performance of airports within the same MACs. The three representative years of 1997, 2007 and 2019 were selected to demonstrate hub performance in stage1, stage 2 and stage 3, respectively. In stage 1, Hong Kong had the highest transfer flights among all the hubs, followed by Seoul and Sydney; Singapore, Tokyo, Shanghai and Osaka ranked 4th, 5th, 6th and 7th, respectively (Figure 5a). In stage 2, the top seven cities remained unchanged, but the gap between Hong Kong and Seoul widened sharply. Noticeably, Guangzhou, with the highest growth rate, overtook Osaka’s seventh position (Figure 5b). In stage 3, the rankings of these cities went through dramatic changes. Sydney and Guangzhou surpassed Hong Kong, occupying the top two positions in the list. Shanghai overtook Seoul and Singapore, moving upward to the fourth position. In addition, new hubs emerged in Mainland China (such as Shenzhen, Chengdu) and Oceania (Melbourne, Auckland) with vigorous growth (Figure 5c).
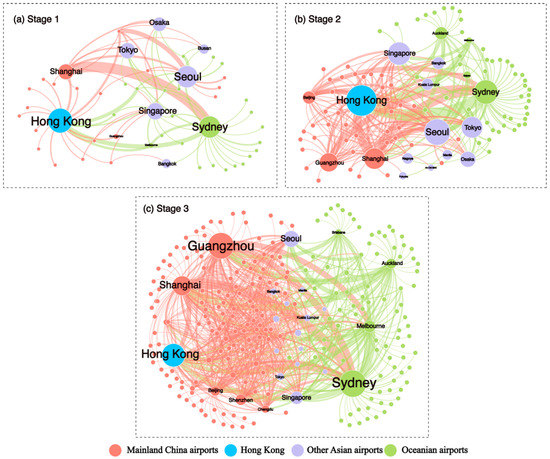
Figure 5.
Evolution of major hubs in the China–Oceania market.
3.3. Identifying the Competitors of the Representative Hubs
In accordance with the numbers of connecting flights (Figure 5), the selected representative hubs are: five mainland China hubs (Beijing, Shanghai, Guangzhou, Chengdu and Shenzhen), Hong Kong, five other Asian hubs (Seoul, Tokyo, Singapore, Kuala Lumpur and Bangkok) and four Oceanian hubs (Sydney, Melbourne, Brisbane and Auckland). Based on the market overlapping of the transfer city pairs (Figure 6, Figure 7 and Figure 8), the main competitors of the hubs at different stages are identified.
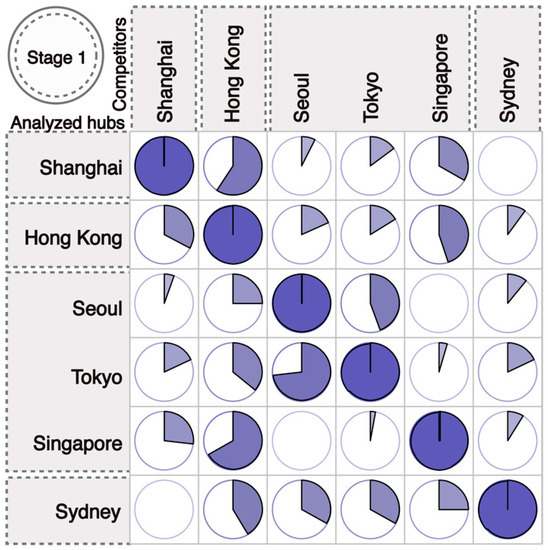
Figure 6.
Identifying the competitors of the representative hubs in stage 1. Note: The analyzed hub is distributed on the vertical axis and its potential competitors are located on the horizontal axis. The share of colored pie in the corresponding cell is equal to the number of transfer city pairs that the analyzed hub overlaps with their competitors divided by the total number of transfer city pairs that the analyzed hub provides. The darker the color, the larger the share.
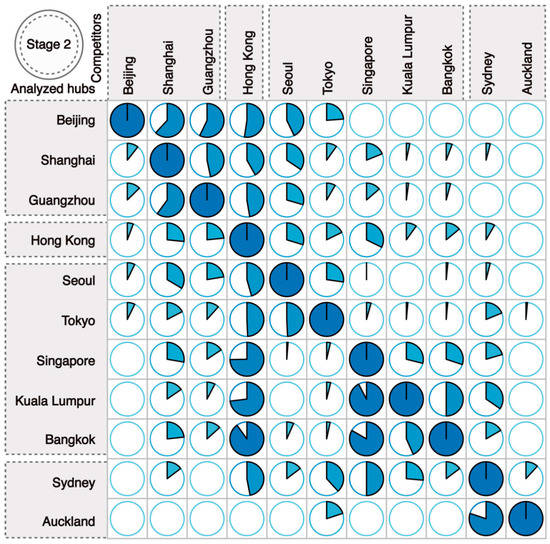
Figure 7.
Identifying the competitors of the representative hubs in stage 2.
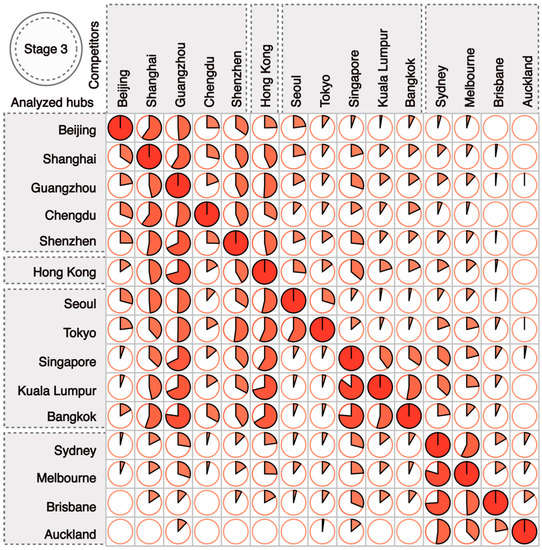
Figure 8.
Identifying the competitors of the representative hubs in stage 3.
3.3.1. The Main Competitors of the Mainland China Hubs
The primary competitors of the mainland China hubs have shifted from Hong Kong to other mainland China hubs. In stage 1, Shanghai was the only hub in mainland China that had overlapping markets with the other hubs, and Hong Kong was its biggest rival. A total of 59.26% of the transfer city pairs of Shanghai were also provided by Hong Kong. Only a few city pairs of Shanghai overlapped with that of other Asian hubs. No city pairs of Shanghai overlapped with that of Oceanian hubs (Figure 6). In stage 2, Beijing and Guangzhou participated in the competition of overlapping markets, and the mainland China hubs gradually started competing with each other instead of competing with Hong Kong. The Hong Kong hub was more exposed to the competition with the mainland China hubs than other Asian hubs and Oceanian hubs (Figure 7). In stage 3, the competition of the mainland China hubs took place mostly within the region, with the Shenzhen and Chengdu hubs emerging as new competitors. While the overlapping of city pairs between the mainland China hubs, Southeast Asian hubs (such as Singapore, Kuala Lumpur and Bangkok) and Oceanian hubs increased, the overlapping between the mainland China hubs and East Asian hubs such as Tokyo and Seoul reduced (Figure 8).
3.3.2. The Main Competitors of other Asian Hubs
The major competition that other Asian hubs are mainly exposed to has shifted from other Asian hubs to Hong Kong and Guangzhou. In stage 1, Seoul and Tokyo were each other’s biggest competitors, and Hong Kong was their second biggest competitor; Hong Kong was the biggest competitors to Singapore (Figure 6). In stage 2, apart from Kuala Lumpur, Hong Kong was the biggest competitor to all Asian hubs (Figure 7). In stage 3, along with the increasing competition from the mainland China hubs, the rise of the Guangzhou hub weakened the dominating position of Hong Kong, which was the major competitor to other Asian hubs, and replaced Hong Kong, becoming the main competitor to Singapore and Bangkok (Figure 8).
3.3.3. The Main Competitors of Oceanian Hubs
The major competitors of the Oceanian hubs encountered has shifted from competing with hubs outside the region to competing with each other. In stage 1, Sydney was the only hub in Oceania that had overlapping markets with the other hubs, and its top 3 competitors were Hong Kong, Seoul and Tokyo (Figure 6). In stage 2, Auckland entered the competition of overlapping markets. With Singapore replacing Hong Kong as the biggest competitor to Oceanian hubs, the competition was mostly from non-Oceanian hubs (Figure 7). In stage 3, Brisbane became active in the overlapping market, and Oceanian hubs gradually started competing with each other. As for the competition from non-Oceanian hubs, Guangzhou and Singapore became the major competitors to Oceanian hubs, weakening the competitive position of Hong Kong (Figure 8).
3.4. Evaluating Hub Competitiveness
3.4.1. The Monopoly Markets
The monopoly superiority (M1) of Oceanian hubs outperformed other hubs in all three stages. In stage 1, Sydney (275) was the best performer, followed by Hong Kong (197) and Seoul (126). The monopoly transfer flights provided by other hubs were fewer than 50 (Figure 9a). In stage 2, while a great number of monopoly transfer flights were still found from Sydney (814), Hong Kong (356) and Seoul (343), the monopoly transfer flights from the mainland China hubs were at a low level (fewer than 150) (Figure 9b). In stage 3, the Oceanian hubs had the highest monopoly superiority with Sydney and Auckland offering, respectively, 1780 and 1105 monopoly transfer flights. Although the Guangzhou hub (with 800 monopoly transfer flights) ranked third in terms of the monopoly superiority, it was still far behind Sydney and Auckland (Figure 9c).
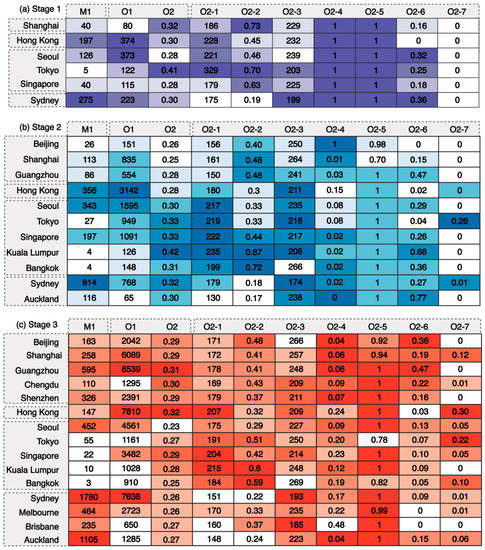
Figure 9.
Evolution of hub competitiveness in the monopoly market and overlapping market. Note: The darker the cell color, the more competitive the hub is in the corresponding dimension.
3.4.2. The Overlap Markets
In the overlapping market, the dominance of Hong Kong and other Asian hubs in both the quantity (O1) and quality dimensions (O2) was challenged by emerging hubs from different stages. In stage 1, Hong Kong and other Asian hubs outperformed others. Hong Kong (374) and Seoul (373) were the top two providers in terms of the number of overlapping transfer flights, and Tokyo (0.41) was the top provider in terms of the quality index (Figure 9a). The dominance of Hong Kong and other Asian hubs remained largely unchallenged until stage 3 (Figure 9b). In stage 3, a large number of high-quality overlapping transfer flights were provided by the mainland China hubs, notably flights from Guangzhou. The number of overlapping flights from Sydney (7638) increased substantially, on par with Hong Kong (7810) (Figure 9c).
Other Asian hubs possessed the strongest capacity of overlapping transfer flights in all three stages(O2-1). In stage 1, Tokyo (329), Hong Kong (228) and Seoul (221) offered the most seats, frequently using wide-bodied aircrafts. For instance, a large number of transfer flights connecting mainland China and Oceania through Tokyo were operated by wide-bodied aircrafts such as Boeing 747s (Figure 9a). In stage 2, other Asian hubs maintained their advantageous capacity, even Bangkok, the weakest among other Asian hubs, offered an average of 199 seats, which was higher than the Hong Kong (180), mainland China and Oceanian hubs (Figure 9b). In stage 3, while the mainland China and Oceanian hubs enhanced their capacities, the average seats offered by them still lagged behind other Asian hubs (Figure 9c).
While the mainland China hubs keep gaining strength in all three stages, other Asian hubs demonstrated heterogeneity over time in the shares of transfer flights with minimum travel time (O2-2). In stage 1, Shanghai (73%) had the greatest share of transfer flights with minimum travel time, then came Tokyo and Singapore, with proportions of 70% and 63%, respectively. Sydney (19%) lagged far behind other hubs (Figure 9a). In stage 2, more than 40% of the transfer flights with minimum travel time were provided by the mainland China hubs (Shanghai, Guangzhou and Beijing) and Southeast Asian hubs (such as Singapore, Kuala Lumpur and Bangkok); the hubs in East Asian (Tokyo and Seoul) and Oceania were in disadvantageous positions (Figure 9b). In stage 3, although the mainland China and southeast Asian hubs maintained their advantages, the East Asian and Oceanian hubs started their overtaking paces, markedly, the share of Tokyo soared to 51% (Figure 9c).
The Oceanian hubs presented their transit efficiency (O2-3) in all three stages. In stage 1, Sydney was the only hub that managed its average transit time within 200 min (Figure 9a). In stage 2, while other Asian hubs reduced their average transit time, Sydney, as the major hub in Oceania, further shortened its average transit time to within 3 h. In contrast, the average transit time in the mainland China hubs increased to more than 4 h (Figure 9b). In stage 3, whereas Oceanian hubs, along with Singapore and Seoul, in general maintained their transit efficiency, other Asian hubs went through prolonged average transit times. In mainland China, new hubs, Chengdu (209 min) and Shenzhen (211 min), emerged with decent average transit times (Figure 9c).
In all three stages, the transfer flights of the mainland China hubs encountered comparatively few challenges from direct flights (O2-4). In stage 1, there were only a few direct flights competing with the transfer flights (Figure 9a). In stage 2, the share of transfer fights without competition from direct flights was being eroded. Hong Kong (15%) was the hub being the most severely affected, and other Asian hubs (Seoul and Tokyo) were pronouncedly affected (Figure 9b). In stage 3, while Hong Kong (24%) and other Asian hubs were further eroded, the Oceanian hubs were also noticeably affected by direct flights. The transfer flights with competition from direct flights from Brisbane, Melbourne and Sydney went up to 48%, 22%, 17%, respectively. In contrast, the mainland China hubs were only lightly affected by direct flights (Figure 9c).
Interairport transfer flights within the MACs (O2-5) were found in mainland China and other Asian hubs in all three stages. In stage 1, interairport transfer flights were not found in any of the cities (Figure 9a). In stage 2, interairport transfer flights were only found in the mainland China cities of Shanghai and Beijing, in which the shares were 30% and 2%, respectively (Figure 9b). In stage 3, the rise and decline of interairport transfer flights was found in mainland China cities. Other Asian cities also started to involve in interairport transfer flights. The share of interairport transfer flights in Tokyo and Bangkok were 22% and 18%, respectively (Figure 9c).
The mainland China hubs gradually surpassed other hubs, possessing the highest shares of transfer flights operated by the same airline (O2-6). In stage 1, Sydney had the greatest share of transfer flights operated by the same airline. Among the transfer flights via Sydney, 36% were operated by the airline Qantas. Seoul was the best performer in other Asian hubs, with a total 32% of the transfer flights operated by Korean Air and Asiana Airlines, respectively (Figure 9a). In stage 2, the Oceanian hubs, notably Auckland, and other Asian hubs, notably Kuala Lumpur and Bangkok, outperformed other hubs. The share of transfer flights operated by the mainland China hubs increased substantially. Remarkedly, among the transfer flights from Guangzhou, 47% were operated by China Southern Airlines (Figure 9b). In stage 3, the mainland China hubs started to overtake the Oceanian and other Asian hubs. The top five hubs of the shares of transfer flights operated by the same airline were all mainland China hubs (Guangzhou, Beijing, Chengdu, Shanghai and Shenzhen) (Figure 9c).
Transfer flights operated by the same airline alliance (O2-7) started to emerge from the second stage; Hong Kong and other Asian hubs were the leaders (Figure 9a). In stage 2, Tokyo (26%) and Sydney (1%) were the two hubs with transfer flights operated by Oneworld (Figure 9b). In stage 3, Hong Kong had the highest share (30%) of transfer flights operated by the same airline alliances. The mainland China and other Asian hubs started accommodating transfer flights operated by the same airline alliances, but the latter outperformed the former. China Southern exited the SkyTeam in 2019, which resulted in the share of transfer flights within the same alliances generated by Guangzhou plunging from 15.91% in 2017 to 0% in 2019 (Figure 9c).
4. Conclusions and Recommendations
This study, applying an updated ConUM model, investigated the hub competition pattern from both quantity and quality dimensions between 1997 and 2019. By incorporating more service factors related to passenger preference, the updated ConUM model can better reflect hubs’ competitiveness from the perspective of passengers.
Concerning the changes that have taken place in the competitive landscape of hubs in delivering transfer flights between China and Oceania, the results indicate that air connectivity in the China–Oceania market has been significantly increased through transfer flights in the past two decades. While the mainland China and Oceanian hubs expand their capabilities of offering transfer flights, the Hong Kong and other Asian hubs have been under various challenges. The leadership of Hong Kong has been challenged and eventually replaced by Guangzhou and Sydney. The hubs such as Seoul, Tokyo and Singapore started to play less important roles.
Regarding the main competitors of each hub, for the mainland China hubs, their primary competitors have shifted from competing with Hong Kong to competing with each other. For other Asian hubs, their major competitors have shifted from competing with each other to the Hong Kong and Guangzhou hubs. For the Oceanian hubs, their main competitors have shifted from competing with non-Oceanian hubs to competing with each other.
In terms of hub competitiveness in the China–Oceania market over the past two decades, different hubs possessed varied advantages at different times. In the monopoly market, the Oceanian hubs have always enjoyed the greatest monopoly superiority. In the overlapping market, the dominance of Hong Kong and other Asian hubs in both quantity and quality dimensions has been challenged by the mainland China hubs. Detailed examinations of each factor shaping the quality of hub connections indicate that other Asian hubs benefited from more seats, faster transfer options and a more efficient utilization of airline alliances. The strength of the Oceania hubs resulted from shorter transit times and fewer negative impacts caused by the interairport transfer. The mainland China hubs have encountered less competitive pressure from direct flights, and their higher shares of transfer flights operated by the same airline were critical factors to maintain their competitiveness.
What stands out through the entire evolution is the rising of hubs in mainland China represented by Guangzhou. Similar to the Middle East hubs reshaping the global air traffic flow with the help of gulf carriers’ hub-and-spoke operation [46], the emergence of Guangzhou is largely attributed to the implementation of the “Canton Route” strategy initiated by China Southern Airlines in 2012 [20]. There is no doubt that the based airlines do their best to fully create transfer opportunities at hubs by optimizing route design and improving schedule coordination, which has become a powerful weapon against other hubs [40,47]. In addition to improving the supply of efficient transfer flights under clear international strategies, it is necessary for Chinese airlines to continuously expand the proportion of high-quality transfer flights by tapping the potential of airline alliance platforms or strengthening bilateral and multilateral cooperation with foreign airlines outside the alliance.
However, cultivating the hubs with core competencies is not an effort that hub carriers can take on alone. Close cooperation between airlines and airports is also crucial to hub construction [18,47,48]. For example, the results indicate that the mainland China hubs, especially Beijing, Shanghai and Guangzhou, generally suffer from excessively long transit times. Therefore, shortening transit time is one of the important strategies to enhance competitiveness. However, less transit time also means that the available consumption time of passengers at the hubs would be reduced, which is likely to harm the nonaeronautical revenue of the hubs [47]. The contradictions caused by these diverse interests of the airports and airlines impeded the generation of high-quality connections at hubs. This dilemma also occurs frequently in the mainland China hubs. With the completion of airport localization reform in 2003, the airports assumed a dual role of “semi-public welfare” and “semi-profitmaking”. The “semi-profitmaking” role of airports was prone to conflicts of interest with airlines in business operations, such as flight wave construction, transfer process design and transfer service supply. Therefore, exploring the win–win vertical relationships between hub airports and based carriers is an assurance for hubs to survive the competition [48].
The international air transport landscape has seen the powerful influence of top-down institutional reforms led by the Civil Aviation Administration of China (CAAC) in the past two decades [9,10,49]. Although the regulations of the CAAC on the international air transport market have gradually weakened after years of liberalization, it was still subject to numerous supervisions in terms of route entry and slot allocation [10,18]. It was not until 2018 that the CAAC removed the “one carrier, one route” rule from long-haul markets. In the newly released method for the distribution of international traffic rights, whether it is conducive to hub construction has become one of the important evaluation principles for airlines to obtain entry rights. Regarding slot allocation, a new approach that integrates government administration and the market replaced the previous single-government regulatory method. Meanwhile, the new policy articulates rules for the exchange, transfer and shared operation of flight slots, which is conducive to constructing a highly interactive wave system in hub airports. In other words, whether the CAAC can adhere to the hub-oriented strategy in the allocation of scarce resources will have enormous implications on the competitiveness of the hub in the postpandemic era.
Due to the availability of data, this study is based on data of the third week of May in every other year between 1997 and 2019, more time periods are needed to avoid seasonality bias in future studies. Moreover, the assignment of some parameters in the updated ConUM model mainly refers to the existing literature, which could be improved by supplementing the survey on passengers’ preference in the future. Although we modified some parameters and algorithms from the original ConUM model to improve its accuracy, future research could incorporate more quality factors (e.g., distinguishing between daytime and night-time flights) and adopt different filtering rules (e.g., only considering the quickest alternatives). It is also worth comparing the results with actual passenger booking data from the demand perspective. Additionally, as Niewiadomski (2017) argued, more attention needs to be paid to how the economy, policies, institutions, history and social and cultural aspects of the place where an airport is located influence airlines, thus capturing the evolution of air transport services “from below” [50]. Therefore, it would produce more practical implications to figure out the complex interaction process of multiple actors in typical hubs. Finally, since the outbreak of COVID-19 might be a catalyst for the revolution in the airline industry and global air transportation network [51,52,53], comparing the competitive hub pattern in the China–Oceania market before and after the outbreak of the epidemic will generate fresh insights.
Author Contributions
Conceptualization, D.X. and Q.Z.; data curation, Q.Z.; formal analysis, Q.Z.; funding acquisition, D.X.; writing—original draft, Q.Z. and B.W.; writing—review and editing, D.X. and B.W.; funding acquisition, D.X. All authors have read and agreed to the published version of the manuscript.
Funding
This research was funded by the National Natural Science Foundation of China, grant number 41930646.
Institutional Review Board Statement
Not applicable.
Informed Consent Statement
Not applicable.
Data Availability Statement
Not applicable.
Conflicts of Interest
The authors declare no conflict of interest.
References
- IATA. IATA Annual Review 2018. Available online: https://www.iata.org/contentassets/c81222d96c9a4e0bb4ff6ced0126f0bb/iata-annual-review-2018.pdf (accessed on 10 November 2021).
- Fageda, X. International Air Travel and Fdi Flows: Evidence from Barcelona. J. Reg. Sci. 2017, 57, 858–883. [Google Scholar] [CrossRef]
- Cristea, A.D. Buyer-seller relationships in international trade: Evidence from U.S. States’ exports and business-class travel. J. Int. Econ. 2011, 84, 207–220. [Google Scholar] [CrossRef]
- National Bureau of Statistics. Available online: http://www.stats.gov.cn/tjsj/ndsj/ (accessed on 17 October 2021).
- Zhang, Y.; Findlay, C. Air transport policy and its impacts on passenger traffic and tourist flows. J. Air Transp. Manag. 2014, 34, 42–48. [Google Scholar] [CrossRef]
- O’Connor, K.; Fuellhart, K.; Zhang, S. Change in the role of cities in China’s air transport 2005–2015. Asian Geogr. 2018, 35, 1–14. [Google Scholar] [CrossRef]
- Fu, X.; Oum, T.H.; Chen, R.; Lei, Z. Dominant carrier performance and international liberalization—The case of Northeast Asia. Transp. Policy 2015, 43, 61–75. [Google Scholar] [CrossRef]
- Lieshout, R.; Malighetti, P.; Redondi, R.; Burghouwt, G. The competitive landscape of air transport in Europe. J. Transp. Geogr. 2016, 50, 68–82. [Google Scholar] [CrossRef]
- Zhang, A.; Chen, H. Evolution of China’s Air Transport towards Development International and Policy Liberalization. Transp. J. 2003, 42, 31–49. [Google Scholar]
- Lei, Z.; O’Connell, J.F. The evolving landscape of Chinese aviation policies and impact of a deregulating environment on Chinese carriers. J. Transp. Geogr. 2011, 19, 829–839. [Google Scholar] [CrossRef]
- Civil Aviation Administration of China. Available online: http://www.caac.gov.cn/index.html (accessed on 16 October 2021).
- Goetz, A.R.; Sutton, C.J. The geography of deregulation in the U.S. airline industry. Ann. Assoc. Am. Geogr. 1997, 87, 238–263. [Google Scholar] [CrossRef]
- Shaw, S.L. Hub structures of major US passenger airlines. J. Transp. Geogr. 1993, 1, 47–58. [Google Scholar] [CrossRef]
- Goetz, A.R.; Vowles, T.M. The good, the bad, and the ugly: 30 years of US airline deregulation. J. Transp. Geogr. 2009, 17, 251–263. [Google Scholar] [CrossRef]
- Derudder, B.; Devriendt, L.; Witlox, F. Flying where you don’t want to go: An empirical analysis of hubs in the global airline network. Tijdschr. Econ. Soc. Geogr. 2007, 98, 307–324. [Google Scholar] [CrossRef]
- Redondi, R.; Malighetti, P.; Paleari, S. Hub competition and travel times in the world-wide airport network. J. Transp. Geogr. 2011, 19, 1260–1271. [Google Scholar] [CrossRef]
- Grosche, T.; Klophaus, R.; Seredyński, A. Competition for long-haul connecting traffic among airports in Europe and the Middle East. J. Air Transp. Manag. 2017, 64, 3–14. [Google Scholar] [CrossRef]
- Piltz, C.; Voltes-Dorta, A.; Suau-Sanchez, P. A comparative analysis of hub connections of European and Asian airports against Middle Eastern hubs in intercontinental markets. J. Air Transp. Manag. 2018, 66, 1–12. [Google Scholar] [CrossRef]
- Chang, Y.C.; Lee, W.H.; Hsu, C.J. Identifying competitive position for ten Asian aviation hubs. Transp. Policy 2020, 87, 51–66. [Google Scholar] [CrossRef]
- Zhu, Z.; Zhang, A.; Zhang, Y.; Huang, Z.; Xu, S. Measuring air connectivity between China and Australia. J. Transp. Geogr. 2019, 74, 359–370. [Google Scholar] [CrossRef]
- Derudder, B.; Devriendt, L.; Witlox, F. A spatial analysis of multiple airport cities. J. Transp. Geogr. 2010, 18, 345–353. [Google Scholar] [CrossRef]
- O’Connor, K.; Fuellhart, K. Airports and regional air transport markets: A new perspective. J. Transp. Geogr. 2016, 53, 78–82. [Google Scholar] [CrossRef]
- Wong, W.H.; Cheung, T.; Zhang, A.; Wang, Y. Is spatial dispersal the dominant trend in air transport development? A global analysis for 2006–2015. J. Air Transp. Manag. 2019, 74, 1–12. [Google Scholar] [CrossRef]
- Reynolds-Feighan, A.; McLay, P. Accessibility and attractiveness of European airports: A simple small community perspective. J. Air Transp. Manag. 2006, 12, 313–323. [Google Scholar] [CrossRef]
- Burghouwt, G.; Redondi, R. Connectivity in air transport networks an assessment of models and applications. J. Transp. Econ. Policy 2013, 47, 35–53. [Google Scholar]
- Burghouwt, G.; Hakfoort, J.; van Eck, J.R. The spatial configuration of airline networks in Europe. J. Air Transp. Manag. 2003, 9, 309–323. [Google Scholar] [CrossRef]
- James, G.A.; Cliff, A.D.; Haggett, P.; Ord, J.K. Some Discrete Distributions for Graphs with Applications to Regional Transport Networks. Geogr. Ann. Ser. B Hum. Geogr. 1970, 52, 14–21. [Google Scholar] [CrossRef]
- Alderighi, M.; Cento, A.; Nijkamp, P.; Rietveld, P. Assessment of new hub-and-spoke and point-to-point airline network configurations. Transp. Rev. 2007, 27, 529–549. [Google Scholar] [CrossRef]
- Barabási, A.L.; Albert, R. Emergence of Scaling in Random Networks. Science 1999, 286, 509–512. [Google Scholar] [CrossRef]
- Watts, D.J.; Strogatz, S.H. Collective dynamics of ‘small-world’ networks. Nature 1998, 393, 440–442. [Google Scholar] [CrossRef]
- Guimerà, R.; Mossa, S.; Turtschi, A.; Amaral, L.A.N. The worldwide air transportation network: Anomalous centrality, community structure, and cities’ global roles. Proc. Natl. Acad. Sci. USA 2005, 102, 7794–7799. [Google Scholar] [CrossRef]
- Lordan, O.; Klophaus, R. Measuring the vulnerability of global airline alliances to member exits. Transp. Res. Procedia 2017, 25, 7–16. [Google Scholar] [CrossRef][Green Version]
- Wang, J.; Mo, H.; Wang, F. Evolution of air transport network of China 1930–2012. J. Transp. Geogr. 2014, 40, 145–158. [Google Scholar] [CrossRef]
- Wang, J.; Mo, H.; Wang, F.; Jin, F. Exploring the network structure and nodal centrality of China’s air transport network: A complex network approach. J. Transp. Geogr. 2011, 19, 712–721. [Google Scholar] [CrossRef]
- Paleari, S.; Redondi, R.; Malighetti, P. A comparative study of airport connectivity in China, Europe and US: Which network provides the best service to passengers? Transp. Res. Part E Logist. Transp. Rev. 2010, 46, 198–210. [Google Scholar] [CrossRef]
- Dennis, N. Scheduling strategies for airline hub operations. J. Air Transp. Manag. 1994, 1, 131–144. [Google Scholar] [CrossRef]
- Burghouwt, G.; de Wit, J. Temporal configurations of European airline networks. J. Air Transp. Manag. 2005, 11, 185–198. [Google Scholar] [CrossRef]
- Huang, J.; Wang, J. A comparison of indirect connectivity in Chinese airport hubs: 2010 vs. 2015. J. Air Transp. Manag. 2017, 65, 29–39. [Google Scholar] [CrossRef]
- Danesi, A. Measuring airline hub timetable co-ordination and connectivity: Definition of a new index and application to a sample of European hubs. Eur. Transp. 2006, 34, 54–74. [Google Scholar]
- Logothetis, M.; Miyoshi, C. Network performance and competitive impact of the single hub—A case study on Turkish Airlines and Emirates. J. Air Transp. Manag. 2018, 69, 215–223. [Google Scholar] [CrossRef]
- Zhang, Y.; Zhang, A.; Zhu, Z.; Wang, K. Connectivity at Chinese airports: The evolution and drivers. Transp. Res. Part A Policy Pract. 2017, 103, 490–508. [Google Scholar] [CrossRef]
- Lee, S.Y.; Yoo, K.E.; Park, Y. A continuous connectivity model for evaluation of hub-and-spoke operations. Transp. A Transp. Sci. 2014, 10, 894–916. [Google Scholar] [CrossRef]
- Suau-Sanchez, P.; Voltes-Dorta, A.; Rodríguez-Déniz, H. Regulatory airport classification in the US: The role of international markets. Transp. Policy 2015, 37, 157–166. [Google Scholar] [CrossRef]
- Seredyński, A.; Rothlauf, F.; Grosche, T. An airline connection builder using maximum connection lag with greedy parameter selection. J. Air Transp. Manag. 2014, 36, 120–128. [Google Scholar] [CrossRef]
- Li, W.K.; Miyoshi, C.; Pagliari, R. Dual-hub network connectivity: An analysis of all Nippon Airways’ use of Tokyo’s Haneda and Narita airports. J. Air Transp. Manag. 2012, 23, 12–16. [Google Scholar] [CrossRef]
- O’Connell, J.F. The rise of the Arabian Gulf carriers: An insight into the business model of Emirates Airline. J. Air Transp. Manag. 2011, 17, 339–346. [Google Scholar] [CrossRef]
- O’Connell, J.F.; Bueno, O.E. A study into the hub performance Emirates, Etihad Airways and Qatar Airways and their competitive position against the major European hubbing airlines. J. Air Transp. Manag. 2018, 69, 257–268. [Google Scholar] [CrossRef]
- Fu, X.; Homsombat, W.; Oum, T.H. Airport-airline vertical relationships, their effects and regulatory policy implications. J. Air Transp. Manag. 2011, 17, 347–353. [Google Scholar] [CrossRef]
- Wang, J.; Yang, H.; Wang, H. The evolution of China’s international aviation markets from a policy perspective on air passenger flows. Sustainability 2019, 11, 3566. [Google Scholar] [CrossRef]
- Niewiadomski, P. Global production networks in the passenger aviation industry. Geoforum 2017, 87, 1–14. [Google Scholar] [CrossRef]
- Garrow, L.; Lurkin, V. How COVID-19 is impacting and reshaping the airline industry. J. Revenue Pricing Manag. 2021, 20, 3–9. [Google Scholar] [CrossRef]
- Li, S.; Zhou, Y.; Kundu, T.; Zhang, F. Impact of entry restriction policies on international air transport connectivity during COVID-19 pandemic. Transp. Res. Part E Logist. Transp. Rev. 2021, 152, 102411. [Google Scholar] [CrossRef]
- Li, S.; Zhou, Y.; Kundu, T.; Sheu, J.B. Spatiotemporal variation of the worldwide air transportation network induced by COVID-19 pandemic in 2020. Transp. Policy 2021, 111, 168–184. [Google Scholar] [CrossRef]


Publisher’s Note: MDPI stays neutral with regard to jurisdictional claims in published maps and institutional affiliations. |
© 2022 by the authors. Licensee MDPI, Basel, Switzerland. This article is an open access article distributed under the terms and conditions of the Creative Commons Attribution (CC BY) license (https://creativecommons.org/licenses/by/4.0/).