Abstract
While migration is often understood as movement towards cities, it can also assume another direction, traditionally termed counter-urbanisation. This paper contributes to the study of counter-urbanisation by investigating data on settlement patterns to places outside commuting distance to the Copenhagen labour market. Counter-urban migration outside of the Copenhagen commuting area is compared with out-migration from Copenhagen to suburbs and commuting areas in the period from 2005 to 2020, reflecting periods of both economic growth and recession. In this paper, we explore this development in terms of the numbers and characteristics of migrants moving out of commuting distance in comparison to those migrants who leave the city to settle in the suburbs or within commuting distance. The quantitative findings are combined with qualitative findings from a survey of the motives of migrants. In line with earlier studies, this study finds that family, friends, place-specific relations and job opportunities are important motives for moving. However, the results also show that an increasing share of migrants have higher education. This will contribute to the future economic and social sustainability of rural and peripheral places in Denmark.
1. Introduction
The term ‘counter-urbanisation’ usually describes migration flows from large cities to rural areas, in contrast to the dominant form of migration to big cities. It is far from a new phenomenon; during all phases of urbanisation and regardless of the prevailing movement, all localities experience flows of people moving to and from them. In recent decades, many of the large cities in the Western world have regained their dominant position in the urban hierarchy after years of decline or stagnation. As a result, many of them are enjoying growth rates in businesses, employment, average incomes and population, thereby also attracting increasing numbers of people.
However, the current development termed ‘reurbanisation’ or ‘metropolisation’ [1,2] or Zwischenstadt [3] is following a phase of deurbanisation, that is, of general decline in agglomerations and in the growth of smaller towns and cities [4,5]. The resurgence of large cities is usually linked to the rise of the knowledge economy, where the agglomeration of industries and the demand for creatively thinking employees with formal education is dominating the economy [6,7,8,9], as well as creating a preference for city living [6,10,11].
It is clear, however, that most authors do not include the parallel transformation of rural areas when studying the transformation of large cities, although the development of rural areas is strongly connected to the development of the larger cities. In cities, there is a constant exchange of population, jobs, housing markets and leisure activities. This also applies to rural areas outside the functional area of the metropolis. In this respect, a growing number of studies are addressing counter-urban migration, such as Mitchell [12], Nørgaard, et al. [13], Hansen and Aner [14], Sandow and Lundholm [15], and Bosworth and Finke [16]. Migration patterns are never just a one-way movement; while much attention is paid to net migration, there is good reason to include both in- and out-migration to understand a population’s geographical shifts. The concept of counter-urban migration has unfortunately been used in at least two different senses: on the one hand, the ‘out-of-town’ movement of people; and on the other, as a process of decentralization, where smaller towns grow faster than larger ones [17]. In this paper, the term is only used in the first sense, i.e., as a term for migration out of the larger cities and into rural areas beyond the limits of the functional urban region.
The scale of counter-urban migration is unclear, and it is also questionable whether the concepts of urbanisation and counter-urbanisation capture regional development with respect to settlement patterns. This paper will contribute to the existing literature on counter-urban migration by analysing what characterises counter-urban migrants and why they move. Furthermore, this paper will examine the association between the migrants’ individual characteristics and their moving destination. Our hypothesis is that we expect that migrants moving out of Copenhagen differ in terms of educational background, income and household composition related to where they resettle, e.g., that low-income groups will be more likely to move to more to peripheral areas where housing costs are lower compared to urban areas. We also expect that regardless of socio-economic characteristics, the migrants’ place of residence during childhood will play an important role for their choice of moving destination. This will be analysed by examining migration and settlement patterns in Denmark from 2005 to 2020, a period that covers two periods of economic up-turn until 2008 and again until 2020 together with an economic down-turn in 2008, periods that are traditionally characterised by distinctly different phases of urbanisation and counter-urban migration. In order to explore these questions, we utilise both quantitative administrative microdata on moving patterns out of Copenhagen over a thirteen-year period and responses to a qualitative survey on the motives leading people to choose to move out of Copenhagen.
The paper is structured as follows. First, we provide a literature review of both international and Scandinavian studies of counter-urban migration describing who the counter-urban migrants are and why they choose to move. Next comes a methodological section describing the two data sources used in this paper, as well as the geographical categories we employ in the analysis. Thereafter follows the analysis, where we present and discuss our findings from both the quantitative and qualitative data. Finally, this leads to a conclusion on the research questions, along with perspectives related to the economic and social sustainability of rural and peripheral areas.
2. Studies of Counter-Urban Migration
Studies of migration seek to analyse and understand patterns and processes of people moving from one area to another, including in the case of counter-urban migration, that is, the flows of people out of the larger urban settlement into less urbanised areas. Key aspects of this include who and how many people are moving, why they are moving and where they are moving to. Over time, we have witnessed changes in the direction of migration and settlement where, in recent decades, rural and peripheral areas especially have experienced population decline primarily due to young people moving away, resulting in an increase in the share of the elderly population in these areas. However, more recently, attention has been given to people moving into these areas, exploring who they are and why they move.
Who Moves and Why Do They Move?
Counter-urbanisation is often conceptualised as urban, middle-class movers attracted by an idyllic rural setting. However, some scholars, e.g., Halfacree [18], have stressed the need for a broader understanding challenging the notion of ‘the sophisticated middle-class urbanite moving themselves and their family to start a “new life” in what is perceived to be an idyllic rural setting’ (p. 479). He stresses the need for a fuller picture of counter-urbanisation, paying attention to both ‘ordinary’ people and international migrants. Furthermore, Bijker, et al. [19] stress that rural areas differ in their popularity for living and thus argue for more attention to be paid to the diversity of rural in-migration.
Migration and decisions to move have traditionally been explained in terms of ‘push’ and ‘pull’ factors or advantages and disadvantages. In traditional economic theory, households’ locations are determined by the labour market [20] and motivated by economic incentives, seen as an expression of the rational assessment of the possible economic gains and costs of moving [21,22,23,24]. Following this, it is assumed that households first choose a place to work and then a place to live within an acceptable commuting distance. Thus, as pointed out by Lundholm and Malmberg [25], labour market conditions are seen as superior determinants compared to, for instance, social ties. Several studies have questioned the dominance of economic rationale and stress the importance of non-economic factors, such as social networks and interaction, as well as attachment to place [26,27,28,29] and, e.g., Hanson and Pratt [30] found that place of residence is often chosen first and workplace second. In many subsequent studies, both economic- and non-economic motives for moving, such as education, career, employment, housing cost and size, living environment, environmental qualities, social relations and attachment to a place, have been documented. It has also been stressed that motives for migration vary during different life-phases and the respective time and places that they are part of: Specific economic, political and socio-cultural conditions, such as job opportunities, the housing market and cultural norms, influence individual values and choices [31,32,33].
Scandinavian studies of counter-urban migration also show variation in and diversity among migrants, as well as their motives for moving. A study of Sweden by Lindgreen [34] showed that counter-urban migrants often try to satisfy housing-related needs and that a substantial number of migrants to the countryside moved to an area where they had second homes, but also that households with lower incomes were more likely to make counter-urban moves due to housing costs. Lindgren further found that the likelihood of counter-urban migration increased with age until approximately sixty years of age, but also that retired people were less likely to move out of urban areas. Moreover, he found a negative relationship between counter-urban migration and having children. Conversely, a study by Aner [35] found that outmigration from Copenhagen was mostly of families with children under ‘school age’, and that outmigration grew with settlement at a greater distance from Copenhagen in the period from 1992 to 2002. The study further showed that counter-urban migrants had higher incomes in 2002 compared with those who moved in earlier periods, but also that migration distance was related to income. Thus, the study showed that those with the lowest incomes generally moved further away than those with higher incomes, even within the medium income range that was studied. Nørgaard, et al. [13] explored migration to peripheral areas from both urban and other areas in Denmark and found that migrants to peripheral areas were dominated by middle-aged couples and singles aged thirty to sixty years, followed by younger families with children under the age of seven. The study further showed that the migrants were a mixture in terms of age groups, family status, educational background and income. This was confirmed in another study [36], which showed that migrants are a mixed group in terms of age and family composition, employment status, etc.
Aner and Hansen [37] studied both highly educated and socially vulnerable counter-urban migrants aged 17 to 64 years. The study showed that the average age of the migrants was the late thirties and that many of the migrants were younger families with children. In a subsequent study [14], attention was paid to highly educated individuals moving from urban to peripheral areas in the period 2003–2010, which was marked by both economic growth and decline. In this study, they found that highly educated individuals only made up a small share of those migrating to peripheral areas, approximately five percent of total migrants, and furthermore that their share fell in the period being studied. In the study, the group of highly educated migrants who moved from urban to peripheral areas was divided into three subgroups. One group, young and newly educated, moved to peripheral areas to start their first job and gain work experience to make themselves more attractive in the labour market in the longer turn. Another group was migrants forty years old or older who moved to peripheral areas wishing for a change in career or to climb their career ladders as well as to be closer to nature, family, etc., supporting findings described earlier. This group did not see settling in the periphery as a permanent move but as something they needed to restart their professional careers, as they argued that it is easier to change professional paths in the periphery. The last group that Hansen and Aner [14] identified was families with children seeking what they consider to be an ideal place for children’s upbringing and for family life. This group of migrants was looking for a rural environment and regarded their settlement in it as permanent. As far as the socially vulnerable groups were concerned, Hansen and Aner [14] showed that they were motivated by low housing costs, but also by social relations. Combined with the earlier study, Hansen and Aner [37] point to an interesting finding, namely an increase in the number of socially marginalised migrants during periods of economic crisis, whereas a reverse pattern could be identified for highly educated migrants moving to rural and peripheral areas during periods of economic growth.
In a recent study by Sandow and Lundholm [15], counter-urban migration among families with children who moved out of Swedish metropolitan areas in the period 2003–2013 was explored. They found a small but steady outflow of families moving to medium-sized or small towns and also that the highly educated were over-represented. They further stress that, while knowledge workers generally have flexible opportunities for working from home, etc., they do not have a higher probability than others to move from urban to rural and peripheral settings. However, the study found that people in the public-sector labour market have a higher probability of moving, probably due to the more dispersed job market that the public sector represents [38]. The study also found that low-income households were probably leaving urban areas due to the higher housing costs in the city. Moreover, the study showed a positive relationship between parental leave and counter-urban migration, demonstrating that when a household grows in numbers, this can either push people away from an urban setting due to the cost of housing or pull them towards more provincial settlements due to changes in their preferences. In a study by Neergaard [39], the experiences of a group of highly educated middle-class residents aged 35 to 45 years who moved out of Copenhagen to the countryside were explored. The study was based on qualitative interviews with urbanites moving to the countryside that explored their motives for moving. While cheaper and better housing conditions were important for many migrants, Neergaard showed that the rural setting was the preferred destination for this group of highly educated middle-class migrants, although they had various other options regarding where to live.
The many different considerations middle-income families had for leaving the city or metropolitan areas to settle in rural surroundings was, as suggested by Mazanti [40] and Aner [35], captured in the desire for a good everyday life. Additionally, Nørgaard and Haagerup [36] showed that many considerations come into play when moving from metropolitan to rural areas, the first and foremost of which is a desire to be closer to nature and to live in a safe and peaceful environment, while for some the decision to move was based on a desire to return to where they or their partner had grown up or were seeking similar qualities. Other motives were to live a less stressful life and to have the opportunity to balance work and family life. Another Danish study [41] showed that some migrants wish to return to their rural roots due to attachment to a place and their strong bonds to particular places or regions, as well as family and social networks.
Most of the studies described above focus on migration from urbanised areas to rural and peripheral places, but other studies have been included in order to contribute to an understanding of the variation and diversity of counter-urban migration, especially of people moving to the countryside. For most people, moving to a new place is strongly influenced by economic considerations, and several studies of migration show that this is also a factor for moving to rural and peripheral areas due to a wish or need for cheaper housing and/or more living space. For others, a new job or career possibilities or reducing stress and workload may be a motivating factor. However, studies also demonstrate that being close to nature and returning to where they grew up, to places where they have social relations through their sense of belonging to a particular place may be decisive motives. Thus, studies show that counter-urban migration is motivated by economic considerations in terms of cheap housing and opportunities such as new and better jobs, but also less economic pressure, giving a sense of freedom. Not least, many studies demonstrated the importance of place and social relations, thereby revealing a strong connection between economic and non-economic motives for urban–rural migration.
3. Data, Sampling and Method
Two different types of data are used in this paper: quantitative registers and qualitative responses. First, we use administrative population registers maintained by Statistics Denmark (DST) to describe who moves out of Copenhagen and where the counter-urban migrants move to. The registers contain annual information of the total population of individuals living in Denmark, including their social and economic characteristics, residential information such as family type, highest achieved education, labour market attachment and job type. The sample population in the quantitative analysis includes all individuals between 25 and 65 years who moved out of either Copenhagen of Frederiksberg municipality at some time between 2005 and 2020 (In the following, Copenhagen municipality and Frederiksberg municipality will both be described as Copenhagen.). This period has been chosen in order to capture the times before, during and after the great global recession in 2008 in order to counter the potential impact of economic trends. However, in the econometrics models, which take several explanatory variables into account, we only use data from 2005 to 2017 because information of income and labour markets attachment is not available after 2017.
Second, we use qualitative answers from a survey conducted between March and May 2020 to analyse why counter-urban migrants move out of Copenhagen. The aim of the survey was to shed light on some of the often-overlooked aspects of regional dynamics when it comes to settlement and preferences. The survey was sent to 18,128 people living in Denmark by Statistics Denmark and collected first through a web survey, followed by telephone interviews for those who had not completed the web survey. This produced a participation rate of 32%, equal to answers from 5800 people living in Denmark at the time of the survey who had moved to a rural or peripheral municipality. The survey contained both closed and open-ended questions and was administered in both Danish and English.
To investigate the role of children and family type for the counter-urban migrant, we define six different family types based on number of children and civil status. Married and unmarried couples are lumped together. The question about having children is determined based on whether a child of the family is residing at the same address. We also examine how families’ desire for residential space is actuated among the counter-urban migrants, which we define as the average number of square meters per person in the household. To describe the association between education and moving destination, we define educational categories based on the highest achieved education for each individual based on the ISCED (International Standard Classification of Education) nomenclature. The six educational categories are compulsory education, general upper secondary education, vocational education (practical) and short- (pre-bachelor), medium- (bachelor) and long-cycle (master) education. To explore the role of labour market attachment, we divide the sample into three groups: working, student and nonworking. Furthermore, we also distinguish whether people are employed within the private or public sector. Finally, in order to reveal whether the regional characteristics of the destinations of counter-urban migrants are similar to those they lived in when growing up, we include the ‘From @ 15’ variable, which captures the type of municipality the individual lived in at the age of 15, Our sample size is reduced from 42,131 to 34,289 when we include the ‘From @15’ variables in the statistical model, because we lack information of residential municipality for a subgroup of the population.
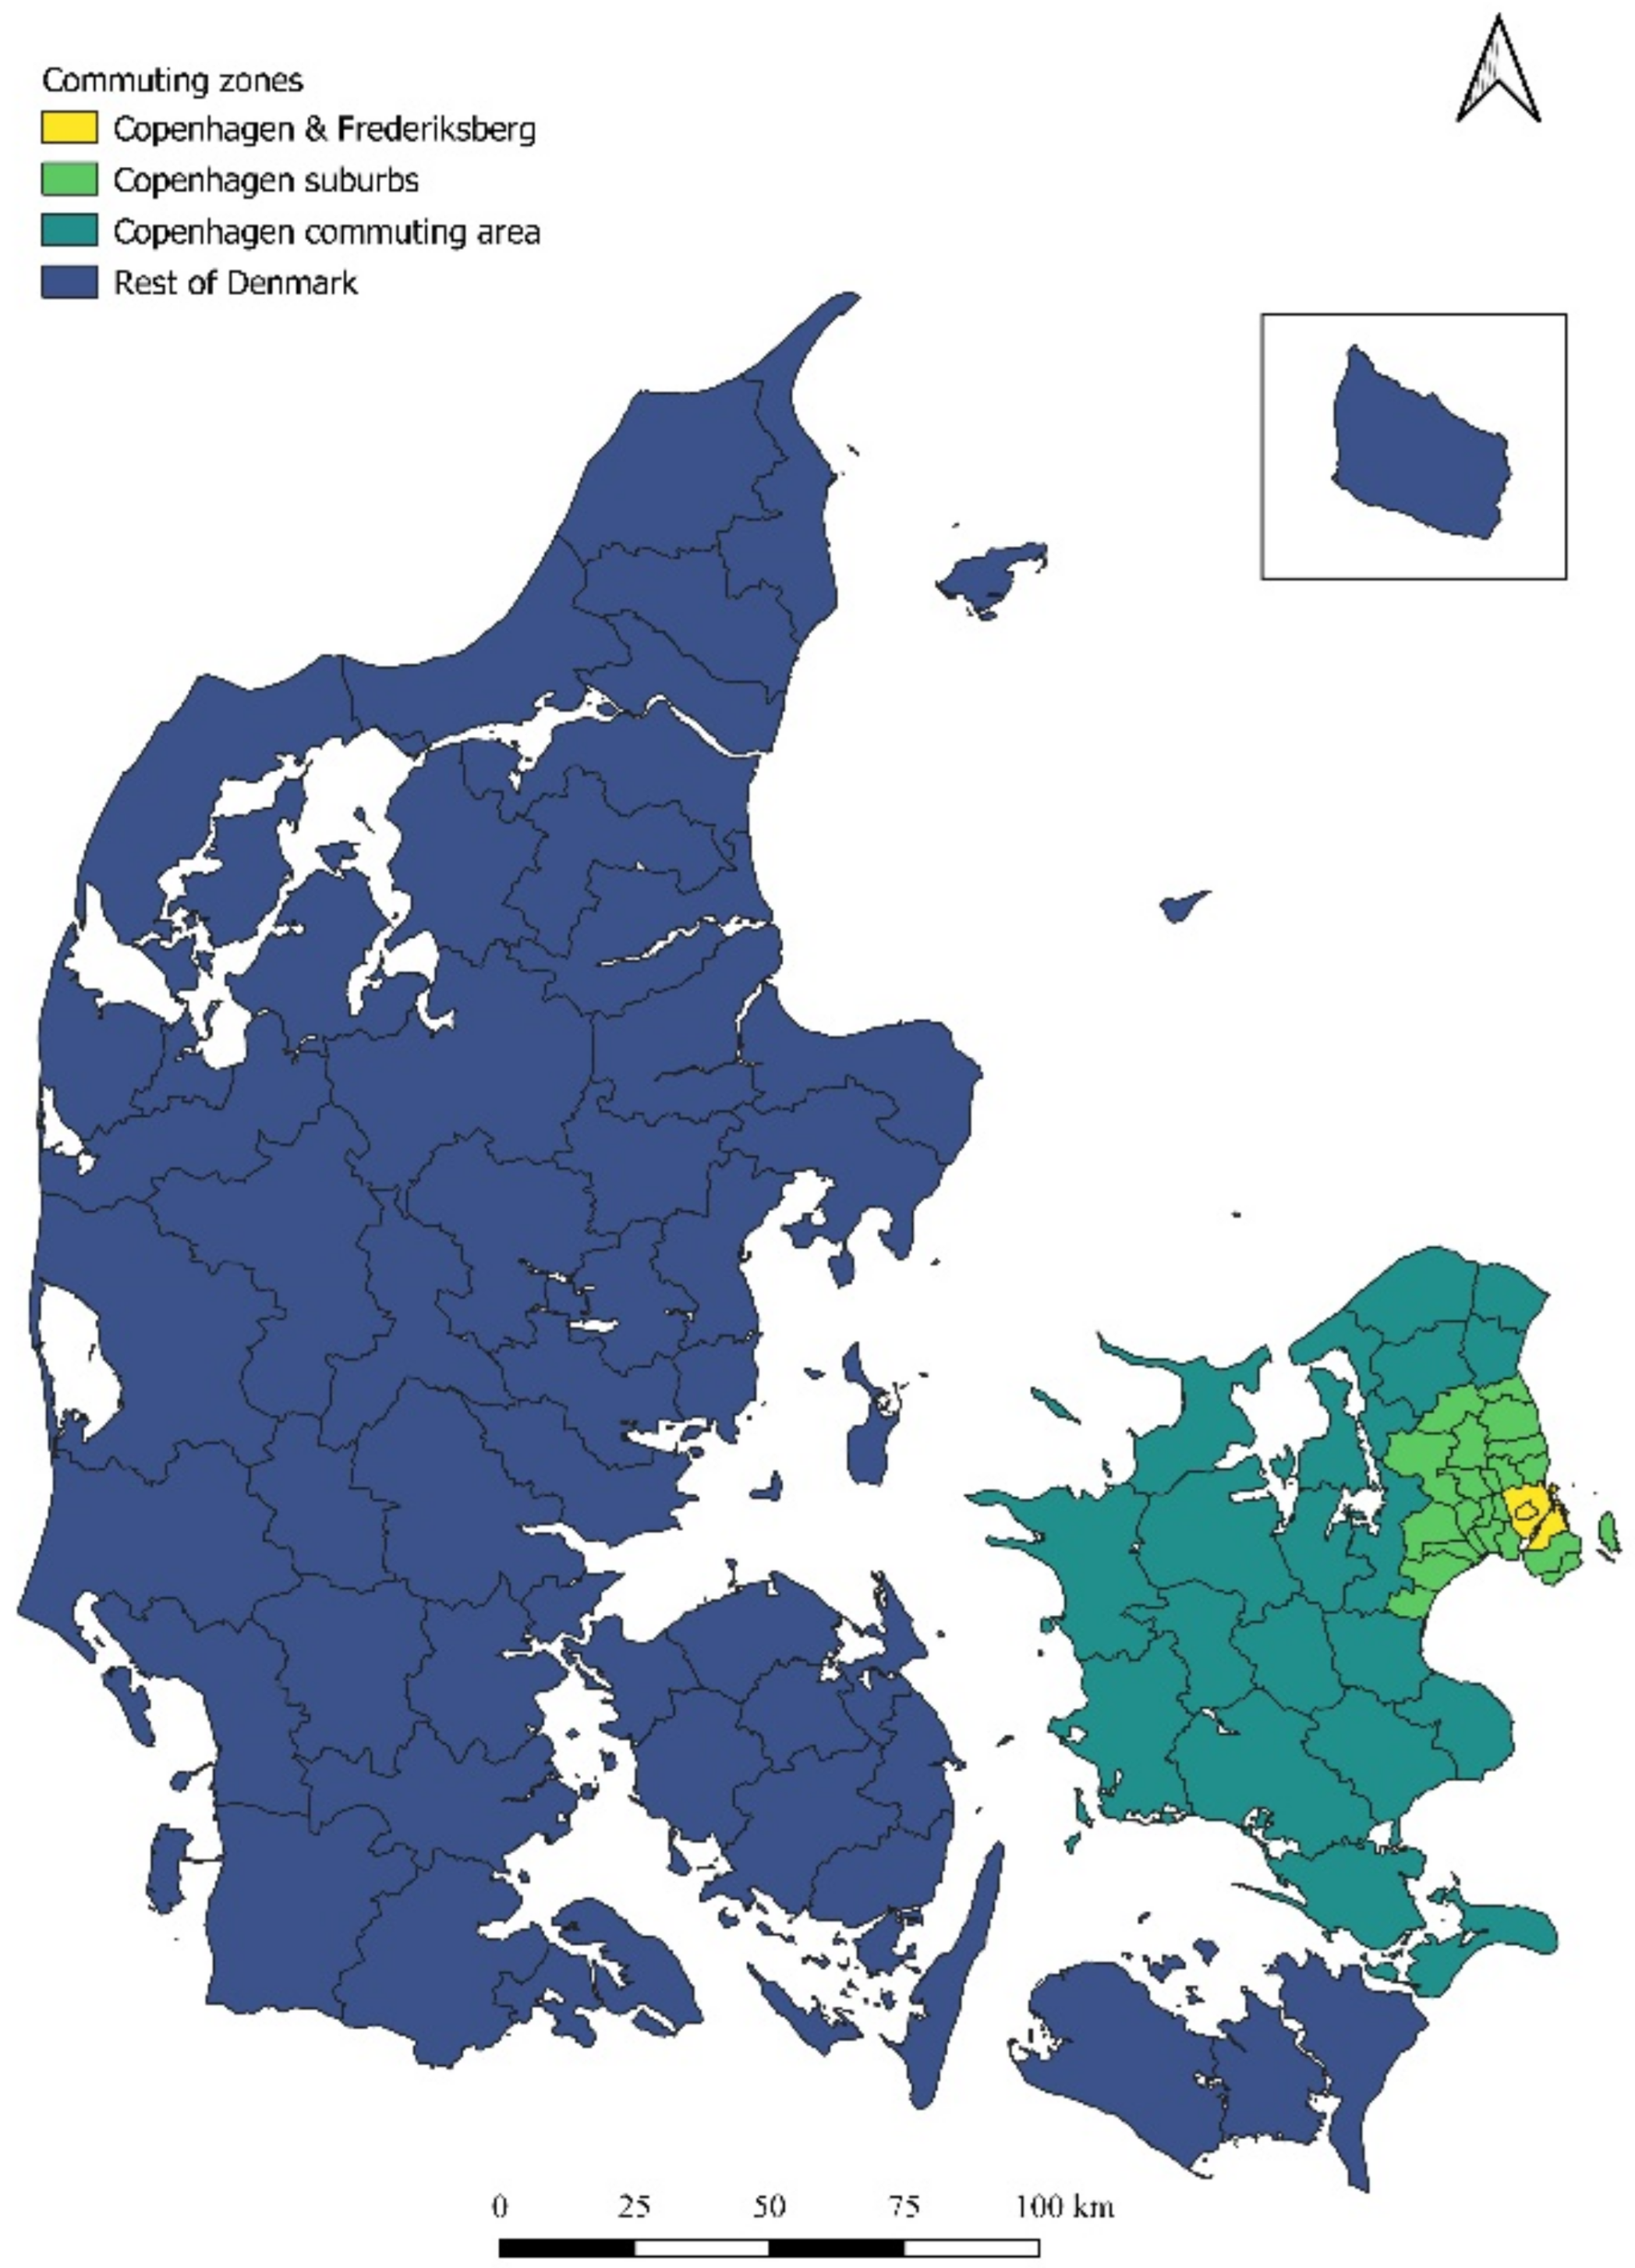
To obtain a thorough understanding of the migration patterns out of Copenhagen, we have divided the analysis into two sections. In the first section we look at differences between migrants moving to the suburbs, people moving into the larger commuting area of Copenhagen and lastly people moving further away from Copenhagen (Figure 1). We make this division because the Copenhagen labour market is very important to pay notice to when discussing location patterns from Copenhagen to the rest of Zealand.
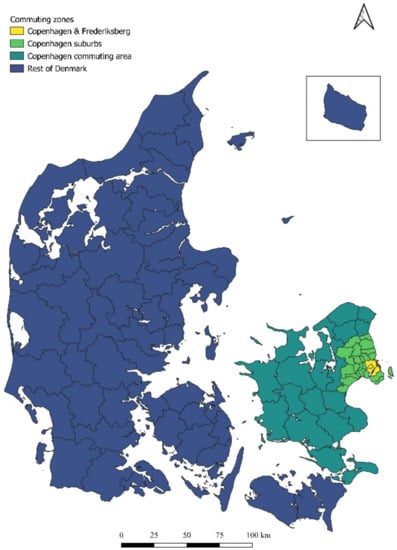
Figure 1.
Residential moving zones in relation to Copenhagen.
In the second part of the analysis, we examine the sub-group of counter-urban migrants who moved further away than the commuting area of Copenhagen, defined as the ‘rest of Denmark’. These movement are counter-urban in the sense that they represent resettlements that do not rest upon proximity to the Copenhagen labour market. However, since the ‘rest of Denmark’ consist of different types of municipalities, we conduct the analysis based on a distinction between whether migrants settle in urban, intermediary, rural or peripheral municipalities (Figure 2).
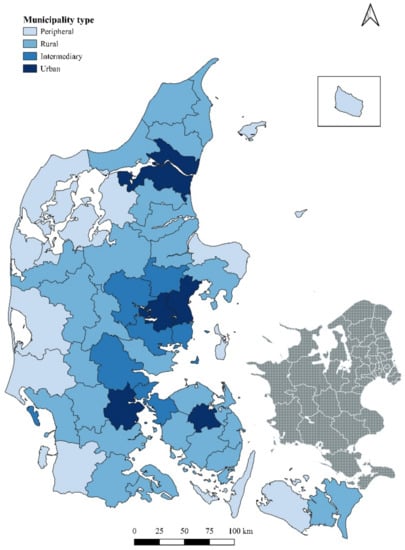
Figure 2.
Municipality types based on degree of urbanisation.
In the first part of the analysis, we split the residential move from Copenhagen up into four zones. These zones are selected in terms of their geographical relation to Copenhagen, namely Copenhagen, Copenhagen suburbs, the larger commuting area of Copenhagen and the rest of Denmark, as shown in Figure 1. While Copenhagen is the starting point for all people in the present study, the Copenhagen suburbs are characterised as the municipalities closely surrounding Copenhagen that are connected through various transportation networks. Our definition of the Copenhagen commuting area is the same as that used by Hansen, et al. [42] and is characterised as being further away from Copenhagen than the suburbs, but still within a manageable commuting distance, whereas the rest of Denmark lies outside of this zone. Setting up specific thresholds for what to include in a commuting area is difficult. Often shares of commuting patterns in and out of places are used by Statistics Denmark to define whether a municipality is within a commuting area or not. However, average commuting distances differ with gender and level of education. According to Statistics Denmark, the commuting area for Copenhagen is larger for highly skilled than for low-skilled individuals [43], and commuting areas increase over time.
In the second part of the analysis, we focus on migration patterns of migrants moving further away than the commuting area. These migrants can resettle in municipalities with different characteristics. Thus, we allocate all municipalities to one of four categories based on their overall degree of urbanization. This division was developed in co-operation between the Ministry of Interior, Ministry of Health and Ministry of Food, Agriculture and Fisheries in 2011 based on several characteristics, such as level of urbanization, demography, educational level, economy and development [44] (Figure 2). Using this division allows nuances in how to analyse the migration patterns of people moving far away from Copenhagen and the labour market that it offers. At the same time, it allows us to study which differences that can be identified between people moving outside the commuting area of Copenhagen but into an intermediary, rural or peripheral area compared to those who ‘just’ move to an urban municipality in Jutland or Funen.
We use a multinomial logit model (MNL) to analyse counter-urban migrants’ choice between four different moving destinations in ’rest of Denmark’: (1) Urban municipality, (2) intermediary municipality, (3) Rural municipality and (4) peripheral municipality. The interpretation depends on a referent alternative. We choose “(1) Urban municipality” as the referent alternative in the following analysis. Thus, the results should be interpreted as the probability of moving to intermediary, rural or peripheral municipalities, respectively, relative to moving to an urban municipality. The probability of moving to destination j by individual i is expressed in terms of upbringing municipality , vectors of observable demographic characteristics , socio-economic characteristics , and parameters , to be estimated.
The following multinomial logit model is estimated:
is interpreted as a utility term, where are dummy variables that comprise information of the type of upbringing municipality: urban, intermediate, rural or peripheral, respectively. The vector comprises the individual characteristics gender, age, family type and residential size. The vector comprises socio-economic variables such as highest completed education, income, attachment to the labour market and a dummy indicating if the individual works in the public sector. The parameters are estimated by maximum likelihood methods.
We estimate two different models with slightly different samples: Model A and Model B. Model A contains all individuals in our sample who moved from Copenhagen at some point in the time period studied. Model B contains the subgroup for whom we have information on the type of municipality they lived in at the age of 15. Model B allows us to examine the impact of upbringing municipality on counter-urban migrants’ choice of moving destination; hence, Model B is our preferred model. We present the results from Model B in Section 4.2 and the results from Model A in Appendix D Table A4.
4. Counter-Urban Migration in the Case of Copenhagen: Who Moves Out of Copenhagen, Where to and Why?
In the last century, Copenhagen has developed along the same lines as many other larger European cities, having had a steadily growing population that peaked in the early 1950s at close to 900,000 inhabitants. Thereafter, the city experienced a marked process of suburbanisation and industrial transformation, resulting in a decline of more than 300,000 inhabitants to 550,000 inhabitants by the early 1990s. The majority migrated to the suburban areas around Copenhagen, but from 1970, the region also witnessed an increase in migration out of the functional urban area. Deindustrialisation, rising unemployment, economic stagnation, fiscal problems and declining population marked the 1970s and 1980s. However, the knowledge economy, with its growth in knowledge-intensive services, together with major public investments from the late 1990s changed Copenhagen in terms of its growing population, extended physical infrastructure, growth in employment and thriving private sector, which has dominated since then [45,46]. From the 1990s onwards, Copenhagen has experienced a new period of population growth, reaching more than 730,000 inhabitants in 2020. However, while the population growth of the last century was to a large extent dominated by domestic migration into Copenhagen, the last two decades have been dominated more by natural growth rates and international migration, while domestic net outmigration has been evident from 2000–2007 and again from 2015 [47]. However, Copenhagen, like many other places, is characterised by constant movements of inhabitants moving in and out of the city. During the last two decades, housing costs have increased extraordinarily in Copenhagen; moving out of central parts of the larger Copenhagen area easily reduces housing costs up to 50 percent. Thus, in the following sections, we will consider the characteristics and patterns of those who move out of the city and explore the motives of counter-urban migrants in particular.
4.1. Who Moves?
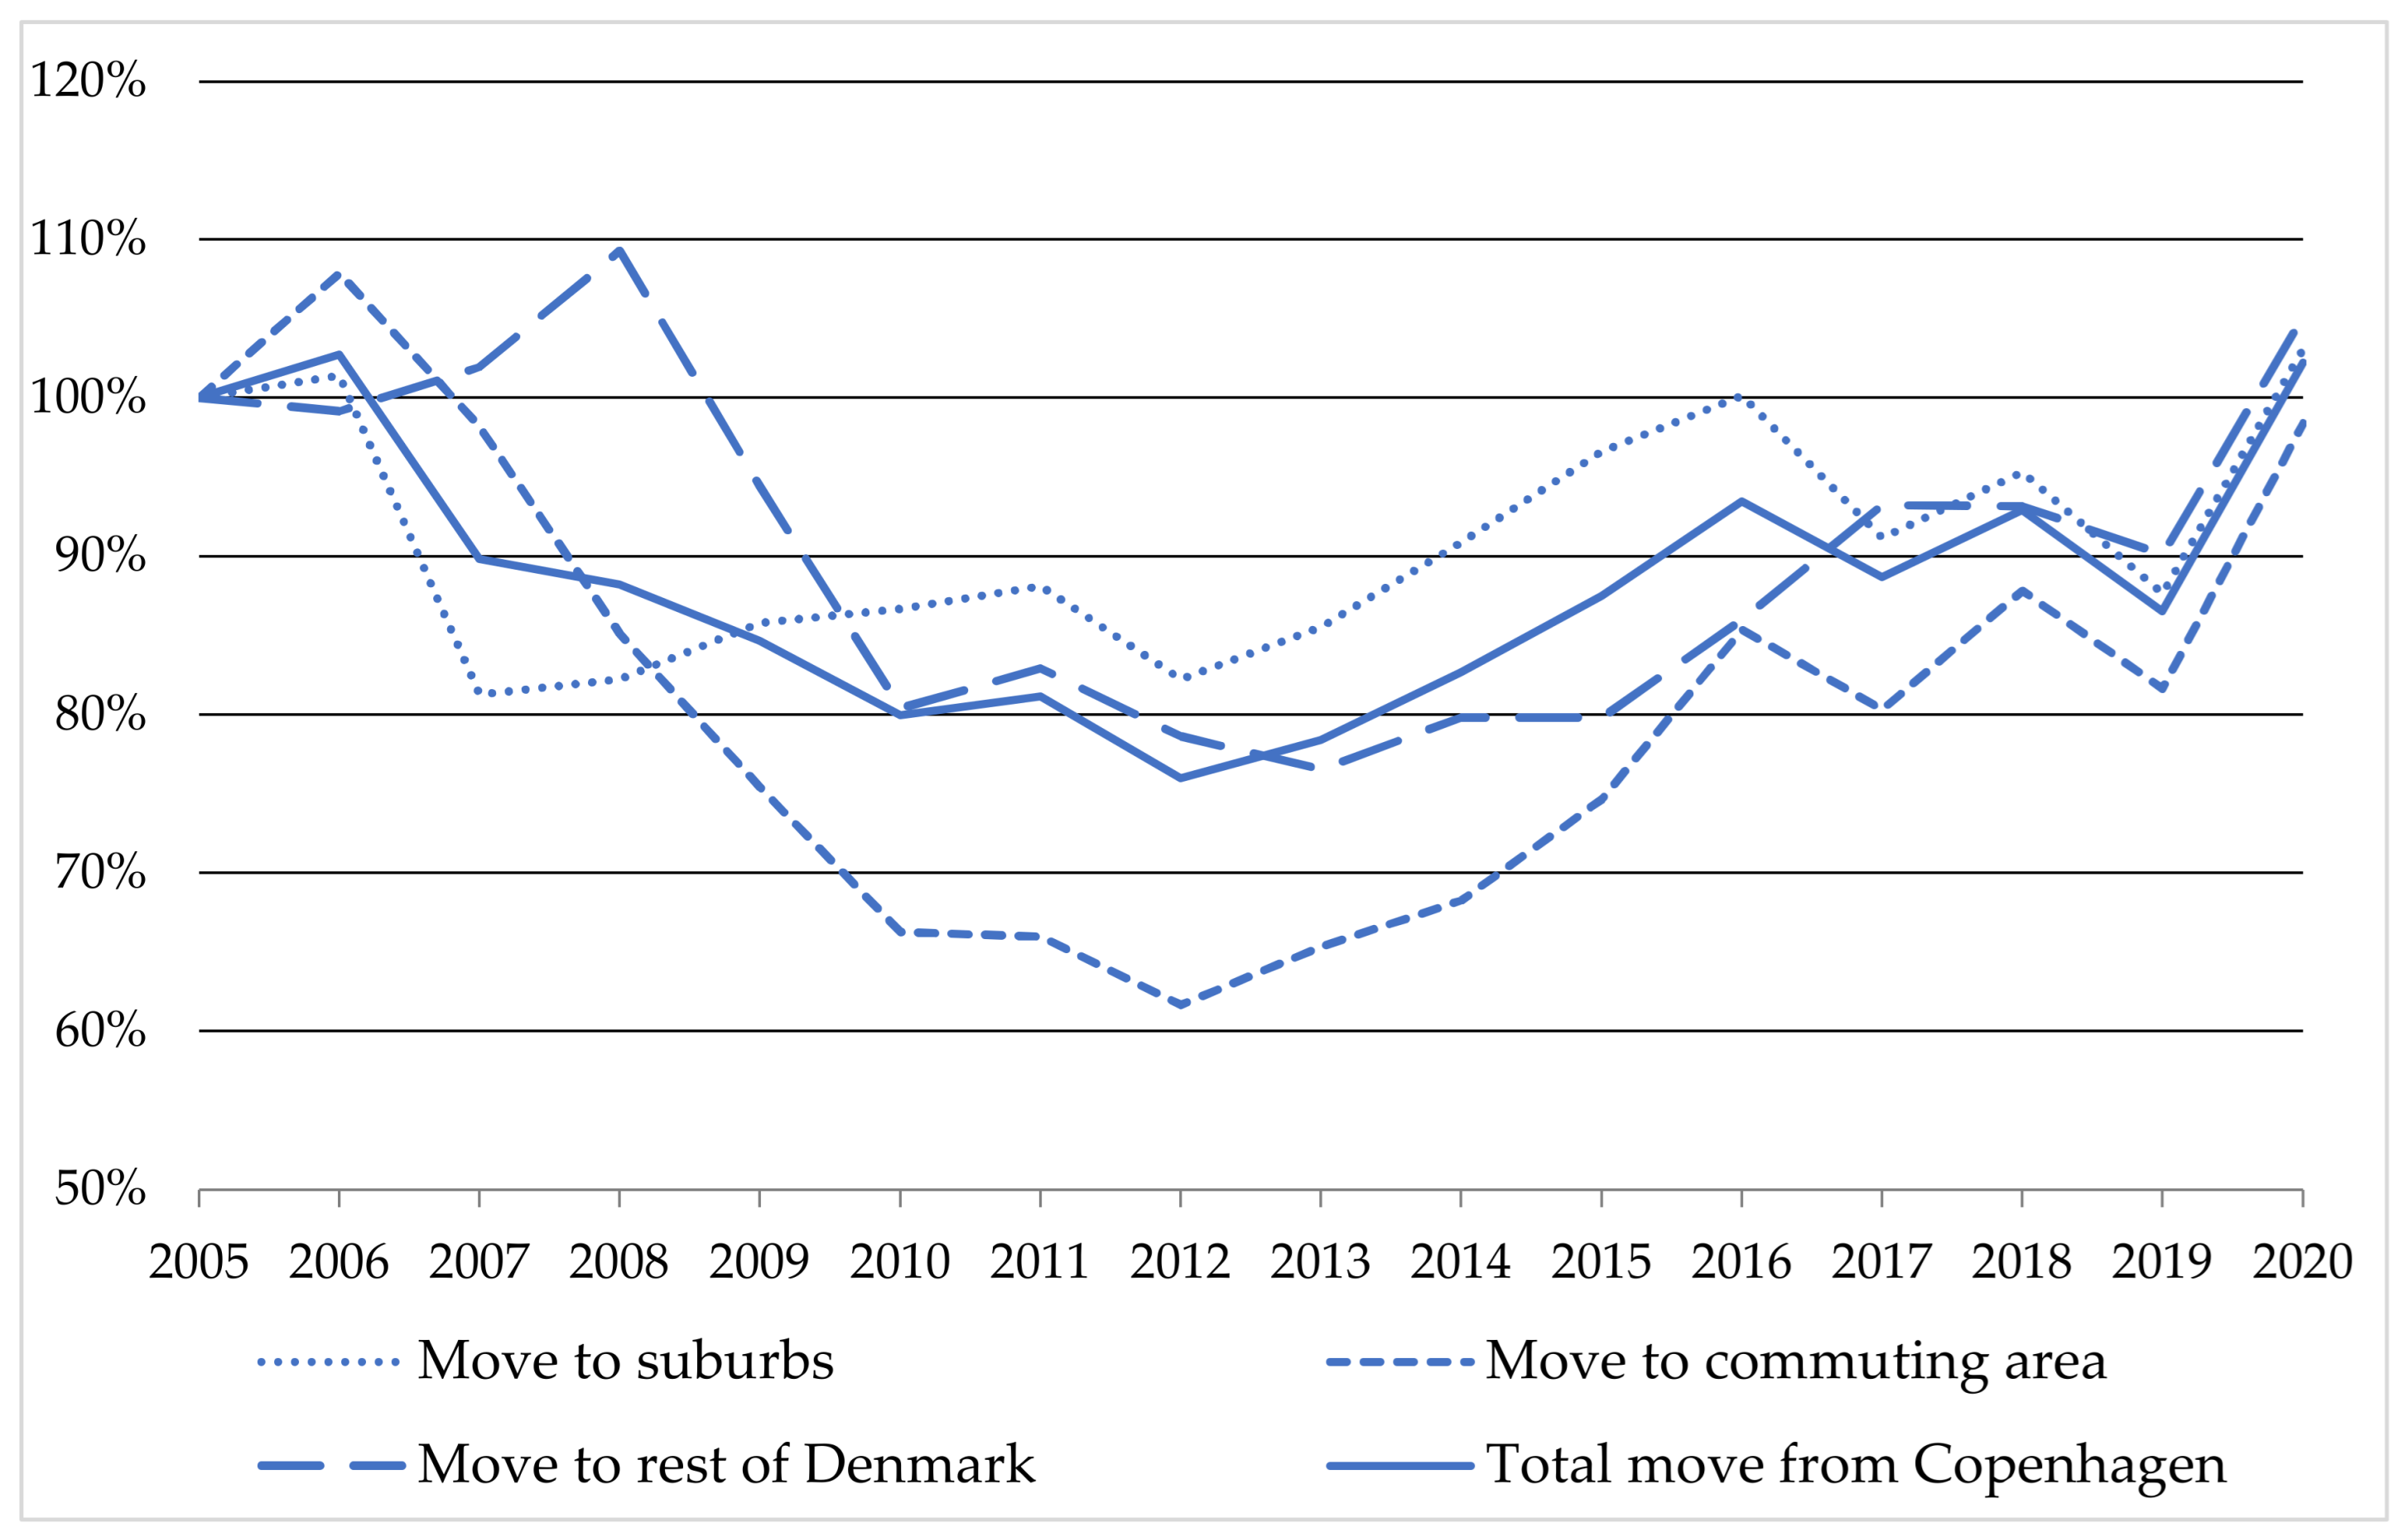
Figure 3 shows the development in outmigration from Copenhagen between 2005 and 2020 for people between the ages of 25 and 65. The migrants are divided into three categories, based on the moving destination. The changes in outmigration are shown in a percentage, where year 2005 acts as the base year (index 100) to which all migration in the subsequent period is related. The figure shows that the level of outmigration from Copenhagen decreased following the economic recession in 2008 and did not come back to the same level until 2020. Within this period especially, migration to the commuting area has undergone the most marked change, whereas changes in moves to the suburbs or to the rest of Denmark have been less significant.
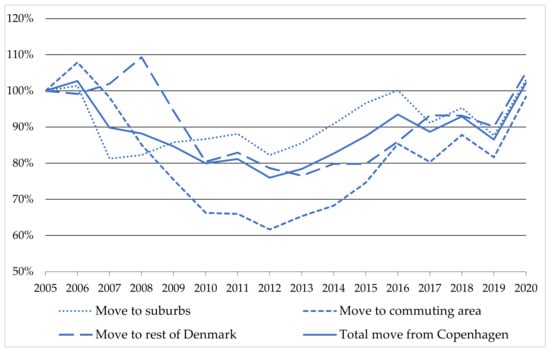
Figure 3.
Development in outmigration from Copenhagen between 2005 and 2020, divided by destination. The changes are shown in percentage (2005 = index 100). The numbers comprise people between 25 and 65 years of age who moved out of Copenhagen.
In total, approximately 19,000 individuals aged between 25 and 65 years, moved out of Copenhagen in 2005 (see Appendix A, Table A1), whereas the number of counter-urban migrants decreased to about 14,000 individuals in 2012. In 2005, approximately 5000 relocated to municipalities within commuting distance of Copenhagen, and in 2012, this number had decreased to about 3000 individuals. Approximately 10,500 moved to the suburbs in 2005, whereas in 2012 the number was 8500. In 2005, 3600 people moved to the rest of Denmark, and in 2012 this figure was 2900. In 2020, overall moves out of Copenhagen, as well as moves to the suburbs, were back at the 2005 level. The number of people who moved to a commuting area was still slightly below the 2005 level, whereas the total number who moved to the ´rest of Denmark’ had increased above the 2005 level (See Appendix A, Table A1).
In the following section, we describe what characterises those who move out of Copenhagen. The counter-urban migrants are characterised by a larger fraction of males, they are younger on average, and they are more likely to be employed and hold a long-cycle education than the non-movers. Among movers, there is a larger share who are couples with children. On the contrary, there as a smaller fraction of singles with children among the movers compared to the non-movers (see Appendix B, Table A2).
Table 1 presents descriptive statistics of the total population between the ages of 25 and 65 years who moved out of Copenhagen. The first column describes the overall mean of the migrants, while the second, third and fourth columns presents the migrants’ characteristics divided by choice of moving destination. We compare migrants who moved to a suburban municipality, those who moved to a municipality in Copenhagen’s commuting area and those who moved outside the Copenhagen commuting area, which we define as ‘rest of Denmark’. A noteworthy difference is that a larger share of those moving to an area outside the commuting area are singles without children, about 40 percent compared to only 24 to 27 percent of those who moved to suburban and commuting area, respectively. This group is also slightly older on average than those who moved to either a suburban area or a municipality within the commuting area. One reason for this pattern may be that migrants moving to the rest of Denmark consist of a larger share of people who have recently completed an education and who are moving in search of a place to start their careers. In support of this, Table 1 shows that a larger share of students and nonworking individuals moved to ‘rest of Denmark’ relative to the two other areas.

Table 1.
Descriptive statistics of the total population (age 25–65 years) who moved out of Copenhagen between 2005–2017.
Table 1 also shows that a larger share of migrants who moved to the rest of Denmark had a medium-cycle education, about 28 percent. On the contrary, the largest share of migrants with a long-cycle education is found among those who moved to a suburban municipality, namely about 23 percent compared to 17 percent of those who moved to other destination.
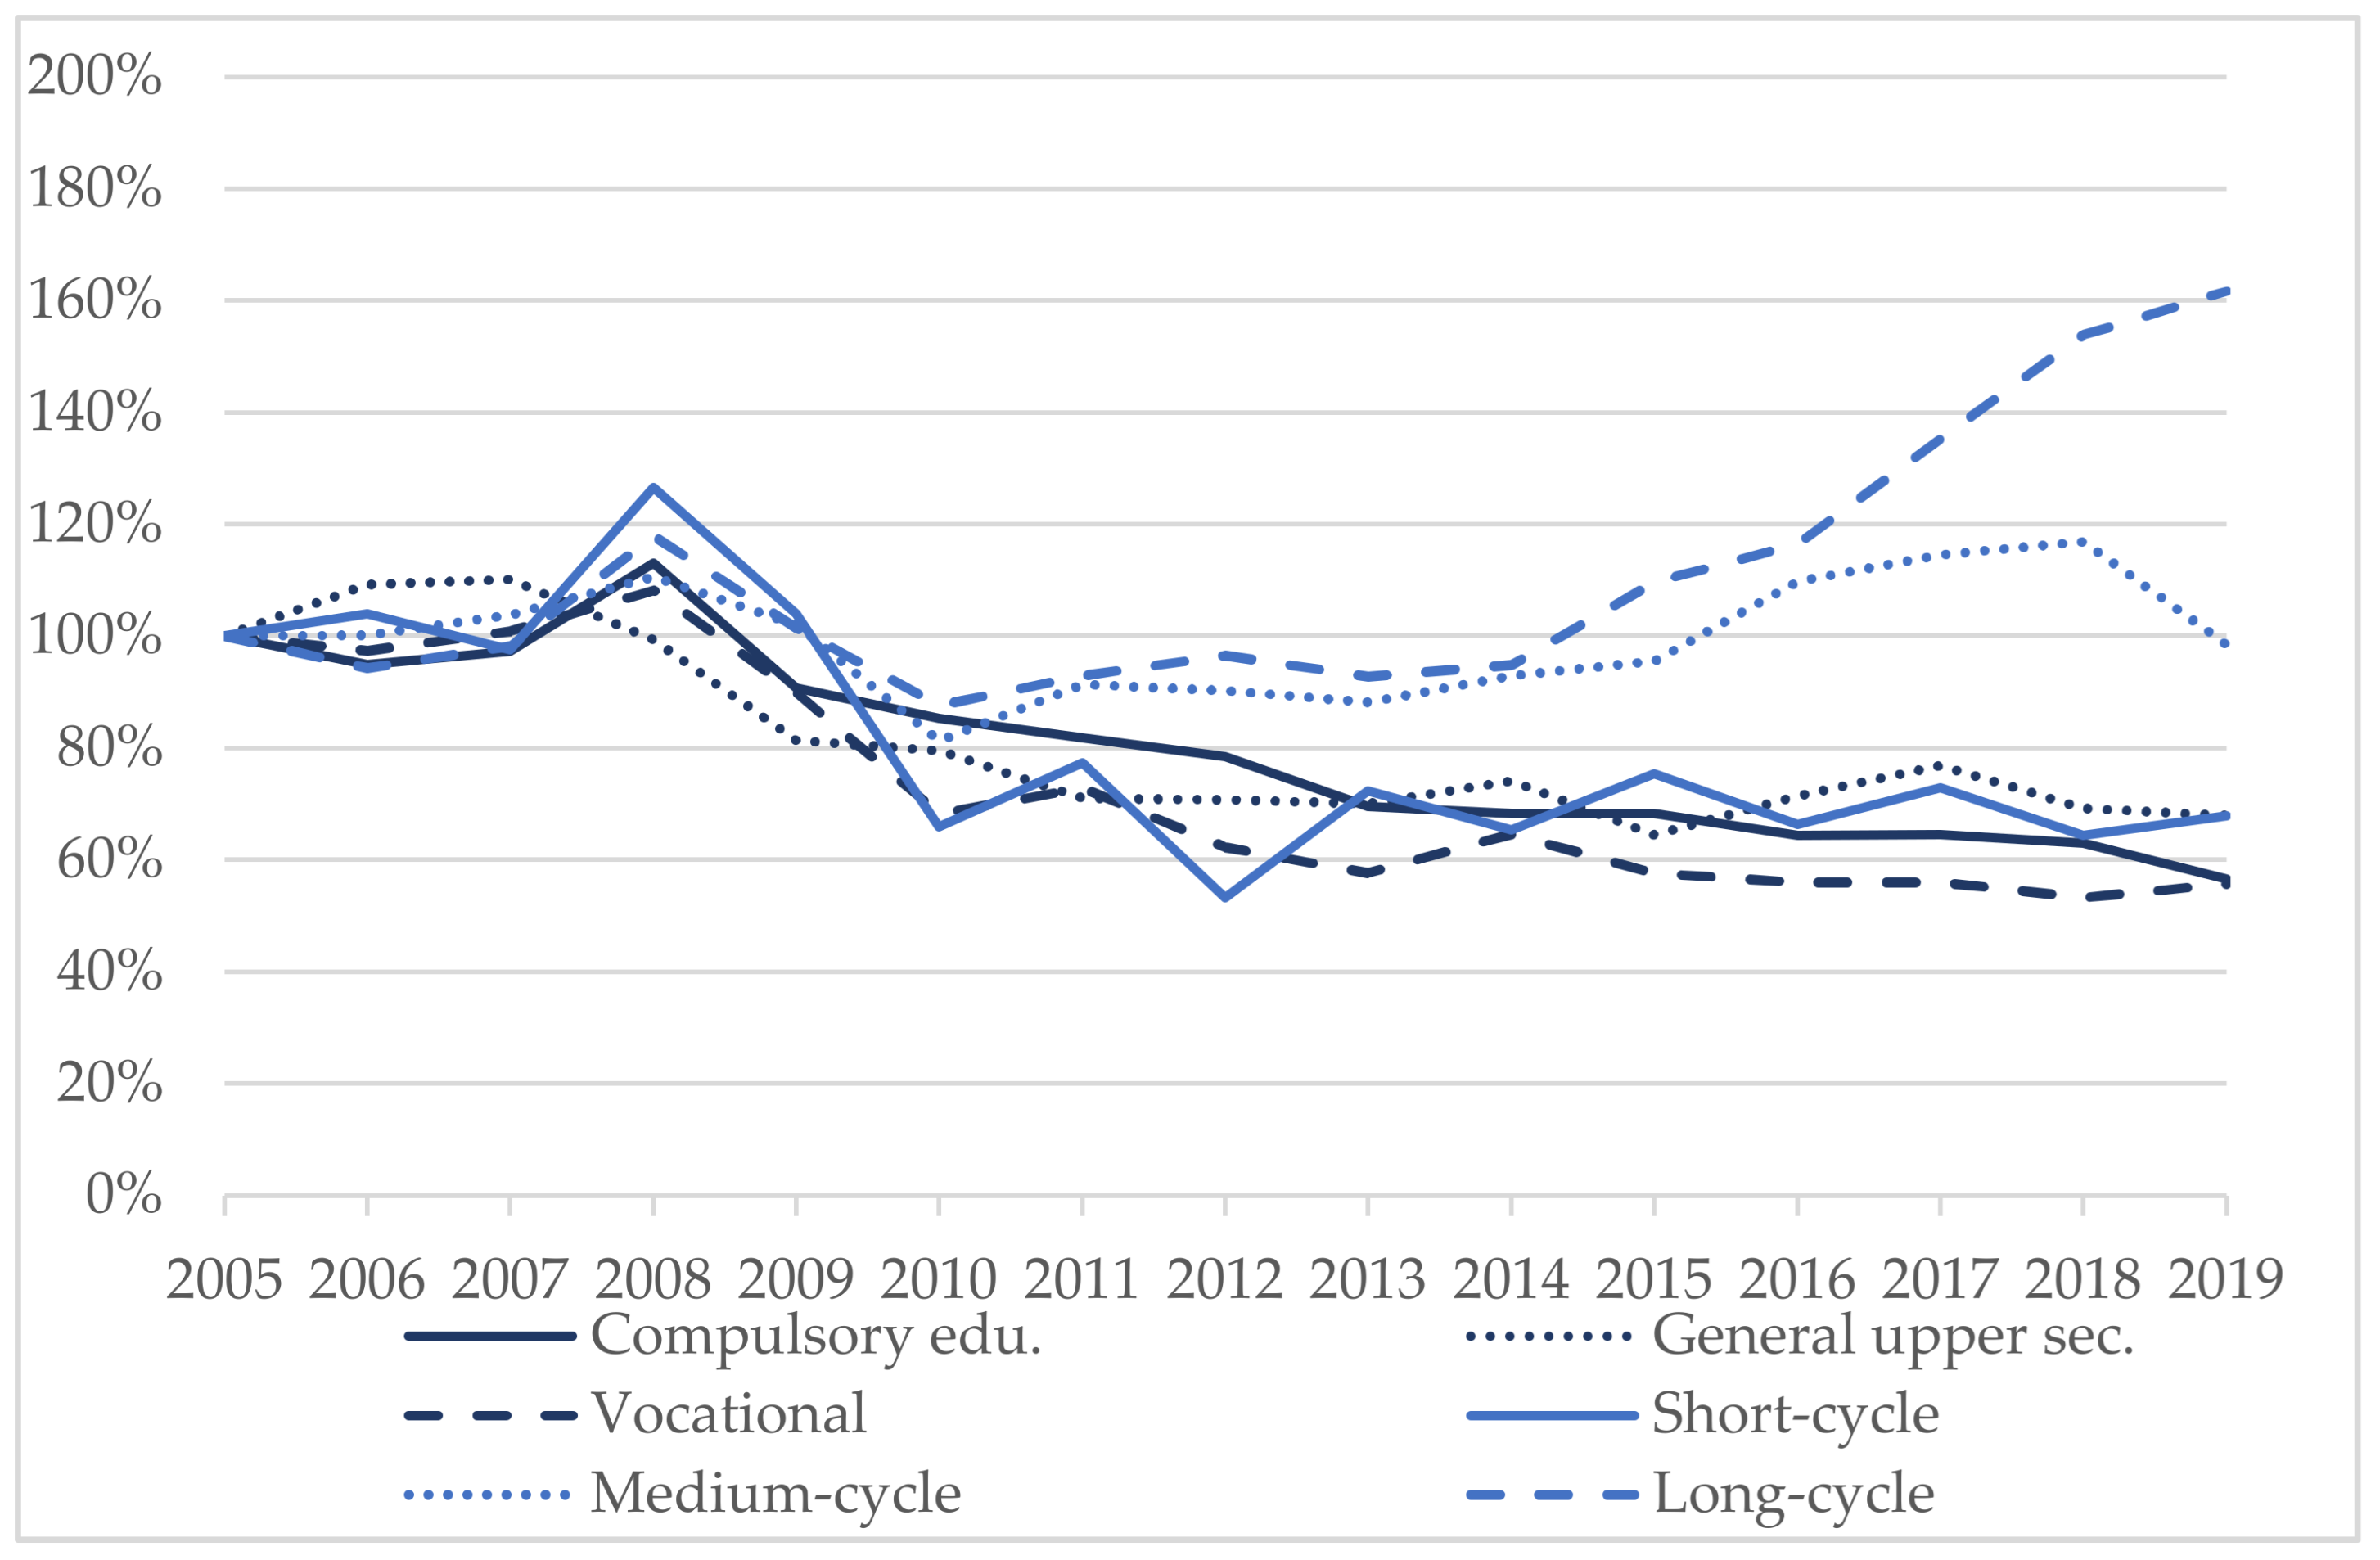
The migrants who moved to the rest of Denmark are relatively well educated, with about 45 percent holding a medium-or long-cycle education and 20 percent holding a vocational education. Figure 4 shows the development in education level among individuals who moved out of Copenhagen between 2005 and 2020. The figures shows that the number of people with a long-cycle education who moved out of Copenhagen has increased by 60 percent from 2005 to 2020. During the same period, the number of counter-urban migrants who held a compulsory education, general upper secondary education or a vocational education decreased by about 40 percent.
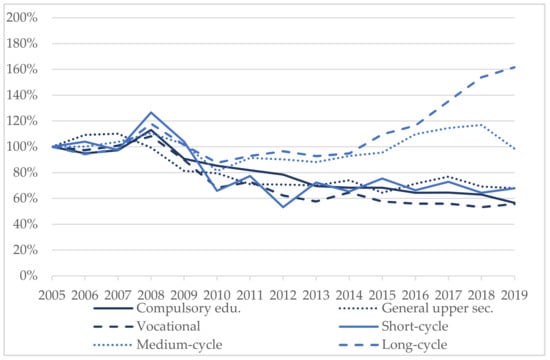
Figure 4.
Development in education level among individuals who moved out of Copenhagen between 2005 and 2020. The changes are shown in percentage (2005 = index 100). The numbers comprise people between 25 and 65 years of age who moved to “rest of Denmark” from Copenhagen.
One reason for the increasing share of highly educated migrants to ‘the rest of Denmark’ may be related to major changes in the labour market in recent decades, with an increase in the demand for highly skilled labour outside of the major urban areas as well, partly fuelled by the rationalisation and automation of work processes in the wake of the economic crisis in 2008. In addition, the public-sector job market has been undergoing substantial changes the last decade. First, a large generation of publicly employed individuals will be retiring in these years due to age, making room for younger, more highly educated people to enter the job market, not only in central parts of the country, but across all types of regions. Secondly, a reform of municipalities in Denmark in 2006 reduced their number from 290 to 98. As the new larger municipalities have been consolidated since 2006, this has opened up a demand for new types of jobs, especially in rural and peripheral municipalities. This again has provided an opportunity for young, well-educated individuals to move to out of the urban areas and enter jobs that match their competences. Thirdly, a large relocation plan of public-sector jobs was launched by the national government in 2015 in an attempt to generate more balanced development across Denmark and to fuel growth outside the major urban areas. This relocation plan created opportunities for highly skilled jobs, among other types, especially in intermediary and rural areas. These developments are a likely explanation for data showing that 28 percent of migrants to ‘the rest of Denmark’ are employed within the public sector. The influence of the relocation of public-sector jobs has been shown to be important by Hansen and Aner [14] and Sandow and Lundholm [15], and was also described as a motive by some of the migrants:
My spouse was offered an exciting job in relation to the relocation of public-sector jobs to a place where she grew up.
Another likely cause of the increase in migrants with medium-or long-cycle education is the increase in young people moving from all places in the country to pursue a university degree in Copenhagen. For this reason, more people with a long-cycle education are also likely to move back after completing their education. Despite the fact that the majority of higher education graduates stay in Copenhagen after graduation (about 65 percent lived in the city 10 years after graduation [48]) there is also a substantial share of highly educated individuals who leave the city. Our survey of migrants leaving Copenhagen to move to rural or peripheral municipalities shows that a common reason for moving is a wish to return to where one grew up, as expressed here:
I became a mother, finished my studies, and wanted to get away from the Copenhagen and back to a village I knew from my childhood in Lolland… I saw many in my social circles leave the city to move to another city or a village like I did.
Another respondent said:
We moved away from Copenhagen to get away from big-city life. There was too much noise, pollution, too many people, (it was) too hectic and (there was) not enough nature etc. We wanted to give our children the same safe surroundings and upbringing as ourselves.
Approximately 14.5 percent of the migrants were not in employment nor undertaking an education. This indicates that migration patterns are diverse in terms of education and skills, supporting findings by Skifter Andersen [49] and Nørgaard, et al. [13]. According to Lindgren [34] and Aner and Hansen [37], for example, a desire for affordable housing may be a reason for migrating to less urbanised settings. A great many of the respondents in our survey point to housing prices as an important reason for moving to rural and peripheral areas, stressing that buying housing in these areas represents more value for money. This is combined with a desire for lower housing costs, which offers more economic freedom and a better work–life balance, as expressed here:
We moved from Copenhagen to Møn (small island) because we could not afford a decent house in Copenhagen, needed more space and possibly to work less. And we also have family in Møn.
Another one said:
We had a son and needed more space, while also wanting a life with a slower pace and without two full-time jobs so we could be present for our boy.
Finally, Table 1 provides us with indications of the relationship between the destination of migrant activity and where migrants lived previously at the age of 15. It shows that a significantly higher share of those who moved to ‘rest of Denmark’ grew up in a rural or peripheral municipality, which indicates that many seek to go back to areas similar to where they grew up. This is also evident in many descriptions in our survey, as expressed here:
We just had a child and wanted to move to Fyn, where both of us grew up, in order to be closer to grandparents and because we didn’t want our daughter to grow up in Copenhagen.
Another respondent said: “We have ‘come home’. Have chosen to move and knew it was a compromise”.
4.2. Where Do Counter-Urban Migrants Move to and Why?
In the second part of the analysis, we describe where the counter-urban migrants move to, and the most common explanations of why they move.
In this study, we argue that counter-urban migration includes only migration outside the commuting area of Copenhagen to increase the possibility that migration activity is not just a move to a new place, but also a move to be independent of the Copenhagen job market, etc. However, the rest of Denmark also covers larger cities such as Aarhus, Odense, and Aalborg and a number of medium-size provincial cities. Thus, moving to the rest of Denmark does not necessarily involve a move to a non-urban setting. In order to examine the association between socio-demographic characteristics and moving destination, we divide the destination municipalities in ‘rest of Denmark’ into four categories: urban, intermediary, rural and peripheral, as described in Section 3.
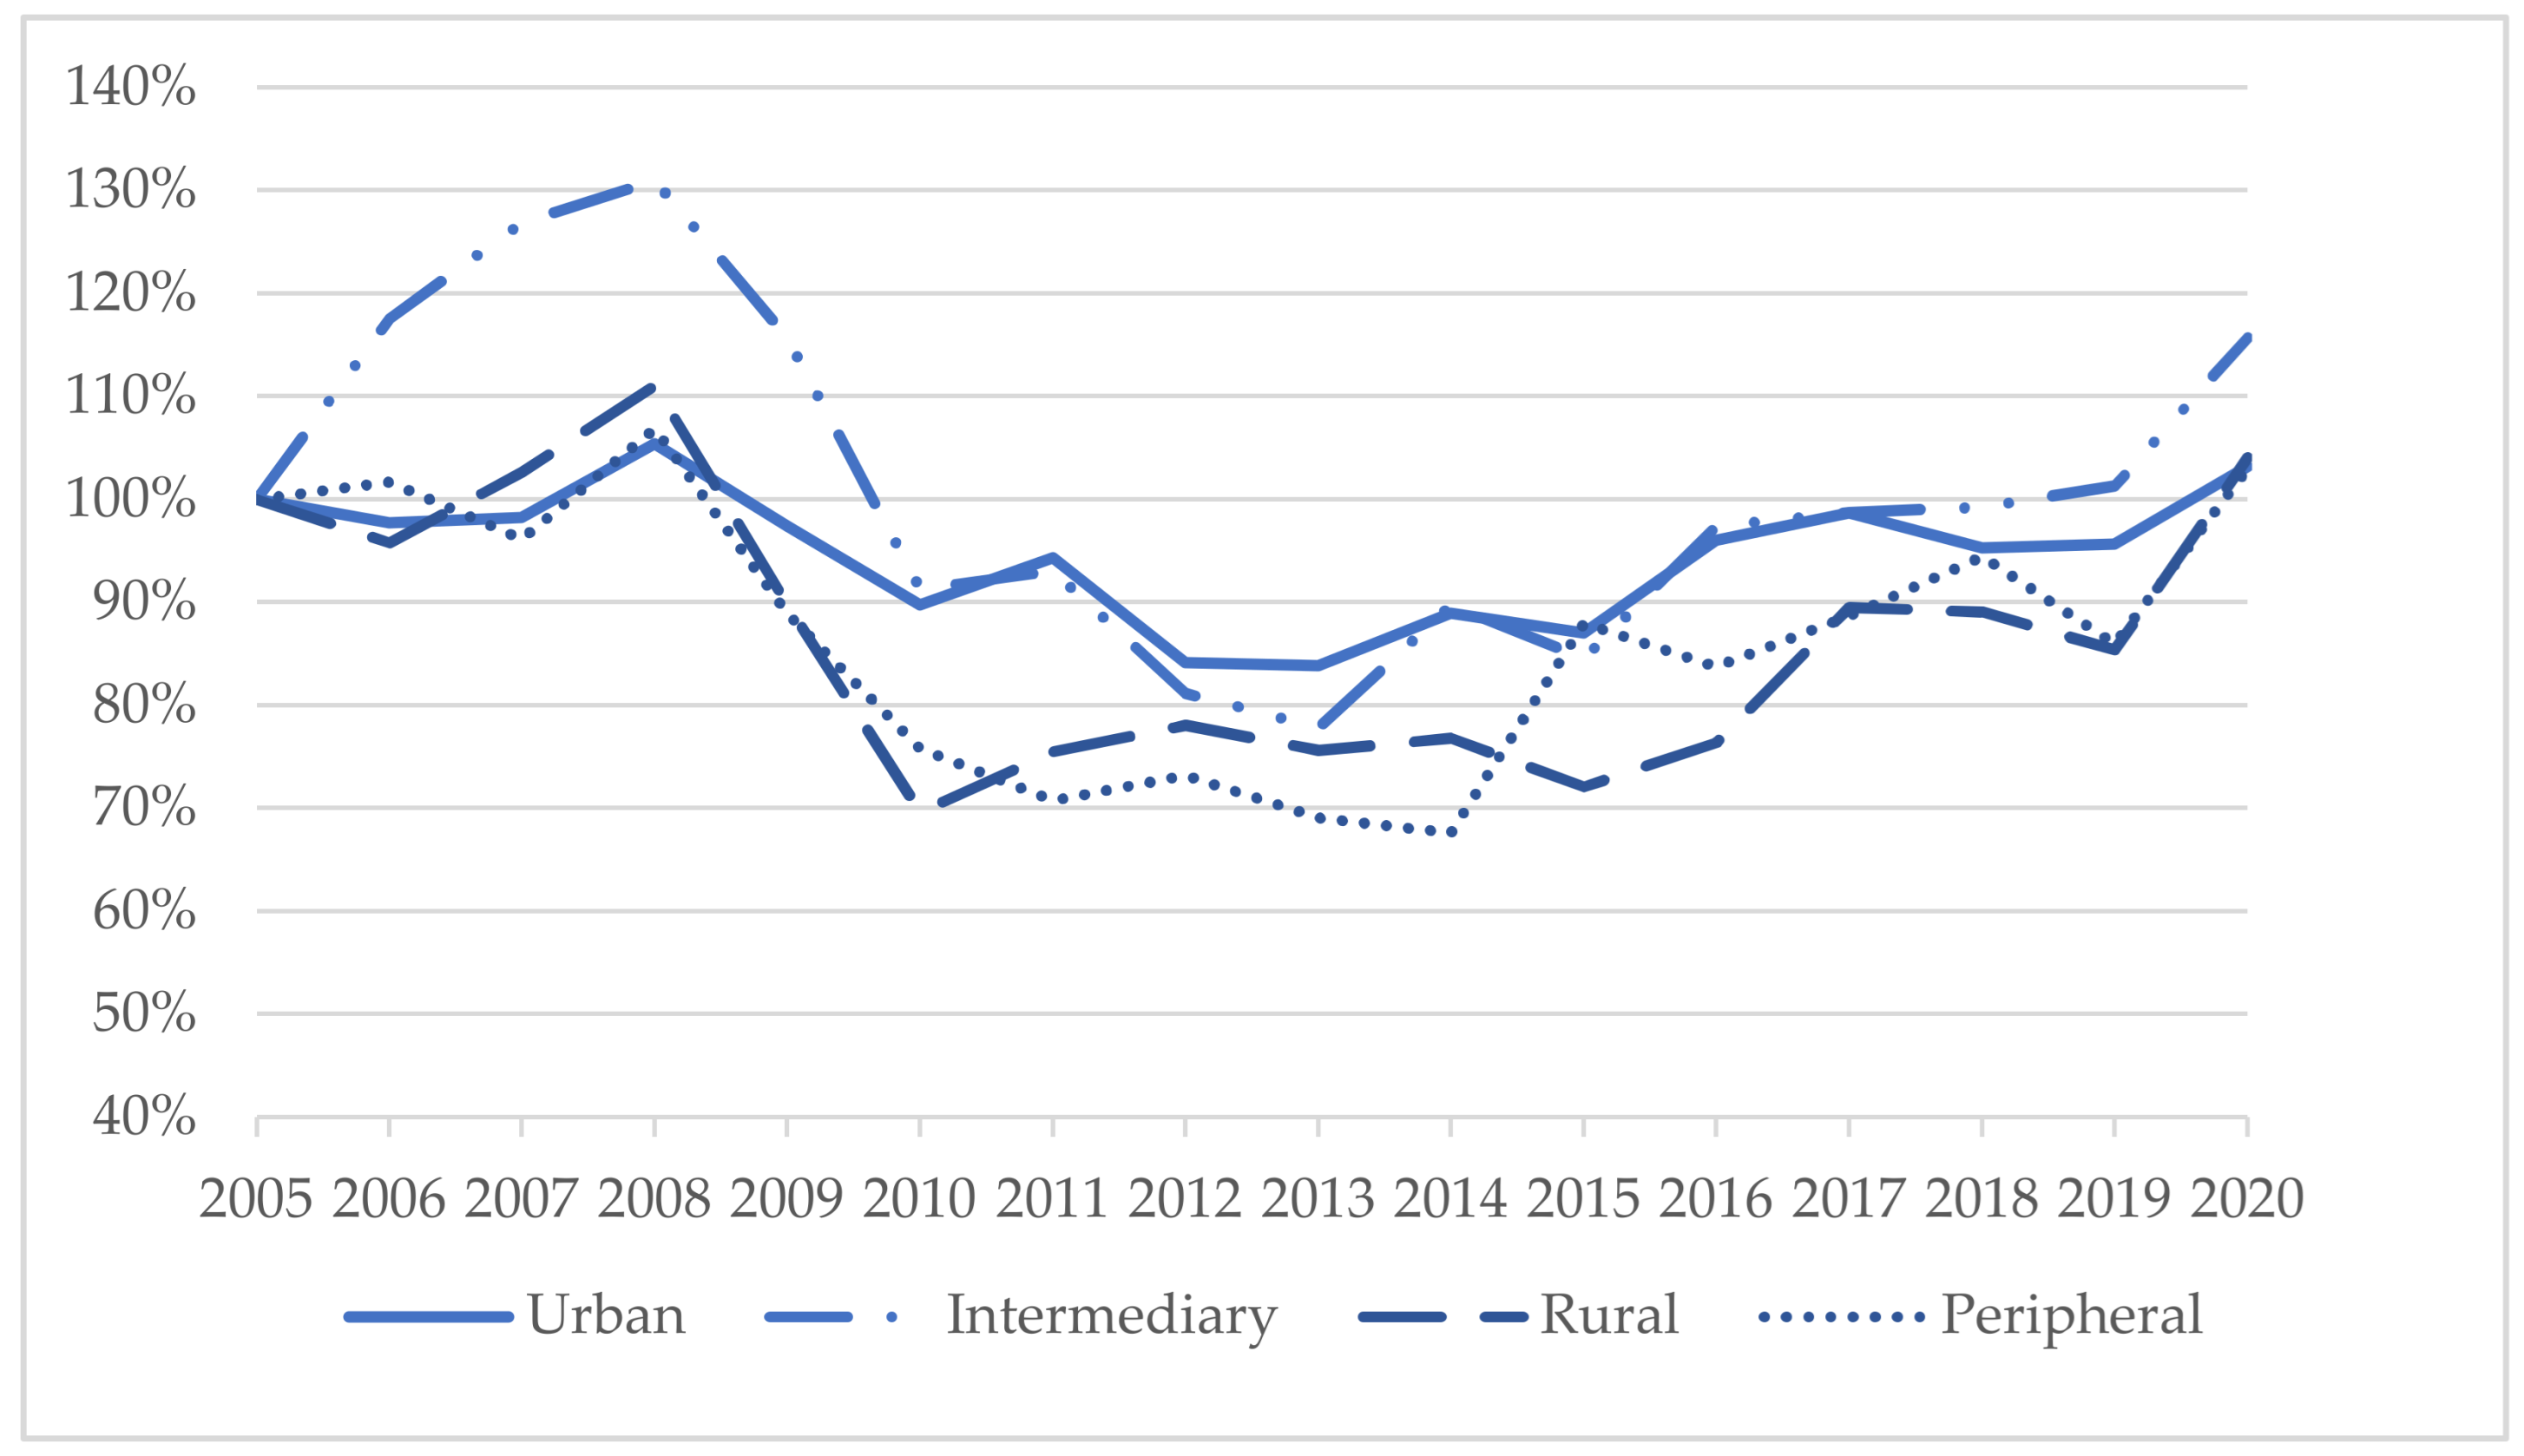
Figure 5 shows the development in outmigration from Copenhagen between 2005 and 2020, divided by municipality type of the moving destination. We see that all types of municipalities experienced a decline in the number of migrants who moved from Copenhagen in the years following the great recession. Rural and peripheral municipalities especially have had the largest decline compared to 2005, while urban- and intermediary municipalities have had a less marked decline. (The total number of counter-urban migrants is presented in Appendix C, Table A3.)
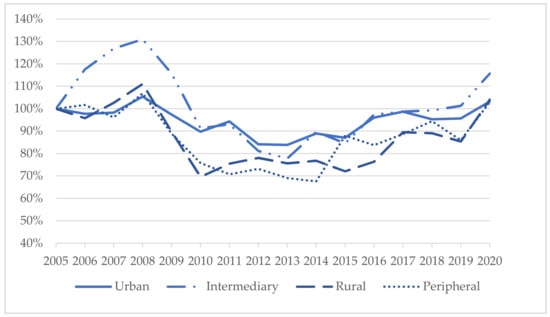
Figure 5.
Development in outmigration from Copenhagen between 2005 and 2020, divided by municipality type of the moving destination. The changes are shown in percentage (2005 = index 100). The numbers comprise people between 25 and 65 years of age who moved to “rest of Denmark” from Copenhagen.
Between 2012 and 2020, the trend shifted, and all municipality types received an increasing number of migrants from Copenhagen. In 2020 all types of municipalities had grown beyond the 2005 level. This pattern indicates that rural and peripheral municipalities are more sensitive to economic fluctuations relative to urban and intermediary municipalities. In addition, we see that by 2020 the number of counter-urban migrants who moved to intermediary municipalities had increased by 15 percent compared to 2005.
To improve our understanding of the association between individual characteristics and moving destination, we apply a multinominal logit model (MNL), as described in Section 3. Here, we focus solely on those individuals who moved from Copenhagen to ‘rest of Denmark’ between 2005–2017. We estimate the likelihood of moving to a given municipality type in relation to moving to an urban municipality among migrants who moved to ‘rest of Denmark. Table 2 presents the results for a subgroup of the population, namely those for whom we have information of their places of residence at the age of 15, in total N = 34,289. This is our preferred model, as we wish to investigate the association between choice of moving destination and social relations and living experiences earlier in one’s life course. The parameter estimates for the total population (N= 42,131) are presented in Appendix C Table A3. In the following section, we present the results from the MNL model alongside the insights from the qualitative survey.
Table 2.
Association between individual characteristics and moving destination, 2005–2017.
One of the most frequent reasons for moving is associated with family formation. The results in Table 1 and Table 2 both confirm that family type is strongly associated with moving destination. Table 1 showed that the majority of those who moved to ‘rest of Denmark’ were singles without children (41%). However, the singles who moved to ‘rest of Denmark’ were much more likely to move to an urban municipality compared to the other municipality types. Table 2 also shows that individuals with multiple children are significantly more likely to move to a peripheral municipality—especially singles with multiple children.
Our survey also confirms that moving away from the city is related to a phase of life in which one has one’s first child or more children. The most common motive for moving is thus related to a need for larger housing and a desire for more space both inside and outside the residence. This strongly coincides with the desire to live in the countryside or a small town, as expressed here:
We moved because we wanted our children to grow up close to nature and to (the children’s) grandparents in a well-functioning rural community with a feeling of togetherness. We very much liked our apartment in Nørrebro (central urban district in Copenhagen), the surroundings and local environment, but needed more space with two children and wanted them to have a childhood close to nature.
This quote, like other respondents cited earlier in the paper, shows that being close to one’s own or one’s partner’s parents and children’s grandparent is an important motive for migrating. Thus, it is not merely a wish for nature and the countryside generally, but for a specific countryside where parents and possibly other family and friends live. Many respondents rather express a specific wish to return to the place where they grew up.
The importance of social relations and living experiences earlier in one’s life course is confirmed by the results from the MNL model in Table 2. The results show a strong association between upbringing municipality and choice of moving destination, e.g., we see that individuals who lived in a peripheral municipality when they were 15 years old are more likely to move to a peripheral municipality, all else being equal. In addition, the model’s explanatory power (measured by R2) increases from 4 percent to 12 percent when upbringing municipality is included in the model (see Appendix D, Table A4 for a comparison).
Finally, we find that socio-economic characteristics are associated with choice of moving destination. Counter-urban migrants who held a long-cycle education were less likely to move to an intermediary, rural or peripheral municipality compared to an urban municipality. Furthermore, the results show that students who moved to ‘rest of Denmark’ were more likely to move to an urban municipality, where nonworking individuals were more likely to move to rural or peripheral municipality, compared to individuals who were employed.
The relatively higher cost of living in cities was also pointed out in the survey. One respondent stressed the balance between living in an expensive city and living outside urban areas and being left with more disposable income after the regular expenses have been paid:
It’s expensive to live in the city, which doesn’t allow economies for doing things with your family, such as travelling, going to a restaurant etc. There are immeasurable options in the city that you have to navigate and choose between, which I experience as stressful in terms of leisure activities, cultural events, seeing friends and family etc.
Although job opportunities are clearly concentrated in and around the big cities, especially for those with an academic background, a large proportion of the respondents describe starting a new job as a motive for moving to the countryside, and some even mention better job opportunities there as a reason to move. Others state that they moved to be closer to their or their partner’s job:
We moved from Frederiksberg (urban neighbourhood in Copenhagen) to Svendborg (small town in Funen) because of a unique job opportunity in Odense (main city in Funen).
The multinominal logit model shows that migrants who worked in the public sector are more likely to move to a rural or peripheral municipality compared to those who worked in the private sector. This corresponds with the findings of Hansen and Aner [14] and Sandow and Lundholm [15], who, based on research in Denmark and Sweden, respectively, point to a potential relationship between migration into rural and peripheral areas and the allocation of public-sector jobs. This is not directly evident from our survey, but some respondents explain their move based on getting a new job as follows:
Primarily because of work. Also a personal desire to get away from the city and move back to where I grew up.
Another respondent said:
I finished studying and got a job in another part of the country.
Additionally, the importance of jobs of spouses was evident in the case of some respondents, e.g.,
My wife got a new job in Viborg municipality. We moved there from the municipality of Copenhagen (because of the job) but also to come home to Jutland.
In sum, our analysis has shown that family type, socio-economic characteristics and social relations and upbringing area are important for the choice of moving destination. In our survey, the majority of respondents migrating from Copenhagen to rural and peripheral municipalities in the rest of Denmark describe a wide range of interrelated motives for moving, confirming findings from earlier studies of counter-urban migration. Thus, we find the need for more living space and a wish for a house with a garden to be dominant motives, along with economic considerations in favour of buying a cheap house in a rural setting, as confirmed by Sandow and Lundholm [15]. More accidental unsystematic explanations for migration, such as falling in love and moving in with a partner or getting divorced, are also evident from the responses.
While job and career possibilities are far from always being stressed in the survey responses, it may simply be taken for granted as an enabling factor, as stressed by, e.g., Coulter and Scott [50], Niedomysl and Hansen [51] and Hansen and Aner [14]. However, this could also be evidence that economic motives come second to non-economic motives, as demonstrated by, e.g., Halfacree [18], who found that while a job may initially be presented as the main reason for moving, it became clear in interviews that a specific place had been chosen and that the search for a new job was centred around this. In accordance with much research on counter-urban migration, e.g., Aner [35] and Nørgaard, et al. [13], the survey shows that respondents clearly stress the importance of nature, and some also of living in a small community, as important when moving to rural places. Not least, the survey confirmed findings from previous studies, e.g., Ní Laoire [27], Hidalgo and Hernandez [28], and Cuba and Hummon [29], stressing that family and social relations were very important motives for counter-urban migration, but for some migrants it was also a desire to try something new by moving to places without prior connections. The desire to be close to parents, grandparents or friends, especially when having children, was a substantial motive for many respondents. As also pointed out by, e.g., Ærø, et al. [41], this might be due to a wish to return to one’s roots, thus demonstrating a strong bond with particular places.
5. Conclusions
Counter-urbanisation is a term that covers a complex number of relations and processes related to migration flows from larger cities to exurbia, that is, to areas outside the functional urban region. In this article, the concept includes relocations that take place from Copenhagen to areas west of the Greater Belt (approximately 150 km from central Copenhagen). Counter-urban migration represents a tiny share of all moves related to the constant exchange of people between various municipalities. However, although modest in size, they are of great importance to rural areas and their development. They are also important to maintain well-functioning local communities; therefore, counter-urban migration is an important process.
Our study shows that counter-urban migrants who move to the periphery are not decisively different from anyone else who moves. Our study also shows that, as expected, the motives for migrating found here are almost unchanged from the motives identified in previous studies: young people move away from home to both acquire an education and find work, form partnerships and eventually become families with children, thereby needing more space. What has changed is the interregional balance of employment, educational opportunities and relative costs of accommodation. The number of academic counter urbanization migrants has increased by 60 percent from 2005 to 2020, which ceteris paribus provide a better-educated labour force also outside the largest cities. Here, we suggest that the public sector plays an important role, as the need for new competences in the relatively new and larger municipalities and the relocation of government jobs has provided an increase in graduate jobs in peripheral regions as well.
Rural districts receive a third of all migrants from Copenhagen to the rest of Denmark. Employment opportunities are of course important, but so is the possibility of moving into detached housing and living close to friends and relatives. In addition, the desire to be close to nature, peace and quiet, and the existence of a local community are stated as important motives. Finally, for a substantial proportion of the ‘counter-urban migrants’, there is a wish to return to the place of upbringing, either one’s own or one’s partner’s. Thus, many factors influence when an individual or household decides to relocate. Any decision is in the end the outcome of balancing options and preferences.
The changes in out-migration from the largest cities during the last ten to fifteen years show a clear relationship with economic conditions: in times of upturn, sizeable decentralization takes place, but in times of downturn (e.g., 2008–2015) we witness the opposite trend, probably strongly influenced by developments in the housing and labour markets. The crisis years stand out, with less relocation from the big cities compared to the periods before and after. Yet, from 2016, the pattern is back to that before the recession in 2008: favourable economic conditions increase property prices in the larger cities and force many families with growing space needs further away, e.g., into the suburbs. However, a smaller group wants to move away from the larger cities and settle in rural settings outside the commuting areas of the big cities. These migrants are an important precondition for the continued development of the peripheral areas and thereby counter-urban migration. Their motives for moving form an important contribution to the future economic and social sustainability of rural and peripheral areas.
Author Contributions
Writing—original draft, H.T.A., A.E.-P., H.K.H., E.S.L. and H.N. All authors have contributed equally to this article. All authors have read and agreed to the published version of the manuscript.
Funding
This research received no external funding.
Institutional Review Board Statement
Not applicable.
Informed Consent Statement
Not applicable.
Data Availability Statement
All data are generated through administrative registers retrieved from Statistics Denmark.
Conflicts of Interest
The authors declare no conflict of interest.
Appendix A
Table A1.
Number of people (aged 25–65 years old) who moved out of Copenhagen, divided by destination, 2005–2020.
Table A1.
Number of people (aged 25–65 years old) who moved out of Copenhagen, divided by destination, 2005–2020.
| Suburbs | Commuting Area | Rest of Denmark | Total | |
|---|---|---|---|---|
| 2005 | 10,449 | 4998 | 3624 | 19,071 |
| 2006 | 10,648 | 5406 | 3613 | 19,667 |
| 2007 | 8506 | 4929 | 3718 | 17,153 |
| 2008 | 8482 | 4216 | 4002 | 16,700 |
| 2009 | 8850 | 3689 | 3453 | 15,992 |
| 2010 | 8936 | 3211 | 2913 | 15,060 |
| 2011 | 9116 | 3145 | 3033 | 15,294 |
| 2012 | 8471 | 2939 | 2896 | 14,306 |
| 2013 | 8799 | 3046 | 2825 | 14,670 |
| 2014 | 9373 | 3228 | 2948 | 15,549 |
| 2015 | 10,025 | 3612 | 2949 | 16,586 |
| 2016 | 10,361 | 4149 | 3155 | 17,665 |
| 2017 | 9407 | 3905 | 3399 | 16,711 |
| 2018 | 9833 | 4259 | 3380 | 17,472 |
| 2019 | 8992 | 3977 | 3298 | 16,267 |
| 2020 | 10,505 | 4668 | 3798 | 18,971 |
| Total | 150,753 | 63,377 | 53,004 | 267,134 |
Appendix B
Table A2.
Descriptive statistics of movers and non-movers, 2005–2017.
Table A2.
Descriptive statistics of movers and non-movers, 2005–2017.
| Non-Movers | Movers | ||||
|---|---|---|---|---|---|
| Mean | Std. Dev. | Mean | Std. Dev | ||
| Municipality type @ 15 years of age | |||||
| From urban municipality @ 15 | 0.660 | 0.474 | 0.611 | 0.487 | |
| From intermediary municipality @ 15 | 0.110 | 0.313 | 0.124 | 0.330 | |
| From rural municipality @ 15 | 0.166 | 0.372 | 0.189 | 0.392 | |
| From peripheral municipality @ 15 | 0.064 | 0.245 | 0.075 | 0.263 | |
| Women | 0.501 | 0.500 | 0.486 | 0.500 | |
| Age | 41.315 | 11.955 | 36.560 | 9.464 | |
| Family type | |||||
| Single w/o child | 0.425 | 0.494 | 0.279 | 0.449 | |
| Single with one child | 0.034 | 0.182 | 0.029 | 0.167 | |
| Single with multiple children | 0.018 | 0.135 | 0.017 | 0.129 | |
| Couple w/o child | 0.276 | 0.447 | 0.375 | 0.484 | |
| Couple with one child | 0.116 | 0.320 | 0.180 | 0.384 | |
| Couple with multiple children | 0.131 | 0.337 | 0.120 | 0.325 | |
| Residential size per person (m2) | 58.472 | 92.372 | 85.147 | 311.159 | |
| Highest achieved education | |||||
| Elementary school | 0.175 | 0.380 | 0.142 | 0.349 | |
| General upper secondary education | 0.129 | 0.336 | 0.118 | 0.323 | |
| Vocational education | 0.230 | 0.421 | 0.240 | 0.427 | |
| Short-cycle education | 0.046 | 0.210 | 0.057 | 0.232 | |
| Medium-cycle education | 0.236 | 0.425 | 0.240 | 0.427 | |
| Long-cycle education | 0.183 | 0.387 | 0.202 | 0.402 | |
| Gross income (10,000 DKK) | 345,387 | 188,079 | 363,433 | 186,112 | |
| Labour market attachment | |||||
| Working | 0.763 | 0.425 | 0.817 | 0.387 | |
| Student | 0.036 | 0.187 | 0.038 | 0.191 | |
| Nonworking | 0.200 | 0.400 | 0.145 | 0.352 | |
| Work in public | 0.273 | 0.445 | 0.270 | 0.444 | |
| Observations | 4,380,183 | 210,085 | |||
Appendix C
Table A3.
Number of people (aged 25–65 years old) who moved from Copenhagen to “rest of Denmark”, divided by municipality type of destination, 2005–2020.
Table A3.
Number of people (aged 25–65 years old) who moved from Copenhagen to “rest of Denmark”, divided by municipality type of destination, 2005–2020.
| Urban Municipality | Suburban Municipality | Rural Municipality | Peripheral Municipality | Total | |
|---|---|---|---|---|---|
| 2005 | 1356 | 388 | 1340 | 540 | 3624 |
| 2006 | 1325 | 456 | 1283 | 549 | 3613 |
| 2007 | 1332 | 492 | 1375 | 519 | 3718 |
| 2008 | 1429 | 508 | 1488 | 577 | 4002 |
| 2009 | 1321 | 449 | 1203 | 480 | 3453 |
| 2010 | 1217 | 354 | 933 | 409 | 2913 |
| 2011 | 1279 | 361 | 1011 | 382 | 3033 |
| 2012 | 1140 | 315 | 1046 | 395 | 2896 |
| 2013 | 1137 | 302 | 1013 | 373 | 2825 |
| 2014 | 1206 | 348 | 1029 | 365 | 2948 |
| 2015 | 1180 | 328 | 966 | 475 | 2949 |
| 2016 | 1302 | 378 | 1023 | 452 | 3155 |
| 2017 | 1338 | 383 | 1199 | 479 | 3399 |
| 2018 | 1292 | 385 | 1193 | 510 | 3380 |
| 2019 | 1297 | 393 | 1144 | 464 | 3298 |
| 2020 | 1399 | 449 | 1394 | 556 | 3798 |
| Total | 20,550 | 6289 | 18,640 | 7525 | 53,004 |
Appendix D
Table A4.
Association between individual characteristics and moving destination, 2005–2017.
Table A4.
Association between individual characteristics and moving destination, 2005–2017.
| Moving Destination (Ref. = Urban Municipality) | Intermediary Municipality | Rural Municipality | Peripheral Municipality | |
|---|---|---|---|---|
| Women (ref. = men) | 0.064 * | −0.008 | 0.006 | |
| −(0.035) | −(0.024) | −(0.032) | ||
| Age | 0.065 **** | 0.029 ** | 0.089 **** | |
| −(0.016) | −(0.011) | −(0.013) | ||
| Age2 | −0.001 *** | 0.000 | −0.000 * | |
| (0.000) | (0.000) | (0.000) | ||
| Family type (ref. = single without children) | ||||
| Single with one child | 0.279 ** | 0.239 *** | 0.409 **** | |
| −(0.112) | −(0.078) | −(0.093) | ||
| Single with multiple children | 0.291 * | 0.471 **** | 0.752 **** | |
| −(0.165) | −(0.111) | −(0.125) | ||
| Couple w/o child | 0.258 **** | 0.065 ** | 0.060 * | |
| −(0.041) | −(0.028) | −(0.036) | ||
| Couple with one child | 0.649 **** | 0.397 **** | 0.256 **** | |
| −(0.053) | −(0.039) | −(0.053) | ||
| Couple with multiple children | 0.789 **** | 0.556 **** | 0.647 **** | |
| −(0.067) | −(0.052) | −(0.063) | ||
| Residential size per person (m2) | 0.002 **** | 0.002 **** | 0.002 **** | |
| (0.000) | (0.000) | (0.000) | ||
| Highest achieved education (ref. = elementary school) | ||||
| High school | −0.392 **** | −0.499 **** | −0.705 **** | |
| −(0.069) | −(0.046) | −(0.058) | ||
| Vocational education | −0.012 | −0.096 ** | −0.207 **** | |
| −(0.065) | −(0.044) | −(0.052) | ||
| Short-cycle education | −0.176 ** | −0.400 **** | −0.812 **** | |
| −(0.088) | −(0.062) | −(0.084) | ||
| Medium-cycle education | −0.249 **** | −0.524 **** | −0.761 **** | |
| −(0.063) | −(0.043) | −(0.052) | ||
| Long-cycle education | −0.502 **** | −0.873 **** | −1.107 **** | |
| −(0.068) | −(0.048) | −(0.060) | ||
| Gross income (in 10,000 DKK) | 0.019 **** | 0.012 **** | 0.007 ** | |
| −(0.003) | −(0.002) | −(0.003) | ||
| Gross income2 (in 10,000 DKK) | −0.000 **** | −0.000 **** | −0.000 **** | |
| (0.000) | (0.000) | (0.000) | ||
| Labour market attachment (ref. = working) | ||||
| Student | −0.371 **** | −0.380 **** | −0.613 **** | |
| −(0.077) | −(0.049) | −(0.072) | ||
| Nonworking | 0.075 | 0.071 ** | 0.100 ** | |
| −(0.050) | −(0.035) | −(0.042) | ||
| Dummy for working in the public sector (ref. = work in private sector) | −0.074 * | 0.159 **** | 0.249 **** | |
| −(0.040) | −(0.028) | −(0.037) | ||
| Year fixed effects | X | X | X | |
| Constant | −3.272 **** | −1.169 **** | −3.211 **** | |
| −(0.330) | −(0.228) | −(0.279) | ||
| Observations | 42,131 | 42,131 | 42,131 | |
| R2 | 0.043 | 0.043 | 0.043 | |
Note: Appendix table D presents the log odds of moving to a given municipality type, in relation to moving to an urban municipality (ref.), from a multinomial logit model. The estimates comprise only the sub-population who moves from Copenhagen to “the rest of Denmark”. Standard errors are in parentheses. * p < 0.10, ** p < 0.05, *** p < 0.01, **** p < 0.001.
References
- Ascher, F. Urban Homogenisation and Diversification in West Europe. In Globalism and Local Democracy: Challenge and Change in Europe and North America; Hambleton, R., Savitch, H., Stewart, M., Eds.; Palgrave: Basingstoke, UK, 2022; pp. 52–66. [Google Scholar]
- Andersen, H.T.; Engelstoft, S. Fra ‘by og land’ til bylandskab. In Den Mangfoldige By; Skifter Andersen, H., Andersen, H.T., Eds.; Statens Byggeforskningsinstitut: Hørsholm, Denmark, 2004. [Google Scholar]
- Sieverts, T. Cities Without Cities: An Interpretation of the Zwischenstadt; Spoon Press: Oxon, UK, 2003. [Google Scholar]
- Champion, A. Counterurbanisation: The Changing Pace and Nature of Population Deconcentration; Edward Arnold: London, UK, 1989. [Google Scholar]
- Van den Berg, L.; Drewet, R.; Klaassen, L.H. A Study of Growth and Decline; Oxford: Pergamon, Turkey, 1982. [Google Scholar]
- Florida, R. The Rise of the Creative Class: And How It’s Transforming Work, Leisure, Community, and Everyday Life; Perseus Books: New York, NY, USA, 2002. [Google Scholar]
- Scott, A.J. Resurgent Metropolis: Economy, Society and Urbanization in an Interconnected World. Int. J. Urban Reg. Res. 2008, 32, 548–564. [Google Scholar] [CrossRef]
- Storper, M.; Scott, A.J. Rethinking human capital, creativity and urban growth. J. Econ. Geogr. 2009, 9, 147–167. [Google Scholar] [CrossRef] [Green Version]
- Glaeser, E.L. The challenge of urban policy. J. Policy Anal. Manag. 2012, 31, 111–122. [Google Scholar] [CrossRef]
- Chen, Y.; Rosenthal, S.S. Local amenities and life cycle migration: Do people move for jobs or fun? J. Urban Econ. 2008, 64, 519–537. [Google Scholar] [CrossRef]
- Clark, T.N.; Lloyd, R.; Wong, K.K.; Jain, P. Amenities drive urban growth. J. Urban Aff. 2002, 24, 493–515. [Google Scholar] [CrossRef]
- Mitchell, C. Making sense of counterurbanization. Rural. Stud. 2004, 20, 15–34. [Google Scholar] [CrossRef]
- Nørgaard, H.; Jensen, J.O.; Simon, C.; Andersen, H.S. Tilflyttere til Yderområder: Forandring, Integration og Strategier; SBI forlag: Hørsholm, Denmark, 2010; Available online: http://www.sbi.dk/boligforhold/boliger/tilflyttere-til-yderomrader/tilflyttere-til-yderomrader-forandring-integration-og-strategier/ (accessed on 15 March 2022).
- Hansen, H.K.; Aner, L.G. On the location dynamics of highly educated people migrating to peripheral regions of Denmark. Popul. Space Place 2017, 23, e2076. [Google Scholar] [CrossRef]
- Sandow, E.; Lundholm, E. Which families move out from metropolitan areas? Counterurban migration and professions in Sweden. Eur. Urban Reg. Stud. 2022, 27, 276–289. [Google Scholar] [CrossRef]
- Bosworth, G.; Finke, H.B. Commercial Counterurbanisation: A driving force in rural economic development. Econ. Space 2020, 52, 654–674. [Google Scholar] [CrossRef]
- Champion, A.G. Studying counterurbanisation and the rural population turnaround. In Migration into Rural Areas: Theories and Issues; Boyle, P., Halfacree, K., Eds.; Wiley: Chichester, UK, 1998; pp. 21–40. [Google Scholar]
- Halfacree, K.H. A Utopian Imagination in Migration’s Terra Incognita? Acknowledging the Non-Economic Worlds of Migration Decision-Making. Popul. Space Place 2004, 10, 239–253. [Google Scholar] [CrossRef]
- Bijker, R.A.; Haartsen, T.; Strijker, D. Different Areas, Different People? Migration to Popular and Less-Popular Rural Areas in the Netherlands. Popul. Space Place 2013, 19, 580–593. [Google Scholar] [CrossRef]
- Böheim, R.; Taylor, M.P. Tied down or room to move? Investigating the relationships between housing tenure, employment status and residential mobility in Britain. Scott. J. Political Econ. 2002, 49, 369–392. [Google Scholar] [CrossRef]
- Sjaastad, L.A. The Costs and Returns of Human Migration. J. Politi. Econ. 1962, 70, 80–93. [Google Scholar] [CrossRef]
- Lee, E.S. A Theory of Migration. Demography; Springer: Berlin/Heidelberg, Germany, 1966; Volume 3, pp. 47–57. [Google Scholar]
- Todaro, M.P. Migration and economic development: A review of theory, evidence, methodology and research priorities. In Occasional Paper 18; Institute for Development Studies, University of Nairobi: Nairobi, Kenya, 1976; Volume 70, pp. 80–93. [Google Scholar]
- De Jong, G.F.; Fawcett, J.T. Fawcett Motivations for Migration: An Assessment and a Value-Expectancy Research Mode. In Migration Decision Making Multidisciplinary Approaches to Microlevel Studies in Developed and Developing Countries; Elsevier: Amsterdam, The Netherlands, 1981. [Google Scholar]
- Lundholm, E.; Malmberg, G. Gains and losses, outcomes of interregional migration in the five Nordic countries. Geogr. Ann. Ser. B Hum. Geogr. 2006, 88, 35–48. [Google Scholar] [CrossRef]
- Brown, D.L. Migration and community: Social networks in a multilevel World. Rural. Sociol. 2002, 67, 1–23. [Google Scholar] [CrossRef]
- Ní Laoire, C. The ‘green green grass of home’? Return migration to rural Ireland. J. Rural. Stud. 2007, 23, 332–344. [Google Scholar] [CrossRef] [Green Version]
- Hidalgo, M.C.; Hernández, B. Place attachment: Conceptual and empirical questions. J. Environ. Psychol. 2001, 21, 273–281. [Google Scholar] [CrossRef]
- Cuba, L.; Hummon, D.M. Constructing a sense of home: Place affiliation and migration across the life cycle. In Sociological Forum; Springer: Berlin/Heidelberg, Germany, 1993; Volume 8. [Google Scholar]
- Hanson, S.; Pratt, G. Reconceptualizing the links between home and work in Urban Geography. In Economic Geography; Taylor & Francis, Ltd.: Oxfordshire, UK, 1988; Volume 64. [Google Scholar]
- Halfacree, K.; Boyle, P.J. The challenge facing migration research: The case for a biographical approach. Prog. Hum. Geogr. 1993, 17, 333–348. [Google Scholar] [CrossRef]
- Wingens, M.; Aybek, C.; de Valk, H.; Windzio, M. A Life-Course Perspective on Migration and Integration; Springer: Amsterdam, The Netherlands, 2011; pp. 1–26. [Google Scholar]
- Boyle, P.; Halfacree, K.; Robinson, V. Exploring Contemporary Migration; Routledge: Oxfordshire, UK, 2014. [Google Scholar]
- Lindgren, U. Who is the counter-urban mover? Evidence from the Swedish urban system. Int. J. Popul. Geogr. 2003, 9, 399–418. [Google Scholar] [CrossRef]
- Aner, L.G. Udflytninger fra København. Børnefamiliers Udflytninger og Bostedsvalg i et Hverdagslivsperspektiv. Ph.D. Thesis, Det Naturvidenskabelige Fakultet, Københavns Universitet, København, Denmark, 2009. [Google Scholar]
- Andersen, H.S.; Nørgaard, H. Motives for moving to rural, peripheral areas: Work, “rural idyll” or “income transfer”. Geoforum Perspekt. 2012, 11, 32–44. Available online: http://ojs.statsbiblioteket.dk/index.php/gfp/article/view/7833 (accessed on 15 March 2022).
- Aner, L.G.; Hansen, H.K. Flytninger Fra Byer Til Land Og Yderområder. Højtuddannede Og Socialt Udsatte Gruppers Flytninger Fra Bykommuner Til Land- Og Yderkommuner—Mønstre Og Motiver; SFi—Det Nationale Forskningscenter for Velfærd: København, Denmark, 2014. [Google Scholar]
- Hansen, H.K.; Winther, L. Regional development and the impact of the public sector in Denmark: Employment growth and human capital. Geogr. Tidsskr. Dan. J. Geogr. 2014, 114, 156–168. [Google Scholar] [CrossRef]
- Neergaard, M.D. Doing the Urban Countryside. Ph.D. Thesis, Roskilde Universitet, Roskilde, Denmark, 2014. [Google Scholar]
- Mazanti, B. Choosing Residence, Community and Neighbours: Theorizing Families’ Motives for Moving. Geogr. Ann. Ser. B Hum. Geogr. 2007, 89, 53–68. [Google Scholar] [CrossRef]
- Ærø, T.; Suenson, V.; Skifter Andersen, H. Bo-Sætning i Yderområder (Settlement in Fringe Areas); Statens Byggeforskningsinstitut: Hørsholm, Denmark, 2004. [Google Scholar]
- Hansen, H.K.; Lyngemark, D.H.; Weatherall, C.D. Migration and employment after an economic shock: Regional characteristics and migration patterns. Reg. Stud. 2021, 55, 907–920. [Google Scholar] [CrossRef]
- Statistics Denmark. Færre og Større Pendlingsregioner. Available online: https://www.dst.dk/Site/Dst/Udgivelser/nyt/GetAnalyse.aspx?cid=28054 (accessed on 13 March 2022).
- Ministry of Interior; Ministry of Health; Ministry of Food, Agriculture and Fisheries. Landdistriktsredegørelse 2011—Regeringens Redegørelse til Folketinget; Indenrigs- og Sundhedsministeriet og Fødevareministeriet: København, Denmark, 2011.
- Andersen, H.T.; Winther, L. Crisis in the Resurgent City? The Rise of Copenhagen. Int. J. Urban Reg. Res. 2010, 34, 693–700. [Google Scholar] [CrossRef]
- Hansen, H.K.; Winther, L. The Urban Turn: Cities, Talent and Knowledge in Denmark; University Press: Aarhus, Denmark, 2012. [Google Scholar]
- Andersen, H.S.; Nørgaard, H.; Jensen, J.O.; Simon, C. Yderområderne og Deres til- og Fraflytning: Baggrundsrapport til SBi 2010 52: Tilflyttere til Yderområder: Forandring, Integration og Strategier; SBI forlag: Hørsholm, Denmark, 2010; Available online: http://www.sbi.dk/boligforhold/boliger/yderomraderne-og-deres-til-og-fraflytning/yderomraderne-og-deres-til-og-fraflytning/ (accessed on 15 March 2022).
- Sørensen, E.S. Human Capital, Migration and Regional Inequality. How the Location of Education Institutions Influences Our Society. Ph.D. Thesis, University of Copenhagen, København, Denmark, 2021. [Google Scholar]
- Hans, S.A. Explanations for Long-Distance Counter-Urban Migration into Fringe Areas in Denmark. Popul. Space Place 2011, 17, 627–641. [Google Scholar]
- Coulter, R.; Scott, J. What Motivates Residential Mobility? Re-examining Self-Reported Reasons for Desiring and Making Residential Moves. Popul. Space Place 2014, 21, 354–371. [Google Scholar] [CrossRef] [Green Version]
- Niedomysl, T.; Hansen, H.K. What matters more for the decision to move: Jobs versus amenities. Environ. Plan. A 2010, 42, 1636–1649. [Google Scholar] [CrossRef]

Publisher’s Note: MDPI stays neutral with regard to jurisdictional claims in published maps and institutional affiliations. |
© 2022 by the authors. Licensee MDPI, Basel, Switzerland. This article is an open access article distributed under the terms and conditions of the Creative Commons Attribution (CC BY) license (https://creativecommons.org/licenses/by/4.0/).