Article

Role of Distribution Centers Disruptions in New Retail Supply Chain: An Analysis Experiment

1
School of Management, Xihua University, Chengdu 610039, China
2
Research Institute of International Economics and Management Science, Xihua University, Chengdu 610039, China
*
Author to whom correspondence should be addressed.
Sustainability 2022, 14(11), 6529; https://doi.org/10.3390/su14116529
Submission received: 24 April 2022 / Revised: 20 May 2022 / Accepted: 21 May 2022 / Published: 26 May 2022

Abstract

:
The convergence of physical stores and e-commerce has led to the emergence of a new retail business mode in the retail industry. In today’s world, new retail supply chains face the potential risks of disruption caused by natural and man-made disasters, and epidemics. In this paper, we simulate a three-stage new retail supply chain consisting of suppliers, manufacturers, and a retailer with online and offline channels in the AnyLogistix simulation and optimization software. We develop a simulation model to analyze the effects of various supply chain node disruptions on new retail supply chain performance and service level with consideration of four scenarios: disruption-free; manufacturer disruption; warehouse center disruption; offline store disruption. The main results show that supply chain node disruptions have negative impacts on the performance and service level. Besides, the warehouse center disruption has the most devastating effect on this new retail supply chain. Overall, this paper provides insights for decision-makers to consider disruption issues when designing resilient new retail supply chains.

1. Introduction

With the development of e-commerce and the popularity of online shopping, physical stores have poured into the online market, consecutively [1,2,3]. For example, many retailers such as HP, Dell, and Nike have set up direct e-commerce channels to sell their products directly to customers [4,5,6,7,8]. However, online retailers have fallen into a dilemma due to the disappearance of demographic dividends and increased traffic costs in recent years. In China, the growth rate of e-commerce dropped from 50% in 2011 to 21.3% in 2017 [9]. In the context of consumption upgrades, both traditional physical and e-commerce retailers are in urgent need of transformation and reformation [10].
The “new retail” business mode proposed by Jack Ma, former chairman of Alibaba Group, which is consistent with the concept of omnichannel retail [9], has been listed as a strategic industry for future development by countries around the world [11]. The new retail/omnichannel retail is a combination of the online channel, offline channel, and efficient logistics, providing customers a seamless shopping experience [12,13,14,15,16]. The new retail is driven by psychological knowledge and advanced technologies such as big data, cloud computing, mobile payment, and artificial intelligence to reshape the business structure and upgrade the retail ecosystem [15,17]. Compared with traditional e-commerce retail or physical retail, the new retail business mode allows customers to experience the products in offline showrooms and order online with shorter waiting times [9]. In this way, customers’ purchasing behaviors drastically changed and companies benefited from this business mode. Thus, new retail enterprises have mushroomed in recent years. Some online retailers have set up their physical stores to supplement online channels for providing offline showrooms, such as Amazon books, Alibaba, BlueNile, and Warby Parker [12,17,18,19,20]. While physical retailers, such as Walmart and Yonghui Supermarket, have opened online channels for providing customers with both online and offline purchasing channels [12,16,21,22].
Over the past few decades, natural disasters, man-made disasters, and epidemics have occurred frequently; supply chain disruption has become a widely concerned problem in supply chain operations [23]. For example, the COVID-19 pandemic, which was first discovered in China and then quickly spread to countries around the world, has caused economic recession globally [24,25], with demand and supply shocks and facility disruptions in the global supply chain [26]. The widespread COVID-19 pandemic has hit the retail sector hard [25,27]. On the one hand, the disruption in the retail supply chain affects the supply of goods, leading to an increase in commodity prices [27,28,29]. On the other hand, the demand for many goods has fallen due to job loss and lockdown measures [25,26]. Consequently, the retail supply chain is facing the challenges of facility disruption and demand shocks. The current published literature focus on the retail consumer behavior changes and the growth of online shopping under the COVID-19 pandemic [25,30,31,32]. However, the impact of disruptions on the operation and performance of the retail supply chain in the COVID-19 pandemic has been neglected. As the new retail market continues to expand across the world [10,16], it is essential to explore the impact of disruption on the new retail supply chain, to provide insights for new retailers to enhance supply chain resilience and mitigate supply chain risks.
This paper simulates a three-stage new retail supply chain consisting of suppliers, manufacturers, and a retailer with online and offline channels by using AnyLogistix simulation and optimization software. Consumers can buy goods through online and offline channels at the same price. We simulate four scenarios: disruption-free; manufacturer disruption; warehouse center disruption; offline store disruption and analyze the operation and performance of the new retail supply chain in the above situations. The purpose of this paper is to investigate the impact of the disruption of different nodes on the performance and service level of the new retail supply chain and find the weakest node in the new retail supply chain. We mainly address the following two questions in this paper:
How do disruptions affect the operation and performance of the new retail supply chain?
(1)
Which node disruption has the greatest impact on the operation and performance of the new retail supply chain?
Our research makes the following major contributions to this paper. First, we articulate the specific features that make node disruption a specific new retail supply chain risk. Second, we demonstrate how simulation-based methodology can be used to examine and predict the impacts of new retail supply chain risk on the supply chain performance using AnyLogistix simulation and optimization software. This analysis can help to identify the successful and wrong elements of risk mitigation/preparedness and recovery policies in case of a new retail supply chain. A set of sensitivity experiments for different new retail supply chains allow to illustrate the model’s behavior, and its value for decision-makers, and to derive several useful insights.
The outline of this paper is organized as follows. Section 2 presents the relevant literature review. The case-study and simulation model are provided in Section 3. The experimental results and analysis are presented in Section 4. In Section 5, we summarize the paper and point out topics for future research.

2. Literature Review

Our work is primarily related to two streams of research. The first examines new retail/omnichannel retail supply chain operations, and the second studies supply chain disruption with simulation.

2.1. New Retail/Omnichannel Retail Supply Chain Operation

New retail/omnichannel retail is the integration of online channels, offline channels, and logistics services. As online and offline channels become more closely linked, the new retail/omnichannel retail supply chain has attracted the attention of scholars in recent years [33,34,35].
Much effort has been made to investigate the omnichannel retail operations of online retailers in offline showrooms and consumer returns. Bell et al., explore the effect of the introduction of showrooms on an online retailer; their results confirm that this omnichannel tactic increases demand overall and in the online channel as well, improves overall operational efficiency, and generates operational spillovers to the other channels [36]. Li proposes that offline showrooms attract more customers to the offline stores but do not always increase the retailer’s profit, only when the offline operating cost is not so large or the return cost is large [34]. Zhang et al., investigate the optimal pricing and inventory decisions of an online retailer when it adopts an omnichannel strategy where consumers can cancel the order before payment and return the product after payment if the product does not meet consumer expectations. Their results also confirm that this omnichannel strategy is not always beneficial to the retailer [20]. Li et al., further investigate how the showroom deployment strategy affects the product prices and information service provision. The results of their research show that high-level showroom feasibility is more likely to increase the profits of retailers who build physical showrooms, and the profitability of different assortment strategies is closely related to consumers’ showrooming behaviors [12].
He et al., develop a newsvendor model to investigate the impacts of store return on the retailer’s pricing and ordering decisions in the context of omnichannel retail, where customers can return unsatisfied products to any store [37]. Wang and Ng build a duopoly model to analyze the price competition between the new retail firm and the traditional online based on behavior-based pricing (BBP) theory [9]. Buy-Online-and-Pick-up-in-Store (BOPS) mode is the most popular in new retail/omnichannel retail and has obtained the most concern from scholars [33,38,39].
Research on the new retail supply chain is in the developing stage and most of the papers focus on the new retail operations. The importance of designing a resilient retail supply chain against the risk of disruption has been highlighted in previously published papers [27,40,41]. However, little effort has been made to investigate the effect of disruptions on the new retail supply chain. In this study, we fill this gap by analyzing the impact of disruptions at different nodes on the new retail supply chain with a simulation method.

2.2. Supply Chain Disruption Research with Simulation

A considerable body of literature has been developed to study supply chain disruption from the impact of the ripple effect on supply chains, and the proactive and reactive strategies to mitigate its effects and recover from serious disruptions [42]. In comparison with analytical closed-form analysis, simulation has the advantage that it can deal with complex problem settings where situational behavior changes in the system over time [43]. Various real-life examples of the supply chain have been simulated to investigate the ripple effect in the supply chain and the effect of recovery policies in previous work [44,45,46,47,48].
The ripple effect follows disruptions, and it affects the propagation process of the disruption and the performance of the supply chain, affecting supply chain structural design and planning parameters [43,49,50]. Ivanov et al., build a simulation model in AnyLogistix for a real dairy supply chain to explore the impact of the recovery policies on supply chain performance with consideration of the ripple effect. After comparing the performance of the supply chain under four scenarios, they figure out the performance impact of using a back-up distribution center and alternative transportation means [47]. Ivanov develops a discrete-event simulation model to investigate disruption propagation in the supply chain and recommends the supply chain structural design with consideration of sustainability and ripple effect mitigation. This study provides three interesting results. First, sustainable single-sourcing enhances the ripple effect. Second, reinforcement of facilities in regions can reduce the ripple effect and enhance sustainability. Third, the reduction in storage facilities in the downstream supply chain of disrupted risk facilities increases sustainability but leads to the ripple effect [51].
Recovery strategies to mitigate the risk of supply chain disruption and improve the resilience of the supply chain include proactive and reactive strategies. Ivanov studies a real-life case-study of disruption to analyze supply chain design and production-ordering systems in the recovery and post-disruption periods by building a simulation model. They also propose that the recovery policy should consider the post-disruption period and be included in supply chain design decisions [45]. Ivanov and Rozhkov compare supply chain performance impacts concerning coordinated and non-coordinated ordering and production control policies with the help of a simulation model. They confirm that a coordinated production-ordering contingency policy is conducive to inventory dynamics stabilization, improvement in time delivery, and variation reduction in customer service level [46]. Ivanov develops a discrete-event simulation model to investigate recovery strategies for a supply chain in the context of the COVID-19 pandemic. They find increasing capacity gradually before delaying the expected peak of demand is an effective strategy for disruption tail control [52]. Schmitt and Singh simulate a multi-echelon supply chain for a real case of a consumer product packaging company to analyze the effect of inventory placement and back-up strategy on reducing supply chain risk [48].
Simulation models have been extensively used in the area of analyzing various disruptions and corresponding recovery strategies. Wilson compares the performance changes of a traditional supply chain system and vendor-managed inventory system with simulation when transportation disruption occurs. The results show that when the transportation disruption occurs between the tier 1 supplier and the warehouse or distributor, the supply chain suffers the most damage, especially the traditional supply chain. The author also proposes the corresponding recovery policy [53]. Xu et al., build an agent-based simulation model to investigate the impact of recovery policies on supply chain service levels when a certain supplier is disrupted. After comparing the performance impact of the adoption and absence of recovery measures in four situations, the authors conclude that the impact of ripple effects on customer satisfaction depends on proactive resilience planning and recovery measures [50]. Thomas and Mahanty find that transparency of information regarding vulnerabilities among supply chain members improves performance in the event of disruption from upstream suppliers with the help of a simulation tool [54]. Thomas and Mahanty propose a dynamic simulation model to analyze the emergency sourcing mitigation strategy of the supply chain in the case of supply disruption [55]. Ivanov supposes that single-sourcing, capacity flexibility, and dual sourcing can be recommended for different combinations of demand and inventory patterns with consideration of capacity disruptions [49].
The literature mentioned above has proven that simulation software is an effective tool for studying supply chain disruption. To the best of our knowledge, the research on analyzing the impact of different node disruptions on the new retail/omnichannel retail supply chain based on simulation is scarce. In this paper, we investigate the impact of various disruptions in the new retail supply chain on its performance and service level with simulation.

3. Case-Study and Simulation Mode
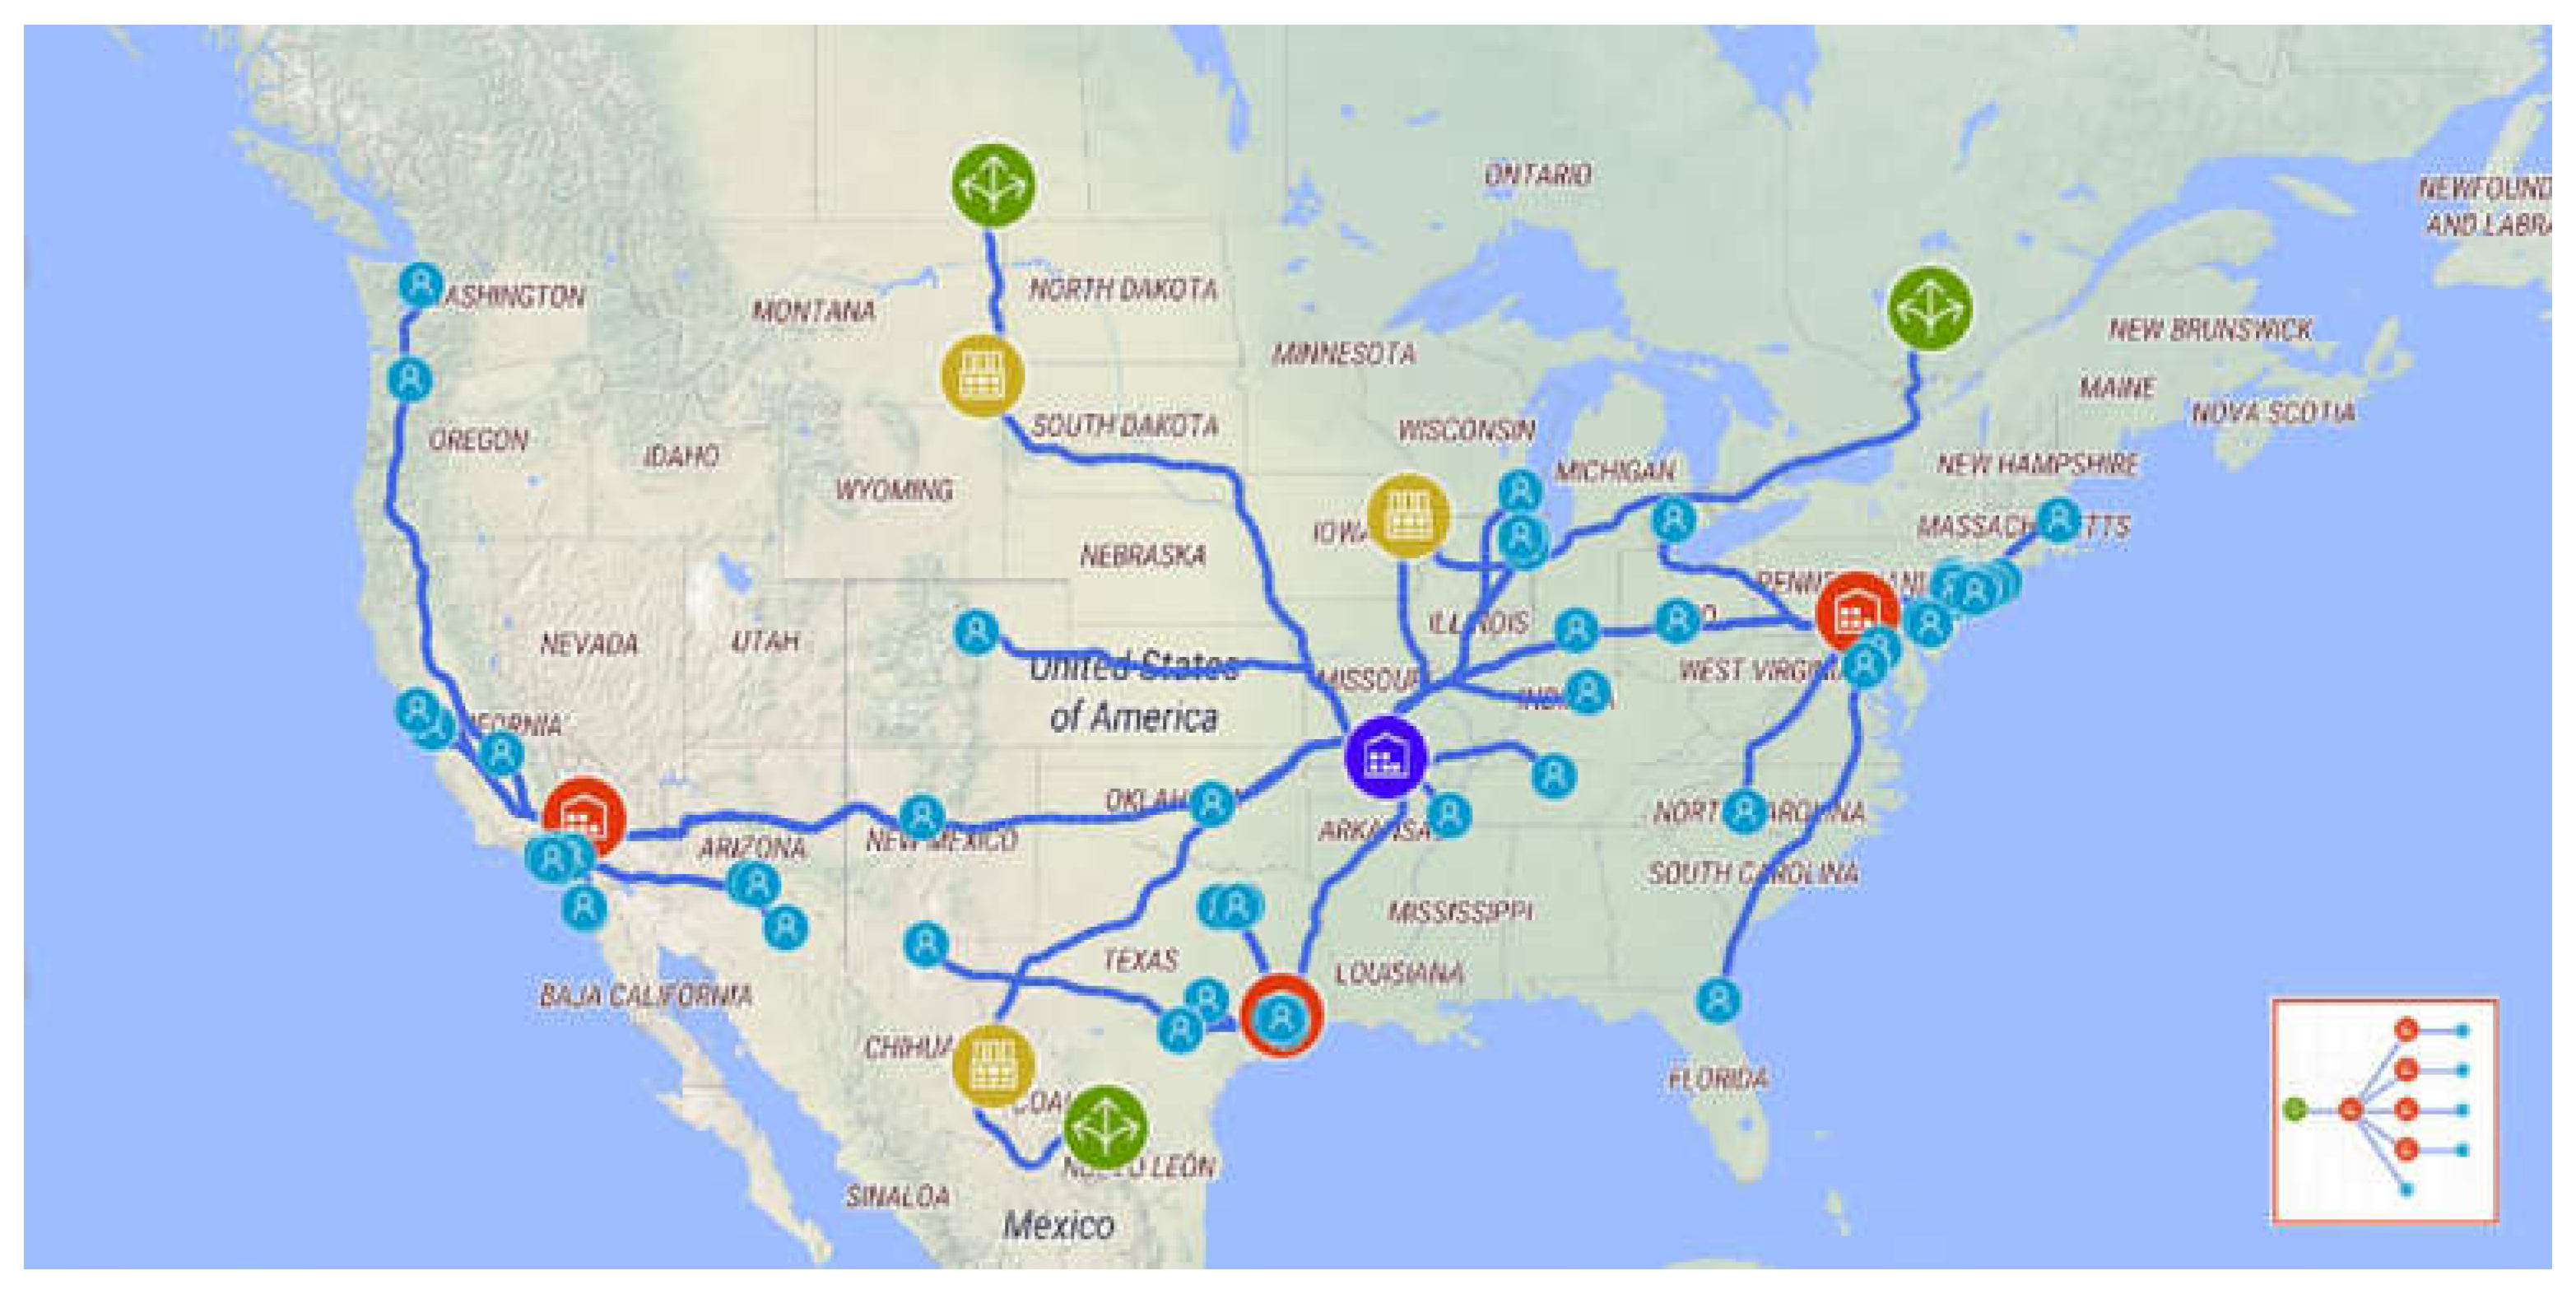
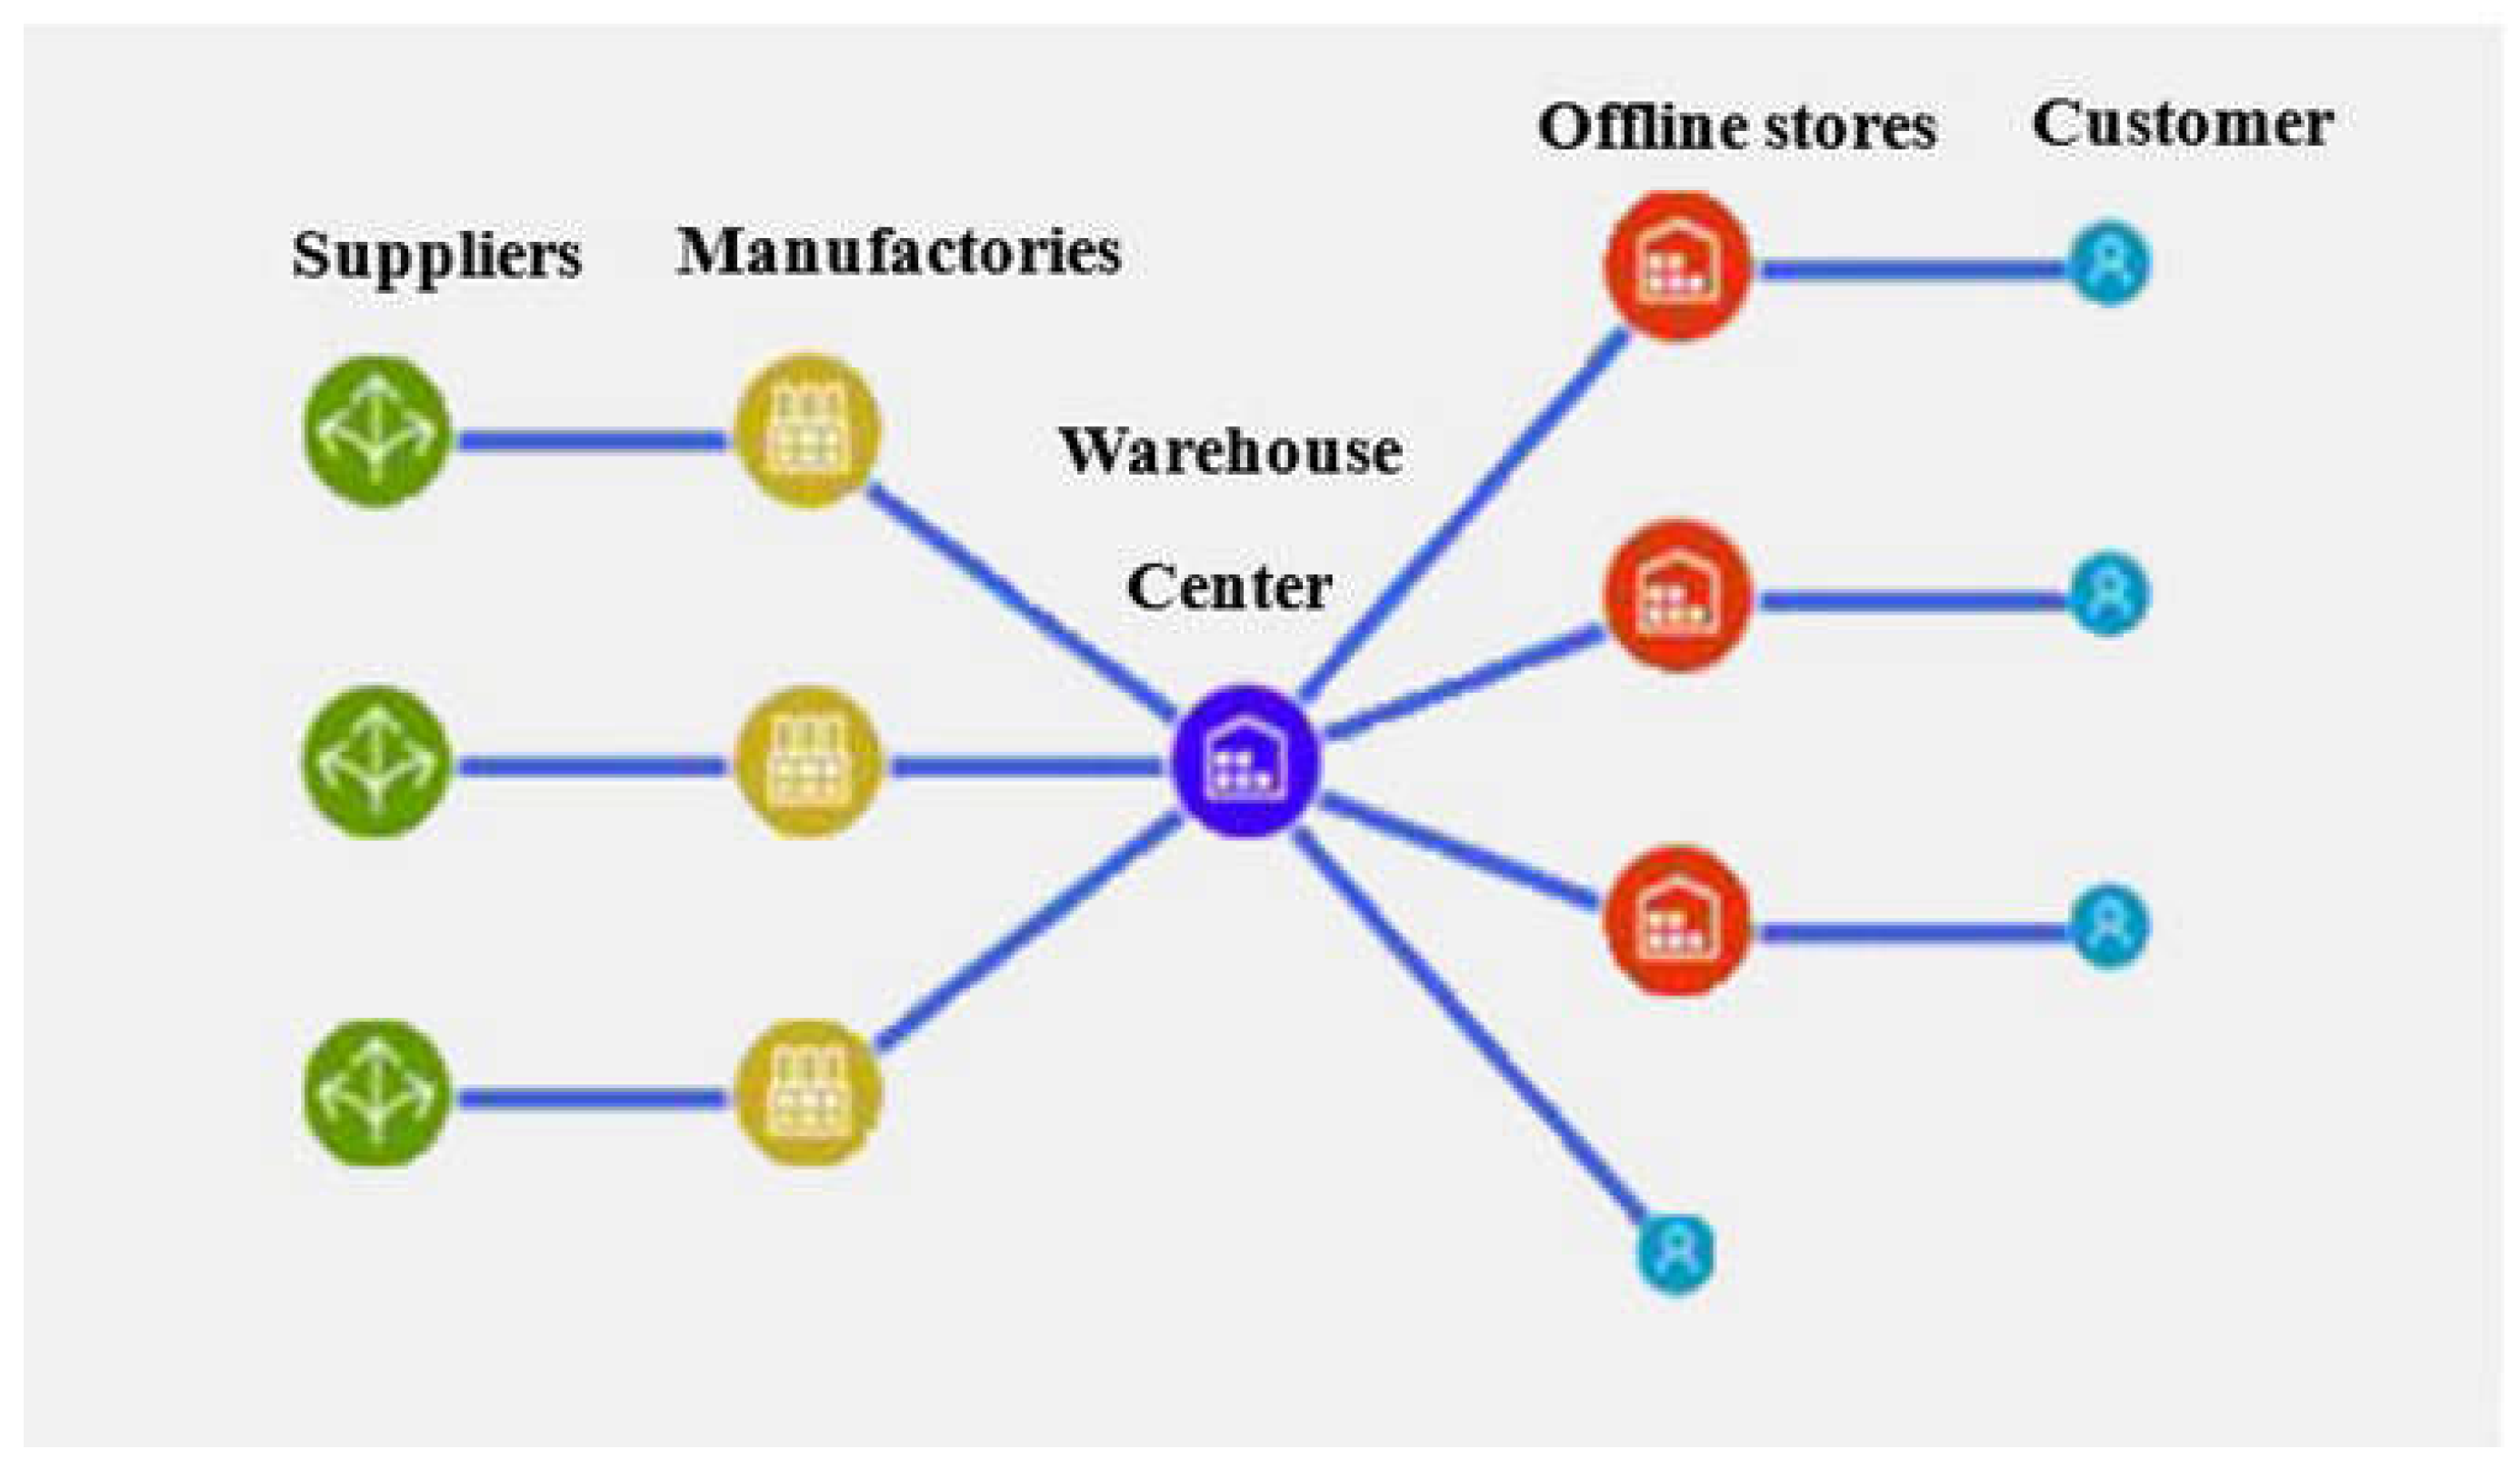
3.1. Case-Study

This paper simulates a multi-stage supply chain consisting of raw material suppliers, manufacturers, and a retailer with online and offline channels. The supply chain members cooperate to produce and sell the home and garden categories and are distributed in different geographical locations. The distribution network is shown in Figure 1.
The retailer who plays a dominant role in the supply chain sells household items and garden products (Furniture, Lighting, Small appliances, Large home appliances, and Gardening equipment) to customers with its brand through its online platform and three offline stores. The retailer adopts (s, S) inventory policy to determine the quantity of each order and ship goods to its warehouse. Besides, it adopts a new retail business mode by providing customers with online and offline channels, which are set at the same price, to enrich customer purchase experience and improve service level. Three manufacturers buy raw materials from three local suppliers to minimize transportation and time costs. There are 66 loyal customers across the country by analyzing the historical sales data. These customers can order products on the online platform, then orders will be delivered from the warehouse to the customer in a short time. They also can purchase goods in the physical stores after experiencing them. A good service level means that the retailer delivers products to customers through online or offline channels within the expected delivery time, otherwise it could be regarded as delayed delivery. Figure 2 depicts the flow of goods and information in the supply chain.

3.2. Simulation Methods and Models

AnyLogistix is a simulation software with supply chain design, analysis, and optimization functions; it combines traditional analytical optimization methods with innovative simulation techniques to provide an effective way of describing the supply chain in detail [45,47,56,57,58]. In this paper, a digital supply chain is created to observe the details of the dynamic changes in the supply chain and investigate how disruptions affect the new retail supply chain. The simulation model is set to run for one year and the simulation model structure is shown in Figure 3.
A standard AnyLogistix model, “SIM Distribution Network Analysis”, which has been validated by the software developer for large-scale discrete events is selected in this paper. We modify the parameters inconsistent with the case-study in the simulation model and repeat the experiment 500 times to ensure the rationality and accuracy of the modified data. These modified input parameters are shown in Table 1 and Table 2. In addition, we select some key performance indicators (KPI) including economic indicators, service level, lead time, available inventory, and demand as the main criteria for assessing new retail supply chain operation and performance; the specific interpretation of those KPI is shown in Table 3.

4. Experimental Results and Analysis

Academics have considered supply disruption [50,59,60,61], transportation disruption [53,62], and demand disruption [63,64,65] in their research. Different from the risk of operation, the disruption of the supply chain which is characterized by low frequency and high influence is more destructive to the entire supply chain [56,66]. In this section, we mainly explore the performance and service level of the new retail supply chain when the disruption occurs at the manufacturer, warehouse center, and offline store.

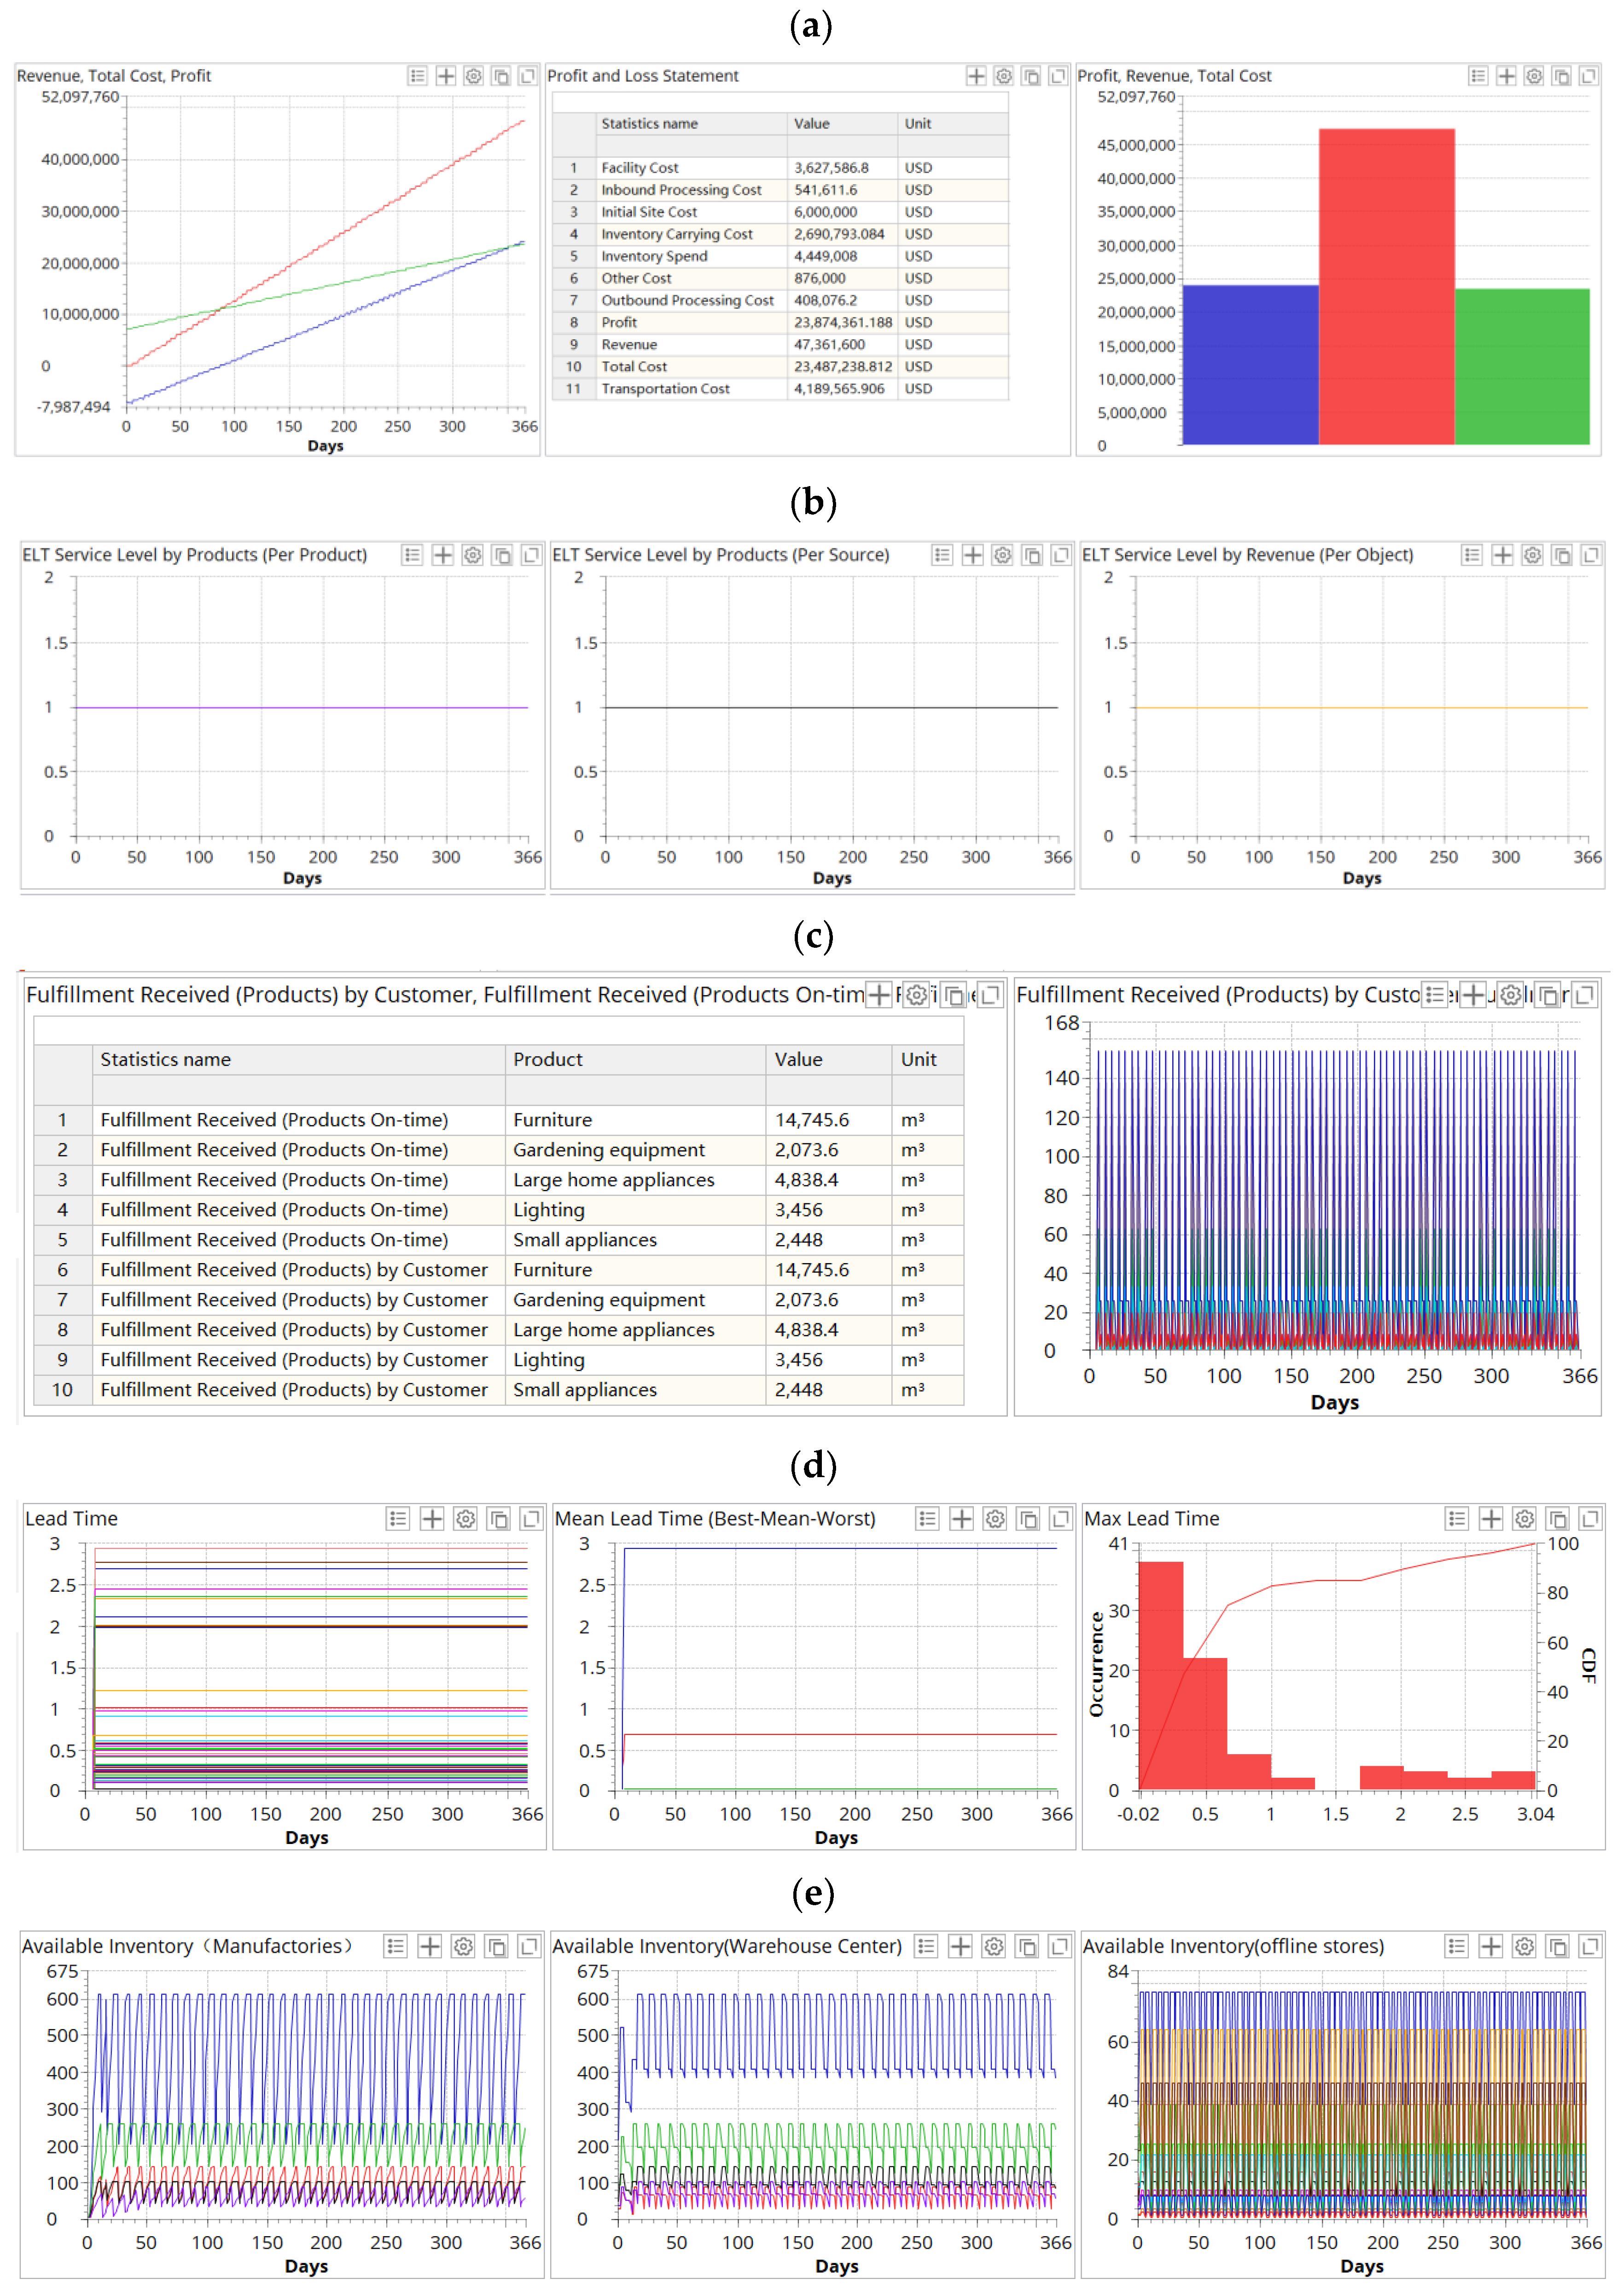
4.1. The Supply Chain Performance and Analysis without Disruption

We first analyze the new retail supply chain operational performance without disruption, and the simulation results are presented in Figure 4.
It can be observed from part a) that the total revenue of the new retail supply chain is USD 47,361,600, the total cost is USD 23,487,238.812, and the total profit is USD 23,874,361.188. Moreover, parts b) and c) show that orders of the online channel and offline channel can be delivered to customers on time, that is, there is no delayed delivery so the service level of the new retail supply chain is 1. Part d) shows that the lead time is fairly stable throughout the operation period, and the total lead time of products to all customers is about 54 days. Finally, it can be seen from part e) that the inventory at each level of the supply chain keeps a dynamic balance, which means that there is no shortage or excess inventory. In conclusion, when no disruption occurs, the new retail supply chain operates well.

4.2. The Supply Chain Performance and Analysis with Disruption

We build a simulation model to explore each level of disruption in new retail supply chain operation and performance. Three scenarios are given: disruption occurs at the manufacturer, disruption occurs at the warehouse center, and disruption occurs at the physical store. The disruption period is set to 60 days.

4.2.1. Disruption Occurs at the Manufacturer

When a facility disruption occurs at the manufacturer, goods cannot be produced as scheduled, which may result in a shortage of supply on the market. We simulate muanufacter1 (M1) disruption with AnyLogistix software and the simulation results are shown in Figure 5.
Figure 5 confirms the intuitive perception that the operation and performance of the entire supply chain will be affected if a production disruption occurs. By comparing with Figure 4, we find that the revenue of the supply chain remains unchanged when M1 is disrupted because the remaining inventory in the warehouse center can fully meet the demand of customers within a certain disruption period. However, the supply chain profit falls 21% due to some potential cost increases. From parts (b–d), we find that since furniture and lighting are only produced by M1, the production of these two products ceases when the M1 is disrupted. As a result, orders cannot be delivered to customers on time and the service level drops significantly. It can be observed from part (e) that the retailer will face the risk of suspension of operation due to ripple effects in the new retail supply chain.
Insight 1: For the retailer, on the one hand, a single-source procurement strategy is conducive to establishing in-depth partnerships with suppliers and reducing procurement costs. On the other hand, it aggravates the ripple effect and increases supply chain disruption risks. Therefore, a multi-source procurement strategy, which can share supply chain risks and may bring certain price concessions due to competition among multiple suppliers, may be considered.

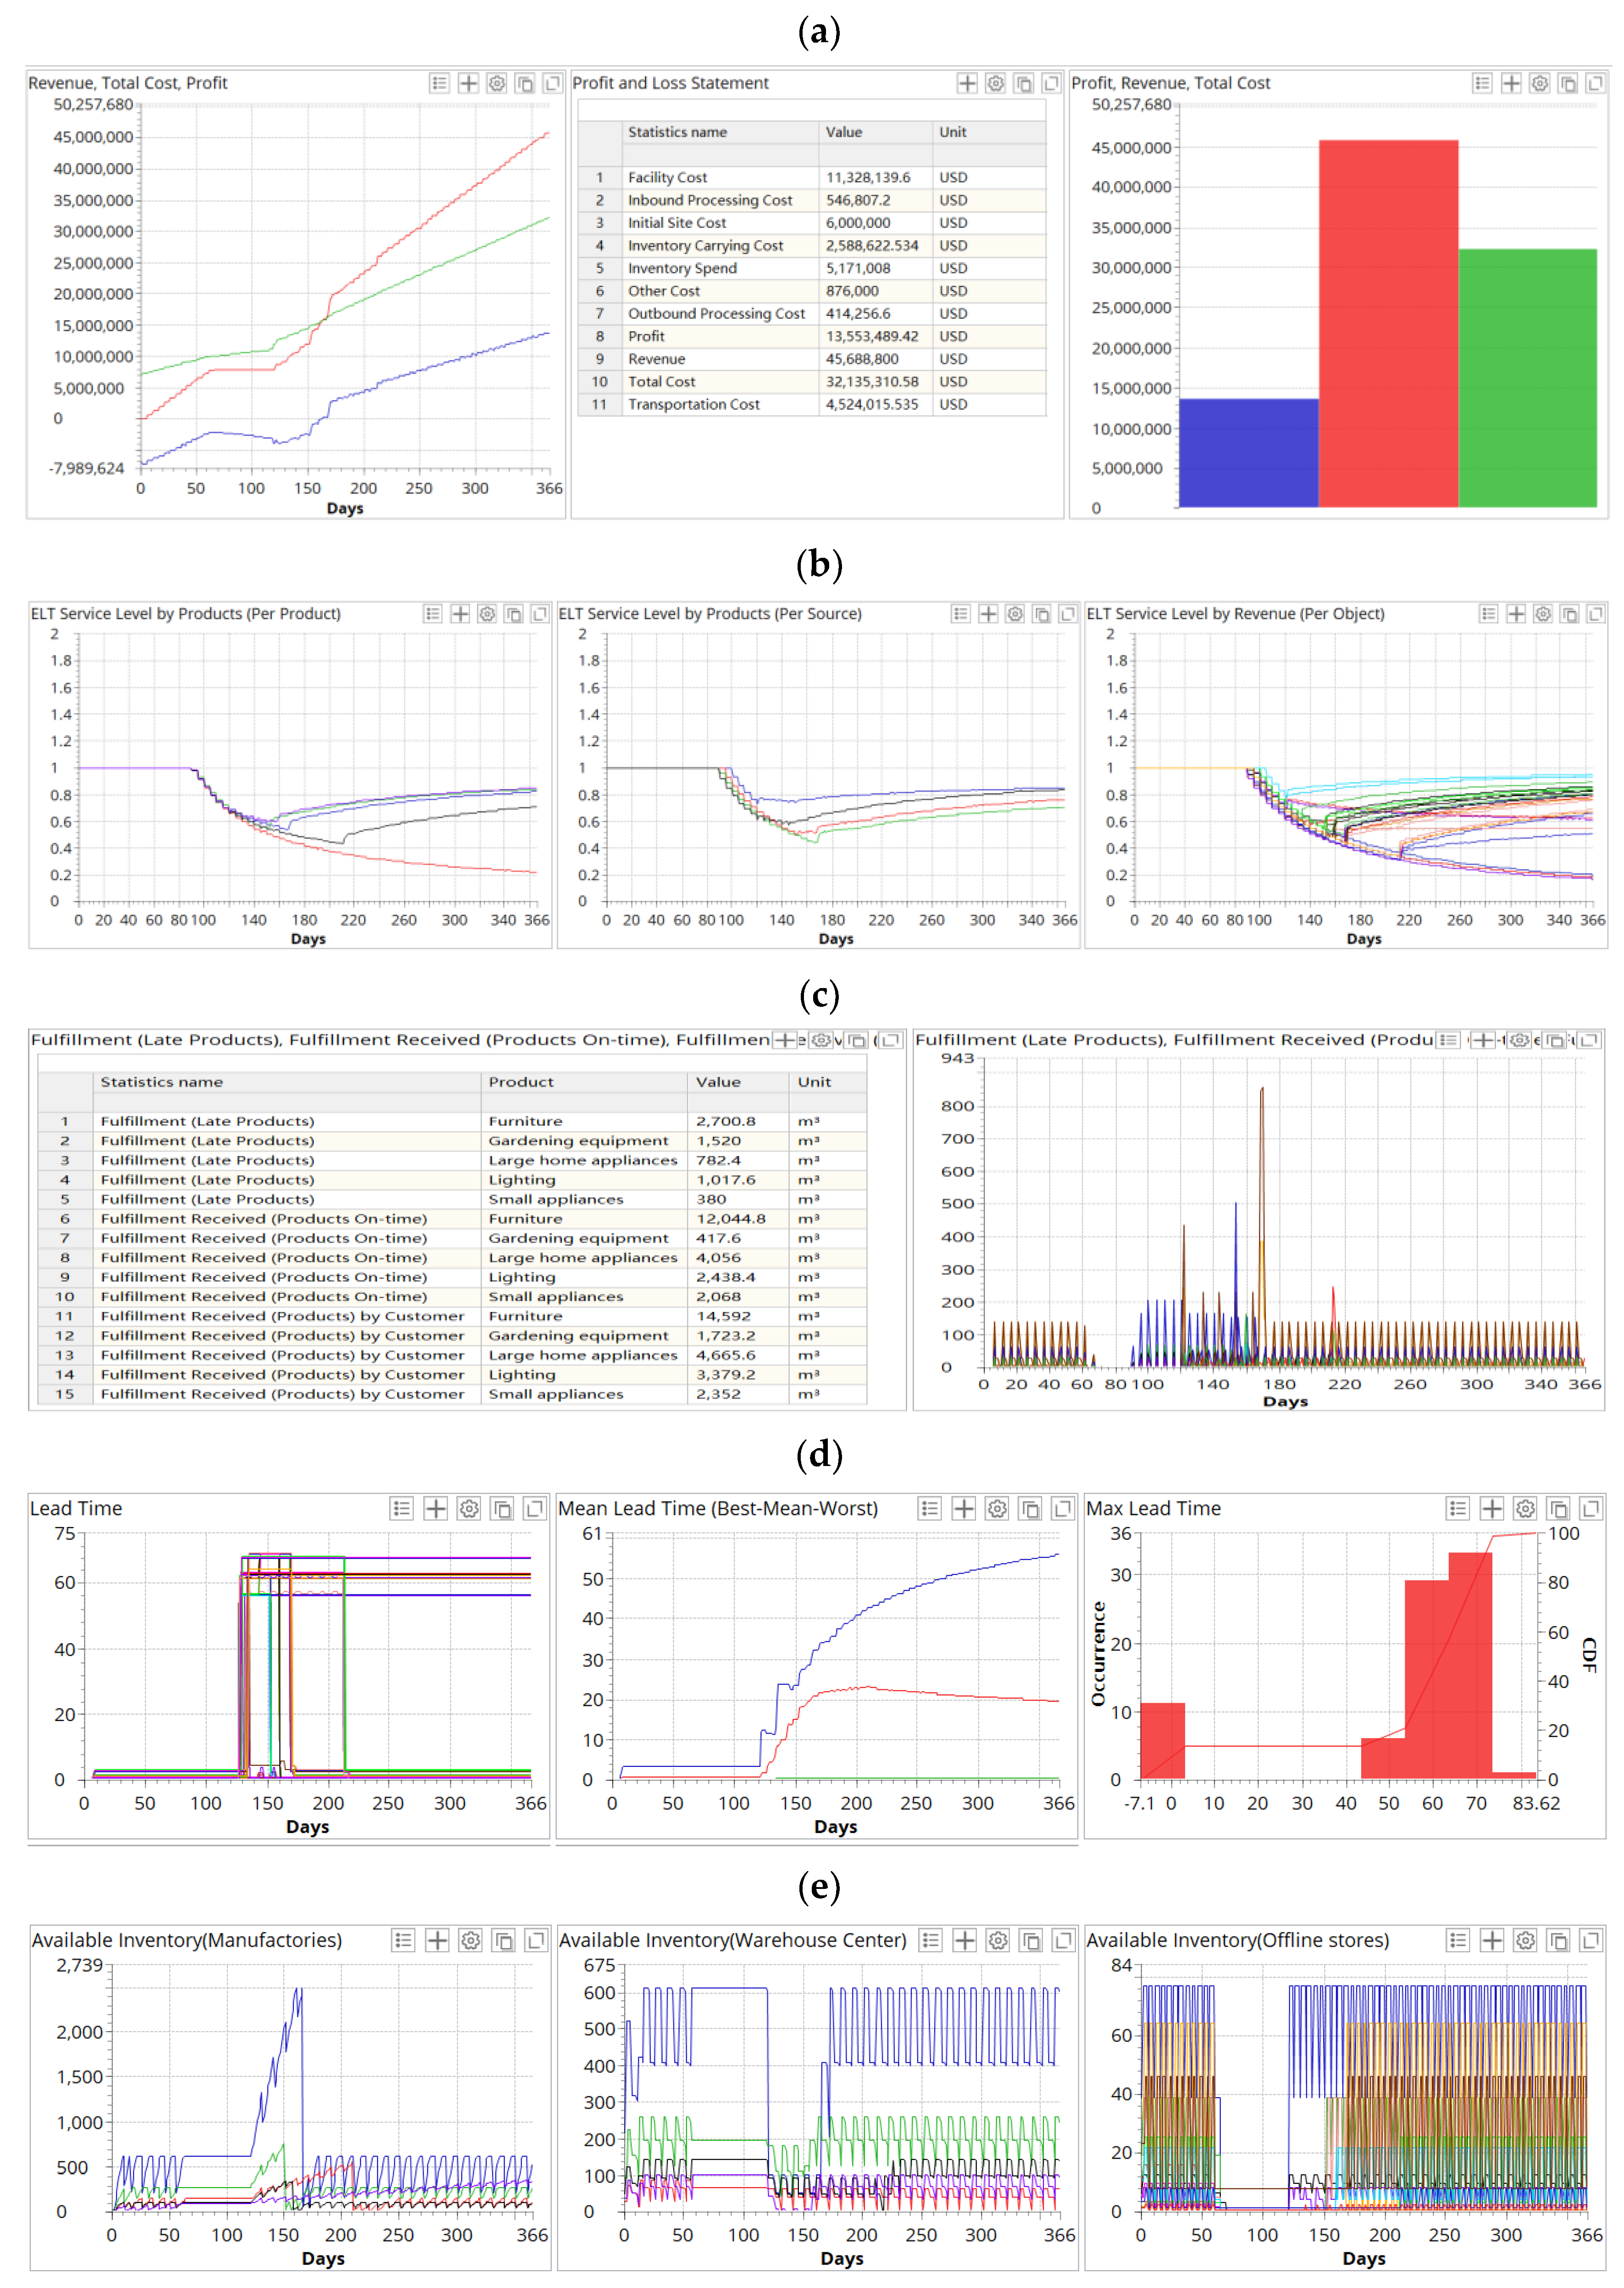
4.2.2. Disruption Occurs at the Warehouse Center

When the disruption occurs at the retailer’s warehouse center, both online and offline channel operations will be negatively affected. We simulate the disruption of the warehouse center, and the simulation results are shown in Figure 6.
Figure 6 indicates that disruptions occurring at the warehouse centers harm the new retail supply chain operations and performance. These manufacturers and the warehouse center are overstocked, and the profit of the new retail supply chain declines. The warehouse center is the distribution source of online and offline channels. Once disrupted, the online channel can only accept orders but cannot deliver. Besides, the remaining inventory of offline stores will be quickly consumed, leading to a supply shortage. We also find when the warehouse center recovers from the disruption for a period of time, even if the manufacturers accelerate the production speed, the available inventory at all levels still shows a cliff-like decline. For products in high demand, physical stores cannot restore stable supply during the one-year observation period.
Insight 2: In the new retail supply chain, the warehouse center of the retailer plays a very important role as a key node connecting the upstream and downstream. Once the warehouse center is disrupted, the supply chain will suffer serious losses.

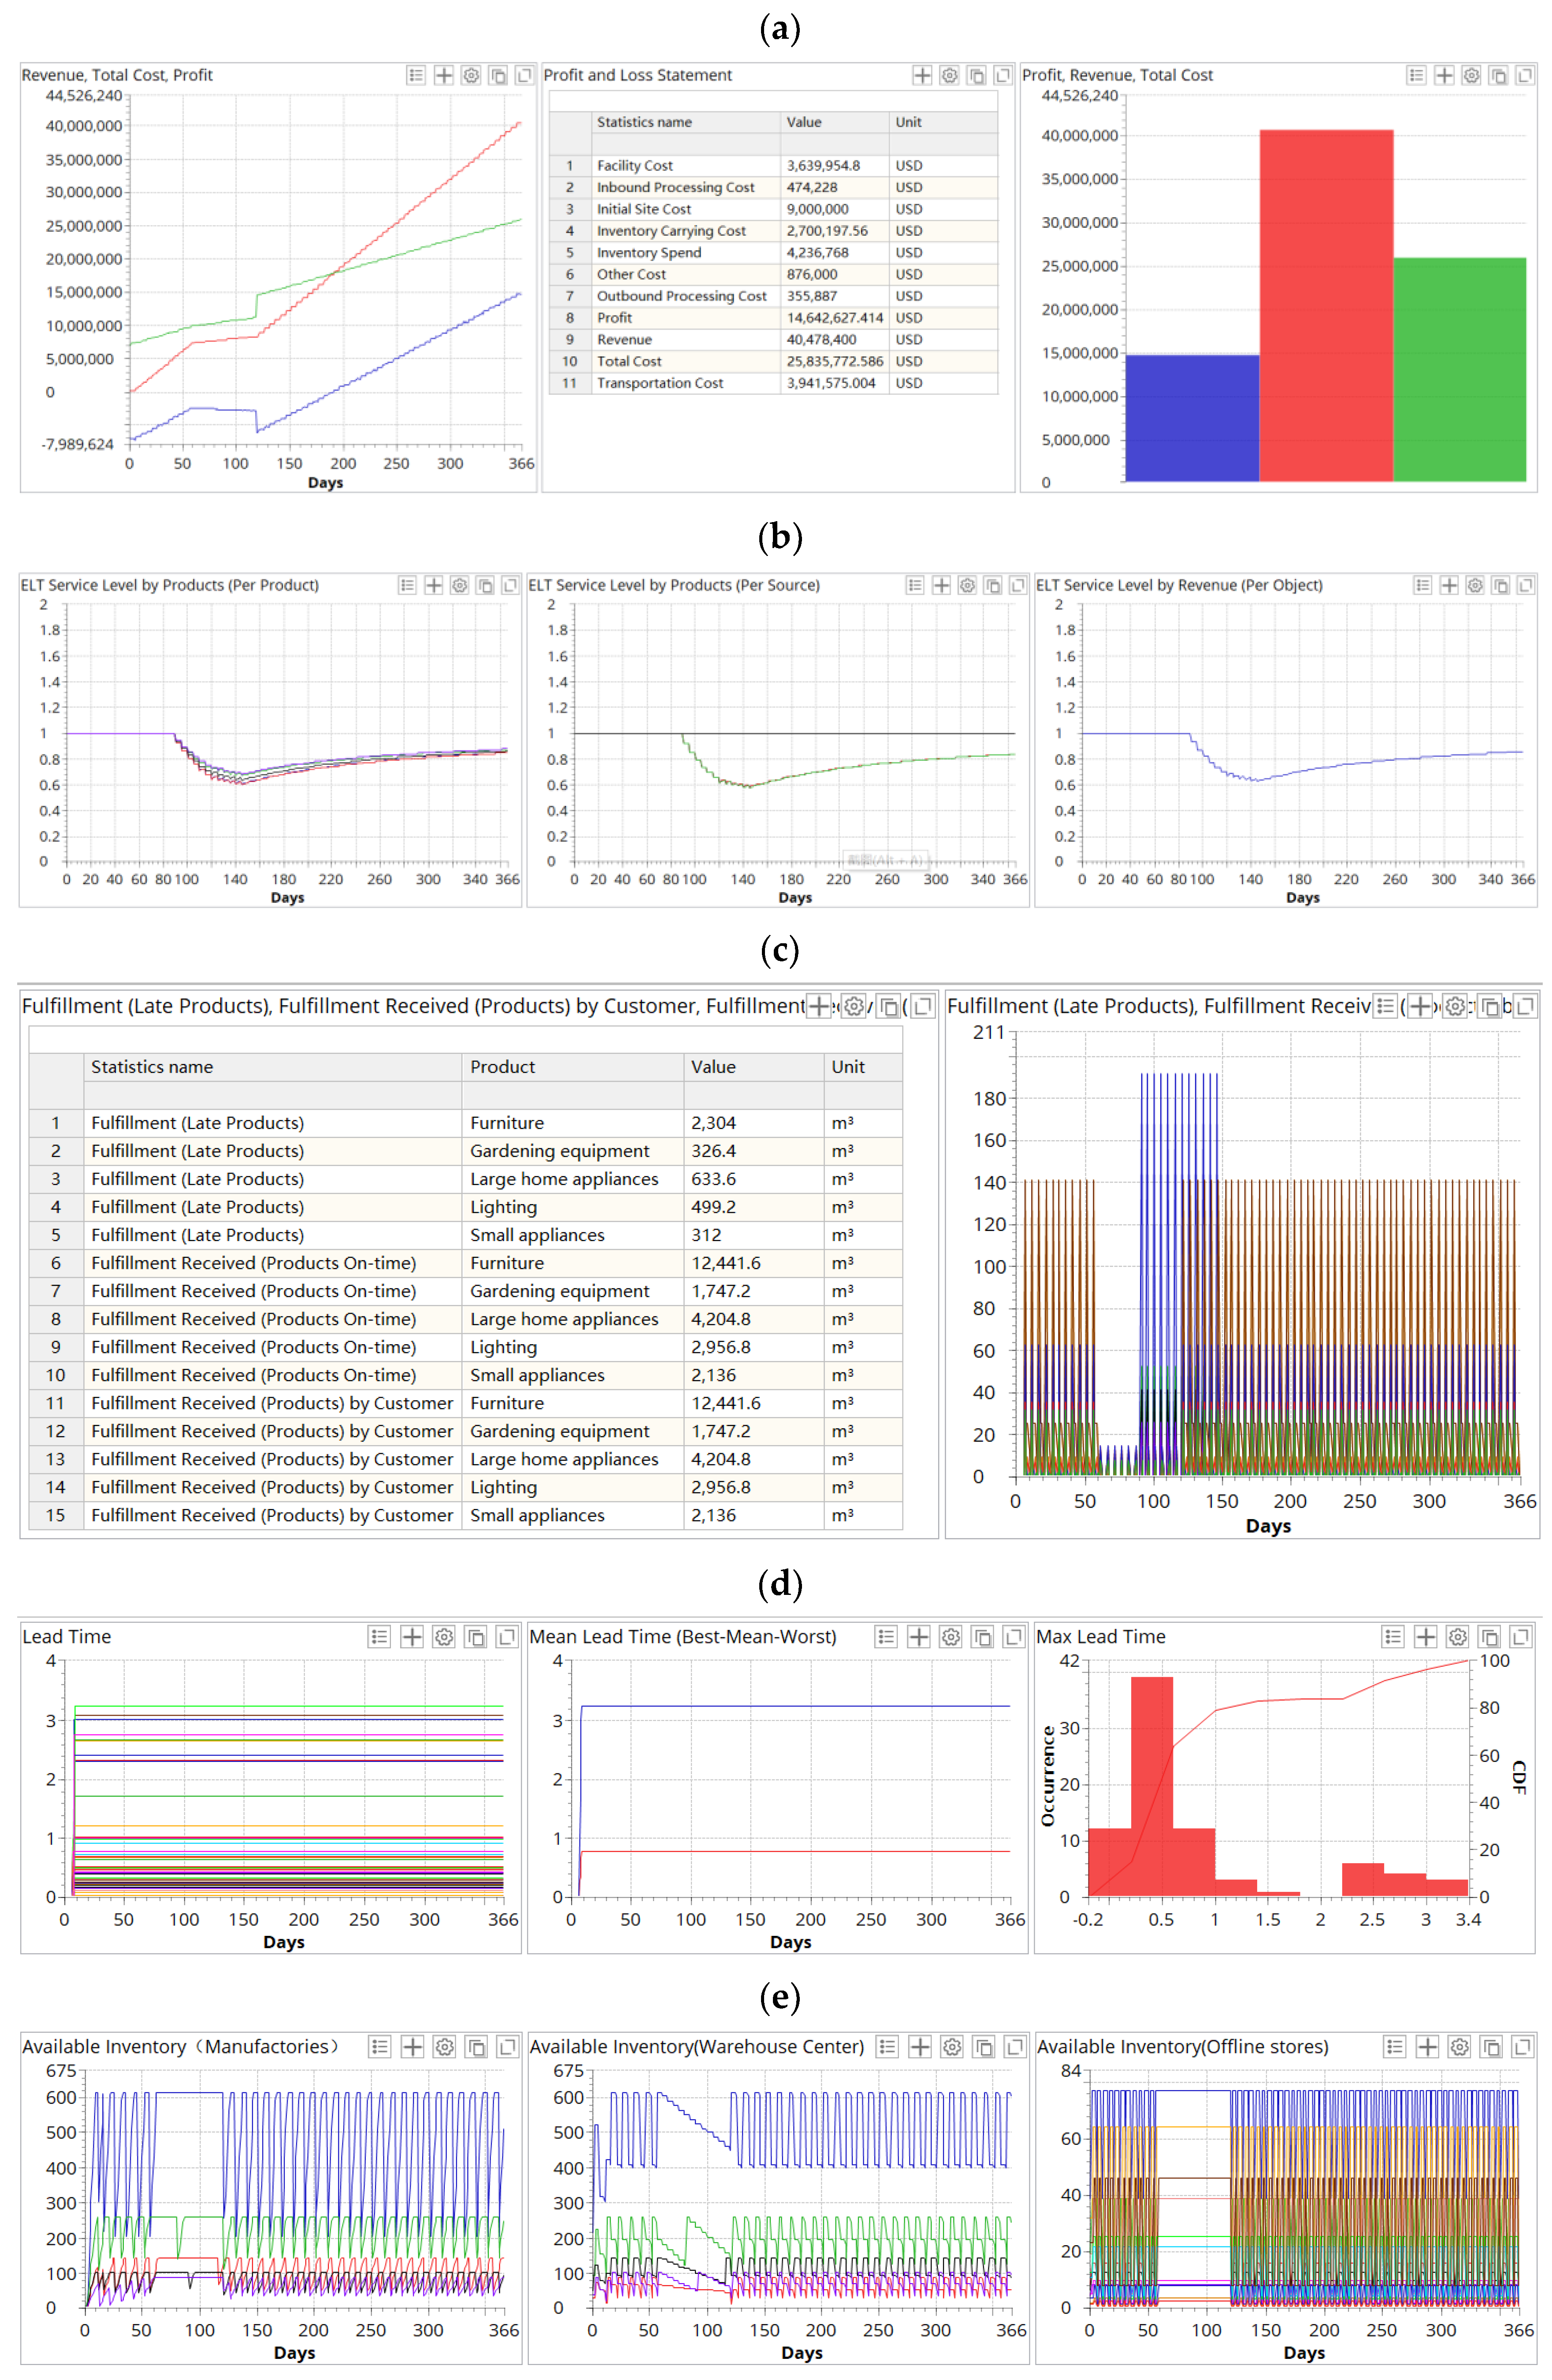
4.2.3. Disruption Occurs at the Offline Store

We simulate the scenario where the disruption occurs at the offline store and the simulation results are presented in Figure 7.
As shown in Figure 7, the physical store disruption has a relatively small impact on the new retail supply chain operation and performance. In this case, only the offline channel is disrupted, and customers can still purchase goods through the online channel. Therefore, the delivery time of the product is stable, the fluctuation of the service level is relatively small, and the recovery time is short.
To directly observe the impact of the above three disruption scenarios on the supply chain operation and performance, we output the specific values of key performance indicators as shown in Table 4.
Insight 3: By comparing the above disruption scenarios, we find that disruptions occurring at different levels of the supply chain have different effects. The warehouse center disruption has the greatest impact on the new retail supply chain, which leads to the lowest supply chain profit and service level. However, the physical store disruption has the least impact on the new retail supply chain operation and performance because the online channel still operates well in this case.

5. Conclusions and Future Research

In this paper, we focus on the impact of the disruption of different levels on the operation and performance of the new retail supply chain by simulating a multi-level supply chain that comprises suppliers, manufacturers, and a retailer. Two major observations are as follows:
Firstly, although the single-source procurement strategy has the advantage of reducing the purchase cost and establishing a deep cooperation relationship with suppliers, once the supplier is disrupted, the new retail supply chain will be put at high risk. Therefore, decision-makers should pay attention to the issue of risk transfer when adopting a single-source procurement strategy. Maybe a multi-source procurement strategy should be considered in the new supply chain resilience design.
Secondly, the physical store disruption has the least impact on the performance of the new retail supply chain, followed by the manufacturer disruption, and the warehouse center disruption has the greatest impact on the new retail supply chain performance. It can be explained that the warehouse center not only has the function of connecting the upstream and downstream enterprises, but also serves as the supply source of both online and offline channels; once disrupted, the impact will be the widest, the deepest, and the recovery time will be longest.
Thirdly, in generalized terms, this paper addresses disruption as a specific type of supply chain risk and provides an approach to support decision-makers when applicable to “new retail” supply chains. The conclusions of the study contribute to the existing literature on supply chain risk management and resilience within the “new retail” business models. Our approach allows for the simulating of the supply chains with disruption in “new retail” and answers such questions as:
  • How do disruptions affect the operation and performance of the new retail supply chain?
  • Which node disruption has the greatest impact on the operation and performance of the new retail supply chain?
As for the limitations of this paper, it is mainly reflected in two aspects. One is that the simulation model is simplified considering the convenience of analysis and the pertinence of conclusions. The other is that we only discuss the impact of the disruption of different nodes on the new retail supply chain operation and performance. For future research, dynamic and random factors should be considered in simulation systems to explore the effect of the disruption on the new retail supply chain operation and performance. In addition, corresponding recovery measures for the disruption of different nodes in the new retail supply chain should be investigated.

Author Contributions

Conceptualization, C.D. and L.L.; methodology, Y.Z.; software, J.L.; validation, C.D., L.L. and J.L.; formal analysis, W.H.; investigation, W.H.; resources, J.L.; data curation, L.L.; writing—original draft preparation, W.H.; writing—review and editing, L.L.; visualization, Y.Z.; supervision, C.D.; project administration, Y.Z.; funding acquisition, C.D. All authors have read and agreed to the published version of the manuscript.

Funding

The work was supported by the “Young Scholars” program of Xihua University, the program of Research Institute of International Economics and Management Science of Xihua University (20210015), the “Chunhui” Plan of Ministry of Education in China (No. S2011012 and No. Z2012017), the Key scientific research found of Xihua University (Grant No. Z1614417)), the Natural Science Foundation of education department of Sichuan (No. 17ZB0414). The Plan of Sichuan Provincial Bureau of statistic (No. 2022XL07).

Institutional Review Board Statement

Not applicable.

Informed Consent Statement

Not applicable.

Data Availability Statement

The data used to support the findings of this study are available from the corresponding author upon request.

Acknowledgments

The authors would like to thank the editors and the anonymous reviewers for their insightful and constructive comments and suggestions that have led to this improved version of the paper.

Conflicts of Interest

The authors declare no conflict of interest.

References

  1. Gao, F.; Su, X. Omnichannel Retail Operations with Buy-Online-and-Pick-up-in-Store. Manag. Sci. 2017, 63, 2478–2492. [Google Scholar] [CrossRef] [Green Version]
  2. Jerath, K.; Netessine, S.; Veeraraghavan, S.K. Revenue Management with Strategic Customers: Last-Minute Selling and Opaque Selling. Manag. Sci. 2010, 56, 430–448. [Google Scholar] [CrossRef] [Green Version]
  3. Ofek, E.; Katona, Z.; Sarvary, M. “Bricks and Clicks”: The Impact of Product Returns on the Strategies of Multichannel Retailers. Mark. Sci. 2011, 30, 42–60. [Google Scholar] [CrossRef] [Green Version]
  4. Cao, E. Coordination of Dual-Channel Supply Chains Under Demand Disruptions Management Decisions. Int. J. Prod. Res. 2014, 52, 7114–7131. [Google Scholar] [CrossRef]
  5. Heydari, J.; Aslani, A.; Sabbaghnia, A. A Collaborative Scenario-Based Decision Model for A Disrupted Dual-Channel Supply Chain Benchmarking Against the Centralized Structure. Benchmarking Int. J. 2019, 27, 933–957. [Google Scholar] [CrossRef]
  6. Huang, G.; Ding, Q.; Dong, C.; Pan, Z. Joint Optimization of Pricing and Inventory Control for Dual-Channel Problem under Stochastic Demand. Ann. Oper. Res. 2021, 298, 307–337. [Google Scholar] [CrossRef]
  7. Soleimani, F.; Khamseh, A.A.; Naderi, B. Optimal Decisions in A Dual-Channel Supply Chain Under Simultaneous Demand and Production Cost Disruptions. Ann. Oper. Res. 2016, 243, 301–321. [Google Scholar] [CrossRef]
  8. Song, H.; Chao, Y.; Xi, Z. Pricing and Production Decisions in Dual-Channel Supply Chains with Demand Disruptions. Comput. Ind. Eng. 2012, 62, 70–83. [Google Scholar] [CrossRef]
  9. Wang, X.; Chi, T.N. New Retail Versus Traditional Retail in E-Commerce: Channel Establishment, Price Competition, and Consumer Recognition. Ann. Oper. Res. 2020, 291, 921–937. [Google Scholar] [CrossRef]
  10. Li, S. Research on the Integrated Development Model of e-Commerce Channel and Physical Retail Channel. In Proceedings of the 9th International Symposium, ISICA 2017, Guangzhou, China, 18–19 November 2017; Revised Selected Papers, Part II. pp. 273–279. [Google Scholar]
  11. Wang, Y.; Chang, J. Future Development Trend of “New Retail” and E-Commerce Based on Big Data. J. Phys. Conf. Ser. 2021, 1852, 032029. [Google Scholar] [CrossRef]
  12. Li, G.; Zhang, T.; Tayi, G.K. Inroad into Omni-Channel Retailing: Physical Showroom Deployment of An Online Retailer. Eur. J. Oper. Res. 2020, 283, 676–691. [Google Scholar] [CrossRef]
  13. Rigby, D. The Future of Shopping. Harv. Bus. Rev. 2011, 89, 65–76. [Google Scholar]
  14. von Briel, F. The Future of Omnichannel Retail: A Four-Stage Delphi Study. Technol. Forecast. Soc. Chang. 2018, 132, 217–229. [Google Scholar] [CrossRef]
  15. Wei, S. Analysis of Marketing Innovation Under the New Retail Mode-Taking “Luckin coffee” as an Example. In Proceedings of the E3S Web of Conferences, Dali, China, 18–20 December 2020; Volume 235, p. 01074. [Google Scholar] [CrossRef]
  16. Zhang, S.; Zhong, F.; Zhang, J.; Du, D.; Yuan, M. Research on Online Shopping Return Mode in “New Retail” Era. In Proceedings of the IOP Conference Series Earth and Environmental Science, Changchun, China, 21–23 August 2020; Volume 526, p. 012199. [Google Scholar] [CrossRef]
  17. Wang, O.; Somogyi, S.; Charlebois, S. Food Choice in the E-Commerce Era: A Comparison between Business-To-Consumer (B2C), Online-To-Offline (O2O) and New Retail. Br. Food J. 2020, 122, 1215–1237. [Google Scholar] [CrossRef]
  18. Ding, D.; Lannes, B.; Zhu, L.; Gao, H.; Peng, L.; Song, F.; Jiang, Z. Embracing China’s New Retail. Available online: http://www.bain.com/publications/articles/embracing-chinas-new-retail.aspx (accessed on 13 March 2018).
  19. Zhang, A.; Liang, C.; Yin, J. How Can Dmall Do Better? Discussion on New Retail Marketing Mode Based on 4Cs Theory. In Proceedings of the 2018 International Conference on E-Business and Applications, Da Nang, Viet Nam, 23–25 February 2018; pp. 46–50. [Google Scholar] [CrossRef]
  20. Zhang, J.; Xu, Q.; He, Y. Omnichannel Retail Operations with Consumer Returns and Order Cancellation. Transp. Res. Part E Logist. Transp. Rev. 2018, 118, 308–324. [Google Scholar] [CrossRef]
  21. Avery, J.; Steenburgh, T.J.; Deighton, J.; Caravella, M. Adding Bricks to Clicks: Predicting the Patterns of Cross-Channel Elasticities Over Time. J. Mark. 2012, 76, 96–111. [Google Scholar] [CrossRef]
  22. Shao, X. Omnichannel Retail Move in A Dual-Channel Supply Chain. Eur. J. Oper. Res. 2021, 294, 936–950. [Google Scholar] [CrossRef]
  23. Xie, D.; Chen, H. Coordinating Dual-Channel Supply Chain Under Price Mechanism with Production Cost Disruption. Manag. Sci. Eng. 2015, 9, 1–7. [Google Scholar] [CrossRef]
  24. World Bank. The Global Economic Outlook during the COVID-19 Pandemic: A Changed World. Available online: https://www.worldbank.org/en/news/feature/2020/06/08/the-global-economic-outlook-during-the-covid-19-pandemic-a-changed-world (accessed on 4 June 2021).
  25. Goswami, S.; Chouhan, V. Impact of Change in Consumer Behaviour and Need Prioritisation on Retail Industry in Rajasthan During COVID-19 Pandemic. Mater. Today Proc. 2021, 46, 10262–10267. [Google Scholar] [CrossRef]
  26. Obaka, A.I. Effect of COVID-19 on Retail Businesses in Nigeria: A Survey of Selected SMEs. Discov. Med. 2020, 56, 748–765. [Google Scholar]
  27. Sharma, M.; Luthra, S.; Joshi, S.; Kumar, A. Accelerating Retail Supply Chain Performance Against Pandemic Disruption: Adopting Resilient Strategies to Mitigate the Long-Term Effects. J. Enterp. Inf. Manag. 2021, 34, 1844–1873. [Google Scholar] [CrossRef]
  28. Evans, O. Socio-Economic Impacts of Novel Coronavirus: The Policy Solutions. BizEcons Q. 2020, 7, 3–12. [Google Scholar] [CrossRef] [Green Version]
  29. Goddard, E. The Impact of COVID-19 on Food Retail and Food Service in Canada: Preliminary Assessment. Can. J. Agric. Econ.-Rev. Can. D Agroecon. 2020, 68, 157–161. [Google Scholar] [CrossRef]
  30. Bhatti, A.; Akram, H.; Basit, H.M.; Khan, A.U.; Raza, S.M.; Naqvi, M.B. E-commerce Trends during COVID-19 Pandemic. Int. J. Future Gener. Commun. Netw. 2020, 13, 1449–1452. [Google Scholar]
  31. Roggeveen, A.L.; Sethuraman, R. How the COVID-19 Pandemic May Change the World of Retailing. J. Retail. 2020, 96, 169–171. [Google Scholar] [CrossRef]
  32. Sayyida, S.; Hartini, S.; Gunawan, S.; Husin, S.N. The Impact of the Covid-19 Pandemic on Retail Consumer Behavior. Aptisi Trans. Manag. 2021, 5, 79–88. [Google Scholar] [CrossRef]
  33. Gao, F.; Su, X. Online and Offline Information for Omnichannel Retailing. Manuf. Serv. Oper. Manag. 2017, 19, 84–98. [Google Scholar] [CrossRef] [Green Version]
  34. Li, H. Omni-Channel Operations with Showrooms and Consumer Returns. In Proceedings of the 2018 15th International Conference on Service Systems and Service Management (ICSSSM), Hangzhou, China, 21–22 July 2018; pp. 1–6. [Google Scholar] [CrossRef]
  35. Gu, Z.; Tayi, G.K. Consumer Pseudo-Showrooming and Omni-Channel Placement Strategies. Mis Q. 2017, 41, 583–606. [Google Scholar] [CrossRef]
  36. Bell, D.R.; Gallino, S.; Moreno, A. Offline Showrooms in Omnichannel Retail: Demand and Operational Benefits. Manag. Sci. 2017, 64, 1477–1973. [Google Scholar] [CrossRef]
  37. He, Y.; Xu, Q.; Wu, P. Omnichannel Retail Operations with Refurbished Consumer Returns. Int. J. Prod. Res. 2020, 58, 271–290. [Google Scholar] [CrossRef]
  38. Gallino, S.; Moreno, A. Integration of Online and Offline Channels in Retail: The Impact of Sharing Reliable Inventory Availability Information. Manag. Sci. 2014, 60, 1434–1451. [Google Scholar] [CrossRef] [Green Version]
  39. Jin, M.; Li, G.; Cheng, T.C.E. Buy Online and Pick Up In-Store: Design of The Service Area. Eur. J. Oper. Res. 2018, 268, 613–623. [Google Scholar] [CrossRef]
  40. Alikhani, R.; Torabi, S.A.; Altay, N. Retail Supply Chain Network Design with Concurrent Resilience Capabilities. Int. J. Prod. Econ. 2021, 234, 108042. [Google Scholar] [CrossRef]
  41. Sadghiani, N.S.; Torabi, S.A.; Sahebjamnia, N. Retail Supply Chain Network Design Under Operational and Disruption Risks. Transp. Res. Part E Logist. Transp. Rev. 2015, 75, 95–114. [Google Scholar] [CrossRef]
  42. Llaguno, A.; Mula, J.; Campuzano-Bolarin, F. State of The Art, Conceptual Framework and Simulation Analysis of The Ripple Effect on Supply Chains. Int. J. Prod. Res. 2021, 60, 2044–2066. [Google Scholar] [CrossRef]
  43. Dolgui, A.; Ivanov, D.; Sokolov, B. Ripple Effect in The Supply Chain: An Analysis and Recent Literature. Int. J. Prod. Res. 2018, 56, 414–430. [Google Scholar] [CrossRef] [Green Version]
  44. Carvalho, H.; Barroso, A.P.; Machado, V.H.; Azevedo, S.G.; Cruz-Machado, V. Supply Chain Redesign for Resilience Using Simulation. Comput. Ind. Eng. 2012, 62, 329–341. [Google Scholar] [CrossRef]
  45. Ivanov, D. Disruption Tails and Revival Policies: A Simulation Analysis of Supply Chain Design and Production-Ordering Systems in The Recovery and Post-Disruption Periods. Comput. Ind. Eng. 2019, 127, 558–570. [Google Scholar] [CrossRef]
  46. Ivanov, D.; Rozhkov, M. Coordination of Production and Ordering Policies Under Capacity Disruption and Product Write-Off Risk: An Analytical Study with Real-Data Based Simulations of a Fast Moving Consumer Goods Company. Ann. Oper. Res. 2017, 291, 387–407. [Google Scholar] [CrossRef]
  47. Ivanov, D.; Pavlov, A.; Dolgui, A.; Pavlov, D.; Sokolov, B. Disruption-Driven Supply Chain (Re)-Planning and Performance Impact Assessment with Consideration of Pro-Active and Recovery Policies. Transp. Res. Part E Logist. Transp. Rev. 2016, 90, 7–24. [Google Scholar] [CrossRef] [Green Version]
  48. Schmitt, A.J.; Singh, M. A Quantitative Analysis of Disruption Risk in A Multi-Echelon Supply Chain. Int. J. Prod. Econ. 2012, 139, 22–32. [Google Scholar] [CrossRef]
  49. Ivanov, D. Simulation-Based Ripple Effect Modelling in The Supply Chain. Int. J. Prod. Res. 2017, 55, 2083–2101. [Google Scholar] [CrossRef]
  50. Xu, M.; Wang, X.; Zhao, L. Predicted Supply Chain Resilience Based on Structural Evolution Against Random Supply Disruptions. Int. J. Syst. Sci. Oper. Logist. 2014, 1, 105–117. [Google Scholar] [CrossRef]
  51. Ivanov, D. Revealing Interfaces of Supply Chain Resilience and Sustainability: A Simulation Study. Int. J. Prod. Res. 2018, 56, 3507–3523. [Google Scholar] [CrossRef] [Green Version]
  52. Ivanov, D. Exiting The COVID-19 Pandemic: After-Shock Risks and Avoidance of Disruption Tails in Supply Chains. Ann. Oper. Res. 2021, 1–18. [Google Scholar] [CrossRef]
  53. Wilson, M.C. The Impact of Transportation Disruptions on Supply Chain Performance. Transp. Res. Part E Logist. Transp. Rev. 2007, 43, 295–320. [Google Scholar] [CrossRef]
  54. Thomas, A.V.; Mahanty, B. Dynamic Assessment of Control System Designs of Information Shared Supply Chain Network Experiencing Supplier Disruption. Oper. Res. 2021, 21, 425–451. [Google Scholar] [CrossRef]
  55. Thomas, V.A.; Mahanty, B. Assessment of Emergency Sourcing Strategy of a Supply Chain Through Dynamic Simulation Approach. J. Ind. Prod. Eng. 2020, 37, 56–69. [Google Scholar] [CrossRef]
  56. Battini, D.; Ivanov, D.; Gianesello, P. Closed-Loop Supply Chain Simulation with Disruption Considerations: A Case-Study on Tesla. Int. J. Inventory Res. 2017, 4, 257. [Google Scholar] [CrossRef] [Green Version]
  57. Ivanov, D. Simulation-Based Single vs. Dual Sourcing Analysis in The Supply Chain with Consideration of Capacity Disruptions, Big Data and Demand Patterns. Int. J. Integr. Supply Manag. 2017, 11, 24–43. [Google Scholar] [CrossRef]
  58. Ivanov, D.; Sokolov, B.; Solovyeva, I.; Dolgui, A.; Jie, F. Dynamic Recovery Policies for Time-Critical Supply Chains Under Conditions of Ripple Effect. Int. J. Prod. Res. 2016, 54, 7245–7258. [Google Scholar] [CrossRef]
  59. Yan, B.; Jin, Z.; Liu, Y.; Yang, J. Decision on Risk-Averse Dual-Channel Supply Chain Under Demand Disruption. Commun. Nonlinear Sci. Numer. Simul. 2018, 55, 206–224. [Google Scholar] [CrossRef] [Green Version]
  60. Chen, K.; Xiao, T. Demand disruption and coordination of the supply chain with a dominant retailer. Eur. J. Oper. Res. 2009, 197, 225–234. [Google Scholar] [CrossRef]
  61. Xu, M.; Qi, X.; Gang, Y.; Zhang, H.; Gao, C. The Demand Disruption Management Problem for A Supply Chain System with Nonlinear Demand Functions. J. Syst. Sci. Syst. Eng. 2003, 12, 82–97. [Google Scholar] [CrossRef]
  62. Unnikrishnan, A.; Figliozzi, M. Online Freight Network Assignment Model with Transportation Disruptions and Recourse. Transp. Res. Rec. J. Transp. Res. Board 2011, 2224, 17–25. [Google Scholar] [CrossRef] [Green Version]
  63. Cavallo, A.; Cavallo, E.; Rigobon, R. Prices and Supply Disruptions during Natural Disasters. NBER Working Paper No. w19474. Available online: https://ssrn.com/abstract=2332544 (accessed on 28 September 2013).
  64. Hou, J.; Zeng, A.Z.; Zhao, L. Coordination with A Backup Supplier Through Buy-Back Contract Under Supply Disruption. Transp. Res. Part E Logist. Transp. Rev. 2010, 46, 881–895. [Google Scholar] [CrossRef]
  65. Li, J.; Wang, S.; Cheng, T.C.E. Competition and Cooperation in A Single-Retailer Two-Supplier Supply Chain with Supply Disruption. Int. J. Prod. Econ. 2010, 124, 137–150. [Google Scholar] [CrossRef]
  66. Kinra, A.; Ivanov, D.; Das, A.; Dolgui, A. Ripple Effect Quantification by Supplier Risk Exposure Assessment. Int. J. Prod. Res. 2020, 58, 5559–5578. [Google Scholar] [CrossRef]
Figure 1. Distribution of supply chain members. Notes: the blue icon refers to Customer, the red is Offline store, the yellow is Manufactory, the green is Supplier, the navy blue is Warehouse center.
Sustainability 14 06529 g001
Figure 2. Goods and information flow in the supply chain.
Sustainability 14 06529 g002
Figure 3. The supply chain framework.
Sustainability 14 06529 g003
Figure 4. The supply chain performance without disruption. (a) Finances; (b) Service Level; (c) Fulfillment; (d) Lead Time; (e) Available Inventory. Note: the title of (c) Fulfillment is Fulfillment Received (Products) by Customer, Fulfillment Received (Products On-time), the left and right are the same.
Sustainability 14 06529 g004
Figure 5. The supply chain performance with M1 disruption. (a) Finances; (b) Service Level; (c) Fulfillment; (d) Lead Time; (e) Available Inventory; Note: the title of (c) Fulfillment is Fulfillment Received (Products) by Customer, Fulfillment Received (Products On-time), the left and right are the same.
Sustainability 14 06529 g005
Figure 6. The supply chain performance with the warehouse center disruption. (a) Finances; (b) Service Level; (c) Fulfillment; (d) Lead Time; (e) Available Inventory. Note: the title of (c) Fulfillment is Fulfillment Received (Products) by Customer, Fulfillment Received (Products On-time), the left and right are the same.
Sustainability 14 06529 g006
Figure 7. The supply chain performance with the offline store disruption. (a) Finances; (b) Service Level; (c) Fulfillment; (d) Lead Time; (e) Available Inventory. Note: the title of (c) Fulfillment is Fulfillment Received (Products) by Customer, Fulfillment Received (Products On-time), the left and right are the same.
Sustainability 14 06529 g007
Table 1. Products.
Table 1. Products.
ProductsPrice (USD)Cost (USD)
Furniture1100400
Lighting700300
Small appliances270120
Large home appliances850350
Gardening equipment800350
Table 2. Structure per site.
ObjectInventory PolicyProduction Time (Unit/Day)
MinMaxInitial Stock
Manufactory1
Furniture3847683840.01
Lighting1803601800.03
Manufactory2
Small appliances51010205100.008
Large home appliances3246483240.015
Manufactory3
Gardening equipment1082161080.06
Online platform
Furniture384768384
Lighting180360180
Small appliances5101020510
Large home appliances324648324
Gardening equipment108216108
Offline stores
Furniture117234117
Lighting5811658
Small appliances162324162
Large home appliances9619296
Gardening equipment377437
Table 3. Key performance indicators.
GroupProvides
FinancesDetailed information on generated revenue and incurred expenses
Service LevelDetailed information on the quality of provided delivery services
Lead TimeThe total time for each product from the upstream facilities to the downstream facilities
FulfillmentOrder fulfillment, including Late Products, Received Products, On-time Received Products
Available InventoryDescribes the daily average dynamic inventory quantity of each product
Table 4. Specific values of KPIs in 4 scenarios.
ScenariosRevenueTotal CostProfitELTLead Time
Normal-state47,361,60023,487,238.81223,874,361.1881.00054
M1 disruption47,361,60028,421,001.97018,940,598.0300.832888
Warehouse center disruption45,688,80032,135,310.58013,553,489.4200.7671110
Offline store disruption40,478,40025,835,772.58614,642,627.4140.85263
Publisher’s Note: MDPI stays neutral with regard to jurisdictional claims in published maps and institutional affiliations.

