Article

Optimal K Management Improved Potato Yield and Soil Microbial Community Structure

1
College of Resources and Environment, Southwest University, Chongqing 400716, China
2
Guizhou Institute of Soil and Fertilizer, Guizhou Academy of Agricultural Sciences, Guizhou 550006, China
3
College of Business Administration, Guizhou University of Finance and Economics, Guizhou 550025, China
*
Authors to whom correspondence should be addressed.
Sustainability 2022, 14(11), 6579; https://doi.org/10.3390/su14116579
Submission received: 19 April 2022 / Revised: 24 May 2022 / Accepted: 26 May 2022 / Published: 27 May 2022

Abstract

:
Optimal potassium (K) fertilizer application in potato cropping systems can effectively increase food production and mitigate soil microbial ecosystem stress. The dynamics and sustainability of potato yield, the dynamics of potato commodity rates (CRs), and microbial community structure were explored under four different K application rates (kg K ha−1 year−1): 0 (control), 75 (low K), 150 (medium K), and 225 (high K). Compared with the low-K application, the medium-K and high-K applications increased potato yields by 8.08% and 11.66%, respectively. The mean CR of potato tubers during 4 years was significantly greater under the medium-K treatment than under the low-K and high-K treatments. Both medium-K and high-K applications significantly enhanced the sustainable yield index (SYI) relative to the Low-K application by 7.93% and 9.34%, respectively. Compared with the zero-K, low-K, and high-K treatments, the medium-K treatment improved the total phospholipid fatty acid (PLFA) contents by 11.91%, 16.84%, and 11.66%, respectively. Moreover, the medium-K application increased the bacterial PFLA, actinomycete PFLA, gram-positive (G+) bacterial PFLA, and gram-negative (G) bacterial PFLA contents in the soil. Overall, application of 150 kg ha−1 year−1 K fertilizer represents a promising fertilization strategy in potato cropping systems in Southwest China.

1. Introduction

Potassium (K) is one among the nutrients necessary for crop growth and plays important roles in numerous physiological processes that are critical to the growth, photosynthesis, yield, quality and stress resistance of all crop species [1,2]; moreover, K is critical in inducing changes in soil chemical, physical, and biological properties [3,4,5]. Nevertheless, K deficiency occurs in most regions worldwide [6]. Additionally, worldwide, nutrient-rich dry matter is removed during crop harvest and is used for other purposes (heating, animal feed, biofuels), which means that a substantial amount of nutrients are removed from the soil, of which 60 million tons K year−1 are removed [7]. Consequently, K has severely limited the sustainable development of agricultural production in intensive agricultural production systems [6,8], especially in developing countries, where the problem of soil K deficiency is particularly prominent [1]. Under K deficiency in agricultural production, the low K levels in farmland soil and the poor utilization efficiency of K fertilizer hinder increases in crop yield potential and further improvement of product quality.
As the world’s fourth-most populous food crop species after rice, wheat and maize [9,10], potato (Solanum tuberosum L.), which is highly enriched in K, is one of the important sources of K in the human diet [6]. Potato plants contain high amounts of K because of their high absorption of K [11]. However, after continuous cropping of potato plants, a large amount of K is removed via the tubers, stems, and leaves, further aggravating the imbalance between the output and input of K in farmlands. Therefore, K has become one of the important elements limiting potato yield [12]. K plays a crucial role in plant growth, starch synthesis, and tuber quality and quantity [2,13,14]; moreover, K is among the macronutrients intensively absorbed by crop plants [15]. Since high yields of marketable tubers require high levels of K, it is imperative to calculate the K fertilizer application rates and sources based on the plant’s biological requirements prior to application [14]. Applying relatively more nitrogen and phosphorus fertilizers and less K fertilizer and organic fertilizer generally occurs in production, leading to a low utilization rate of K fertilizer in potato, which is not conducive to reaping the full benefits of K fertilizer on potato yield [16,17]. Previous studies have indicated that K deficiency in crop plants may limit their ability to utilize nitrogen, thereby increasing the potential for nitrate leaching [1]. In addition, K application level has a great impact on potato yield. A reasonable K application level is beneficial to the improvement of potato yield. An application rate of K that is too high or too low can decrease potato yield and quality [6,18]. Thus, the balanced application of K fertilizer in potato production is an important agronomic measure for improving potato quality and agronomic efficiency.
A rapidly growing number of people are becoming aware of the issue associated with the use of excessive amounts of chemical fertilizers to improve soil fertility [10,19]. Soil microorganisms are the main driving force of material circulation in the soil, are directly related to soil fertility, and are important indicators for measuring soil quality [20,21]. In agricultural production, fertilizer not only directly influences the growth and yield of crops but also greatly affect soil physicochemical properties and cause variations in soil microbial quantity, activity, and community structure [22]. Differences in fertilization patterns can strongly affect the population structure and quantity of soil microorganisms, which can affect plant quality and cultivated land quality [23,24]. In general, the richness of soil microbial species helps stabilize soil ecological function, thereby promoting soil health and soil quality [25,26,27]. Nevertheless, it is still unclear how the application rate of K fertilizer influences the soil ecological characteristics of continuously cropped potatoes in the seasonally arid region of Southwest China.
Southwest China is the largest potato-producing area worldwide [28], but the soil in this region has low K concentrations [29]. Moreover, the amount of K fertilizer applied during potato cultivation is often insufficient due to economic constraints, lack of fertilizer availability, or poor knowledge of scientific fertilization techniques. K application can optimize potato growth conditions on K-deficient soils and enhance potato adaptation/resistance mechanisms. However, few studies have reported the effects of K fertilization on soil microorganisms in yellow soil across multiple years of potato cultivation. Soil microbial structure can reflect dynamic changes in microbial communities, and there are many different research methods to determine soil microbial diversity in various situations. Among them, the phospholipid fatty acid (PLFA) method is characterized by being simple to perform and producing reliable and quantifiable results. Determining the advantages of soil microbial communities can serve to effectively analyze the diversity of the soil microbial community structure [30,31]. Therefore, to identify the effects of different K fertilizer application rates on the yield of potato grown in yellow soil and on the soil microbial community structure, in this paper, we employed the field experiment and PLFA method. Using these techniques, we explored the effects of different K application rates on potato yields, commodity rates (CRs), and yield stability in a yellow soil in the Guizhou area, thus contributing a scientific theoretical basis for the rational application of K fertilizer to potato agricultural production.

2. Materials and Methods

2.1. Site Description

A location field experiment was conducted in yellow soil (entisol) from 2012 to 2015 in Huchao township, Huaxi district, Guiyang (106°31′ E, 26°26′ N, 1185 m above sea level), Guizhou, China. This was a rain-fed trial. A typical subtropical monsoon climate prevails in the region, where the annual mean temperature is 14.5 °C and the annual rainfall range is 1100–1200 mm. An automatic weather station was used to collect air temperature and precipitation data at our experimental field site (Figure 1). Upon beginning the experiment in 2012, the soil had a pH of 4.25 and a soil organic matter (SOM) content of 40.93 g kg−1. The available nitrogen (N, alkaline hydrolysis N), phosphorus (P, Olsen-P), and potassium (K, ammonium acetate-extractable K) (in mg kg−1) values were 135.7, 56.3, and 101.8, respectively.

2.2. Experimental Design

Four treatments were applied in accordance with a completely randomized design, and each of these treatments was repeated three times. The area of each plot was 24 m2, with a size of 8 m × 3 m, and the plots were separated by cement barriers to prevent nutrient and water movement between them. The experimental treatments consisted of: (1) control (a zero-K fertilizer control); (2) low K (75 kg K ha−1 year−1); (3) medium K (150 kg K ha−1 year−1); and (4) high K (225 kg K ha−1 year−1). Mineral N, P, and K refer to urea, superphosphate, and potassium sulfate, respectively. All treatments received the same quantities of N (210 kg ha−1 year−1) and P2O5 (120 kg ha−1 year−1). The fertilization strategy involved dividing the N fertilizer into two portions, namely, basal fertilizer (70%) and topdressing fertilizer (30%). Urea was applied as a topdressing during the initial flowering period of potato, and P and K fertilizers were applied as the basal fertilizations.

2.3. Crop and Soil Sampling and Analysis

Potato (Solanum tuberosum L.) tubers were planted between March 10 and 16 and harvested between August 1 and 10 each year. The chemical pesticides were applied to control weeds, pests, and diseases. The fresh weights of the plants were obtained at harvest. After potato plants were harvested, the 0−20 cm layer of soil was collected; specifically, the soil at 5 locations was collected in each micro area, and the 5 soil samples were mixed into one sample, packed into bags, and transported back to the laboratory. The soil properties and PLFA content were analyzed using three technical replicates. A 2 mm sieve was used to homogenize each soil sample, and a portion of each sample was stored at −80 °C for subsequent PLFA analysis.

2.4. Analysis of PLFAs of Microbial Communities

Soil microbial PFLAs were extracted according to the methods of Bligh and Dyer [32], and then the composition was analyzed with an Agilent 6850 gas chromatograph. It was carried out under the following conditions: instrument, HP-5 column (25.0 m × 200 μm × 0.33 μm); injection volume, 1 μL; split ratio, 10:1; carrier gas, H2; makeup gas, high-purity N2; auxiliary gas, air; flow rate, 0.8 mL min−1. The vaporization chamber temperature was 250 °C, the detector temperature was 300 °C, and the precolumn pressure was 10.0 psi. The column temperature was 170 °C initially, increased at 5 °C min−1 to 260 °C, was raised at 40 °C min−1 to 310 °C, and, then, maintained for 1.5 min. The fatty acids of each component were analyzed by an American MIDI Sherlock Microbial Identification System (version 6.1, MIDI, Inc., Newark, DE), C9-C20 fatty acid methyl ester standards were purchased from American MIDI Company, and C19:0 served as the internal standard to calculate the absolute contents of the PLFAs.
PLFA profiles were used to study the microbial community composition [33,34]. The bacterial labeled fatty acids included 14:0, i14:0, i15:0, a15:0, i15:0 G, 16:0, i16:0, 16:1 2OH, 16:1 G, 16:1w5c, 16:1w9c, i17:0, a17:0, cy17:0, 17:1 w8c, i18:0, 11Me18:1w7c, cy19:0w8c, and i19:0, of which 14:0, i14:0, i15:0, a15:0, i15:0 G, i16:0, 16:1 2OH, 16:1 G, i17:0, a17:0, and i18:0 were gram-positive (G+) bacteria and 16:1w5c, 16:1w9c, cy17:0, 17:1 w8c, cy19:0w8c, and 18:0 were gram-negative (G) bacteria. In addition, 18:1 w9c was a fungal fatty acid, and 10Me17:0 and 10Me18:0 were actinomycete fatty acids. The F/B PLFA ratio was presented as an indicator of the bacterial/fungal biomass ratio in the soil [35], and the G+/G-PLFA ratio was presented as an indicator of the G+/G bacteria ratio in the soil [34].

2.5. Commodity Rates (CRs) of Potato

The CRs of potato were calculated using the following Equation:
CRs =   Y 1 Y
where Y1 represents the weight of all >50 g potato tubers (t ha−1) and Y represents the yield of all potato tubers (t ha−1).

2.6. Determination of the Sustainable Yield Index (SYI)

The SYI is a key indicator representing system sustainability. The SYI was obtained with the following equation, according to the methods of Liu et al., 2020 [36]:
SYI = ( Y σ ) Y max
where Y, σ and Ymax refer to mean yield (t ha−1), standard deviation, and the highest yield obtained across all the treatments across all years (t ha−1), respectively. There was a variable SYI of 0 to 1; the larger the SYI, the higher the sustainable yield.

2.7. Statistical Analyses

The one-way analysis of variance (ANOVA) was employed to measure the significant differences between soil and plant indicators. A Duncan’s multiple range test (SSR) was used to test for significance of treatment effects at a level of p < 0.05. The statistical analysis was conducted using SPSS 16.0 (SPSS, Inc., Chicago, IL, USA). Figures and tables were constructed with Excel 2016 and Origin 22.0. The soil microbial community PLFA was analyzed using principal component analysis (PCA). CANOCO 5.0 was used to conduct the statistical analysis.

3. Results

3.1. Potato Yield, CRs and the SYI

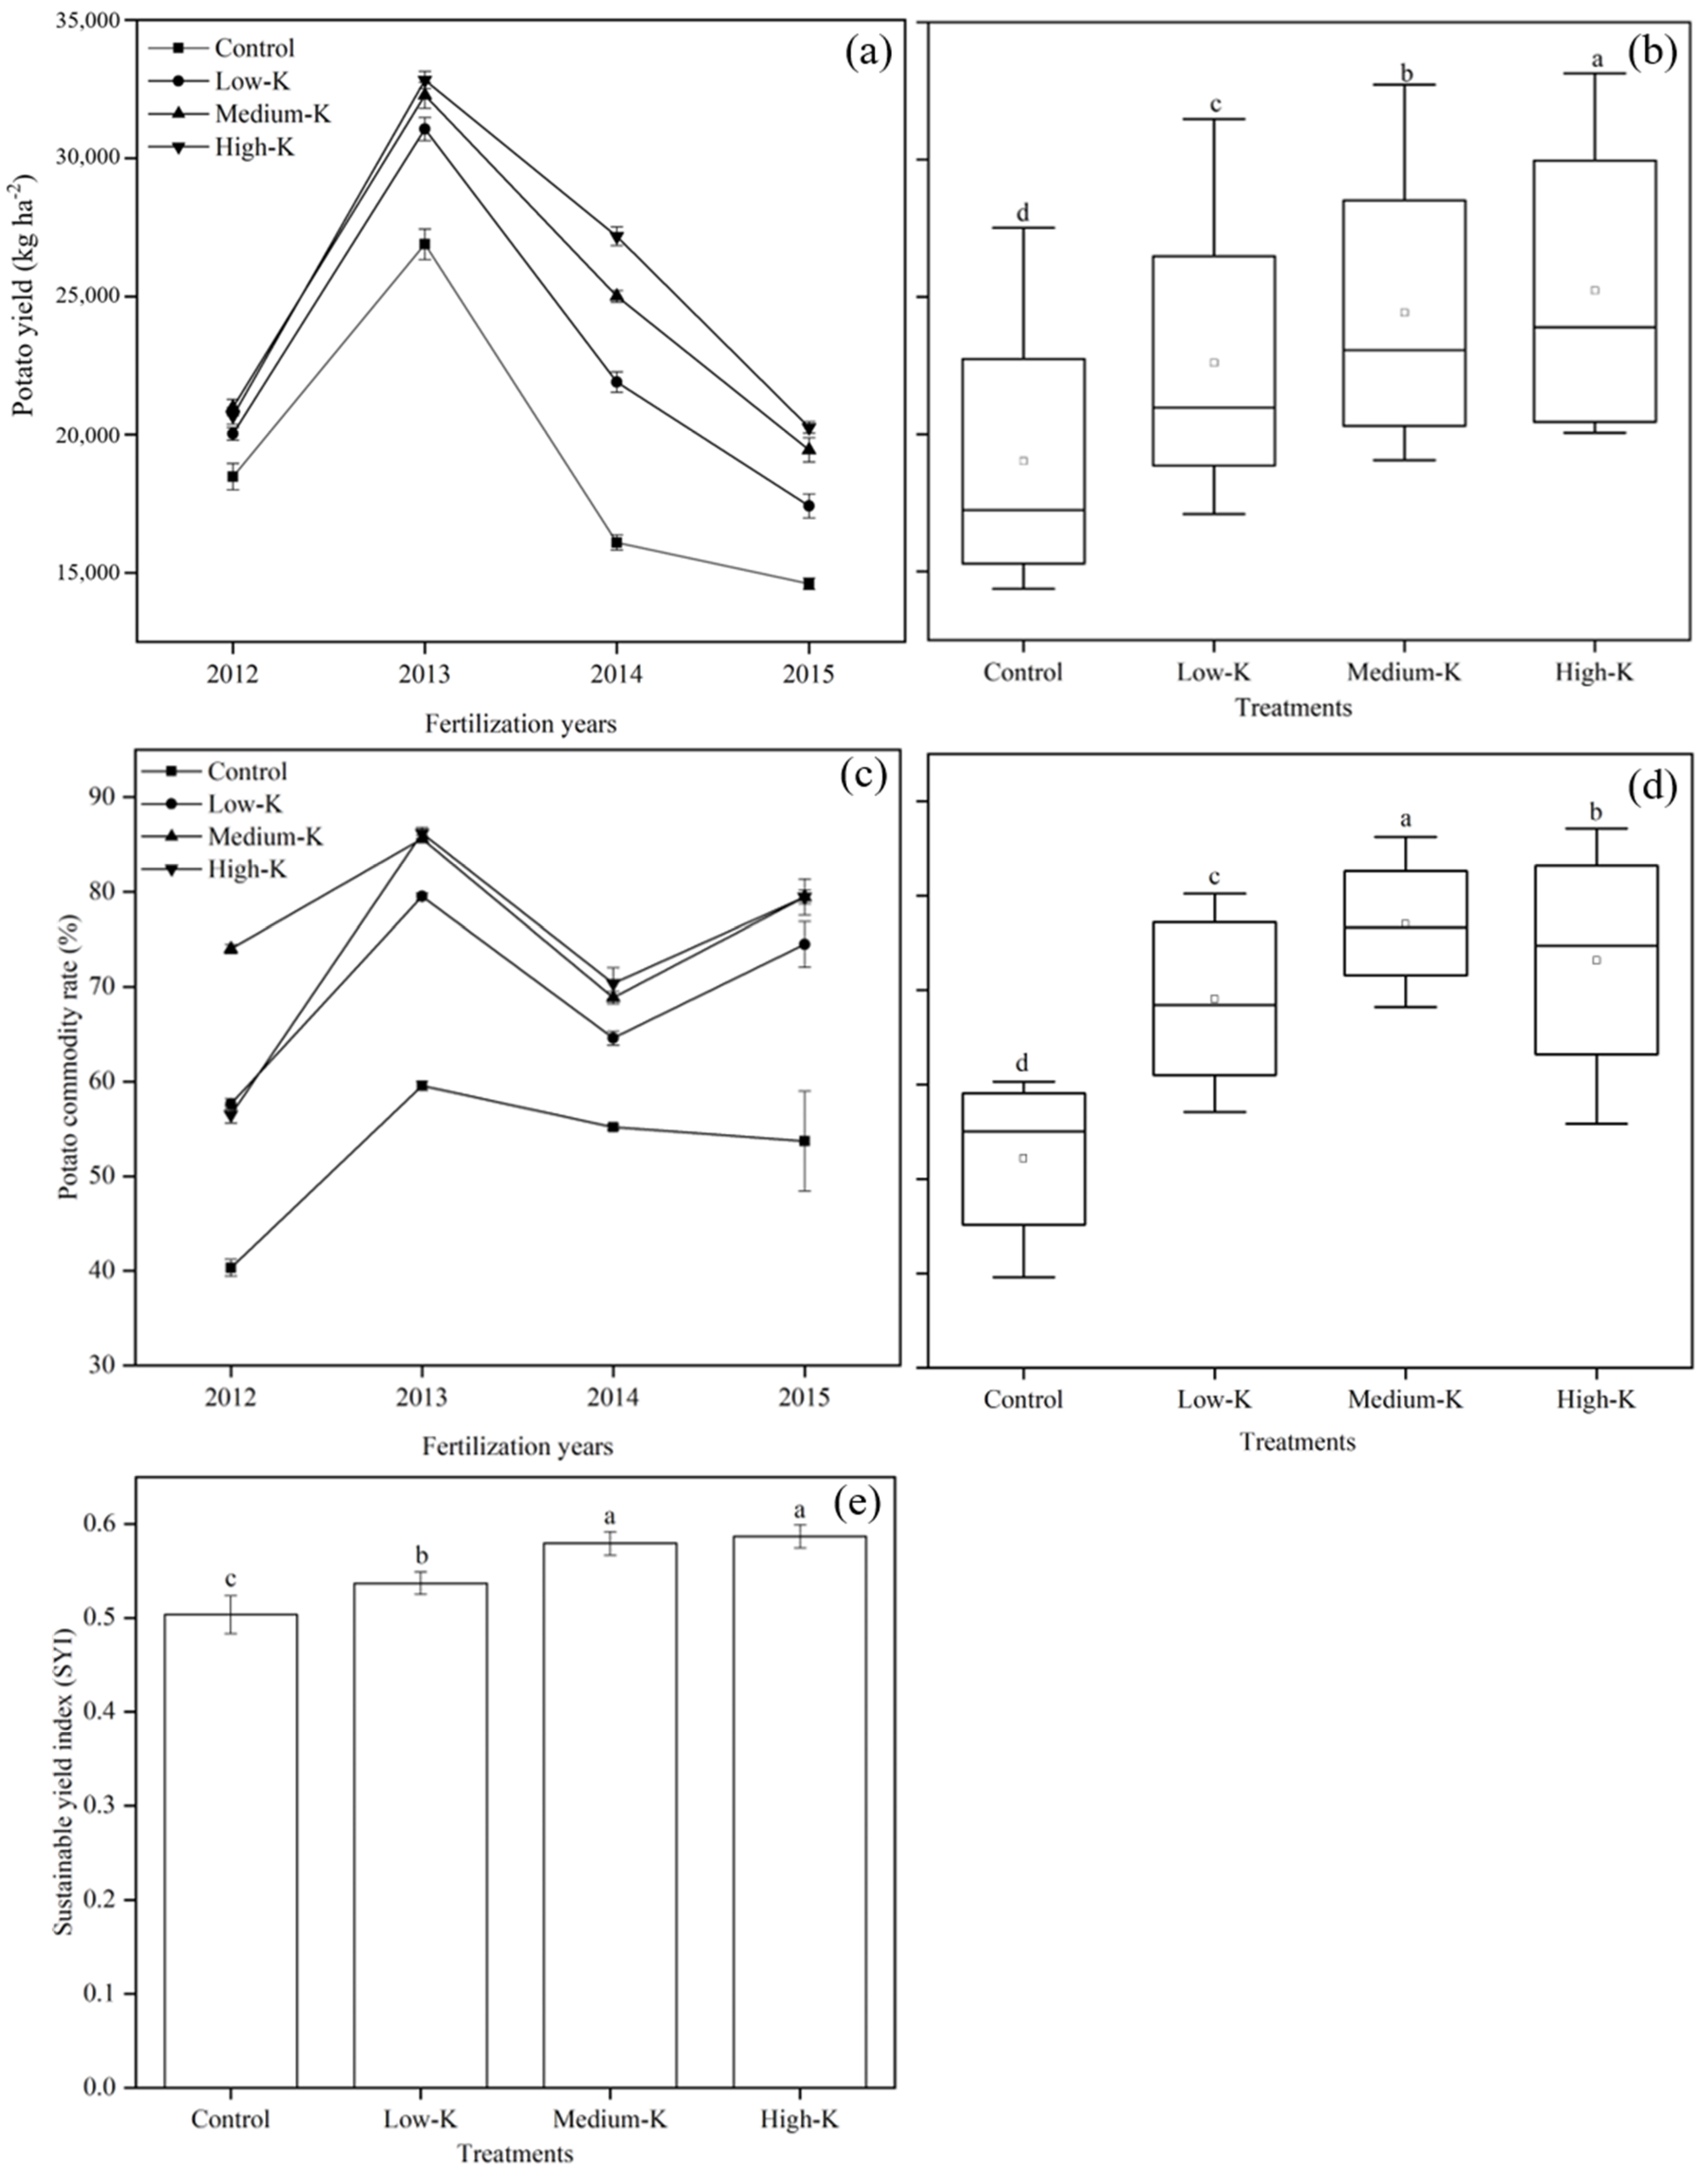
In comparison with the zero-K treatment, yields of potatoes increased under various K application rates. As a result of zero-K application, potato yields were the lowest of all years (Figure 2a). Based on our research, we discovered an interesting phenomenon: the potato yield in 2013 was higher than in other years. As shown in Figure 1, the rainfall in June and July 2013 was significantly less than in other years. It is well known that excessive rain will lead to soil nutrient leaching, which adversely affects the crop’s ability to absorb and utilize nutrients. Potato plants benefit from less cloudy and rainy weather so that they can get more sunlight, improve photosynthesis, and increase their production rates. The mean yield of potato in all four years under different K application rates increased compared with the zero-K treatment (Figure 2b). The mean yield of potato across all 4 years followed the order of high-K application > medium-K application > low-K application. Under the medium-K and high-K treatments, the yield significantly improved compared with that under the low-K application rate by 8.08% and 11.66%, respectively.
Compared with that under the zero-K application treatment, the CRs of potato under the different K application rates increased. Under the zero-K application, the CRs of potato were the lowest in all the years (Figure 2c). The mean CRs of potato across all 4 years significantly increased by 32.33%, 47.54%, and 40.15% in the low-K, medium-K, and high-K application rate treatments, respectively, relative to the zero-K application treatment (Figure 2d). Unlike the law of the mean yield of potato, the mean CRs of potato across all 4 years were significantly higher under the medium-K than under the other K application rate treatments.
The SYI of potato significantly improved under the different K application treatments relative to the zero-K application treatment (Figure 2e). The SYI significantly increased by 7.93% and 9.34% in the medium-K and high-K application rate treatments, respectively, relative to the low-K application treatment. However, the SYI was not different between the medium-K and high-K treatments.
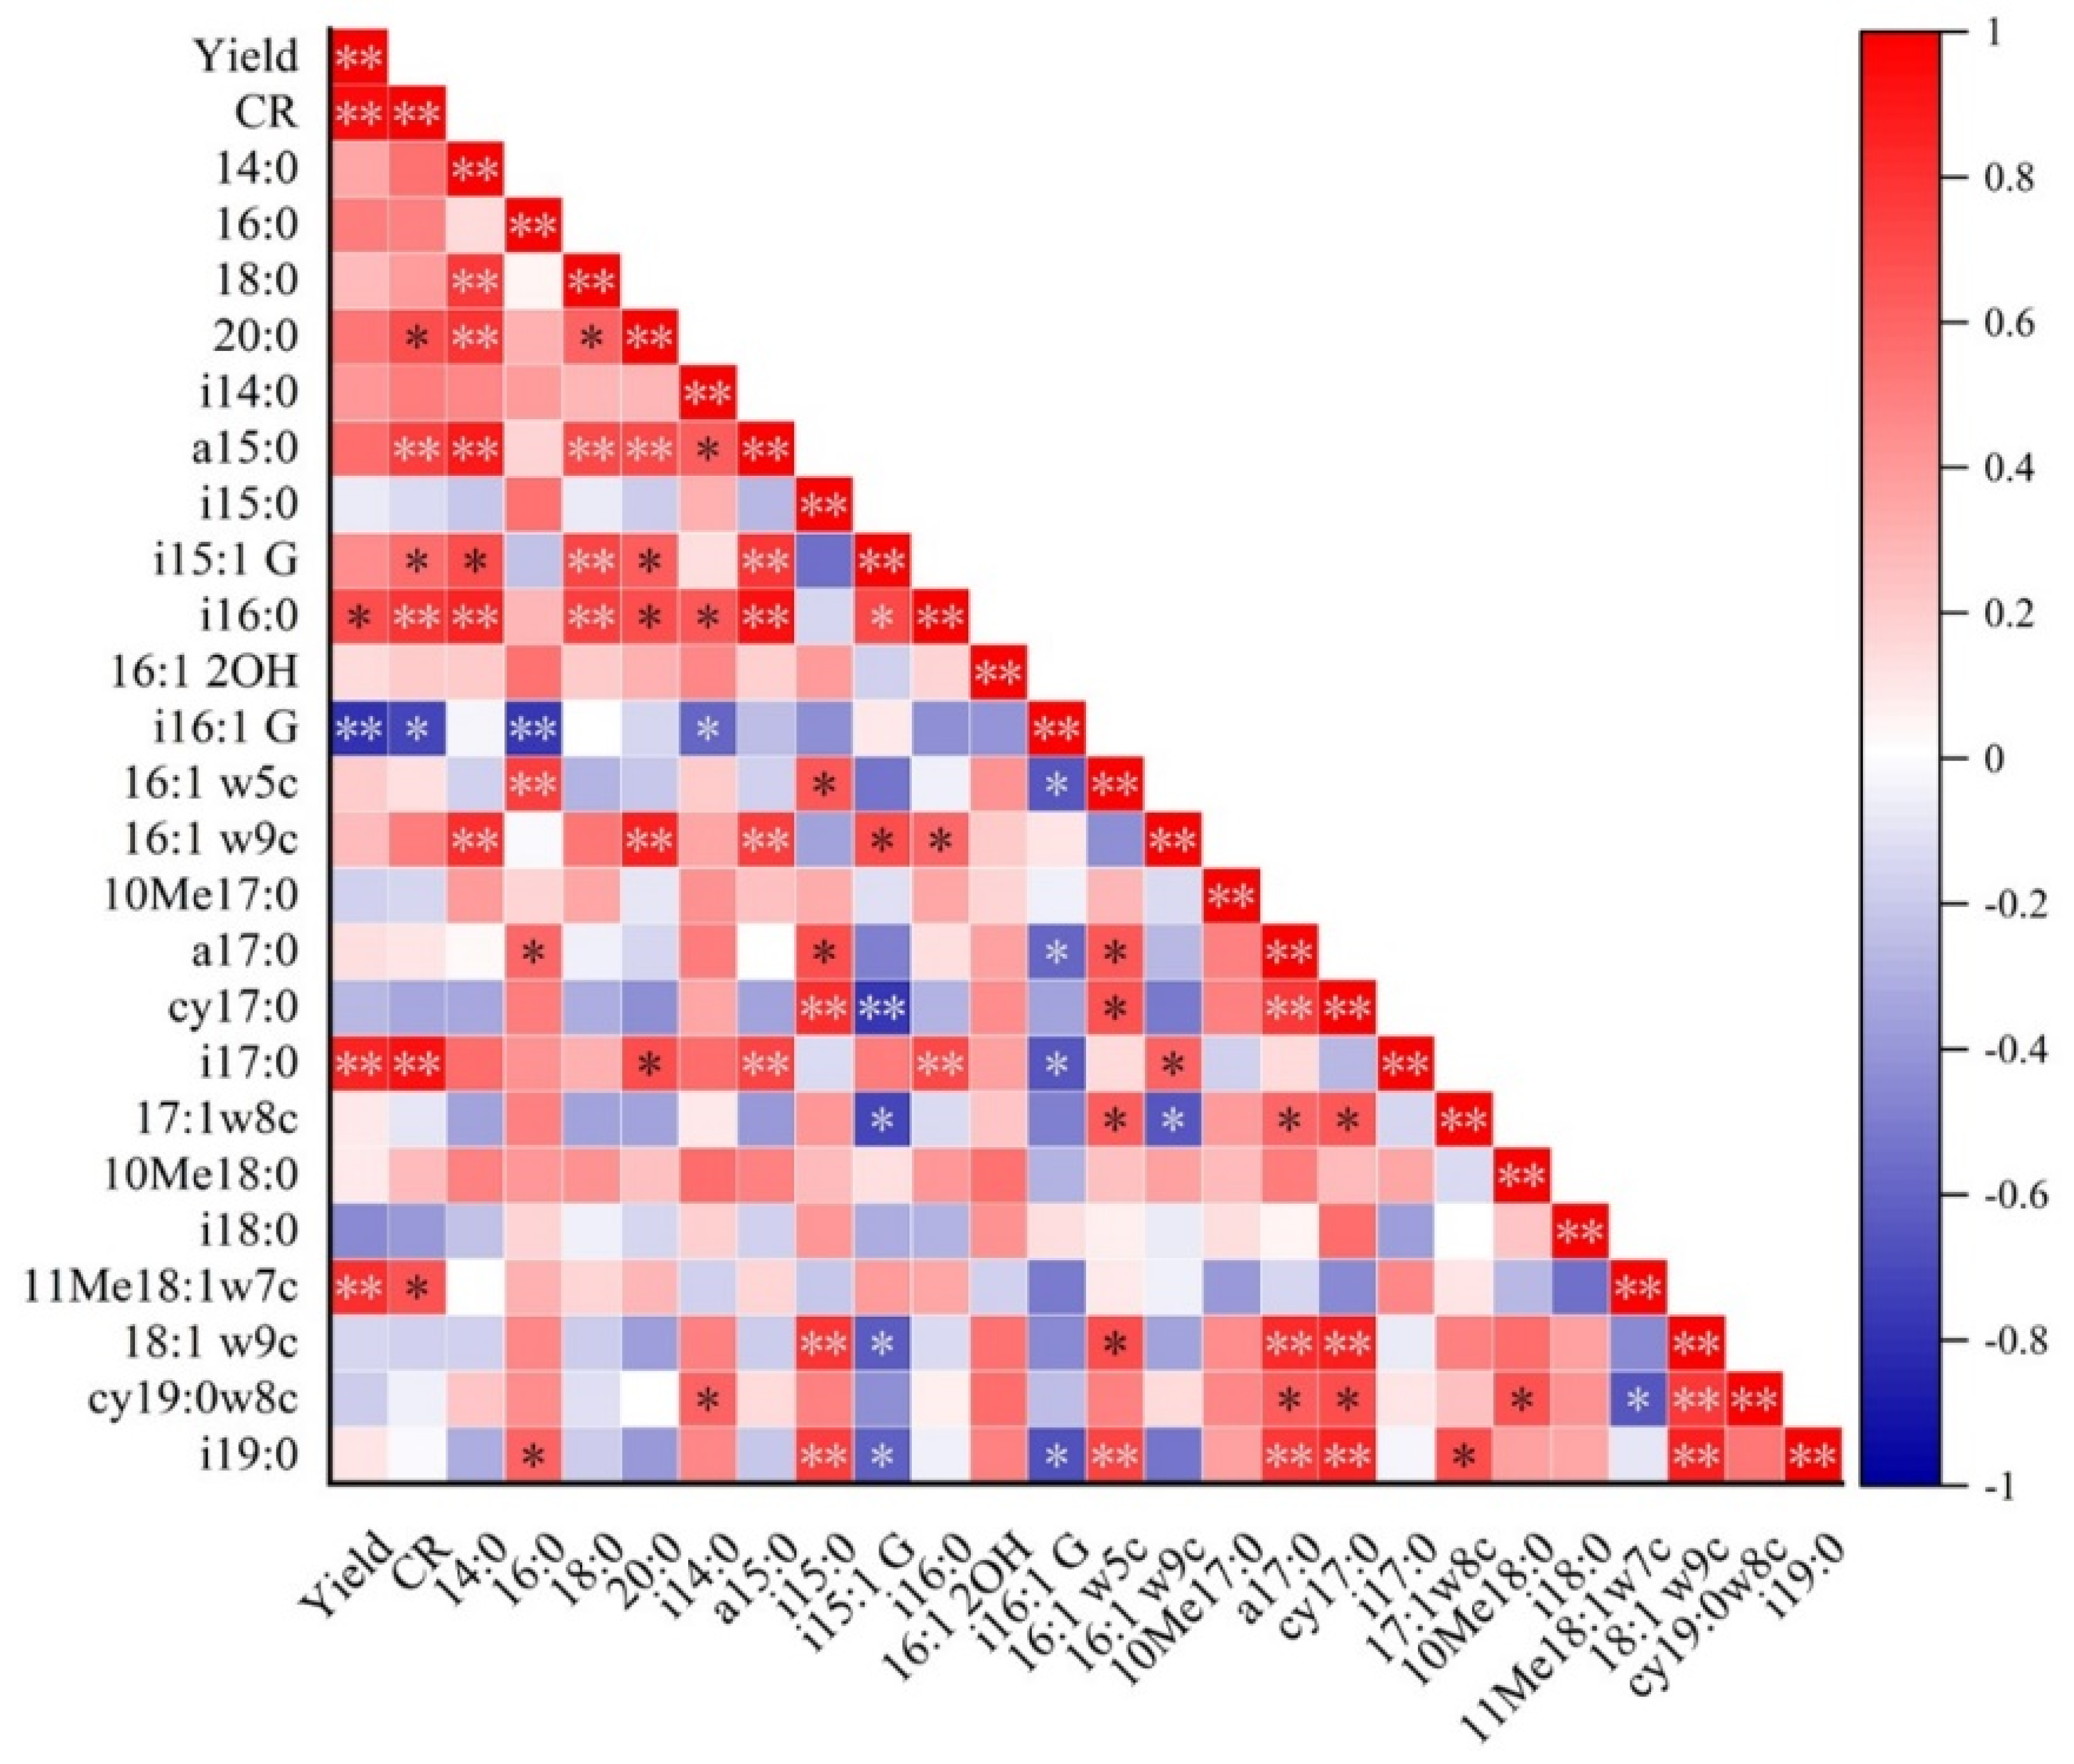
Correlation analysis showed that potato yield had a significantly positive linear relationship with CRs, i16:0, i17:0, and 11Me18:1w7c (Figure 3). CRs had a significantly positive linear relationship with 20:0, a15:0, i15:1 G, i16:0, i17:0, and 11Me18:1w7c. However, the potato yield and CRs were significantly negatively correlated with the i16:1 G.

3.2. Soil Microbial PLFA Content and Composition

As a result of the different K application rates, an overall total of 24 PLFAs were detected in order to assess the microbial community composition (Table 1). Compared with those under the zero-K, low-K, and high-K application treatments, the total PLFA content under the medium-K treatment significantly increased by 11.91%, 16.84%, and 11.66%, respectively. Twenty 14–19-carbon PLFAs representing bacteria, 10Me17:0 and 10Me18:0 PLFAs representing actinomycetes, and 18:1 w9c PLFAs representing fungi were identified. The PLFA profiles comprised predominantly normal saturated fatty acids: 14:0, 16:0, 17:0, 18:0, 19:0, and 20:0. Terminally branched saturated fatty acids (i15:0, a15:0, i16:0, a17:0, i17:0, and i18:0), cyclopropyl fatty acids (cy17:0 and cy19:0w8c), monounsaturated fatty acids (16:1w5c, 16:1w9c 17:1w8c, and 18:1w9c), and a hydroxyl fatty acid (16:1 2OH) were also detected.
The contents of bacterial PFLAs, actinomycete PFLA, G+ bacterial PFLAs, and G bacterial PFLAs under the medium-K treatments compared with the zero-K application treatment significantly increased by 12.35%, 17.27%, 13.59%, and 7.85%, respectively (Figure 4a,c–e). The fungal PLFA content under the low-K and high-K application rates decreased compared with that under the zero-K and medium-K application rates (Figure 4b). Under low-K application, the fungal PLFA contents were the lowest in all the treatments. The medium-K application rate significantly increased the contents of bacterial PFLAs, fungal PLFAs, actinomycete PFLAs, G+ bacterial PFLAs, and G bacterial PFLAs under both the low-K and the high-K treatments.

3.3. Principal Component Analysis (PCA)

PCA of the PLFA biomarkers of the soil microbial community revealed variations in microbial composition with different K application rates (Figure 5). The top 2 principal components (PCA1 and PCA2) explained 93.77% of the variance of the PLFA data. From the results of the PCA of the different K application rates, compared with the zero-K application treatment, the different K application treatments resulted in obvious microbial population advantages. The PLFA profiles showed a significant separation of the high-K and medium-K treatments from the zero-K to low-K treatments (PC1). The microbial community had significant advantages in response to the high-K and medium-K treatments compared with the low-K treatment, including PLFA profiles being composed of predominantly normal saturated fatty acids (14:0, 16:0, 18:0, 20:0), terminally branched saturated fatty acids (a15:0, i16:0, and i17:0), isomerized PLFAs (i14:0), and 11Me18:1w7c PLFAs.

3.4. Soil Microbial PLFA Ratios

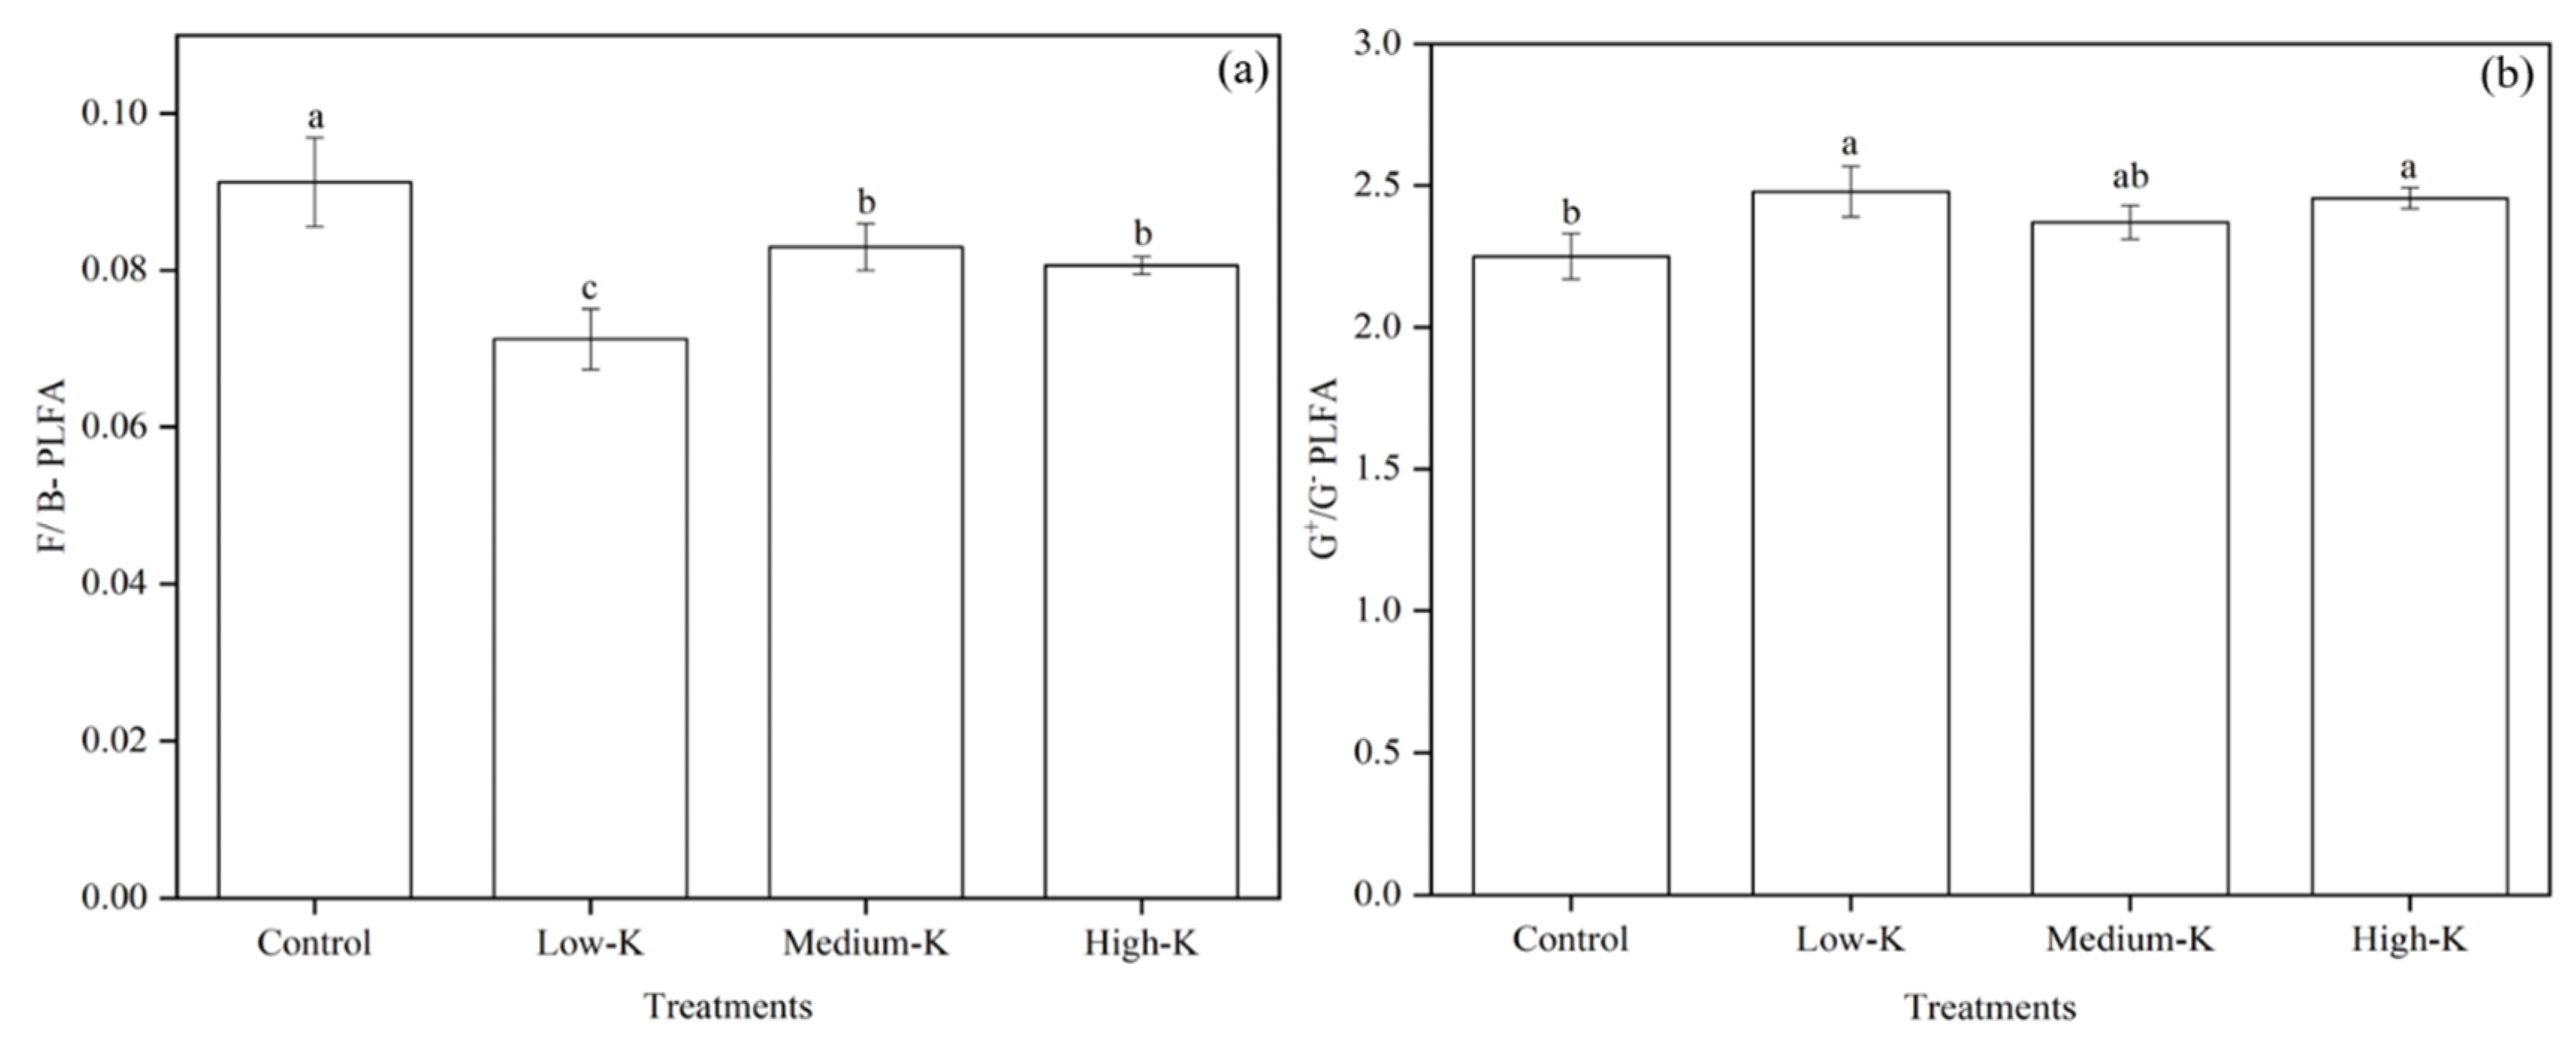
Figure 6a,b show the ratios of fungal PFLAs/bacterial PFLAs (F/B) and G+/G bacterial PFLAs, which may all be associated with different amounts of K fertilizer. F/B-PFLA ratios were significantly higher under the high-K and medium-K treatments compared with low-K application treatments by 16.48% and 13.20%, respectively (Figure 6a). Moreover, compared with the zero-K application treatment, the different K application treatments significantly increased the G+/G bacterial PLFA ratios. However, the G+/G bacterial PLFA ratios were not different between the medium-K and zero-K application treatments (Figure 6b).

4. Discussion

Plants need an adequate nutrient supply to achieve optimal productivity; greater amounts of K than any other mineral element except nitrogen are especially needed [28,37,38]. Potato growth requires a considerable amount of K, but no adverse reactions are known to result from K deficiency [12]. In the present study, a 4-year field trial with various potassium fertilizer rates indicated that (Figure 2) K fertilizer can significantly increase potato yield and potato tuber CRs and can increase the sustainability index. This study concluded that potato yield was highest under the high-K application rate (225 kg K ha−1 year−1), which was similar to the results of Zhang et al., 2018 [39]. Nonetheless, from the perspective of the potato tuber CRs and SYI, the medium-K application rate (150 kg K ha−1 year−1) can achieve high and stable potato yields, and the benefits are more significant in terms of the ratio of production to investment. Previous studies have shown that an unsuitable K application rate directly affects potato yield and quality; potato starch content, phosphorus content, and particle size decreased with increasing K application rate [39]. Moreover, excessive K levels can lead to severe magnesium deficiency [40,41], which in turn affects the improvement of potato yield. Optimizing K fertilizer management and achieving a balanced nutrient application are beneficial to the improvement of potato yield and quality [42]. A correlation analysis in this study determined that potato yield, CR, and microbial community were strongly related. The bacteria (i16:0, i17:0, and 11Me18:1w7c) promote increased potato yields, and bacteria 20:0, a15:0, i15:1 G, i16:0, i17:0, and 11Me18:1w7c had a positive effect on the improvement of CRs, while bacteria i16:1 G had no effect.
Nutrient availability is an important determinant of microbial community composition [43,44]. The soil microbial community structure varied in response to the different fertilizer application, and K treatment also strongly affected the soil microbial community structure over time (Figure 3). Organic acids excreted by some soil microorganisms (e.g., Pseudomonas, Burkholderia, Acidithiobacillus ferric oxide, Bacillus myxi, Bacillus medlar, Bacillus xanthos) can release K from K-containing minerals [45]. This suggests that the secretions of these microorganisms can be used to promote the release of K from clay minerals. Furthermore, culture experiments have shown that the addition of inoculated feldspar to the soil can increase the soil’s solubility of K and plant K absorption by approximately 40–60% [46,47,48]. In this study, the medium-K fertilizer rate promoted an increase in total soil PLFAs, indicating that optimizing the management of K fertilizer application altered the microbial community structure. Soil microbial abundance near potash mines was much lower than in soils not affected by high K concentrations, possibly because high K conditions may inhibit biota or negatively affect DNA extraction [49]. Fungi have a wide range of enzymatic roles in soil [50]. G+ bacteria have specific activities in promoting plant growth [51], and G bacteria promote the development of fast-growing soil microbial species [52]. G+ and G bacteria PFLAs have different functions in the soil ecosystem, which are strongly influenced by the environment. As PFLAs of G+ and G bacteria increase, soil ecosystem stability is improved. This study revealed that the medium-K fertilizer rate increased the contents of soil bacterial, actinomycetes, and G+ bacterial and G bacterial PFLAs and significantly improved the microbial community structure composition. An appropriate K fertilizer application is critical to improving G+ and G bacterial PFLA levels and promoting soil ecosystem stability. K deficiency leads to the blockage of sucrose transport from the leaves to the root system in plants and the inhibition of root development, thereby reducing root exudates and the content of microbial taxa [1]. Moreover, insufficient or excessive K fertilizer can cause an imbalance in plant nitrogen supplies, resulting in physiological nitrogen deficiency, which stimulates G bacteria and actinomycetes, thereby altering the composition of soil microbial communities [31]. The PCA results revealed an interesting phenomenon: high-K and medium-K treatments can significantly improve the population dominance of soil bacteria (20:0, a15:0, i16:0, i17:0, 11Me18:1w7c) with the consequence being an increase in potato yield and CRs. The results suggest that the K application rate also affected the soil microbial community structure because the different K fertilizer rates had varying effects on the growth and number of specific microbial communities, which affected the soil microbial community even more.
The ratio of soil fungi to bacteria reflects the variation range and relative abundance of the contents of fungi and bacteria [53]. Previous studies have demonstrated that the higher the ratio of fungi to bacteria is, the greater the health and stability of the soil ecosystem [54]. In this study, the medium-K and high-K treatments increased the F/B PLFA ratio compared with the low-K treatment, indicating that the F/B PLFA ratio was a better indicator of soil health at the medium-K application rate than at the low-K application rate. The F/B PFLA ratio varied differently, which was due to the fact that compared with the zero-K treatment, the medium-K treatment mainly had a more significant effect on bacteria. In contrast, the high-K treatment mainly had a more substantial impact on fungi. This change in fungi and bacteria led to different changes in F/B PFLA. Compared with low-K treatment, medium-K treatment significantly increased both bacterial and fungi PLFAs. In contrast, high-K treatment had no significant effect on bacterial PLFA but significantly increased fungal PLFA. This indicated that the medium-K and low-K treatments changed both bacterial and fungi PLFAs, while the high-K treatment only changed the fungal PLFA. The ratio of G+ bacteria to G bacteria (G+/G) is an indicator of environmental stress. The higher the G+/G PLFA ratio, the higher the relative abundance of soil populations and the stronger the stability of soil ecosystems [34]. Our study revealed that, compared with zero-K, the various K treatments improved the G+/G PLFA ratio, which may be due to the imbalance in soil nutrient contents resulting from no-K fertilizer treatment. Compared with zero-K treatment, medium-K treatment significantly increased G+ PLFA, but low-K and high-K treatments had no significant effect; medium-K treatment significantly increased G PLFA, while low-K and high-K treatments significantly decreased G PLFA. As a result, there was a difference in G+/G PLFA ratio. Soil microorganisms are usually in a state of nutrient deficiency; G bacteria are mostly fast-growing microorganisms and are more sensitive to fluctuations in soil nutrient levels than other microorganisms; therefore, G bacteria are less able to adapt to environmental stress conditions [55]. The results showed that a balanced application of K fertilizer could improve the stability of the soil ecosystem by improving G+/G PLFA. Obviously, the soil microbiota was strongly affected by differences in the fertilizer treatments [56,57,58]. It can be concluded that optimizing the K fertilizer application rate is critical to maintaining soil microbial biomass and affecting the stability of the microbial community structure.

5. Conclusions

K fertilizer application can increase potato yields, the CRs of potato tubers and the SYI and can improve microbial community structure. However, from the point of view of comprehensive benefits, the K fertilizer application rate at 150 kg ha−1 year−1 increases the potato yield, CRs and SYI most efficiently. At the same time, a K fertilizer rate of 150 kg ha−1 year−1 increases the total PLFA, bacterial PFLA, actinomycetes PFLA, G+ bacterial PFLA, and G bacterial PFLA contents. Moreover, compared with the other rates tested, the 150 kg ha−1 year−1 K fertilizer application rate had less stress on the soil microbial ecosystem and provided a more suitable environment for soil microorganism survival. Under the conditions of this specific study, yellow soils with moderate fertility require K fertilizer application rates of 150 kg ha−1 year−1 should therefore be adopted in potato cropping systems.

Author Contributions

Conceptualization, H.Z., H.X. and Z.W.; methodology, H.Z.; software, H.Z.; validation, H.Z., H.X. and G.H.; formal analysis, H.Z.; investigation, H.Z., H.X. and G.H.; writing—original draft preparation, H.Z.; writing—review and editing, H.Z., H.L., M.G. and Z.W.; visualization, H.Z.; supervision, M.G. and Z.W. All authors have read and agreed to the published version of the manuscript.

Funding

This study was supported by China Public Welfare Industry (Agriculture) Research Project (No. 201203013-5-2).

Institutional Review Board Statement

Not applicable.

Informed Consent Statement

Not applicable.

Data Availability Statement

The data will be provided upon request by the corresponding author.

Conflicts of Interest

The authors declare no conflict of interest.

Abbreviations

The following abbreviations are used in this manuscript:
KPotassium
PFLAPhospholipid fatty acid
BBacteria
FFungal
G+Gram-positive bacteria
GGram-negative bacteria
CRsPotato commodity rates
SYISystem sustainability

References

  1. Zörb, C.; Senbayram, M.; Peiter, E. Potassium in Agriculture—Status and Perspectives. J. Plant Physiol. 2014, 171, 656–669. [Google Scholar] [CrossRef] [PubMed]
  2. Torabian, S.; Farhangi-Abriz, S.; Qin, R.; Noulas, C.; Sathuvalli, V.; Charlton, B.; Loka, D.A. Potassium: A Vital Macronutrient in Potato Production—A Review. Agronomy 2021, 11, 543. [Google Scholar] [CrossRef]
  3. Huber, S.C. Biochemical Basis for Effects of K-Deficiency on Assimilate Export Rate and Accumulation of Soluble Sugars in Soybean Leaves. Plant Physiol. 1984, 76, 424–430. [Google Scholar] [CrossRef] [PubMed] [Green Version]
  4. Marschner, H.; Cakmak, I. High Light Intensity Enhances Chlorosis and Necrosis in Leaves of Zinc, Potassium, and Magnesium Deficient Bean (Phaseolus vulgaris) Plants. J. Plant Physiol. 1989, 134, 308–315. [Google Scholar] [CrossRef]
  5. Zheng, S.; Hu, J.; Jiang, X.; Ji, F.; Zhang, J.; Yu, Z.; Lin, X. Long-Term Fertilization Regimes Influence FAME Profiles of Microbial Communities in an Arable Sandy Loam Soil in Northern China. Pedobiologia 2013, 56, 179–183. [Google Scholar] [CrossRef]
  6. Römheld, V.; Kirkby, E.A. Research on Potassium in Agriculture: Needs and Prospects. Plant Soil 2010, 335, 155–180. [Google Scholar] [CrossRef]
  7. Smil, V. Crop Residues: Agriculture’s Largest Harvest. BioScience 1999, 49, 299–308. [Google Scholar] [CrossRef] [Green Version]
  8. Goulding, K.W.T.; Loveland, P.J. The Classification and Mapping of Potassium Reserves in Soils of England and Wales. J. Soil Sci. 1986, 37, 555–565. [Google Scholar] [CrossRef]
  9. Ali, A.M.; Awad, M.Y.M.; Hegab, S.A.; Gawad, A.M.A.E.; Eissa, M.A. Effect of Potassium Solubilizing Bacteria (Bacillus cereus) on Growth and Yield of Potato. J. Plant Nutr. 2020, 44, 411–420. [Google Scholar] [CrossRef]
  10. Awad, M.; Ali, A.M.; Hegab, S.A.; El Gawad, A.M.A. Organic Fertilization Affects Growth and Yield of Potato (Cara. Cv) Plants Grown on Sandy Clay Loam. Commun. Soil Sci. Plant Anal. 2022, 53, 688–698. [Google Scholar] [CrossRef]
  11. Kang, W.Q.; Fan, M.S.; Ma, Z.; Shi, X.H.; Zheng, H.L. Luxury Absorption of Potassium by Potato Plants. Am. J. Potato Res. 2014, 91, 573–578. [Google Scholar] [CrossRef]
  12. Allison, M.F.; Fowler, J.H.; Allen, E.J. Responses of Potato (Solanum tuberosum) to Potassium Fertilizers. J. Agric. Sci. 2001, 136, 407–426. [Google Scholar] [CrossRef] [Green Version]
  13. Karam, F.; Massaad, R.; Skaf, S.; Breidy, J.; Rouphael, Y. Potato Response to Potassium Application Rates and Timing under Semi-Arid Conditions. Adv. Hortic. Sci. 2011, 25, 265–268. [Google Scholar]
  14. Khan, M.Z.; Akhtar, M.E.; Mahmood-ul-Hassan, M.; Mahmood, M.M.; Safdar, M.N. Potato Tuber Yield and Quality as Affected by Rates and Sources of Potassium Fertilizer. J. Plant Nutr. 2012, 35, 664–677. [Google Scholar] [CrossRef]
  15. Li, S.T.; Duan, Y.; Guo, T.W.; Zhang, P.L.; He, P.; Johnston, A.; Shcherbakov, A. Potassium Management in Potato Production in Northwest Region of China. Field Crops 2015, 174, 48–54. [Google Scholar] [CrossRef]
  16. Zhao, H.; Gou, J.L.; Zhao, L.X.; Wu, Q.Y.; He, J.F.; Zhao, P.Y.; Wang, Z.Y.; Li, Z.L.; Xiao, H.J. Analysis on Status of Soil Potassium and the Effects of Potassium Fertilizer in Dryland Soil in Guizhou. J. Plant Nutr. Fertil. 2016, 22, 277–285. (In Chinese) [Google Scholar]
  17. Mokrani, K.; Hamdi, K.; Tarchoun, N. Potato (Solanum tuberosum L.) Response to Nitrogen, Phosphorus and Potassium Fertilization Rates. Commun. Soil Sci. Plant Anal. 2018, 49, 1314–1330. [Google Scholar] [CrossRef]
  18. Zhao, H.; Gou, J.L.; He, J.F.; Zhao, L.X.; Zhao, P.Y.; Xiao, H.J.; Wang, Z.Y.; Li, Z.L. Effects of Potassium Fertilizer on Dry Matter Accumulation, Potassium Absorption and Utilization Efficiency of Potato. Southwest China J. Agric. Sci. 2015, 28, 644–649. (In Chinese) [Google Scholar]
  19. Myvan, F.F.; Jami Al-Ahmadi, M.J.; Eslami, S.V.; Noferest, K.S. Role of Potassium in Modifying the Potato Physiological Responses to Irrigation Regimes Under Different Planting Patterns. Potato Res. 2022, 1–22. [Google Scholar] [CrossRef]
  20. Jing, X.; Sanders, N.J.; Shi, Y.; Chu, H.Y.; Classen, A.T.; Zhao, K.; Chen, L.T.; Shi, Y.; Jiang, Y.X.; He, J.S. The Links between Ecosystem Multifunctionality and Above- and Belowground Biodiversity Are Mediated by Climate. Nat. Commun. 2015, 6, 8159. [Google Scholar] [CrossRef]
  21. Delgado-Baquerizo, M.; Maestre, F.T.; Reich, P.B.; Jeffries, T.C.; Gaitan, J.J.; Encinar, D.; Berdugo, M.; Campbell, C.D.; Singh, B.K. Microbial Diversity Drives Multifunctionality in Terrestrial Ecosystems. Nat. Commun. 2016, 7, 10541. [Google Scholar] [CrossRef] [Green Version]
  22. Montalba, R.; Arriagada, C.; Alvear, M.; Zúñiga, G.E. Effects of Conventional and Organic Nitrogen Fertilizers on Soil Microbial Activity, Mycorrhizal Colonization, Leaf Antioxidant Content, and Fusarium Wilt in Highbush Blueberry (Vaccinium corymbosum L.). Sci. Hortic. 2010, 125, 775–778. [Google Scholar] [CrossRef]
  23. Pan, Y.; Cassman, N.; de Hollander, M.; Mendes, L.W.; Korevaar, H.; Geerts, R.H.E.M.; van Veen, J.A.; Kuramae, E.E. Impact of Long-Term N, P, K, and NPK Fertilization on the Composition and Potential Functions of the Bacterial Community in Grassland Soil. FEMS Microbiol. Ecol. 2014, 90, 195–205. [Google Scholar] [CrossRef] [PubMed]
  24. Zarraonaindia, I.; Martínez-Goñi, X.S.; Liñero, O.; Muñoz-Colmenero, M.; Aguirre, M.; Abad, D.; Baroja-Careaga, I.; de Diego, A.; Gilbert, J.A.; Estonba, A. Response of Horticultural Soil Microbiota to Different Fertilization Practices. Plants 2020, 9, 1501. [Google Scholar] [CrossRef] [PubMed]
  25. Li, R.; Khafipour, E.; Krause, D.O.; Entz, M.H.; de Kievit, T.R.; Fernando, W.G.D. Pyrosequencing Reveals the Influence of Organic and Conventional Farming Systems on Bacterial Communities. PLoS ONE 2012, 7, e51897. [Google Scholar] [CrossRef] [Green Version]
  26. Fierer, N.; Leff, J.W.; Adams, B.J.; Nielsen, U.N.; Bates, S.T.; Lauber, C.L.; Owens, S.; Gilbert, J.A.; Wall, D.H.; Caporaso, J.G. Cross-Biome Metagenomic Analyses of Soil Microbial Communities and Their Functional Attributes. Proc. Natl. Acad. Sci. USA 2012, 109, 21390–21395. [Google Scholar] [CrossRef] [Green Version]
  27. Allard, S.M.; Walsh, C.S.; Wallis, A.E.; Ottesen, A.R.; Brown, E.W.; Micallef, S.A. Solanum lycopersicum (Tomato) Hosts Robust Phyllosphere and Rhizosphere Bacterial Communities When Grown in Soil Amended with Various Organic and Synthetic Fertilizers. Sci. Total Environ. 2016, 573, 555–563. [Google Scholar] [CrossRef] [Green Version]
  28. Deng, Z.P.; Yang, J.; Chen, Y.Y.; Han, H.H.; Liu, X.; Yi, X.P.; Wang, J.C.; Lyu, C.W. Screening High Potassium Efficiency Potato Genotypes and Physiological Responses at Different Potassium Levels. Not. Bot. Horti. Agrobot. 2021, 49, 12190. [Google Scholar] [CrossRef]
  29. He, P.; Yang, L.P.; Xu, X.P.; Zhao, S.C.; Chen, F.; Li, S.T.; Tu, S.H.; Jin, J.Y.; Johnston, A.M. Temporal and Spatial Variation of Soil Available Potassium in China (1990–2012). Field Crops Res. 2015, 173, 49–56. [Google Scholar] [CrossRef]
  30. Söderberg, K.H.; Probanza, A.; Jumpponen, A.; Bååth, E. The Microbial Community in the Rhizosphere Determined by Community-Level Physiological Profiles (CLPP) and Direct Soil– and Cfu–PLFA Techniques. Appl. Soil Ecol. 2004, 25, 135–145. [Google Scholar] [CrossRef]
  31. Zhao, Z.W.; Ge, T.D.; Gunina, A.; Li, Y.H.; Zhu, Z.K.; Peng, P.Q.; Wu, J.S.; Kuzyakov, Y. Carbon and Nitrogen Availability in Paddy Soil Affects Rice Photosynthate Allocation, Microbial Community Composition, and Priming: Combining Continuous C-13 Labeling with PLFA Analysis. Plant Soil 2019, 445, 137–152. [Google Scholar] [CrossRef]
  32. Bligh, E.G.; Dyer, W.J. A Rapid Method of Total Lipid Extraction and Purification. Can. J. Biochem. Physiol. 1959, 37, 911–917. [Google Scholar] [CrossRef] [PubMed]
  33. Janus, L.R.; Angeloni, N.L.; McCormack, J.; Rier, S.T.; Tuchman, N.C.; Kelly, J.J. Elevated Atmospheric CO2 Alters Soil Microbial Communities Associated with Trembling Aspen (Populus tremuloides) Roots. Microb. Ecol. 2005, 50, 102–109. [Google Scholar] [CrossRef] [Green Version]
  34. McKinley, V.L.; Peacock, A.D.; White, D.C. Microbial Community PLFA and PHB Responses to Ecosystem Restoration in Tallgrass Prairie Soils. Soil Biol. Biochem. 2005, 37, 1946–1958. [Google Scholar] [CrossRef]
  35. Strickland, M.S.; Rousk, J. Considering Fungal: Bacterial Dominance in Soils—Methods, Controls, and Ecosystem Implications. Soil Biol. Biochem. 2010, 42, 1385–1395. [Google Scholar] [CrossRef]
  36. Liu, Z.; Sun, K.; Liu, W.T.; Gao, T.P.; Li, G.; Han, H.F.; Li, Z.J.; Ning, T.Y. Responses of Soil Carbon, Nitrogen, and Wheat and Maize Productivity to 10 Years of Decreased Nitrogen Fertilizer under Contrasting Tillage Systems. Soil Tillage Res. 2020, 196, 104444. [Google Scholar] [CrossRef]
  37. Tang, Z.H.; Zhang, A.J.; Wei, M.; Chen, X.G.; Liu, Z.H.; Li, H.M.; Ding, Y.F. Physiological Response to Potassium Deficiency in Three Sweet Potato (Ipomoea batatas [L.] Lam.) Genotypes Differing in Potassium Utilization Efficiency. Acta Physiol. Plant. 2015, 37, 184. [Google Scholar] [CrossRef]
  38. Kassim, A.M.; Nawar, S.; Mouazen, A.M. Potential of On-the-Go Gamma-Ray Spectrometry for Estimation and Management of Soil Potassium Site Specifically. Sustainability 2021, 13, 661. [Google Scholar] [CrossRef]
  39. Zhang, W.; Liu, X.W.; Wang, Q.L.; Zhang, H.Q.; Li, M.F.; Song, B.T.; Zhao, Z.Q. Effects of Potassium Fertilization on Potato Starch Physicochemical Properties. Int. J. Biol. Macromol. 2018, 117, 467–472. [Google Scholar] [CrossRef]
  40. Heenan, D.P.; Campbell, L.C. Influence of Potassium and Manganese on Growth and Uptake of Magnesium by Soybeans (Glycine max (L.) Merr. Cv. Bragg). Plant Soil 1981, 61, 447–456. [Google Scholar] [CrossRef]
  41. Seggewiss, B.; Jungk, A. Einfluss der Kaliumdynamik im wurzelnahen Boden auf die Magnesiumaufnahme von Pflanzen. Z. Pflanzenernaehr. Bodenk 1988, 151, 91–96. [Google Scholar] [CrossRef]
  42. Westermann, D.T.; James, D.W.; Tindall, T.A.; Hurst, R.L. Nitrogen and Potassium Fertilization of Potatoes: Sugars and Starch. Am. Potato J. 1994, 71, 433–453. [Google Scholar] [CrossRef]
  43. Drenovsky, R.E.; Vo, D.; Graham, K.J.; Scow, K.M. Soil Water Content and Organic Carbon Availability Are Major Determinants of Soil Microbial Community Composition. Microb. Ecol. 2004, 48, 424–430. [Google Scholar] [CrossRef] [PubMed]
  44. Dong, W.Y.; Zhang, X.Y.; Dai, X.Q.; Fu, X.L.; Yang, F.T.; Liu, X.Y.; Sun, X.M.; Wen, X.F.; Schaeffer, S. Changes in Soil Microbial Community Composition in Response to Fertilization of Paddy Soils in Subtropical China. Appl. Soil Ecol. 2014, 84, 140–147. [Google Scholar] [CrossRef]
  45. Sheng, X.F.; He, L.Y.; Huang, W.Y. The Conditions of Releasing Potassium by a Silicate Dissolving Bacterial Strain NBT. Agric. Sci. China 2002, 1, 662–666. (In Chinese) [Google Scholar]
  46. Han, H.S.; Supanjani; Lee, K.D. Effect of Co-Inoculation with Phosphate and Potassium Solubilizing Bacteria on Mineral Uptake and Growth of Pepper and Cucumber. Plant Soil Environ. 2006, 7, 130–136. [Google Scholar]
  47. Basak, B.B.; Biswas, D.R. Influence of Potassium Solubilizing Microorganism (Bacillus mucilaginosus) and Waste Mica on Potassium Uptake Dynamics by Sudan Grass (Sorghum vulgare Pers.) Grown under Two Alfisols. Plant Soil 2009, 317, 235–255. [Google Scholar] [CrossRef]
  48. Abou-el-Seoud, I.I.; Abdel-Megeed, A. Impact of Rock Materials and Biofertilizations on P and K Availability for Maize (Zea Maize) under Calcareous Soil Conditions. Saudi J. Biol. Sci. 2012, 19, 55–63. [Google Scholar] [CrossRef] [Green Version]
  49. Pushkareva, E.; Sommer, V.; Barrantes, I.; Karsten, U. Diversity of Microorganisms in Biocrusts Surrounding Highly Saline Potash Tailing Piles in Germany. Microorganisms 2021, 9, 714. [Google Scholar] [CrossRef]
  50. Frey, S.D.; Six, J.; Elliott, E.T. Reciprocal Transfer of Carbon and Nitrogen by Decomposer Fungi at the Soil–Litter Interface. Soil Biol. Biochem. 2003, 35, 1001–1004. [Google Scholar] [CrossRef]
  51. Kloepper, J.W.; Schroth, M.N.; Miller, T.D. Effects of Rhizosphere Colonization by Plant Growth Promoting Rhizobacteria on Potato Plant Development and Yield. Ecol. Epidemiol. 1980, 70, 1078–1082. [Google Scholar] [CrossRef]
  52. Zaeem, M.; Nadeem, M.; Pham, T.H.; Ashiq, W.; Ali, W.; Gilani, S.S.M.; Elavarthi, S.; Kavanagh, V.; Cheema, M.; Galagedara, L.; et al. The Potential of Corn-Soybean Intercropping to Improve the Soil Health Status and Biomass Production in Cool Climate Boreal Ecosystems. Sci. Rep. 2019, 9, 13148. [Google Scholar] [CrossRef] [PubMed] [Green Version]
  53. De Vries, F.T.; Hoffland, E.; van Eekeren, N.; Brussaard, L.; Bloem, J. Fungal/Bacterial Ratios in Grasslands with Contrasting Nitrogen Management. Soil Biol. Biochem. 2006, 38, 2092–2103. [Google Scholar] [CrossRef] [Green Version]
  54. Ibekwe, A.M.; Kennedy, A.C.; Frohne, P.S.; Papiernik, S.K.; Crowley, D.E. Microbial Diversity along a Transect of Agronomic Zones. FEMS Microbiol. Ecol. 2002, 39, 183–191. [Google Scholar] [CrossRef] [PubMed]
  55. Kieft, T.L.; Ringelberg, D.B.; White, D.C. Changes in Ester-Linked Phospholipid Fatty Acid Profiles of Subsurface Bacteria during Starvation and Desiccation in a Porous Medium. Appl. Environ. Microbiol. 1994, 60, 3292–3299. [Google Scholar] [CrossRef] [PubMed] [Green Version]
  56. Shi, P.; Wang, S.P.; Jia, S.G.; Gao, Q. Effect of 25-Year Fertilization on Soil Microbial Biomass and Community Structure in a Continuous Corn Cropping System. Arch. Agron. Soil Sci. 2015, 61, 1303–1317. [Google Scholar] [CrossRef]
  57. Wei, M.; Hu, G.Q.; Wang, H.; Bai, E.; Lou, Y.H.; Zhang, A.J.; Zhuge, Y.P. 35 Years of Manure and Chemical Fertilizer Application Alters Soil Microbial Community Composition in a Fluvo-Aquic Soil in Northern China. Eur. J. Soil Biol. 2017, 82, 27–34. [Google Scholar] [CrossRef]
  58. Soares, P.R.; Pato, R.L.; Dias, S.; Santos, D. Effects of Grazing Indigenous Laying Hens on Soil Properties: Benefits and Challenges to Achieving Soil Fertility. Sustainability 2022, 14, 3407. [Google Scholar] [CrossRef]
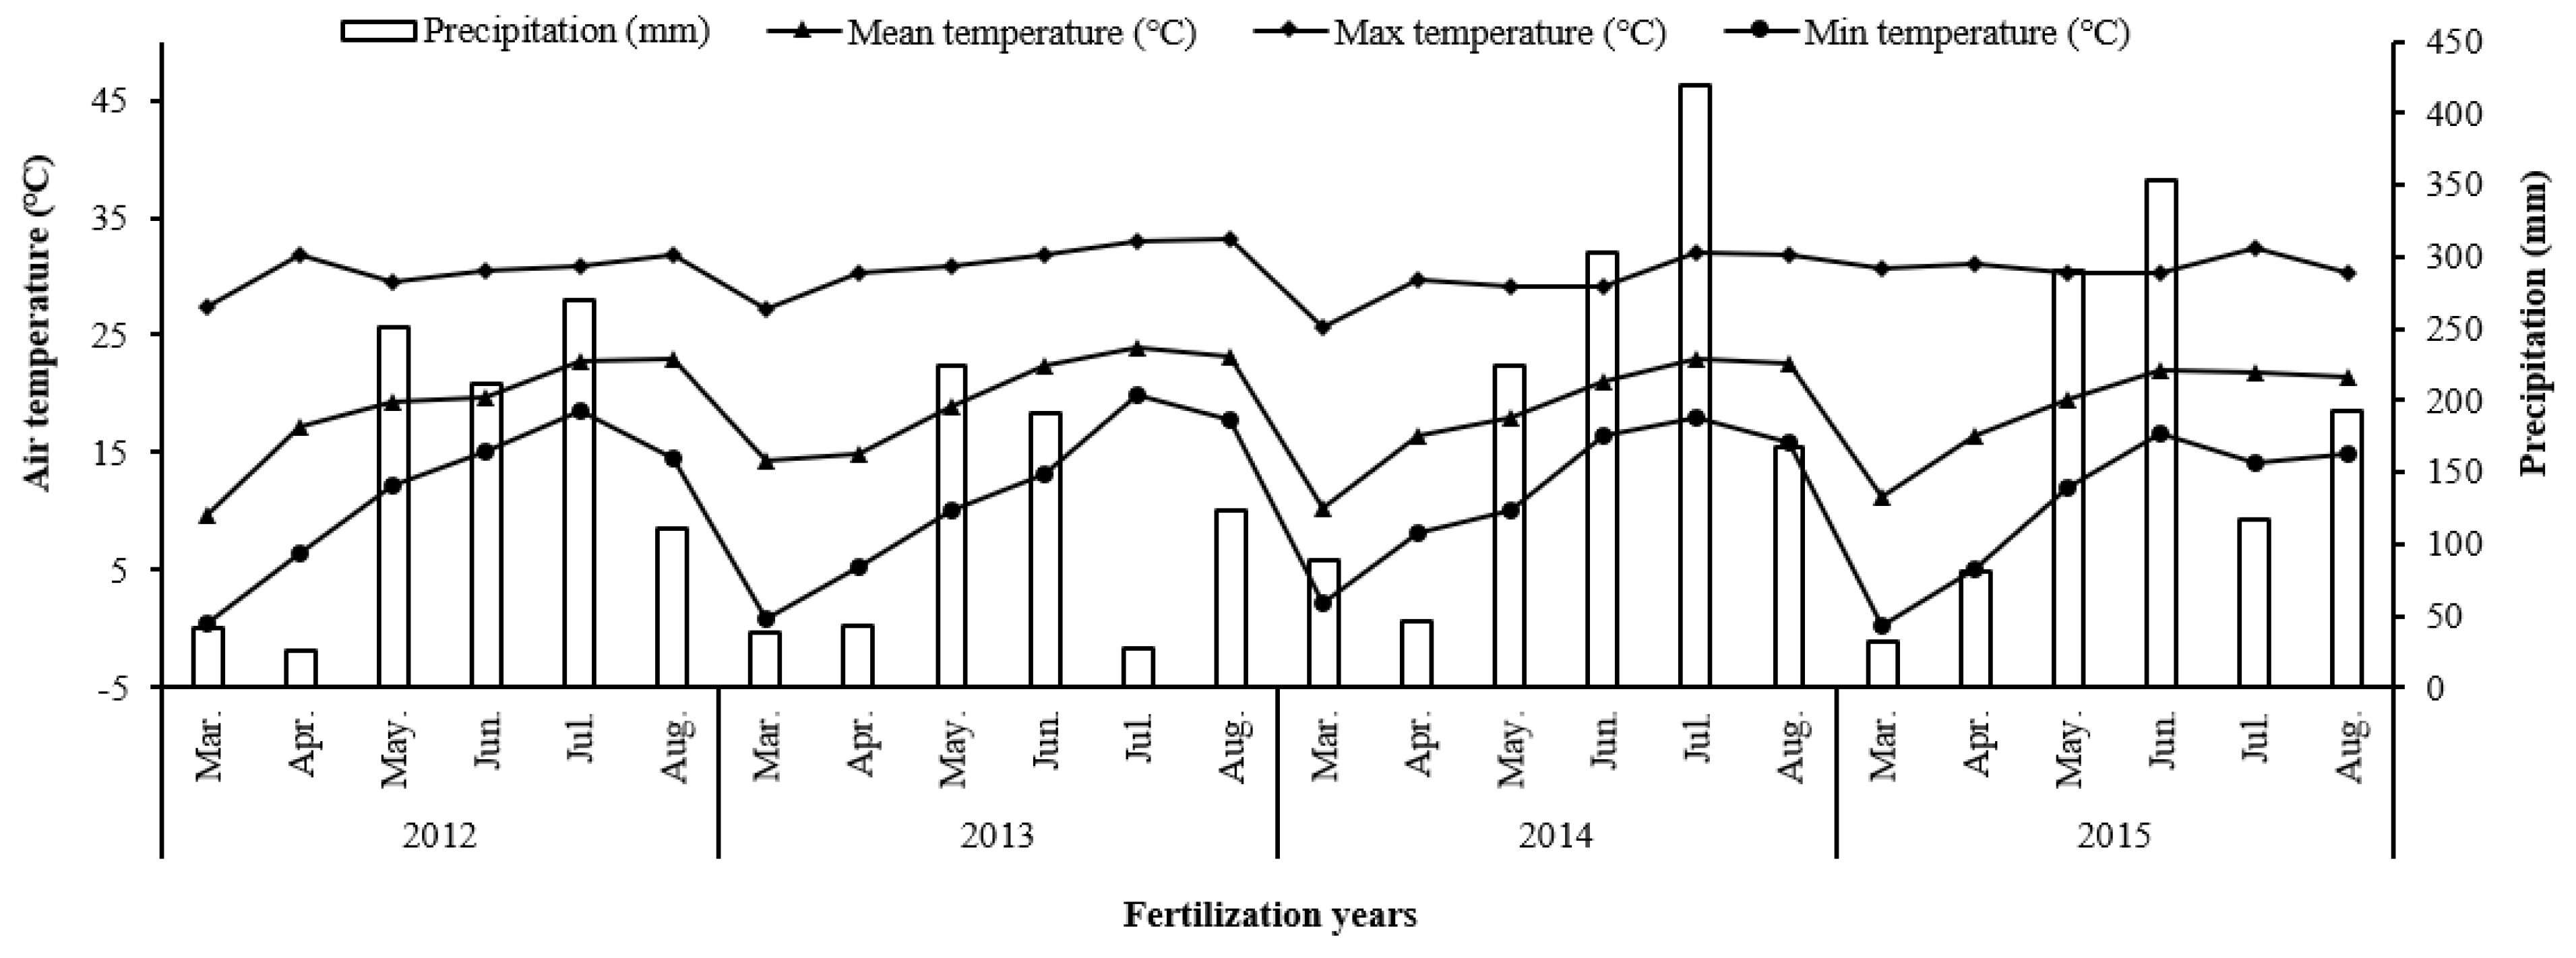
Figure 1. Rainfall and air temperature for each month during the study period (2012–2015).
Sustainability 14 06579 g001
Figure 2. Dynamics and mean values of potato yield and the CRs of potato tubers under different K application rates during 2012−2015. (a), Annual yield of potato. (b) Mean yield of potato across all 4 years. (c) Annual CRs of potato tubers. (d) Mean CR of potato tubers across all 4 years. (e) SYI of potato. The error bars illustrate the standard deviations of the averages (n = 12). Control, low−K, medium−K, and high−K represent K fertilizer rates of 0, 75, 150, and 225 kg K ha−1 year−1, respectively. These letters (a, b, c, d) above the columns represent significant differences (p < 0.05) among the different fertilization treatments. The same below unless stated otherwise.
Sustainability 14 06579 g002
Figure 3. Relationships of among potato yield, CRs, and soil microbial PLFAs (n = 3). * stands for p < 0.05. ** stands for p < 0.01.
Sustainability 14 06579 g003
Figure 4. Changes in the contents of bacterial PFLAs (a), fungal PLFAs (b), actinomycete PFLAs (c), G+ bacterial PFLAs (d), and G bacterial PFLAs (e) under different K application rates. The error bars illustrate the standard deviations of the averages (n = 3).
Sustainability 14 06579 g004
Figure 5. PCA of the soil microbial community PLFAs under different K application rates. A total of 24 PLFAs of species were evaluated. Control, low-K, medium-K, and high-K represent K fertilizer rates of 0, 75, 150, and 225 kg K ha−1 year−1, respectively.
Sustainability 14 06579 g005
Figure 6. Changes in (a) F/B PLFA (F) and (b) G+/G PLFA (G) ratios under different K application rates. The error bars illustrate the standard deviations of the averages (n = 3).
Sustainability 14 06579 g006
Table 1. Contents and compositions of soil microbial PLFAs (nmol g−1).
PLFA BiomarkerControlLow-KMedium-KHigh-K
14:00.12 ± 0.02 b0.17 ± 0.04 a0.18 ± 0.02 a0.13 ± 0.01 b
16:02.17 ± 0.22 bc2.08 ± 0.23 c2.49 ± 0.06 a2.39 ± 0.03 ab
18:00.65 ± 0.08 a0.72 ± 0.11 a0.71 ± 0.01 a0.67 ± 0.02 a
20:00.07 ± 0.00 b0.09 ± 0.01 a0.09 ± 0.00 a0.08 ± 0.00 ab
i14:00.11 ± 0.01 b0.10 ± 0.02 b0.15 ± 0.00 a0.11 ± 0.00 b
a15:00.70 ± 0.03 c0.88 ± 0.12 ab0.94 ± 0.04 a0.79 ± 0.04 bc
i15:01.77 ± 0.09 a1.43 ± 0.17 b1.77 ± 0.18 a1.69 ± 0.05 a
i15:1 G0.09 ± 0.01 c0.14 ± 0.02 a0.12 ± 0.00 ab0.11 ± 0.01 bc
i16:01.02 ± 0.05 b1.19 ± 0.17 a1.28 ± 0.05 a1.18 ± 0.02 ab
16:1 2OH1.24 ± 0.10 ab1.14 ± 0.10 b1.41 ± 0.22 a1.20 ± 0.04 ab
i16:1 G0.15± 0.00 a0.17 ± 0.02 andnd
16:1 w5c0.31 ± 0.00 ab0.25 ± 0.06 b0.33 ± 0.03 a0.32 ± 0.03 a
16:1 w9c0.10 ± 0.01 b0.17 ± 0.01 a0.16 ± 0.02 a0.10 ± 0.01 b
10Me17:00.32 ± 0.01 a0.30 ± 0.04 a0.32 ± 0.02 a0.30 ± 0.00 a
a17:00.52 ± 0.00 a0.45 ± 0.03 b0.56 ± 0.04 a0.52 ± 0.05 a
cy17:00.68 ± 0.02 a0.54 ± 0.03 c0.65 ± 0.01 ab0.62 ± 0.02 b
i17:00.96 ± 0.02 c1.11 ± 0.01 b1.20 ± 0.04 a1.11 ± 0.01 b
17:1w8c0.12 ± 0.01 a0.10 ± 0.00 b0.11 ± 0.01 ab0.12 ± 0.00 a
10Me18:00.58 ± 0.14 b0.54 ± 0.03 b0.74 ± 0.06 a0.51 ± 0.01 b
i18:00.09 ± 0.01 a0.07 ± 0.00 a0.08 ± 0.01 a0.07 ± 0.01 a
11Me18:1w7c0.04 ± 0.01 d0.07 ± 0.00 b0.06 ± 0.00 c0.09 ± 0.00 a
18:1 w9c1.10 ± 0.05 a0.84 ± 0.04 c1.12 ± 0.04 a0.99 ± 0.02 b
cy19:0w8c1.16 ± 0.07 b0.98 ± 0.04 c1.27 ± 0.03 a0.98 ± 0.04 c
i19:00.07 ± 0.01 and0.08 ± 0.00 a0.07 ± 0.00 a
Total PLFA14.13 ± 0.56 b13.54 ± 0.70 b15.82 ± 0.06 a14.17 ± 0.05 b
Control, low-K, medium-K, and high-K represent K fertilizer rates of 0, 75, 150, and 225 kg K ha−1 year−1, respectively. nd stands for not detected. Lowercase letters in the same column represent significant differences across fertilization treatments (p < 0.05). The same below unless stated otherwise.
Publisher’s Note: MDPI stays neutral with regard to jurisdictional claims in published maps and institutional affiliations.