Article

Time History Method of Three-Dimensional Dynamic Stability Analysis for High Earth-Rockfill Dam and Its Application

1
School of Water Conservancy Engineering, Zhengzhou University, Zhengzhou 450001, China
2
State Key Laboratory of Coastal and Offshore Engineering, Dalian University of Technology, Dalian 116024, China
3
Faculty of Infrastructure Engineering, School of Hydraulic Engineering, Dalian University of Technology, Dalian 116024, China
4
CCCC Investment Nanjing Co., Ltd., Nanjing 211899, China
*
Author to whom correspondence should be addressed.
Sustainability 2022, 14(11), 6671; https://doi.org/10.3390/su14116671
Submission received: 9 April 2022 / Revised: 26 May 2022 / Accepted: 26 May 2022 / Published: 30 May 2022
(This article belongs to the Special Issue Civil and Hydraulic Engineering Safety)

Abstract

:
Accurately grasping the stability characteristics of high earth-rockfill dam slopes is the key to the seismic safety evaluation of dams. In this research, the development and application of the common methods for slope stability analysis are reviewed firstly. Then, a three-dimensional dynamic time history stability analysis method is presented, and corresponding software is developed based on the sliding surface finite element stress method combined with the three-dimensional finite element dynamic response. This method makes the three-dimensional dynamic stability analysis efficient, and the effectiveness of this software is verified. Finally, the two-dimensional (2D) and three-dimensional (3D) dynamic stability analyses of a high concrete face dam are carried out, and the stability of the dam’s downstream slope under seismic load is studied. The results indicate that there are many differences between the results of the traditional 2D and 3D stability analyses. The time history of the safety factor, local safety behavior, overall shape and spatial position of the potential sliding body, and even the sliding process of failure can be captured with 3D stability analysis.

1. Introduction

Hydropower plays an important role in achieving sustainable development. In China, earth-rockfill dams have been the most widely used in hydropower projects because of the local material availability and good foundation adaptability [1]. With the development of construction machinery and geotechnical calculation methods, great achievements have been made in the construction of high earth-rockfill dams. According to incomplete statistics, 84 high earth-rockfill dams with a dam height of over 100 m have been built in China, including 68 concrete-faced dams, 15 earth-core rockfill dams and 1 asphalt concrete-core rockfill dam by the end of 2015 [2]. In recent years, an increasing amount of high earth-rockfill dams are planned and constructed in southwest China, within complex geological conditions, due to the easy material acquisition, convenient construction and the low requirements for the foundation condition [3]. The dam heights of Gushui, Lianghekou and Shuangjiangkou areplanned to be 243, 293 and 312 m, respectively. However, strong earthquakes are often aroused in this region, and great attention should be paid to the seismic safety of these high dams [4]. In the event of strong earthquake accidents and secondary disasters, the outcomes will be extremely severe for these high dams and reservoirs; it can be observed that the disasters of earth-rockfill dams mainly include landslides, seismic subsidence and horizontal permanent deformation, etc. based on the analysis of Zipingpu and other earth rock dam disasters [3]. In addition, the seismic stability evaluation of a slope is particularly important; dam slope stability is the main control index for the ultimate seismic capacity analysis of earth-rockfill dams [5]. Therefore, the analysis method and technology of dam slope stability are very important for the seismic safety evaluation of dams. At present, great progress has been made in the stability of dams, but earth-rockfill dams are mostly built using local soil. There are great differences between earth-rockfill dams and concrete dams in terms of building materials and foundation requirements. It is distinct in the location of failure and failure mode of stability. A concrete dam is mainly supported by the reaction of bedrock. Stability failure in concrete dams is like a kind of sliding failure between two rigid bodies which encourages the failure of the engineering directly. On the other hand, the stability of earth-rockfill dams mainly depend on the friction between soil particles. Dam slope failure is mainly a local stability problem where the dam slides through the soil body. Moreover, the safety of concrete gravity dams is relatively high, whereas the safety of earth-rockfill dams is relatively poor [6].
Many methods have been developed for dam slope stability analysis. The limit equilibrium method is often adopted. This method has a complete theoretical basis, convenient calculation, is intuitive and it is easy to accept the obtained safety factor. The basic principles applied to the potential sliding surface are a force equilibrium condition and soil strength criterion based on Mohr–Coulomb theory. In popular numerical analyses, most are based on the general slice method for studying limit equilibrium, the soil is often divided into several soil strips according to a certain method, and then the force balance equation is established, and the stability safety factor of the slope is calculated based on the assumed potential sliding surface [7]. It makes the whole analysis process simple and fast, and is adopted by most specifications. However, the traditional limit equilibrium methods, especially the slice method, cannot reflect the development process of the stress and strain of soil as it fails to take into account the deformed characteristics of soils which limits its application in dynamic stability [8]. Fernando [9] helps to select the appropriate minimum safety design factor through limit equilibrium calculation for tailings dams slope stability analysis. Suggestions for the selection of a minimum safety factor are put forward. This method has extensive experience and engineering application in high-level dams of 100 m, but this is not the case for high-level dams of 300 m. It has a complete theoretical basis, convenient calculation and an intuitive and acceptable safety coefficient which has been greatly developed in academic research and engineering application. However, due to ignoring the fact that the soil itself is a deformed body, the traditional limit equilibrium method cannot reflect the development process of stress and strain in the process of failure, which limits its application in dynamic stability to a certain extent. The finite element strength reduction method is developed to overcome this defect of the limit equilibrium method [10]. The stress-strain state and development process of soil in the potential slipping range is considered in finite element strength reduction analysis. This method defines the safety factor as the reduction factor F divided by the cohesion c and internal friction angle φ. During numerical analysis, the load is kept unchanged, but c and φ are divided by F at the same time. The final safety factor is determined according to the default criterion which is not easy to be confirmed. In addition, some special skills should be used when conducting dynamic stability analysis because of the high complexity of this method. Chen [11] proposed slope stability analysis based on dynamic and an overall strength reduction method by determining the local damaged area. Guo [12] proposed a dynamic method to determine the sliding surface and safety factor based on the change characteristics of PGA at monitoring points. Moreover, the three-dimensional strength reduction analysis is almost impossible to be carried out; most of the existing research results focus on the discussion of slope partition and slope shape [13].
The finite element sliding surface stress method is also in the scheme of the limit equilibrium method. It not only has the advantages of the limit equilibrium method but also can reflect and consider the development process of the stress-strain state in a potential sliding surface [14]. It has the characteristics of a true and accurate stress field and a clear physical meaning of safety factor. In addition, it is suitable for dynamic stability analysis especially. The stress and strain of each element are adopted when using the finite element numerical method to determine the critical sliding surface and the corresponding safety factor. It has been gradually applied to slope stability analysis [15]. In addition, many techniques and methods have been developed for searching sliding surfaces. Donald [16] proposed the CRISS method, which gradually searches for the minimum value from the finite element stress at the top of the slope downward from the higher point, thus connecting it into a through-through sliding surface. Wu [17] used the Separation Mode Joint Search Method to find the critical sliding surface. Li [18] proposed a method for determining the potential sliding surface of a slope foundation based on maximum shear strain increment. Lin et al. [19] carried out a stress analysis of a slope with the finite element method, calculated the stability coefficient of the possible sliding surface, and searched for the most dangerous sliding surface using genetic algorithm. Some scholars use the intelligent search method to search the sliding surface. Gao [20,21] used the ant colony algorithm to search the dangerous sliding surface and introduced the encounter ant colony algorithm and reward and punishment ant colony algorithm to improve the search efficiency. However, there are significant defects in the application of the artificial intelligence algorithm in geotechnical engineering safety analysis, which is that there is not enough reliable supporting data, and there is great variability in geotechnical engineering [22]. Guo [23,24,25] proposed a calculation method based on vector sum theory for the relationship between the overall sliding direction of the sliding surface and the sliding direction of a point on the sliding surface, and introduced dynamic time history and three-dimensional calculation, respectively [26].
The finite element sliding surface stress method is often used for high slopes, but it is not fully applicable for high earth-rockfill dams [4]. High earth-rockfill dams are mostly built into high mountains and valleys, and the building material is artificial which is not identical to natural high slopes [27,28]. If local instability, which is popular in this type of dam slope and cannot be controlled, is present the overall destabilization and destruction of the earth-rockfill dam may be aroused. In addition, earth-rockfill dams are huge in size. Therefore, it is difficult to evaluate the local stability behavior of a dam slope. In addition, the dynamic response behavior is very complicated for dams because of the effects of valley and foundation. Moreover, the size of the high earth-rockfill dam is huge and many dams which sustained damage caused by the Wenchuan earthquake exerted failure mode with obvious three-dimensional characteristics [29]. These conditions make three-dimensional dynamic stability analysis for high earth-rockfill dams very difficult. Some advanced and specific techniques should be developed and implemented. In this paper, the slope seismic stability analyses of high earth-rockfill dams are discussed and analyzed. An efficient analysis method and software for three-dimensional dynamic stability are presented and developed in this paper based on the finite element sliding surface stress method. In addition, the reliability of the calculation method and the software is verified by an existing example. Finally, the three-dimensional sliding rule of the dam slope is studied and compared with the two-dimensional stability results using the dynamic stability analysis of the downstream dam slope of a high concrete face dam.

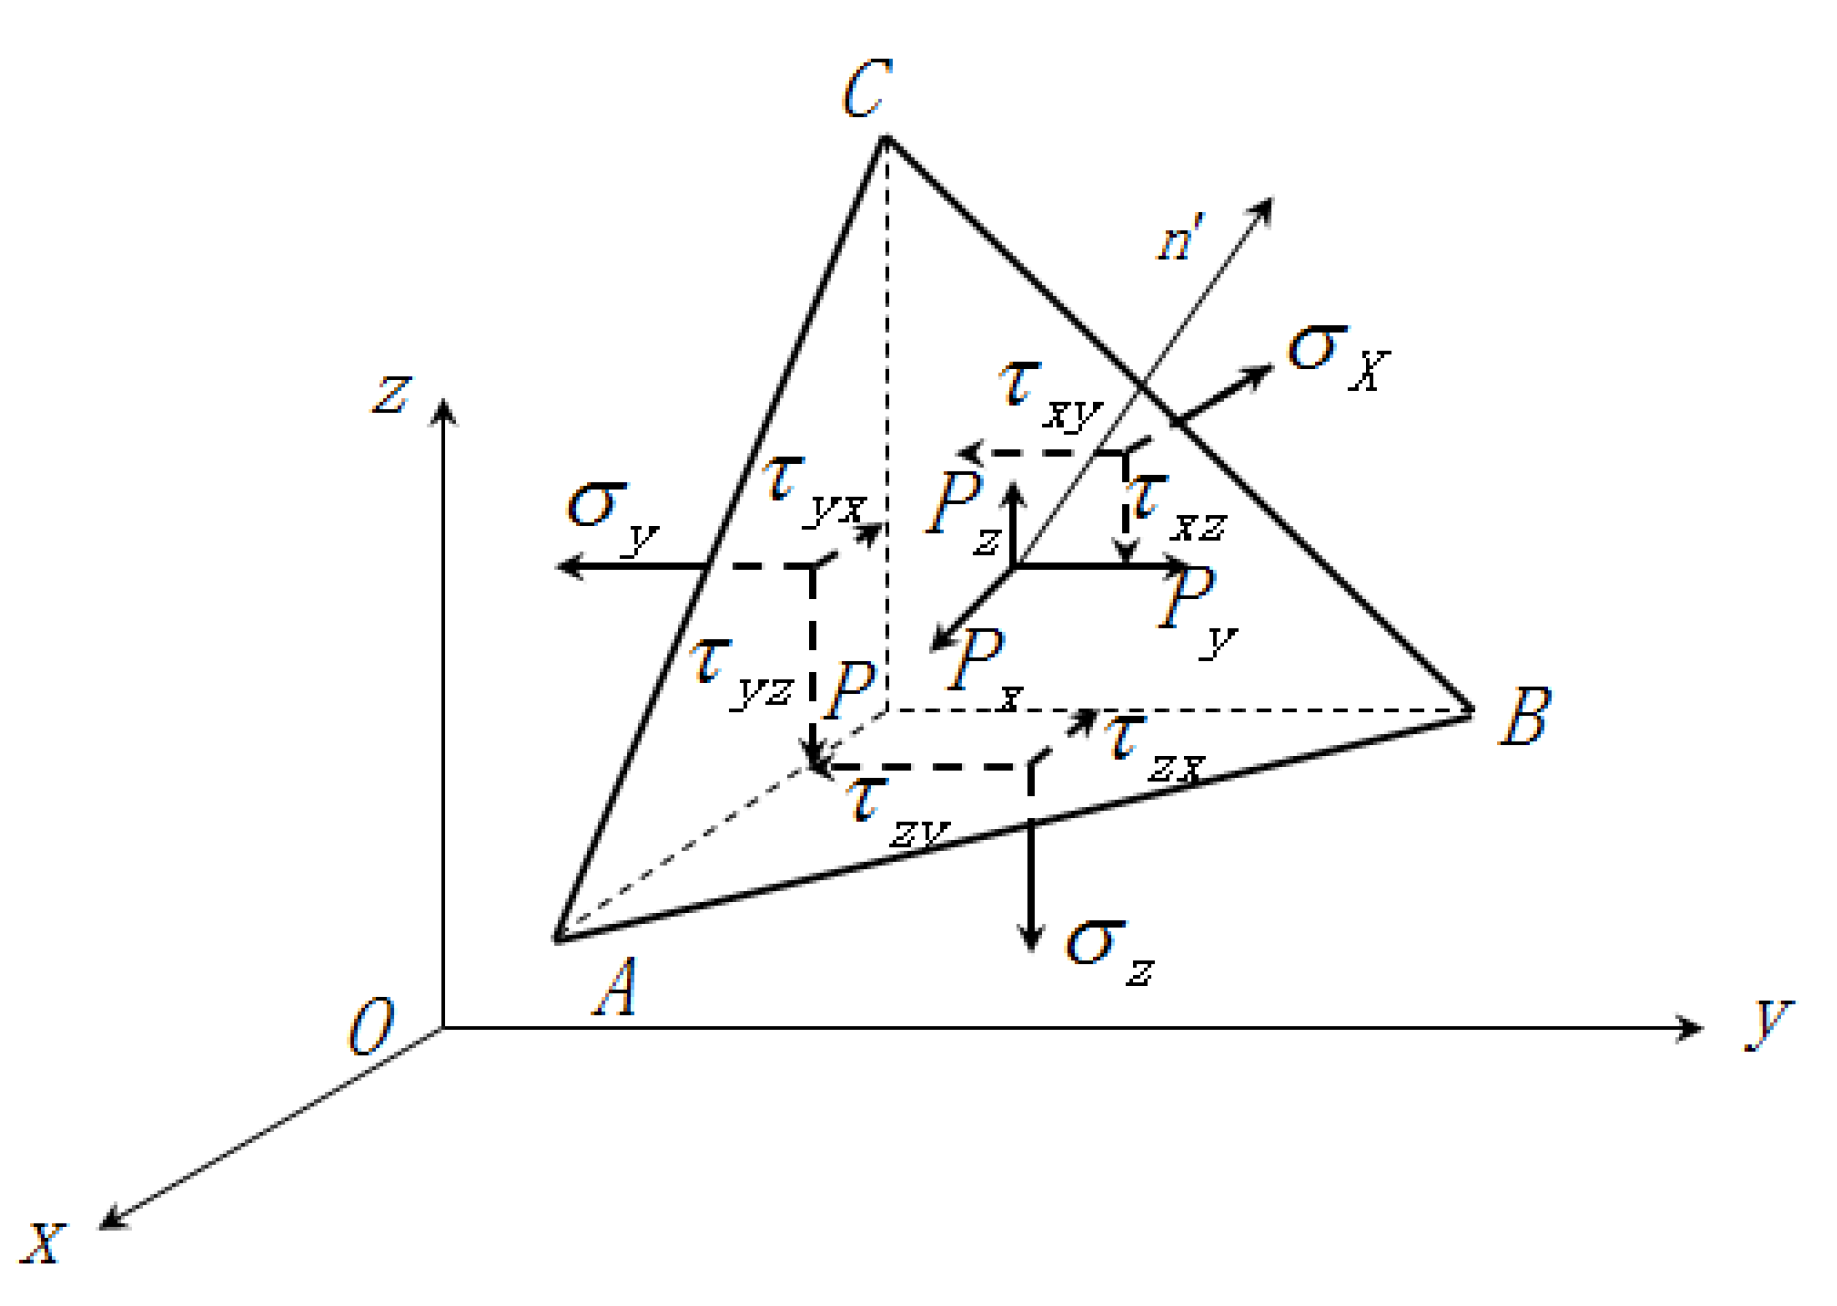
2. Finite Element Sliding Surface Stress Method

The finite element sliding surface stress method combines the basic principles of the finite element calculation and the limit equilibrium method. Firstly, the true stress state of the sliding surface is calculated based on the finite element calculation, and then the safety factor of the potential sliding surface is calculated based on the search method. Early researchers calculated the safety factor based on the stress distribution obtained by the linear elastic finite element method, and the results were close to the limit equilibrium method. Li [30] studied the differences between the safety coefficient and the failure mechanism of spatially variable undrained soil slope using the finite element method, finite difference method and limit equilibrium method.
An important research subject of the sliding surface stress method is how to convert the finite element results into a safety factor which can reflect the stability of a soil slope. In two-dimensional analysis, there are mainly three definitions of safety factor:
Kulhawy [31] proposed a definition method based on shear stress:
F = ( c + σ tan φ ) Δ l τ Δ l
Zienkiewicz et al. [32] proposed a definition method based on stress level:
F = Δ l [ ( σ 1 σ 2 ) ( σ 1 σ 3 ) f Δ l ]
Donald and Tan [33] proposed a definition method to define the weighted stress level strength:
F = ( c + σ tan φ ) Δ l [ ( σ 1 σ 3 ) ( σ 1 σ 3 ) f ( c + σ tan φ ) Δ l ]
where c is cohesion; φ is the angle of internal friction; Δl is the length of a section on the sliding surface; σ is the normal stress at a point on the sliding surface. τ is tangential stress at a point on the sliding surface; ( σ 1 σ 3 ) ( σ 1 σ 3 ) f is the stress level of a point on the sliding surface.
Although these three definition methods have different forms, they all reflect the strength reserve of soil slopes. Shao [34] proved that the physical meaning of the safety factor defined in Equation (1) is consistent with the slice method. The two-dimensional length can be expanded into a three-dimensional area, and the three-dimensional safety factor can be defined as shown in Equation (4) based on Equation (1).
F = ( c + σ tan φ ) Δ S τ Δ S

3. Time History Method of Three-Dimensional Dynamic Stability Analysis

3.1. Analysis Method

The existing numerical modeling of three-dimensional (3D) slopes is performed mainly by using the shear strength reduction technique based on the linear Mohr–Coulomb criterion [35]. In the three-dimensional slope stability analysis using the sliding surface stress method, firstly, the true stress state of the sliding surface is calculated based on the finite element calculation.
The element stresses of each component are obtained according to the finite element method, and the stress components at the points on the sliding surface are solved. Then, the normal and tangential stresses on the sliding surface are obtained from the stress component on the sliding surface.
The general space problem contains 15 unknown functions, namely 6 stress components, 6 deformation components and 3 displacement components, all of which are X, Y and Z coordinate variable functions. The stress components σ x , σ y , σ z , τ x y = τ y x , τ x z = τ z x , τ y z = τ z y on the six cartesian coordinate planes of any point P in the landslide are known. A plane ABC is taken near any point P on the slope, and the crossing point P forms a tiny tetrahedron PABC with the three planes parallel to the coordinate plane, as shown in Figure 1. When the tetrahedron PABC decreases infinitely and approaches point P, the stress on the plane ABC is the stress on the slope.
The direction cosine of the normal line n outside the plane ABC is: cos ( n , x ) = l , cos ( n , y ) = m , cos ( n , z ) = n . According to the equilibrium conditions of tetrahedron F x = 0 , F y = 0 , F z = 0 :
P x = l σ x + m τ y x + n τ z x P y = m σ y + n τ z y + l τ x y P z = n σ z + l τ x z + m τ y z
Then, the normal stress and shear stress on any inclined plane can be obtained. The safety factor of the potential sliding surface is calculated based on the search method. Its safety factor is expressed as:
F s = i = 1 n ( c i + σ i tan ϕ i ) S i i = 1 n τ i S i
Shao [34] proved that the physical meaning of the safety factor defined in Equation (5) is consistent with that in the traditional slice method, and the difference between them is only the calculation method of internal force.

3.2. Features of Software

The time history analysis software FEMSTABLE-3D has been developed to calculate and analyze the three-dimensional dynamic stability of high earth-rockfill dams based on the above analysis methods. Through optimization algorithm, the software effectively solves the difficulties of existing methods in the dynamic calculation of large-scale earth-rockfill dams, such as being time-consuming, having low efficiency and the difficult visualization of results, and provides a reliable method for the high-precision stability calculation of dams. The software analysis process is shown in Figure 2.

3.2.1. Software Framework

The software uses the single optimization method of stable sliding surfaces to centrally calculate all possible sliding surfaces at one time and store less core information. In the subsequent calculation, the safety factor can be quickly calculated by reading the stress at each moment and calling the stored sliding surface information, which is very efficient in the calculation of long-duration seismic waves.

3.2.2. The Software Features

Rich functionality is developed and integrated in order to cope with future large-scale engineering calculations and complex analyses. According to different analysis requirements, three kinds of sliding surface, including spherical, ellipsoid and cylindrical, can be calculated. At the same time, it can be set up according to the demand for the sliding surface scope, the sliding surface minimum depth and radius of the sliding surface search precision, the main scope of sliding direction stability calculation parameters, and can output the most dangerous sliding surface and the dam safety factor of the cloud sliding crack surface sketch map in order to fully combine the user experience; it provides an effective reference for the stability analysis and dam reinforcement.
In addition, for parallel development, CPU can be dynamically allocated during the computing to improve computing efficiency. Table 1 compares and analyzes the serial and parallel computation time of a typical dam (operating condition 3 in Table 2). The model has a total of 150,000 elements, including 60,280 elements in the main part of the faced dam. A total of 5000 ellipsoid centers were set, and 41,039 sliding surfaces were searched at each moment. A total of 900 seismic wave calculations occurred. The CPU model: 22-core Intel Xeon E5 @2.4 GHZ. The parallel computing time is only 1/7 of the serial computing time, so it can be considered that the program provides an efficient computing method for engineering stability calculation.

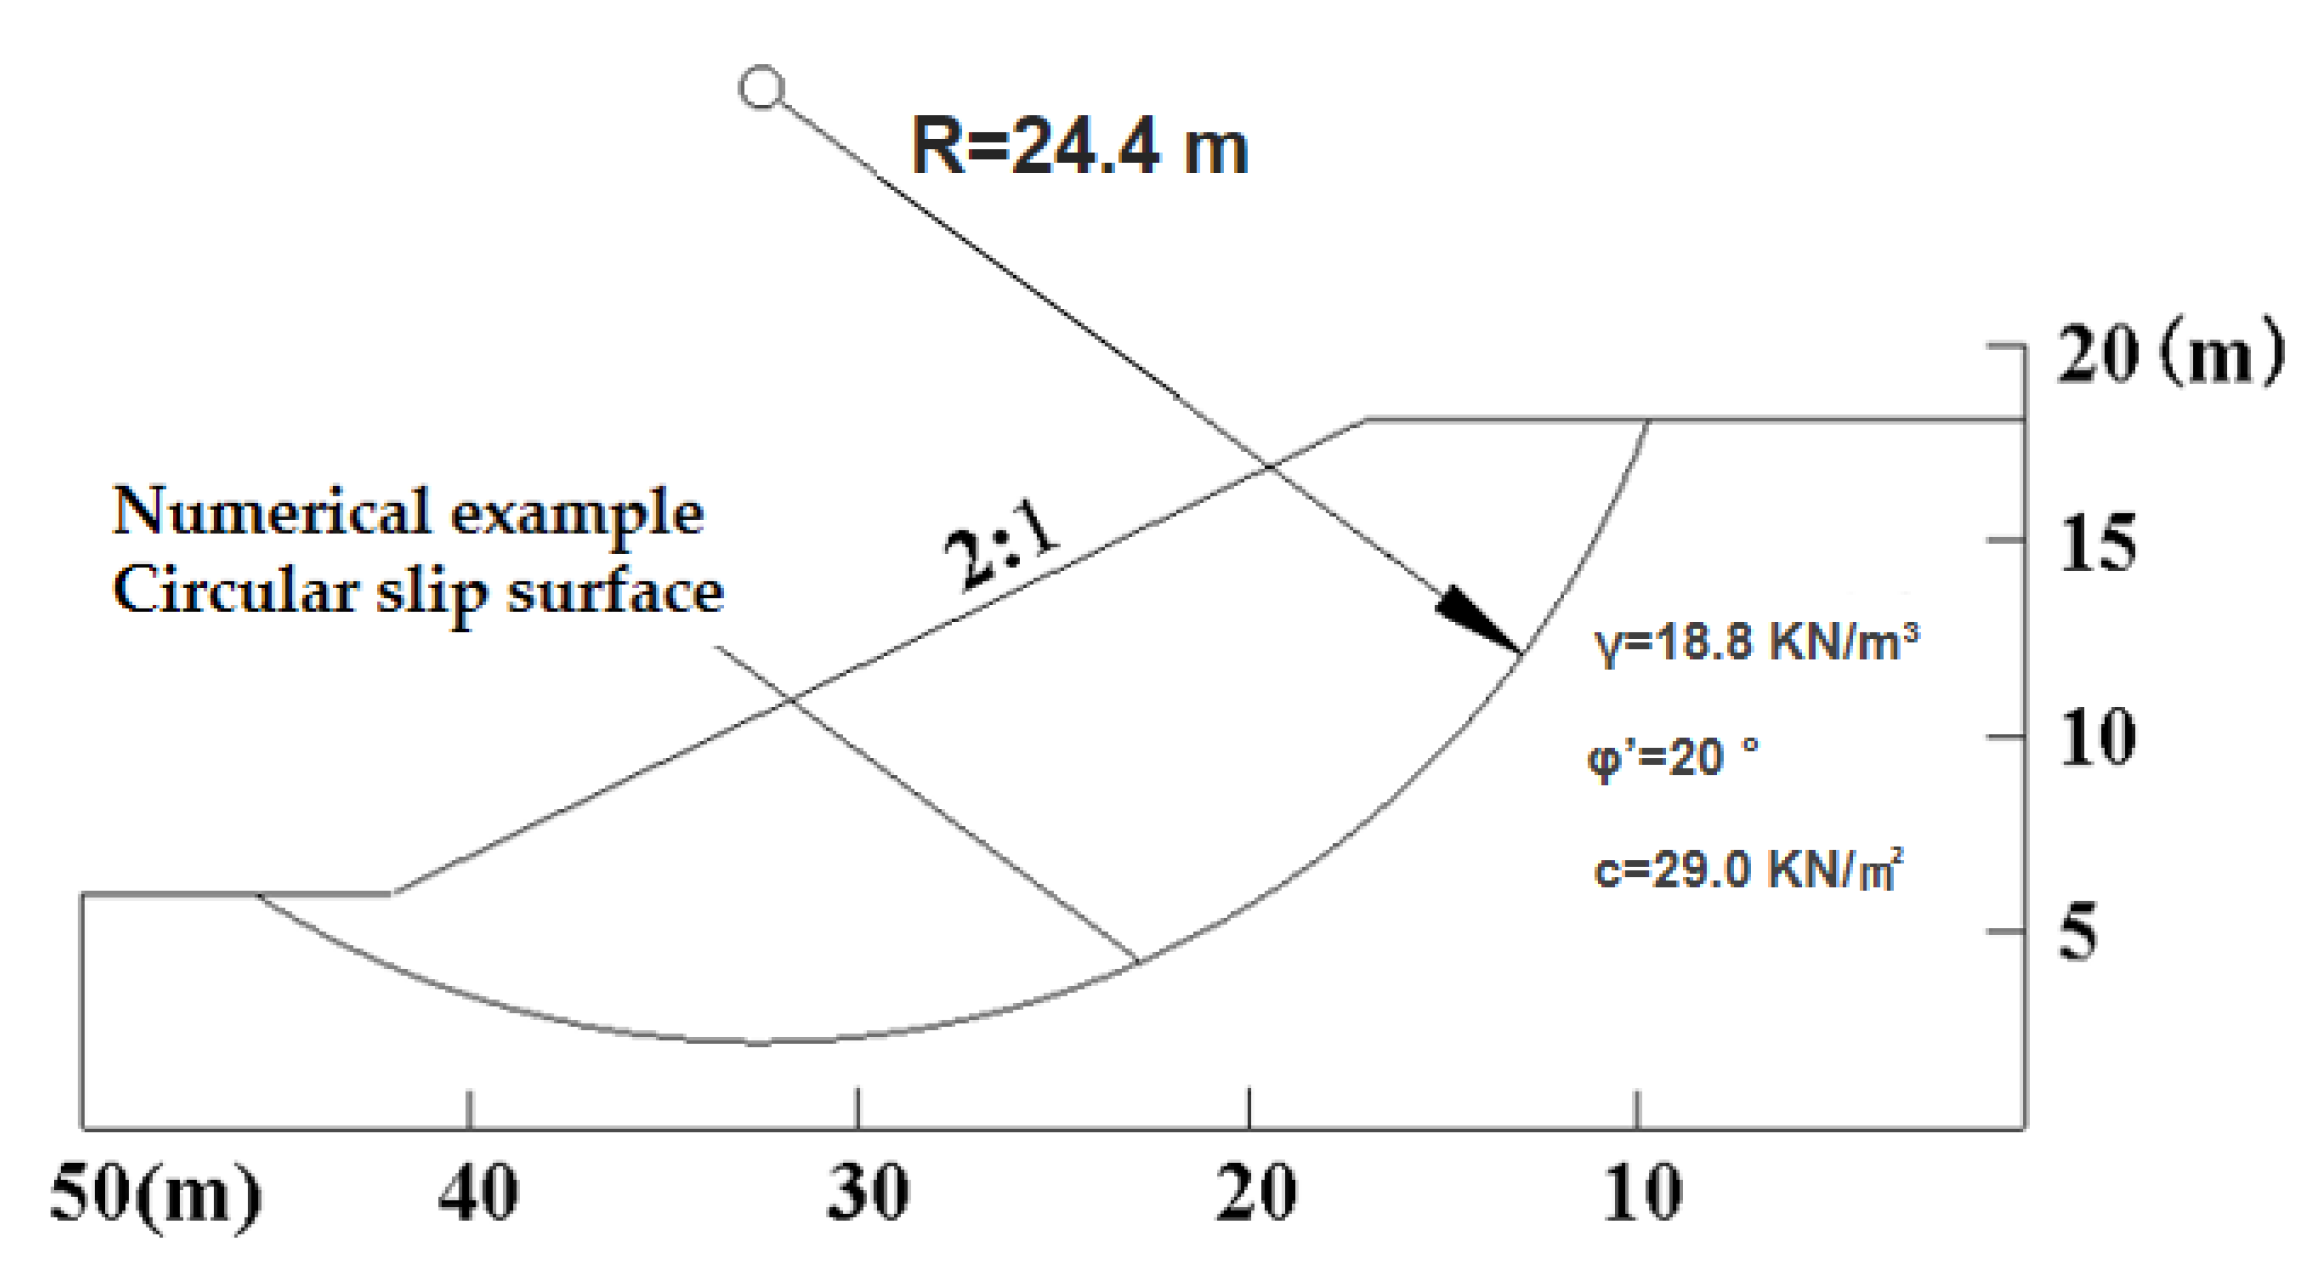
3.2.3. Verification and Analysis

On the basis of the above theoretical method of research and programming, the typical three-dimensional slope model shown in Figure 3 calculated by Zhang Xing (1988) is selected for calculation in this section to check the correctness and reliability of the method and program. The numerical example is a three-dimensional homogeneous slope; the slope height is H = 12 m, the slope is 2:1 and the load only considers the dead weight. The depth length of the slope model is 90 m, with a total of 34,320 elements.
In this paper, the natural self-weight state of the slope is simulated by static calculation using GEODYNA finite element analysis software [36]. After that, the stress, coordinate and material parameters of the three-dimensional finite element are processed and input into the program for calculation.
In finite element dynamic time history stability analysis, firstly, it is assumed that the sliding surface is spherical, given the searching range of the circle center and the range of the sliding surface entering and marking points. Then, the enumeration method is used to automatically search for the most dangerous surface according to the stress state of the element and calculate the safety factor and other results. Finally, the most dangerous slip surface during the entire seismic process is determined by comparing the safety factor or magnitude of slip distance. In this paper, the safety factor is adopted.
The most dangerous sliding surface and corresponding safety factor are 2.162 by searching the sliding surface with different spherical centers and radii. The shape of sliding surfaces is shown in Figure 4. The calculation results obtained by Chen Zuyu’s (1988) method are shown in Figure 5. By comparing the shape of the sliding surface and the safety factor, it can be concluded that the solutions given in this paper are close to those given by other methods, and the program can be considered accurate and reliable. The specific comparison results are shown in Table 3.

4. Three-Dimensional Dynamic Stability Analysis of Faced Rockfill Dam

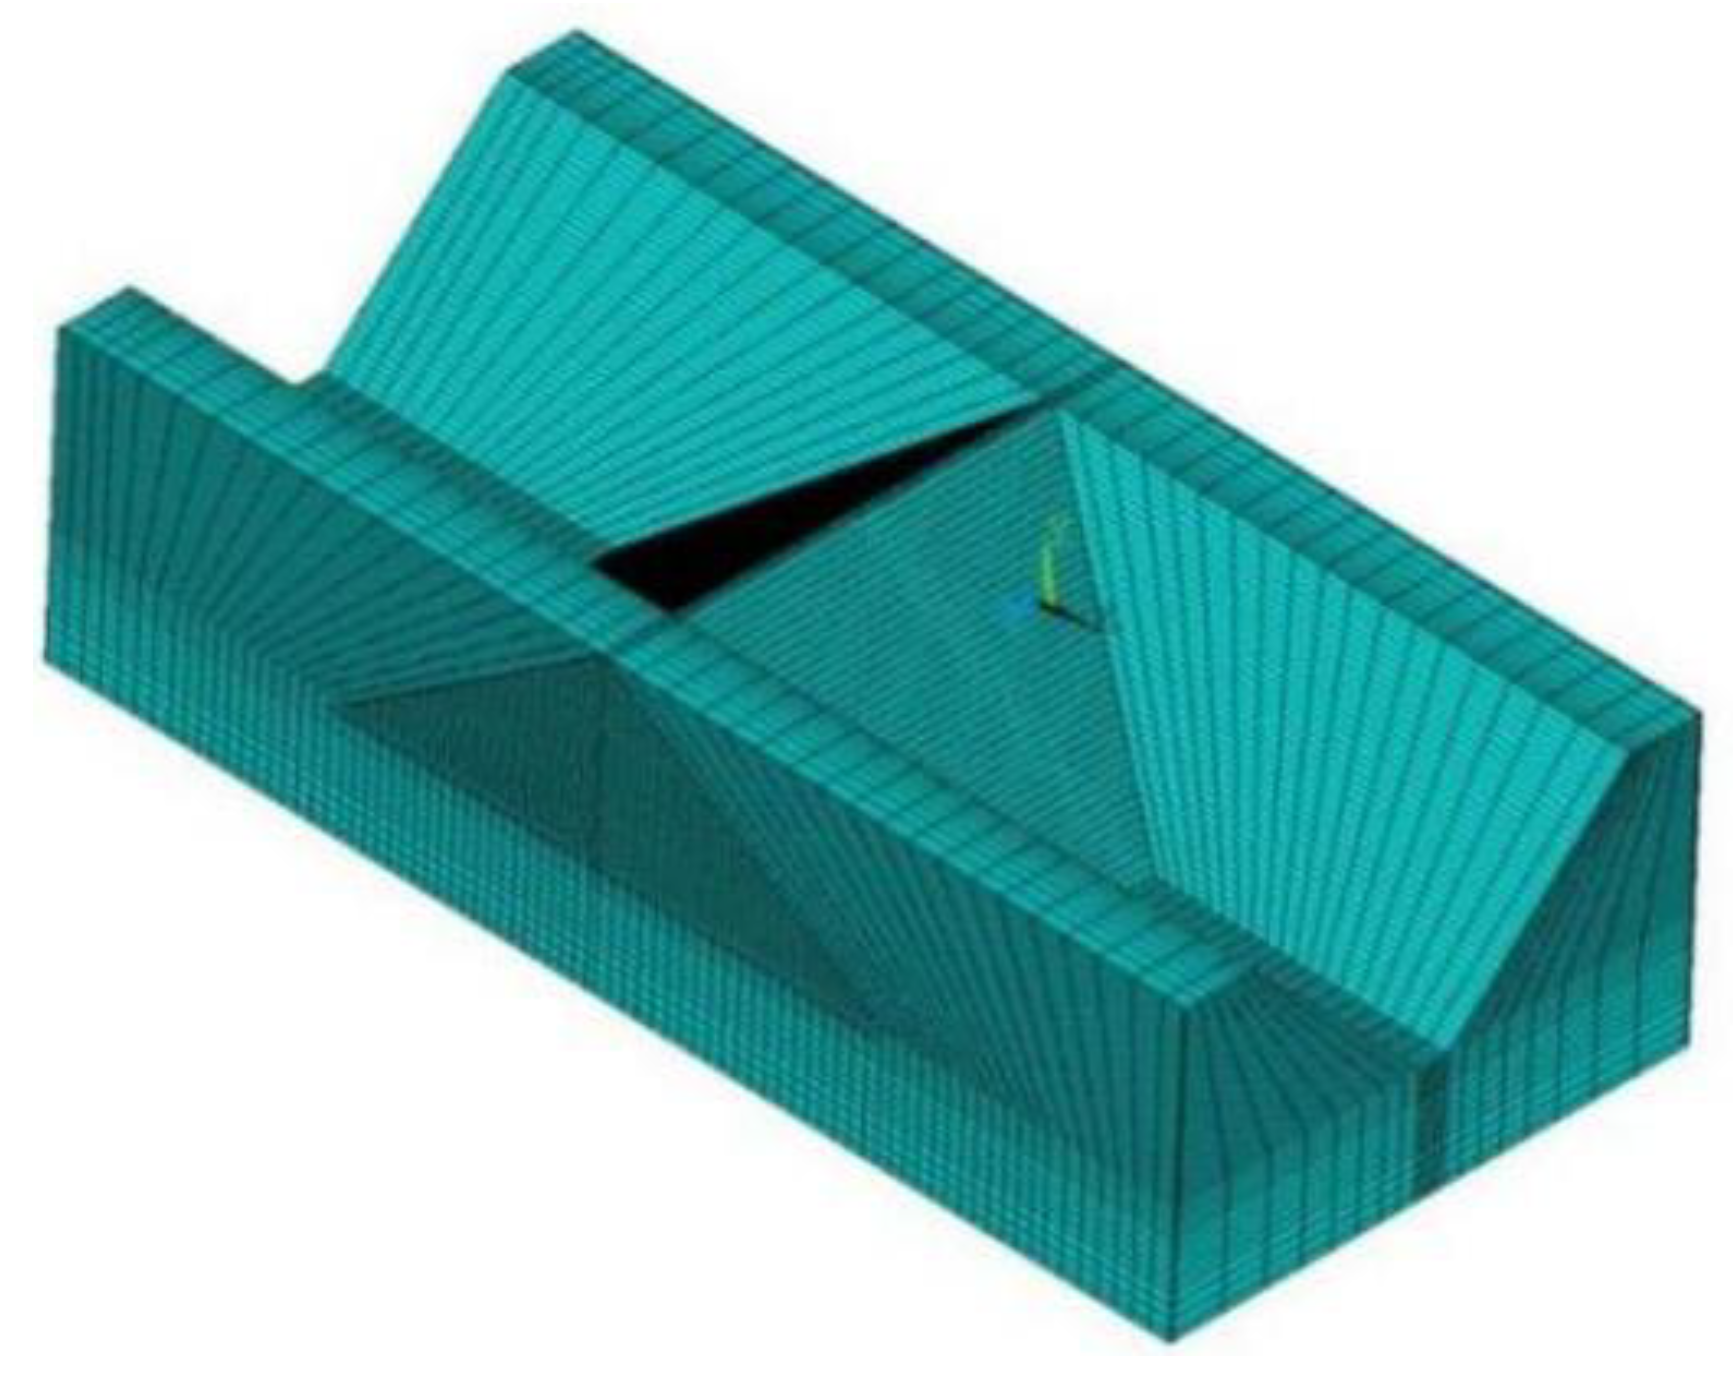
4.1. Numerical Model

A three-dimensional concrete faced rockfill dam (CFRD) is taken as the research object and a finite element model of the dam with a height of 300 m is established for analysis, as shown in Figure 6, and the dam, the hills on both sides and the lithological foundation are included. The foundation is epitaxial at a certain distance in depth and horizontal direction. Viscoelastic artificial boundaries are added at the bottom and surrounding the bedrock. The dam crest width is 16 m, and the factor of the upstream and downstream slope is 1.4. The dam is layered filling with water storage up to 275 m and no water in the downstream. The thickness of the panel is 0.3 + 0.0035 H (H is the dam height). A contact surface element is provided between the concrete face and the dam.

4.2. Material Parameters

A Duncan E-B nonlinear elastic model is adopted in the static calculation model and an equivalent linear viscoelastic constitutive model is adopted in the dynamic calculation. The constitutive model of the concrete face slab and bedrock is a linear elastic model. Static and dynamic parameters of dam-building materials are shown in Table 2 and Table 4, and the bedrock and panel parameters are shown in Table 5. The relationship between the normalized dynamic shear modulus and the damping ratio of rockfill and shear strain adopts the average value suggested by Kong et al. [37].

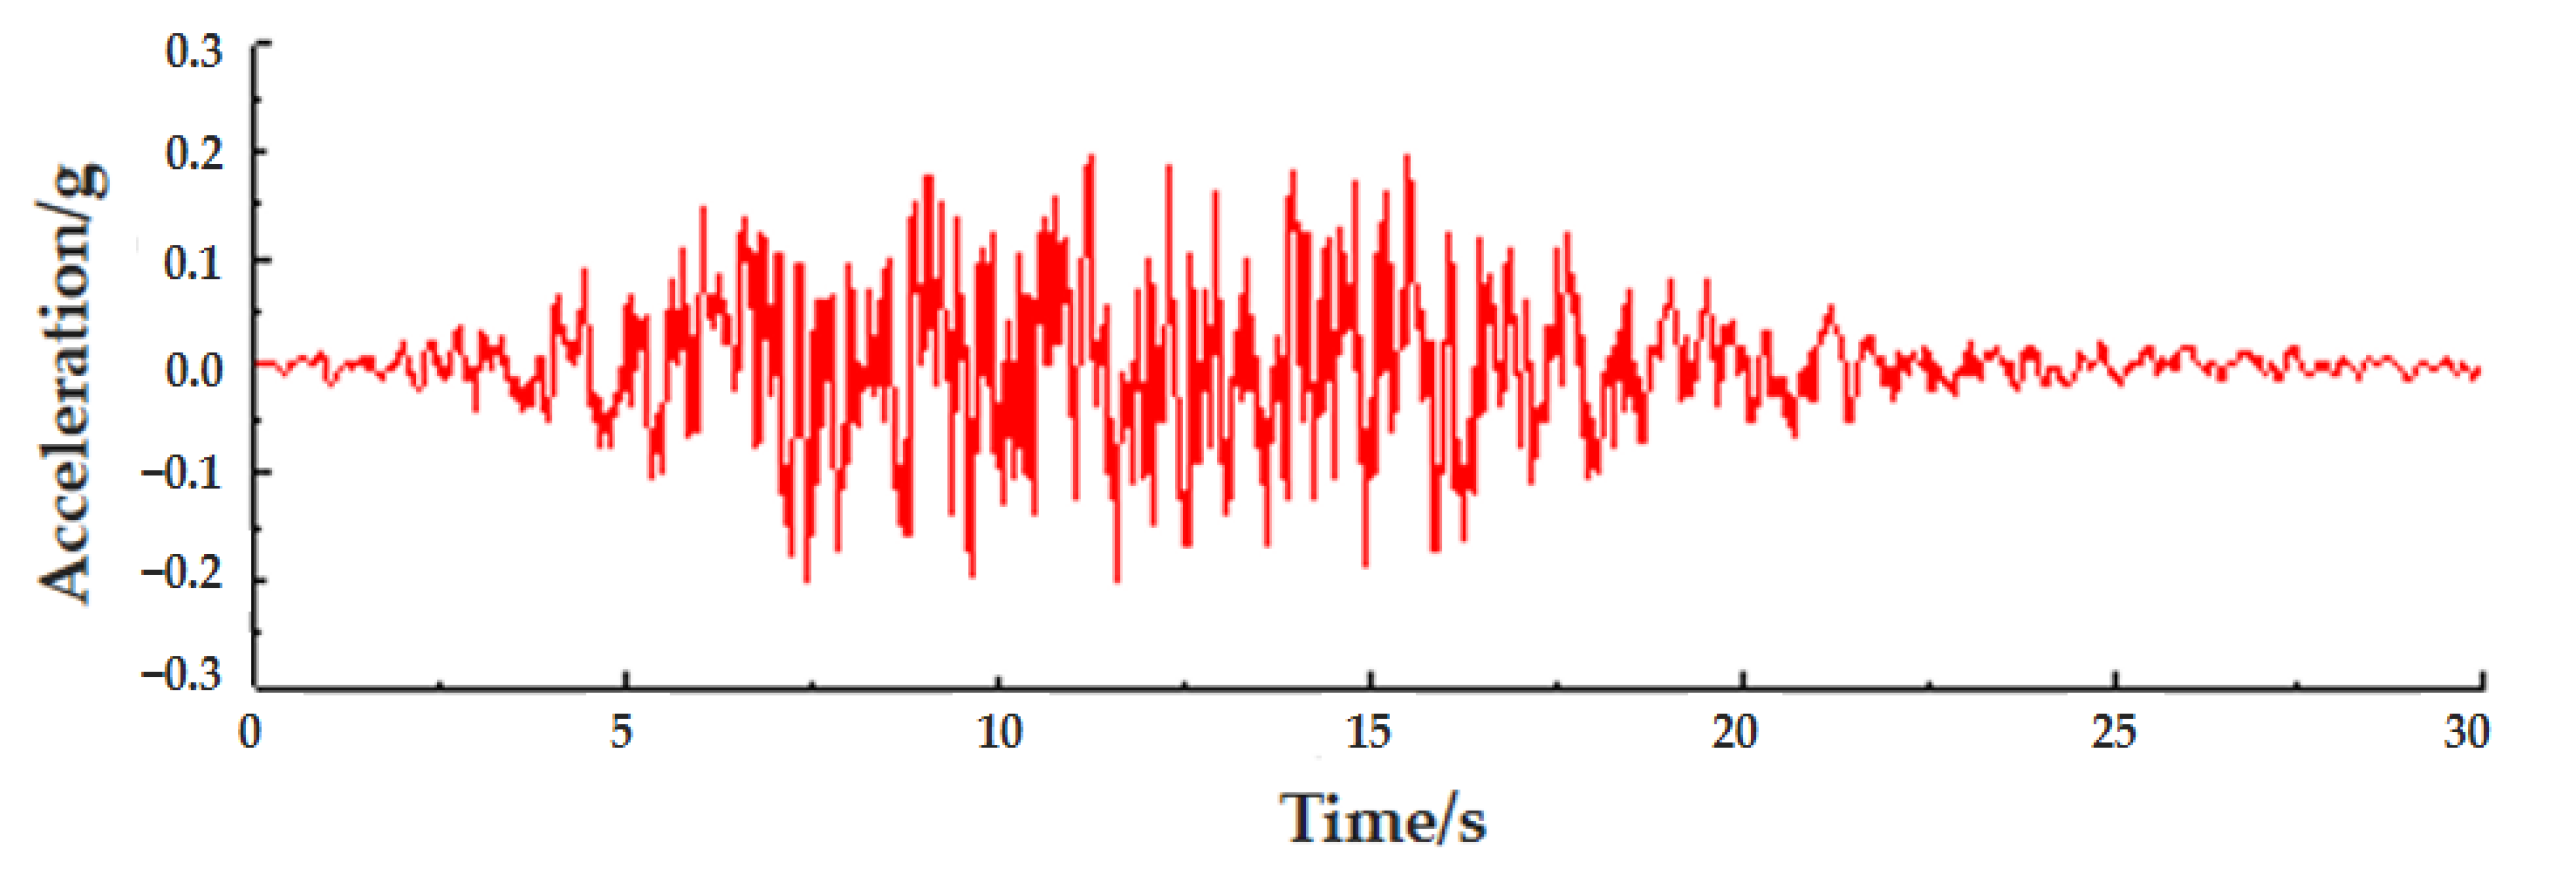
4.3. Ground Motion Input

The seismic waves used in the dynamic calculation are artificial waves synthesized according to the spectrum of the current seismic design code for hydraulic buildings. In order to control the variables, seismic waves are only considered along the river. The acceleration curve is shown in Figure 7. The PGA is 0.2 g, and the seismic load’s input is realized by the wave method.

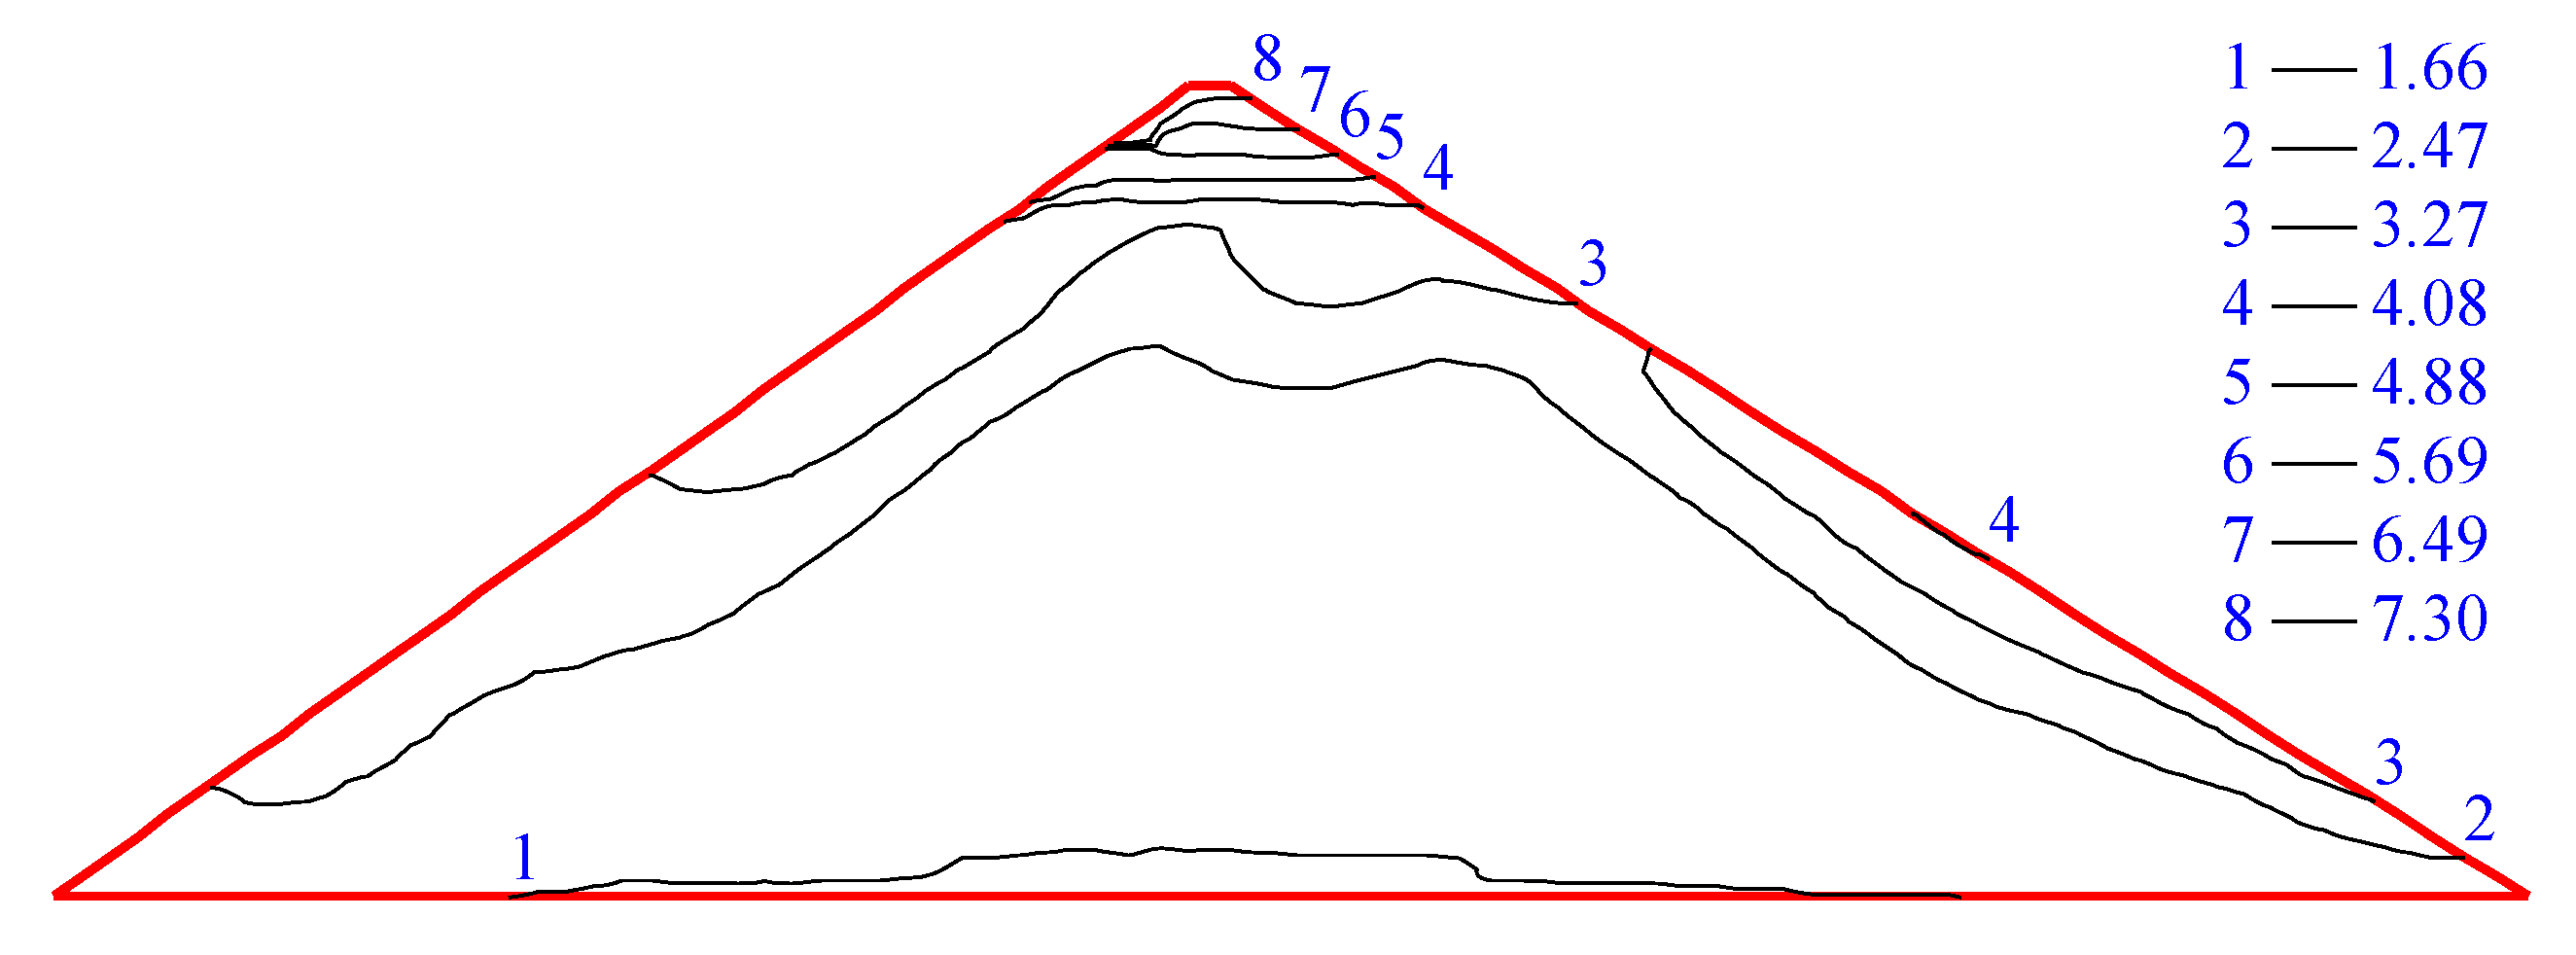
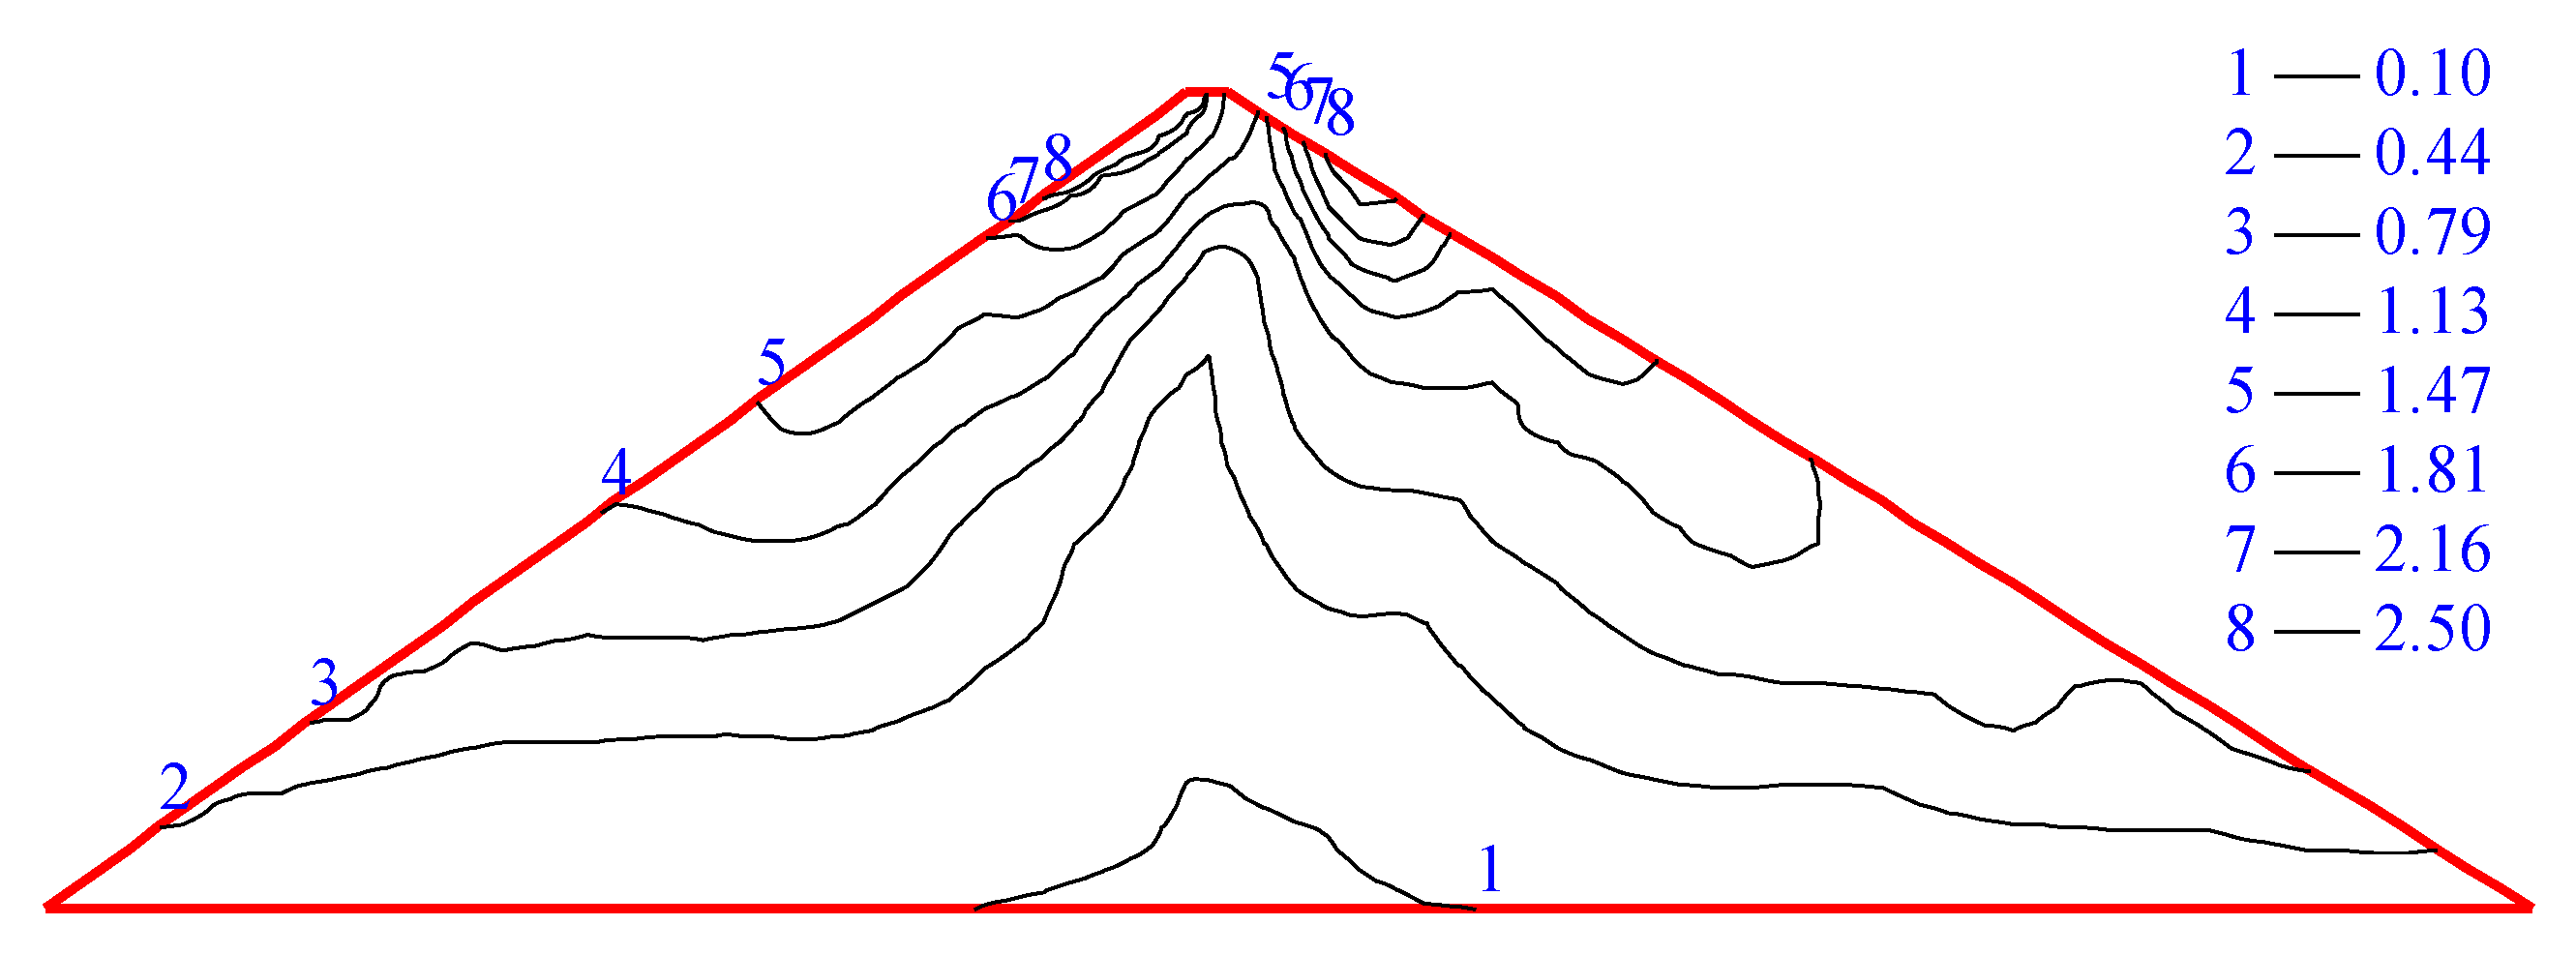
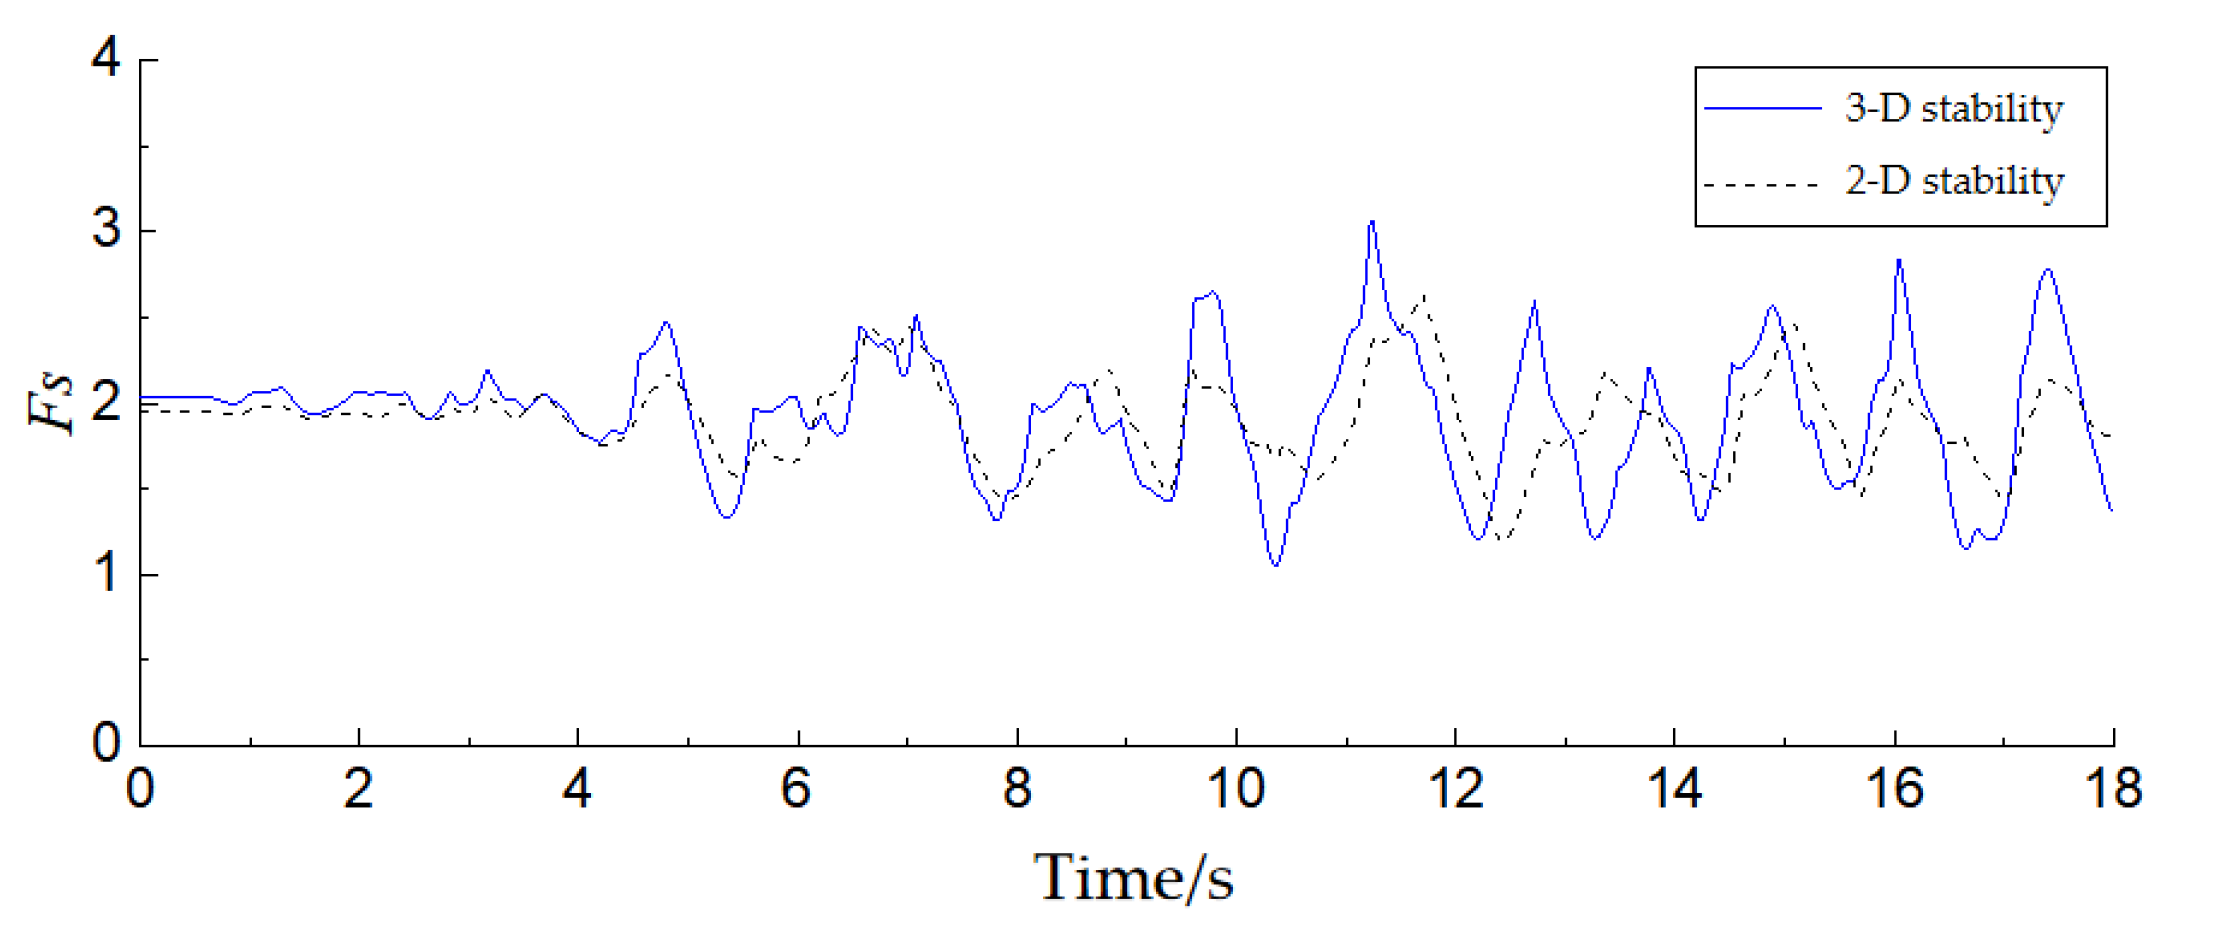
4.4. Analysis of Calculation Results

In a narrow river valley, it is mostly shallow sliding and concentrated in the central area of the dam crest and so the minimum length of the z-axis radius of the elliptical sliding surface is 0.9 times of the x-axis. The response of the dam under dynamic action is analyzed. Figure 8 and Figure 9 are contour maps of the acceleration at the maximum cross-section of the dam. The acceleration gradually amplifies with the increase of the dam height and increases sharply above the height of the dam by more than 4/5, which is consistent with the general laws.
By comparing and analyzing the safety factor time histories (Figure 10), it can be concluded that the shapes of the three-dimensional and two-dimensional stability safety factor processes are different. However, the minimum safety factor and the occurrence time are not identical. It means that the failure process of dam slopes may also be different. If the safety factor of a potential sliding body is less than 1.0, the sliding process of this failure body also will be obtained by this method. Figure 11 is the cloud diagram of the safety factor of the most dangerous sliding surface (top view). Under static conditions, the safety factor of the top of the most dangerous sliding surface is large, while the maximum rule after an earthquake is the opposite. In addition, the safety factor of less than 0.2 is generally located at the local position of the dam crest. This is in accordance with the objective law of slope stability. Moreover, dam crest cracking is one of the most common damage types for high earth-rockfill dams [38]. Therefore, special attention should be paid to the dam crest in the seismic reinforcement. The dam crest should be strengthened by increasing density or adding geo-grille. The vector arrow in the figure represents the direction of the shear stress of the local element on the sliding surface. It can be seen that the local sliding direction is symmetrically distributed. In the dynamic cloud image, both sides of the top tilt toward the center, and both sides of the middle and lower tilt outward; both sides of the static cloud are inclined outwards, and this trend is similar to that in other scholar examples [39].
Figure 12 is a schematic diagram of the location of the downstream dam slope sliding crack surface. In Figure 13, the comparison between the most dangerous sliding surface in the section of the dynamic stabilized 3D dam and the two-dimensional sliding surface shows that the range of the most dangerous sliding surface in the static stability is larger, and the two-dimensional sliding surface has the trend of connecting up and down, while by comparing the three-dimensional static sliding surface diagram shown in Figure 12, it can be seen that the actual dam is constrained by bank slopes on both sides, and the range is smaller than that of two-dimensional. The most dangerous sliding surface of three-dimensional stability is more inclined to the crest of the dam [40]. The results show that the soil at the top of the dam slope reacts greatly under the continuous earthquake action, and even tends to be pulled apart. Most of the soil at the top of the dam slope slides in the shallow layer, especially in three-dimensional response.

5. Conclusions

The main methods for slope stability analysis of earth-rockfill dams are summarized and analyzed. An efficient 3D time history stability analysis method and software are presented and developed in this paper. The method and in-house software are verified with existing results. The two-dimensional and three-dimensional slope seismic stability of a high faced rockfill dam is preliminarily studied. The conclusions are as follows:
  • Based on the finite element sliding surface stress method and dynamic response analysis, a time history method of three-dimensional stability analysis is presented and realized using in-house software. The developed software is verified to be feasible and efficient by examples. It provides a basis for seismic design and the local reinforcement of high earth-rock dams, helps in the understanding of the time history variation of safety factors and the sliding process and optimizes the efficiency of dynamic stability analysis of high earth-rock dams.
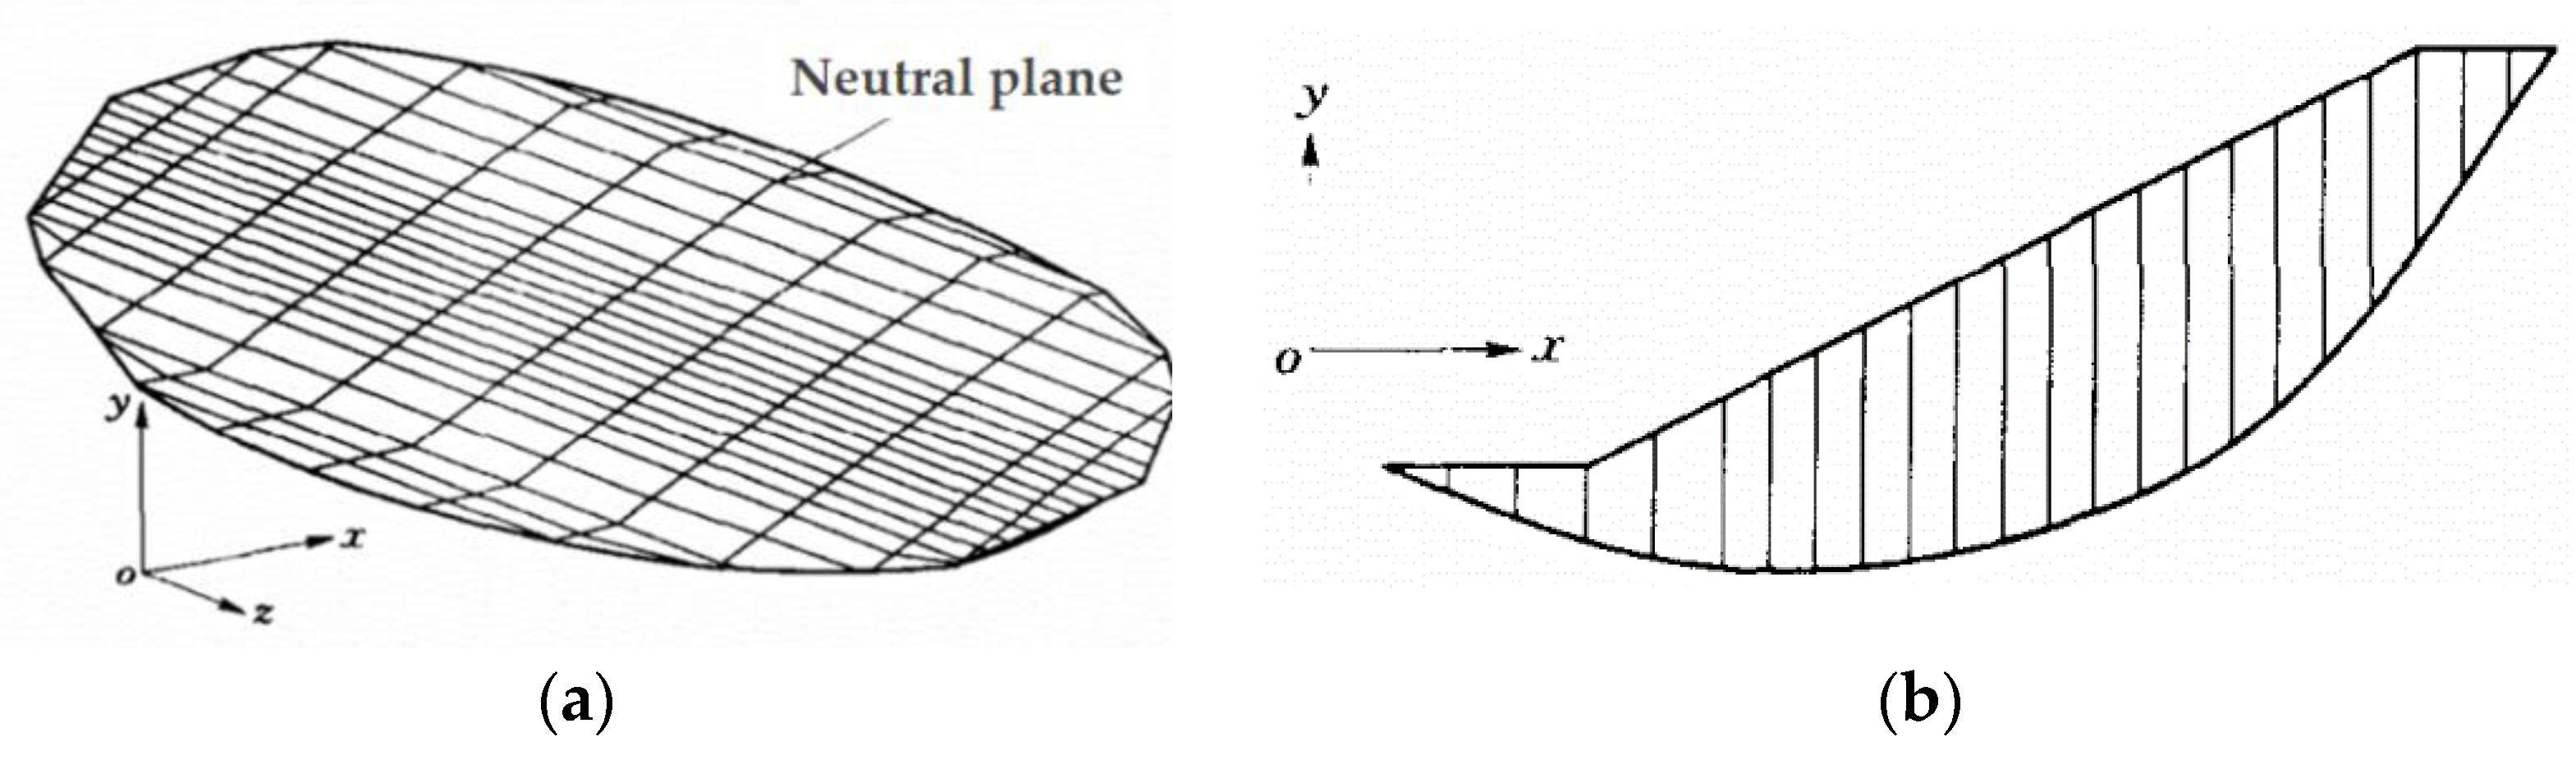
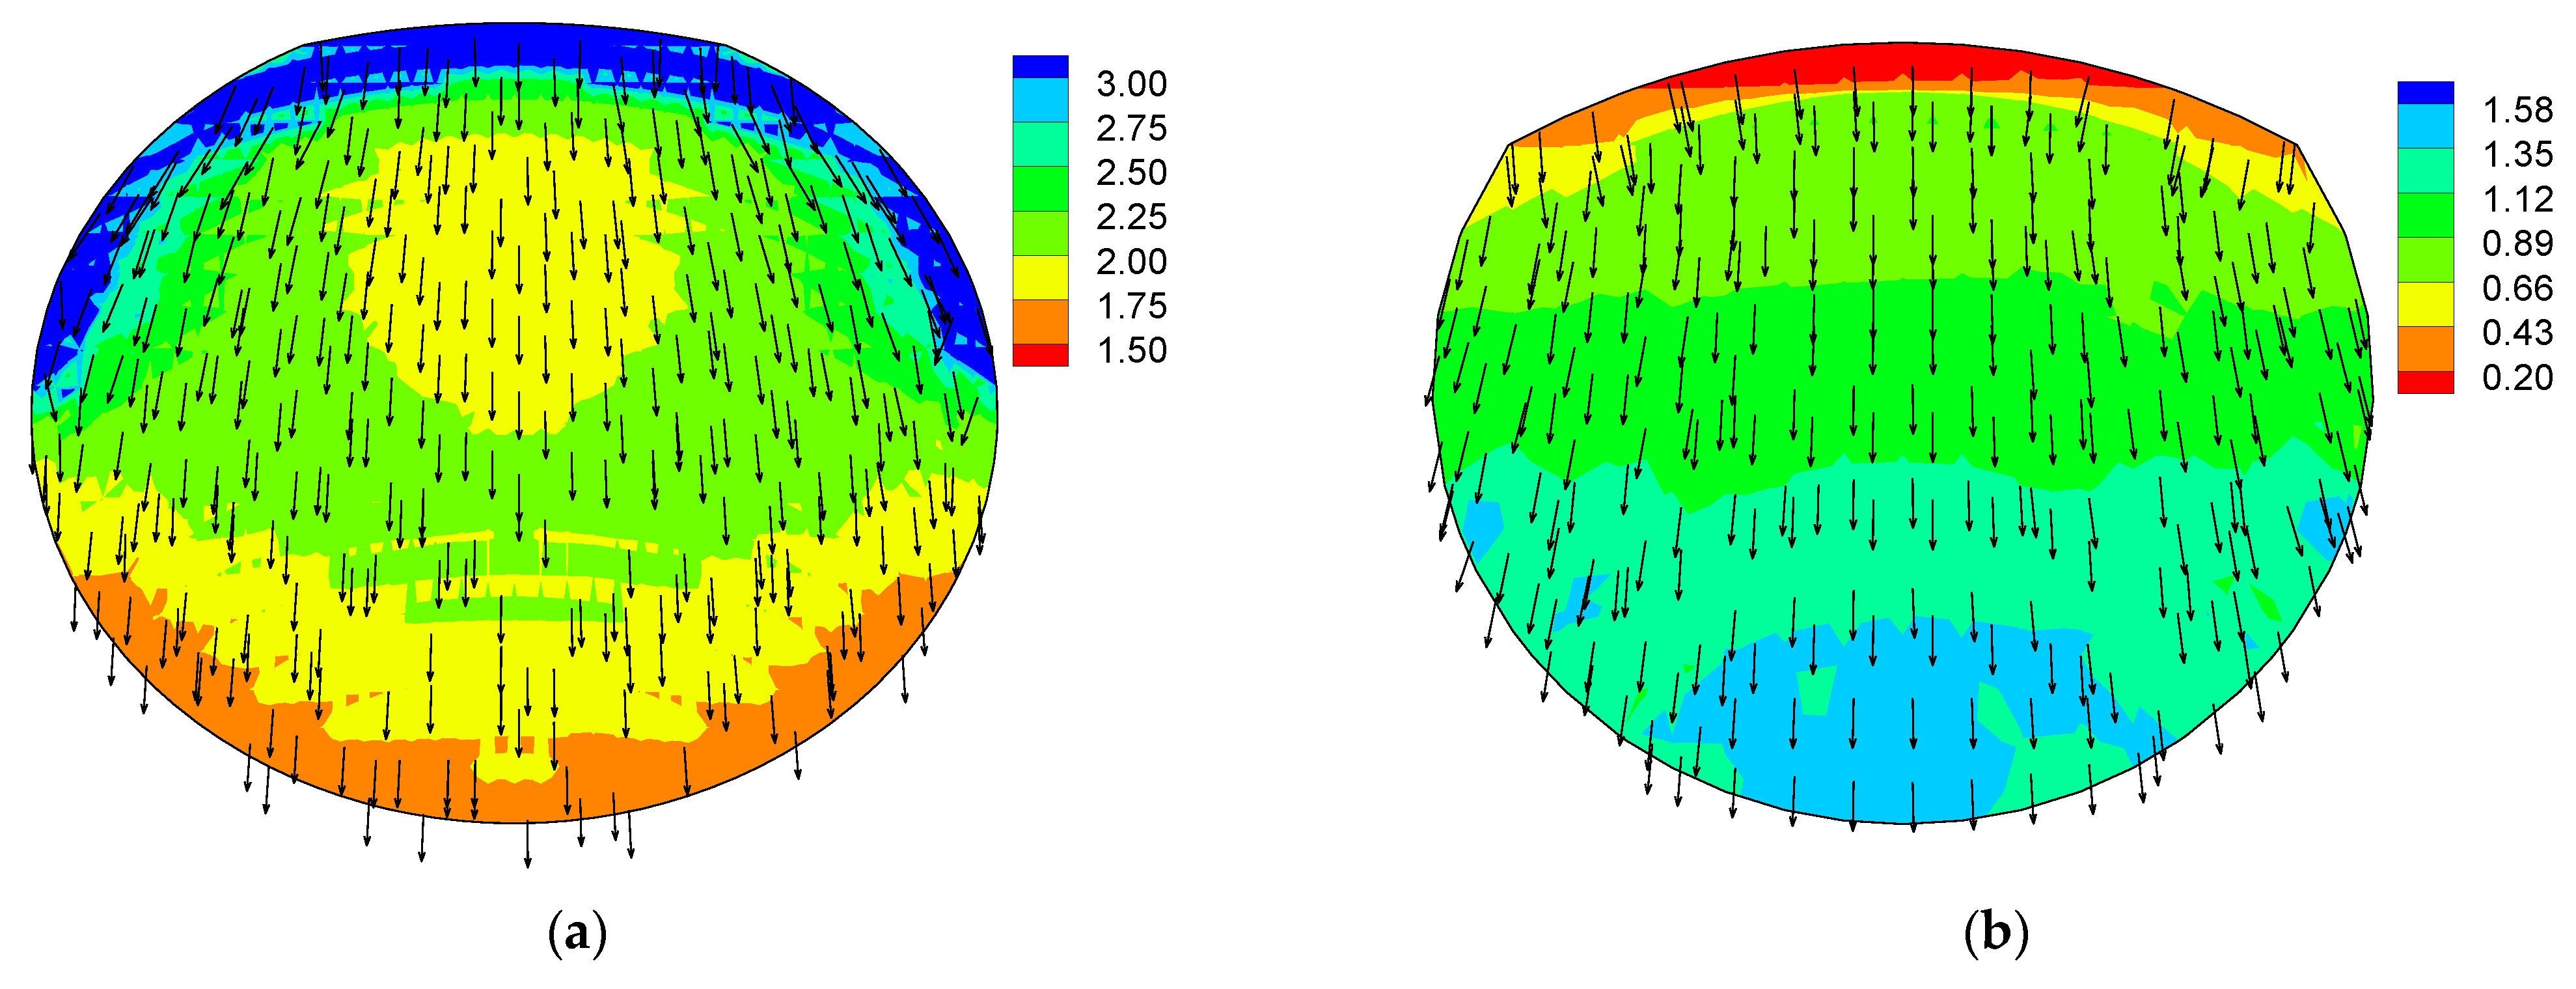
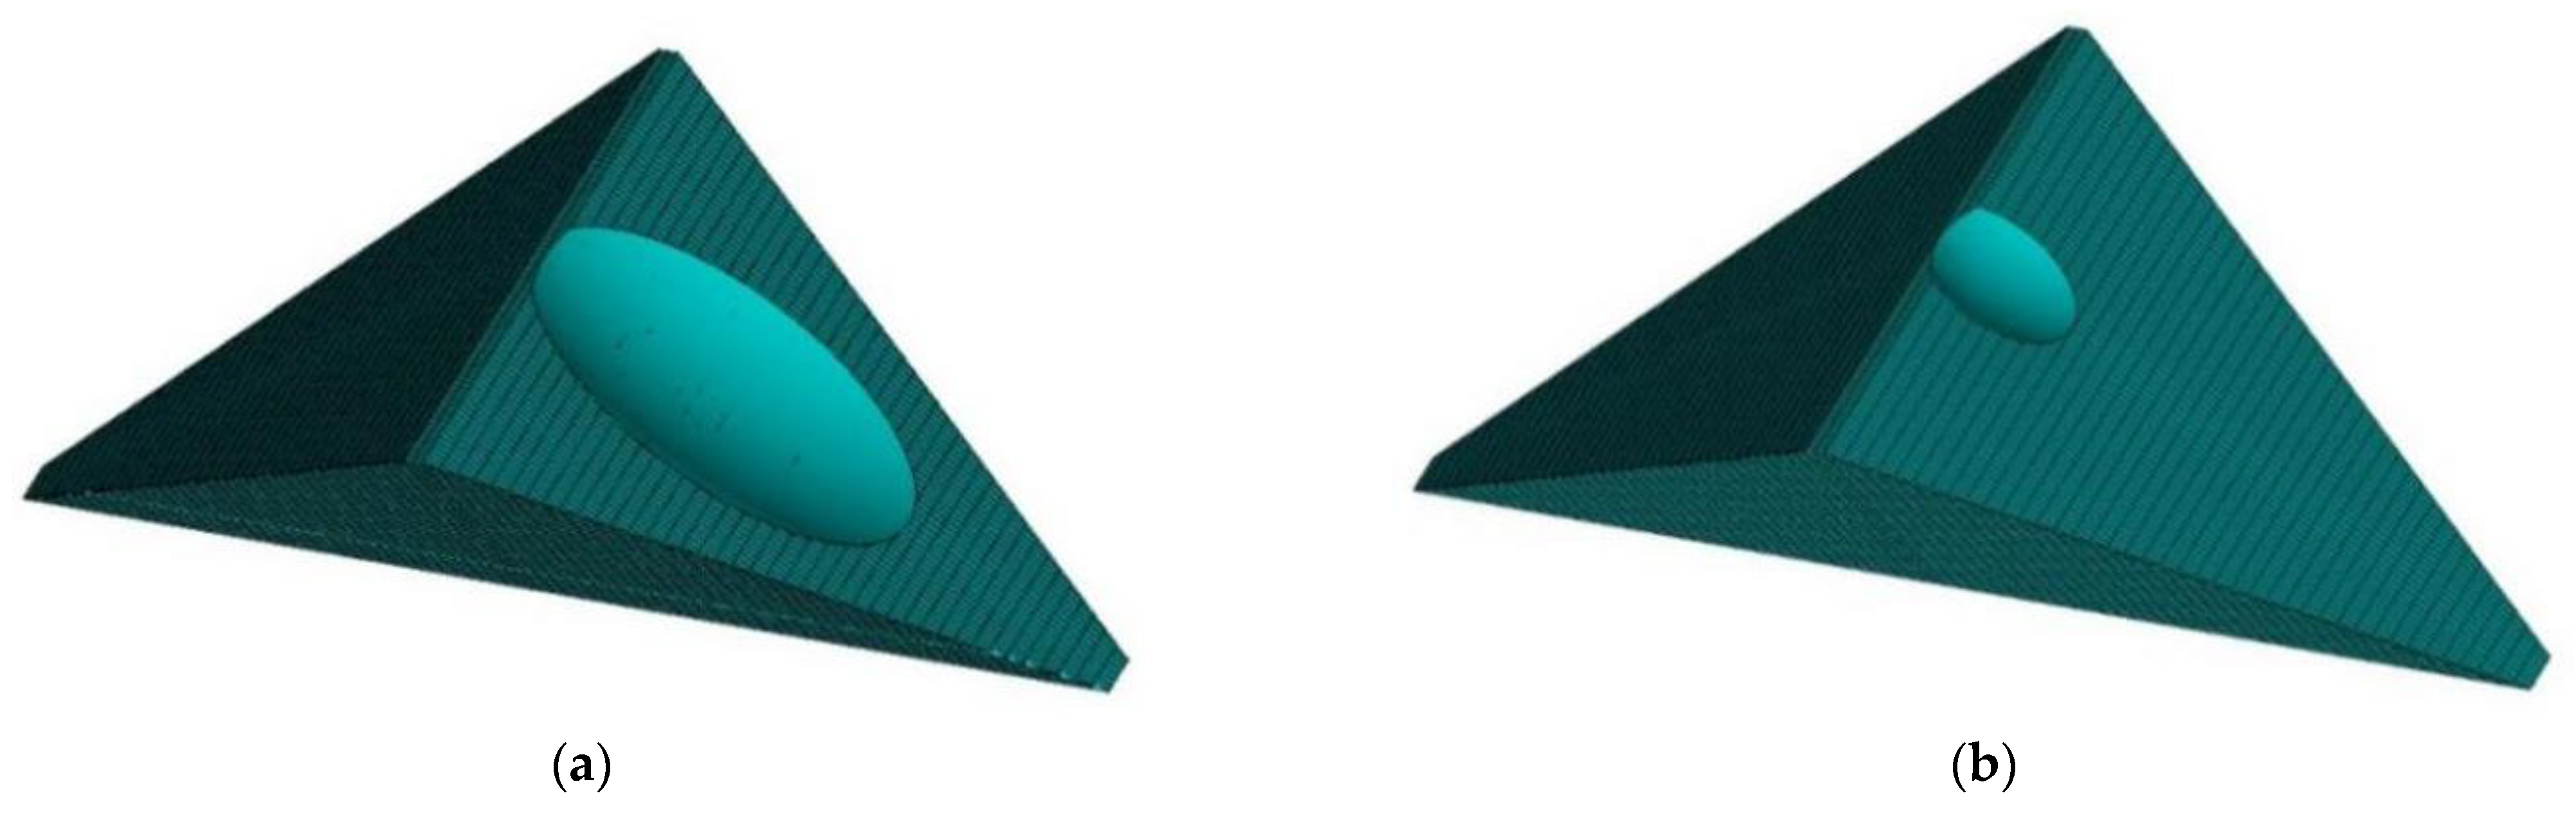
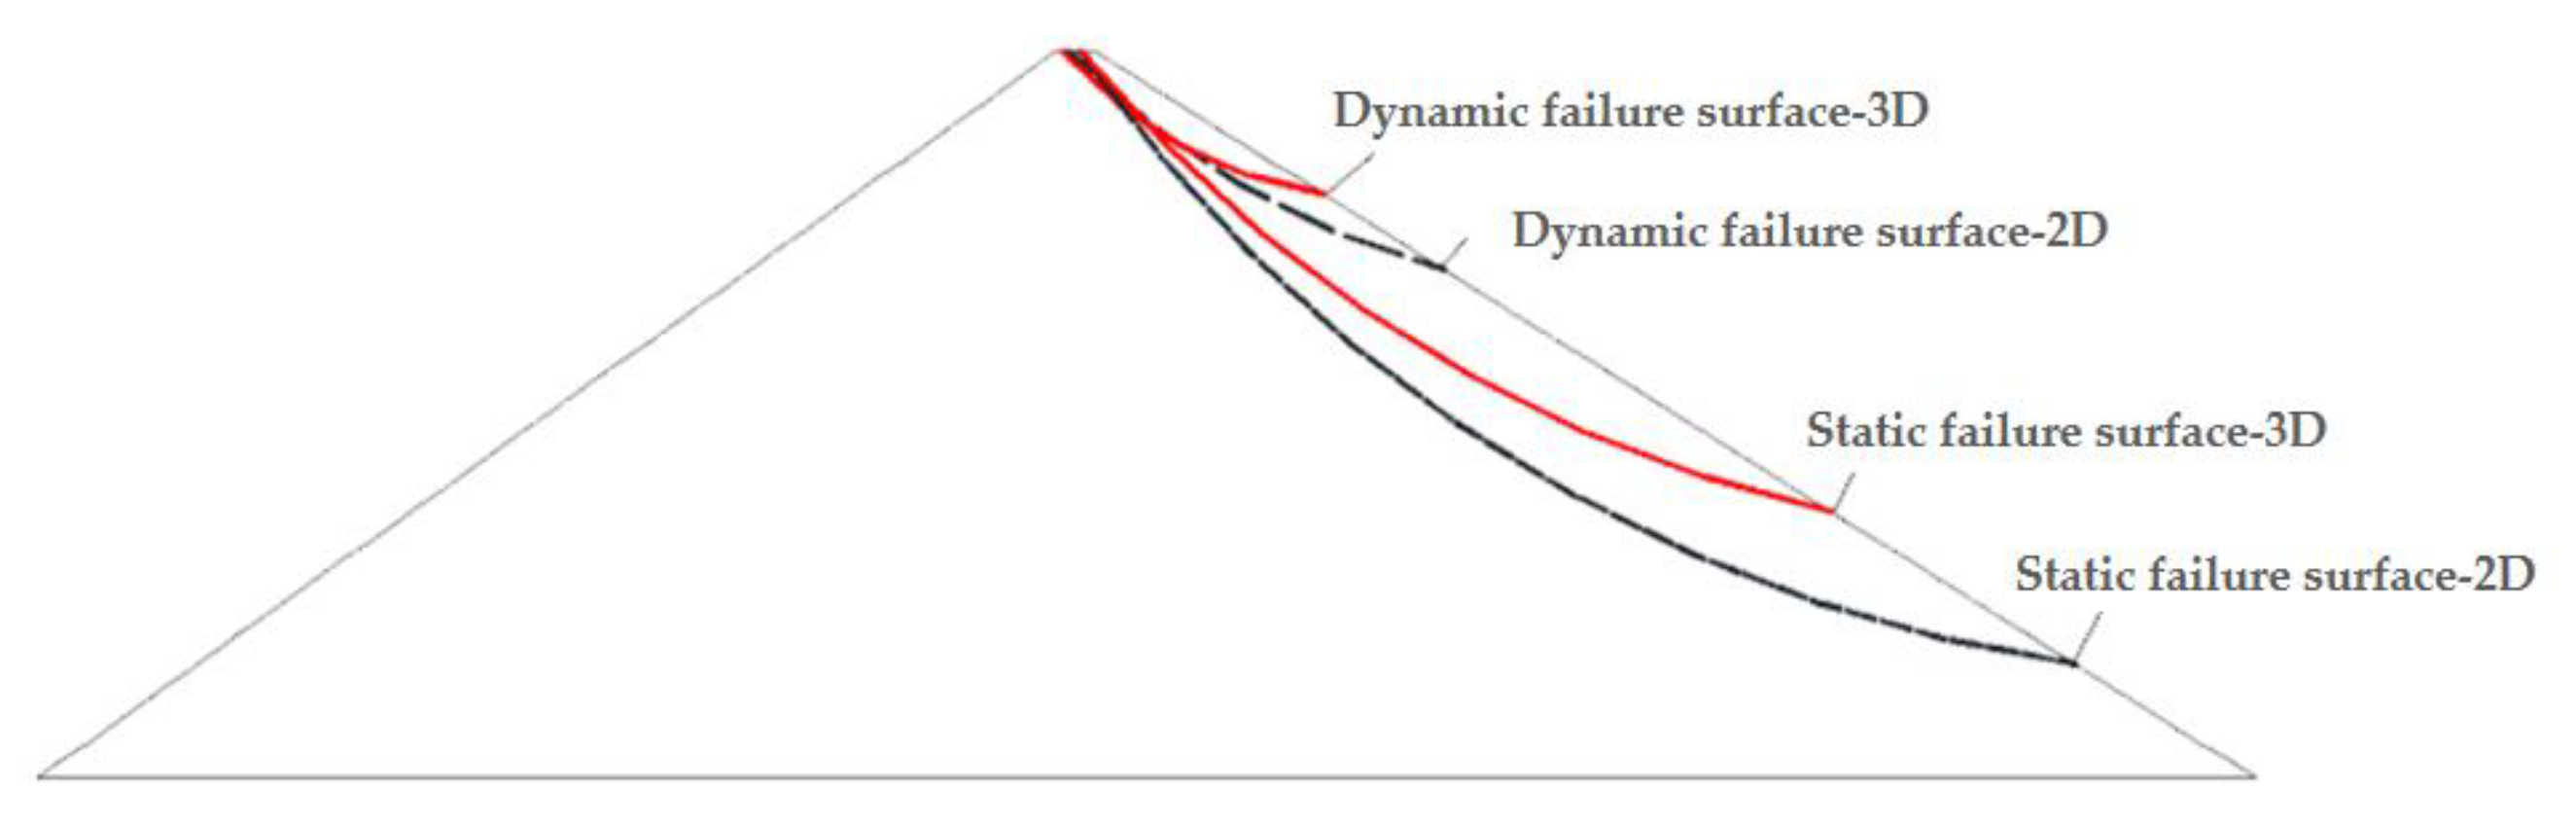
  • The stability analysis method based on finite element analysis is more reasonable and has obvious advantages. It is suitable for analyzing earth-rockfill dam slopes with long seismic duration and complicated action forms. In addition, there is a great difference between traditional two-dimensional stability analysis and three-dimensional stability analysis. The two-dimensional analysis assumes that the sliding body extends indefinitely along the dam axis which is not in line with reality. The most dangerous sliding body captured by three-dimensional stability analysis is shallower. The soil body in the sliding surface at the dam crest tends to be pulled apart. The local sliding direction of the sliding surface is symmetrical and the lower and middle sides are inclined outwards.
  • The three-dimensional dynamic stability time history analysis not only adopts the 3D finite element dynamic response, which is closer to the real response of the dam, but also reflects the local instability characteristics of the dam slope. It can also reflect and consider the development process of the stress-strain state of the potential sliding surface, as well as the local security of the potential sliding face, time history of safety factor, overall form and space position of the dangerous sliding body, even the sliding process of the failure body and the analysis results are closer to the reality.

Author Contributions

Writing—original draft, H.Y. and X.Y.; Methodology, X.Y.; Formal analysis, X.Y. and Y.W.; Software, X.Y. and D.Z.; Data curation, Y.W.; Writing—review & editing, M.L. and J.L. All authors have read and agreed to the published version of the manuscript.

Funding

This research was supported by Key Research & Development and Promotion Projects-Science and Technology in Henan Province (No. 222102320098), Postdoctoral Research Grant in Henan Province (No. 202002022), the Fundamental Research Funds of the Central Universities (No. DUT21TD106), Open Fund of State Key Laboratory of Coastal and Offshore Engineering, Dalian University of Technology (No. LP2014) and China Postdoctoral Science Foundation (No. 2021M692938).

Informed Consent Statement

Not applicable.

Data Availability Statement

Not applicable.

Conflicts of Interest

There are no conflict of interest with CCCC Investment Nanjing Co., LTD. The authors declare no conflict of interest.

References

  1. Yu, X.; Wang, Y.; Tulamaiti, Y.; Zhou, C.; Zhou, Y.; Wang, G. Refined numerical simulation of a concrete cut-off wall in the thick overburden of dam foundation. Structures 2021, 33, 4407–4420. [Google Scholar] [CrossRef]
  2. Wang, F.; Liu, C.; Zhou, J.; Yang, Z. Review of seismic safety study on high earth-rockfill dam in China. Hydropower Pumped Storage 2017, 3, 33–37. [Google Scholar]
  3. Liu, X.; Zhao, J.; Yang, Y.; Wang, Z. Advances in seismic design of earth-rockfill dams and foundations in China and revision of code based on lessons from Wenchuan Earthquake. Chin. J. Geotech. Eng. 2015, 37, 2111–2118. [Google Scholar]
  4. Qu, Y.; Zou, D.; Chen, K.; Liu, J. Three-dimensional refined analysis of seismic cracking and anti-seismic measures performance of concrete face slab in CFRDs. Comput. Geotech. 2021, 139, 104376. [Google Scholar] [CrossRef]
  5. Zhang, J.; Li, X.; Wang, X.; Chi, M.; Wang, Y. Method for judging seismic stability state of soil slopes. Chin. J. Geotech. Eng. 2018, 40, 2096–2102. [Google Scholar]
  6. Cui, P. Research on System Reliability of Deep Anti-Sliding Stability of Gravity Dam Bedrock Considering Stochastic Sracture Network. Master’s Thesis, Dalian University of Technology, Dalian, China, 2021. [Google Scholar]
  7. Kong, L.; Chen, H. Advancement in the techniques for special soils and slopes. China Civ. Eng. J. 2012, 45, 141–161. [Google Scholar]
  8. Chen, K.; Zou, D.; Kong, X.; Zhou, Y. Global concurrent cross-scale nonlinear analysis approach of complex CFRD systems considering dynamic impervious panel-rockfill material-foundation interactions. Soil Dyn. Earthq. Eng. 2018, 114, 51–68. [Google Scholar] [CrossRef]
  9. Schnaid, F.; de Mello, L.G.F.S.; Dzialoszynski, B.S. Guidelines and recommendations on minimum factors of safety for slope stability of tailings dams. Soils Rocks 2020, 43, 369–395. [Google Scholar] [CrossRef]
  10. Matsui, T.; San, K.C. Finite element slope stability analysis by shear strength reduction technique. Soils Found 1992, 32, 59–70. [Google Scholar] [CrossRef] [Green Version]
  11. Chen, G.; Huang, R.; Shi, Y.; Xu, Q. Stability analysis of slope based on dynamic and whole strength reduction methods. Chin. J. Rock Mech. Eng. 2014, 33, 243–256. [Google Scholar]
  12. Guo, Y.; Chen, T.; Qian, H. The determination method of dynamic safety factor for slope based on strength reduction. China Civ. Eng. J. 2012, 45, 117–120. [Google Scholar]
  13. Nian, T.K.; Huang, R.Q.; Wan, S.S.; Chen, G.Q. Three-dimensional strength-reduction finite element analysis of slopes: Geometric effects. Can. Geotech. J. 2012, 49, 574–588. [Google Scholar] [CrossRef]
  14. Gong, J.; Zou, D.; Kong, X.; Liu, J.; Qu, Y. An approach for simulating the interaction between soil and discontinuous structure with mixed interpolation interface. Eng. Struct. 2021, 237, 112035. [Google Scholar] [CrossRef]
  15. Reddy, J.N. An Introduction to the Finite Element Method; John Wiley & Sons, Ltd.: Hoboken, NJ, USA, 2013. [Google Scholar]
  16. Giams, K.; Donaldi, B. Determination of critical slip surfaces for slopes via stress strain calculations. Opt. Quantum Electron. 1988, 5, 1–9. [Google Scholar]
  17. Wu, W.; Chen, Z.; Huang, L. A New Method for Searching Critical Folded Sliding Surface. China Water Transp. 2014, 14, 94–95. [Google Scholar]
  18. Li, J.; Chen, S.; Yu, F. A method for searching potential failure surface of slope based on maximum shear strain increment. Rock Soil Mech. 2013, 34, 371–378. [Google Scholar] [CrossRef]
  19. Lin, Y.; Chen, S. Search of three-dimensional slip surface for slope based on finite element calculation. Rock Soil Mech. 2013, 34, 1191–1196. [Google Scholar] [CrossRef]
  20. Gao, W.; Zhang, F. Study of applications of meeting ant colony algorithm to search non-circular critical slip surface of slope. Rock Soil Mech. 2014, 35, 391–398. [Google Scholar] [CrossRef]
  21. Gao, W.; Zhang, L.; Zhang, F. Critical slip surface searching for slope based on premium-penalty ant colony optimization. J. Hydraul. Eng. 2012, 43, 209–215. [Google Scholar] [CrossRef]
  22. Xing, Y.; Wang, X.; Liu, F.; Gao, J. Study on the Search and Evaluation of the Most Dangerous Sliding Surface of Two-dimensional Slope. Subgrade Eng. 2021, 1, 14–18. [Google Scholar] [CrossRef]
  23. Guo, M.; Li, C.; Wang, S. Three-dimensional slope stability analysis based on finite element stress. Chin. J. Rock Mech. Eng. 2012, 31, 2494–2500. [Google Scholar]
  24. Guo, M.; Ge, X.; Wang, S.; Wang, H. Dynamic stability analysis of slope based on vector sum analysis method. Chin. J. Rock Mech. Eng. 2011, 30, 572–579. [Google Scholar]
  25. Guo, M.; Li, C.; Ge, X.; Wang, S.; Lv, Y. Searching potential slip surface of slopes based on the vector sum analysis method. Rock Soil Mech. 2009, 30, 1775–1781. [Google Scholar]
  26. Pang, R.; Xu, B.; Zhou, Y. Seismic time-history response and system reliability analysis of slopes considering uncertainty of multi-parameters and earthquake excitations. Comput. Geotech. 2021, 136, 104245. [Google Scholar] [CrossRef]
  27. Yu, X.; Wang, Y.; Wang, G.; Xue, B.; Zhao, X.; Du, X. Study on working behaviors and improvement strategies of concrete cutoff wall with slurry cake in thick soil foundation. Int. J. Geomech. 2022, 22, 04022075. [Google Scholar] [CrossRef]
  28. Liu, X.; Zou, D.; Liu, J.; Zheng, B.; Bai, J. A gradation-dependent particle shape factor for characterizing small-strain shear modulus of sand-gravel mixtures. Transp. Geotech. 2021, 28, 100548. [Google Scholar] [CrossRef]
  29. Xu, B.; Zhou, Y.; Zou, D. Numerical Simulation on Slabs Dislocation of Zipingpu Concrete Faced Rockfill Dam during the Wenchuan Earthquake Based on a Generalized Plasticity Model. Sci. World J. 2014, 2014, 572407. [Google Scholar] [CrossRef] [Green Version]
  30. Li, L.; Chu, X. Failure Mechanism and Factor of Safety for Spatially Variable Undrained Soil Slope. Adv. Civ. Eng. 2019, 2019, 8575439. [Google Scholar] [CrossRef]
  31. Kulhawy, F. Finite Element Analysis of the Behavior of Embankments. Ph.D. Thesis, University of California, Los Angeles, CA, USA, 1969. [Google Scholar]
  32. Czienkiewicz, O.; Humpheson, C.; Wlewis, R. Associated and non-associated visco-plasticity and plasticity in soil mechanics. Géotechnique 1975, 25, 671–689. [Google Scholar] [CrossRef]
  33. Donaldi, B.; Tanc, P. Stability of geomechanical structures assessed by finite element method. In Proceedings of the Second International Conference on Computing in Civil Engineering, Hangzhou, China, 5–9 June 1985; Science Press: Beijing, China, 1985. [Google Scholar]
  34. Shao, L.; Liu, S. Extension of limit equilibrium conditions and stability analysis of geotechnical structures. Rock Soil Mech. 2015, 36, 71–75. [Google Scholar]
  35. Shen, J.; Karakus, M. Three-dimensional numerical analysis for rock slope stability using shear strength reduction method. Can. Geotech. J. 2014, 51, 164–172. [Google Scholar] [CrossRef]
  36. Liu, J.; Zou, D.; Kong, X. A two-mechanism soil-structure interface model for three-dimensional cyclic loading. Int. J. Numer. Anal. Met. 2020, 44, 2042–2069. [Google Scholar] [CrossRef]
  37. Kong, X.; Lou, S.; Zou, D.; Jia, G.; Han, G. The equivalent dynamic shear modulus and equivalent damping ratio of rockfill material for dam. J. Hydraul. Eng. 2001, 8, 20–25. [Google Scholar]
  38. Wang, Y.; Li, J.; Wu, Z.; Chen, J.; Bian, K. Dynamic Risk Evaluation and Early Warning of Crest Cracking for High Earth-Rockfill Dams through Bayesian Parameter Updating. Appl. Sci. 2020, 10, 7627. [Google Scholar] [CrossRef]
  39. Huang, C.; Tsai, C. New method for 3D and asymmetrical slope stability analysis. J. Geotech. Geoenviron. 2000, 126, 917–927. [Google Scholar] [CrossRef]
  40. Pang, R.; Xu, B.; Zhou, Y.; Zhang, X.; Wang, X. Fragility analysis of high CFRDs subjected to mainshock-aftershock sequences based on plastic failure. Eng. Struct. 2020, 206, 110152. [Google Scholar] [CrossRef]
Figure 1. Stress state of tetrahedral PABC.
Sustainability 14 06671 g001
Figure 2. FEMSTABLE-3D software flow chart.
Sustainability 14 06671 g002
Figure 3. Dimensions and parameters of typical slope examples.
Sustainability 14 06671 g003
Figure 4. (a) 3D view; (b) 2D view. A typical example of ellipsoid sliding surface is given in this paper.
Sustainability 14 06671 g004
Figure 5. (a) 3D view; (b) 2D view. A typical example of ellipsoid sliding surface obtained by Chen Zuyu.
Sustainability 14 06671 g005
Figure 6. Calculation model of CFRD.
Sustainability 14 06671 g006
Figure 7. The acceleration curve.
Sustainability 14 06671 g007
Figure 8. The maximum acceleration along the river of the cross-section of the dam (m/s2).
Sustainability 14 06671 g008
Figure 9. The maximum vertical acceleration of the cross-section of the dam (m/s2).
Sustainability 14 06671 g009
Figure 10. Time-history curve of safety factor.
Sustainability 14 06671 g010
Figure 11. (a) static; (b) dynamic. Cloud chart of minimum safety factor.
Sustainability 14 06671 g011
Figure 12. (a) Static stability; (b) Dynamic stability. Schematic diagram of sliding surface of dam slope.
Sustainability 14 06671 g012
Figure 13. Failure surface position of dam interruption surface.
Sustainability 14 06671 g013
Table 1. Program calculation time.
Number of Elements/PieceNumber of Sliding Surfaces/PieceNumber of Seismic Wave Calculation Time/PieceSerial Calculation Time/hParallel Computing Time/h
149,98441,0399003.70.5
Table 2. Parameters of Duncan E-B model for static analysis
ρ d   ( kg / m 3 ) φ 0   ( ° ) Δ φ   ( ° ) KnRfKbm
2150528.511000.350.826000.1
Table 3. Calculation results of ellipsoid sliding surface.
Calculation Example (Year)Computing MethodSafety Factor
Zhang Xing (1988)Three-dimensional limit equilibrium analysis method2.122
Chen Zuyu (2003)Three-dimensional limit equilibrium analysis method2.187
Fang Jianrui (2007)Direct Search Method for 3-D Finite Element2.386
Zhang Changliang (2008)Three dimensional Sarma method2.241
Zheng Yingren (2010)Strength reduction method—(M-C)2.150
Strength Reduction Method—Inner Corner Point Outer Circle2.217
Strength Reduction Method—Outer corner point circumference2.489
Wang Ke (2013)Improved three-dimensional limit equilibrium analysis method2.213
This PaperFinite element sliding surface stress method2.214
Table 4. Parameters of equivalent visco-elastic model for dynamic analysis.
Kn υ
23390.50.33
Table 5. Parameters of bedrock and face slab.
Material TypeModulus of Elasticity (GPa)Poisson’s Ratioρ
(kg /m3)
Bedrock20.00.2502600
Concrete face material25.50.1672400
Publisher’s Note: MDPI stays neutral with regard to jurisdictional claims in published maps and institutional affiliations.

