Abstract
There are numerous coal mines around the Nansi Lake Provincial Nature Reserve, and the mineral resources are extremely rich. Therefore, it is necessary to effectively assess the impact of mining activities on the topsoil. Based on a focused investigation of the contamination status and ecological risks of the Nansi Lake Nature Reserve assisted by GIS, principal component analysis was combined with positive matrix factorization to quantitatively identify the sources and contributions of heavy metal(loid)s in the topsoil before conducting uncertainty analysis. The results showed that coal mining caused higher Cu, Zn, and As contamination levels, while Hg and Cd had higher eco-toxicity and biological sensitivity. Meanwhile, principal component analysis (PCA) and positive matrix factorization (PMF) modeling displayed that Hg (59.2%) was primarily generated by industrial sources (fossil fuel combustion and mercury-containing wastewater); As (70.2%), Ni (65.6%), Cr (63.5%), Pb (61.3%), Cu (60.3%), and Zn (55.8%) were generated mainly from coal mining and processing, coal fossil fuel combustion, and coal gangue dumps; Cd (79.8%) came mainly from agricultural sources. Through uncertainty analysis, the contribution of contamination sources to the heavy metal(loid)s in the topsoil, as estimated by the PMF model, was shown to be quite different. Moreover, heavy metal(loid)s with lower contributions had errors in source identification and factor quantification. This study innovatively warned management to control the hazards of heavy metal(loid)s caused by mining engineering to protect the environment of the Nansi Lake Nature Reserve and revealed the potential harmful pathways of heavy metal(loid)s.
1. Introduction
The original meaning of heavy metal(loid)s refers to metals with a specific gravity greater than five. In chemistry, to distinguish heavy metal(loid)s from light metals, 45 metals with a density greater than 4.5 g/cm3, such as Au, Ag, Cu, Co, Cd, etc., are defined as heavy metal(loid)s; in the field of environmental contamination, heavy metal(loid)s include Cu, Zn, high-density Ni, the metalloid As, and Hg, Cd, Pb, and Cr with potential toxicity [1,2]. heavy metal(loid)s are ubiquitous due to their unique persistence, irreversibility, toxicity, ecological risk, carcinogenicity, and bioaccumulation [3]. heavy metal(loid)s mostly exist as suspended solids in surface water, groundwater, soil parent materials, and sediments. They can be transported, transferred, and accumulated to plants, animals, and humans through food chains or food webs, thus posing potential threats to human health and risks to the environment [4,5,6,7,8]. Therefore, it is necessary and feasible to research the contamination status and source apportionment of heavy metal(loid)s in soils within nature reserves.
The Nansi Lake Provincial Nature Reserve consists of four lakes: Weishan Lake, Zhaoyang Lake, Dushan Lake, and Nanyang Lake. The area has an advantageous geographical location, typical wetland ecosystem, rich biodiversity, and a unique natural landscape. There are many coal mines in the area, and the coal resources are extremely rich. In the process of coal mining, storage and shipment, dust, coal gangue, industrial waste residue, harmful gas, sewage, and waste liquid will be produced, and the harmful elements will pollute the atmosphere, soil, surface water and groundwater after diffusion, flying and chemical reaction. It even induces a series of ecological and environmental problems such as the destruction of land resources, vegetation degradation, reduction of water sources, and damage to biodiversity. Because of these factors, the area has high conservation and scientific research value. Due to its uniqueness and representativeness, this area has attracted many researchers. Some studies have explored the spatial distribution characteristics and ecological risks of heavy metal(loid)s in the surface sediments of the Nansi Lake Basin and found that the contamination and risks caused by Tl, Cr, Cu, Ni, and Cd were relatively high [9,10,11,12]. It was found that the sediment quality is susceptible to the impacts of heterologous and anthropogenic contamination [12]. More notably, total organic carbon (TOC), organic phosphorus (OP), total nitrogen (TN), total phosphorus (TP), NH4+, PO43−, and NO3− were directly related to the metal contamination and nutrient content of ecosystems [13,14]. In addition, some researchers have established a water resource management model after weighing, coordinating, and quantifying the hydrological ecosystem and reasonably allocating the water volume of Nansi Lake [15,16].
There are many methods for the assessment of heavy metal contamination in soil; these include the single-factor evaluation method, multi-factor evaluation method, Nemerow index method, fuzzy comprehensive evaluation method, Geoaccumulation index, enrichment factor, the new non-residual fractions enrichment factor, pollution load index, health risk assessment, ecological risk assessment, etc. [3,13]. For the source apportionment of heavy metal(loid)s, Irving et al. [17] first proposed a model to clarify the contribution of emission sources to receptors in polluted areas. Receptor models include the chemical-statistical method, physical method, and microscopic method, among which the chemical-statistical method is the most mature and widely used [18]. Chemical-statistical methods include geostatistical analysis, principal component analysis (PCA), factor analysis (FA), absolute principal component scores (APCS), multiple linear regression (MLR), chemical mass balance (CMB), redundancy analysis (RA), self-organizing maps (SOM), UNMIX modeling, random forest (RF), support vector machine (SVM), isotope labeling method, double source analysis method, back-propagation (BP) neural network, Fisher discriminant analysis, and cluster analysis (CA) [3,19,20,21,22]. At the same time, supplementing the analysis with GIS to evaluate the content characteristics and spatial variability of heavy metal(loid)s in the soil helps differentiate between natural and anthropogenic sources and assesses the nature of the disturbance and relative contribution of human activities [23].
However, few studies on the impact of coal mining activities on the environment of the Nansi Lake Nature Reserve are currently available and further investigation is needed. For example, previous studies have mainly focused on the contamination of harmful elements in the surface sediments of the Nansi Lake Basin and rarely addressed the effects of heavy metal(loid)s in the topsoil. Especially lacking is systematic research on source apportionment of heavy metal(loid)s in the concentrated coal mining areas around Nansi Lake. In addition, previous studies have not quantitatively identified source contributions and performed an uncertainty analysis. The reason for this deficiency is that contamination sources may come from historical sources that have disappeared or been concealed; or as a consequence of multiple physical, chemical, and biological reactions that occurred during transportation and accumulation that may not have retained the clear characteristics of their emission sources, making them difficult to track [24]. Therefore, this work combines principal component analysis (PCA) with Positive Matrix Factorization (PMF) to quantitatively identify the sources and contributions of heavy metal(loid)s based on the focused investigation of contamination status and ecological risks in the Nansi Lake Nature Reserve. This study further performs an uncertainty analysis, which is of less concern than source apportionment.
2. Materials and Methods
2.1. Study Area and Site Description
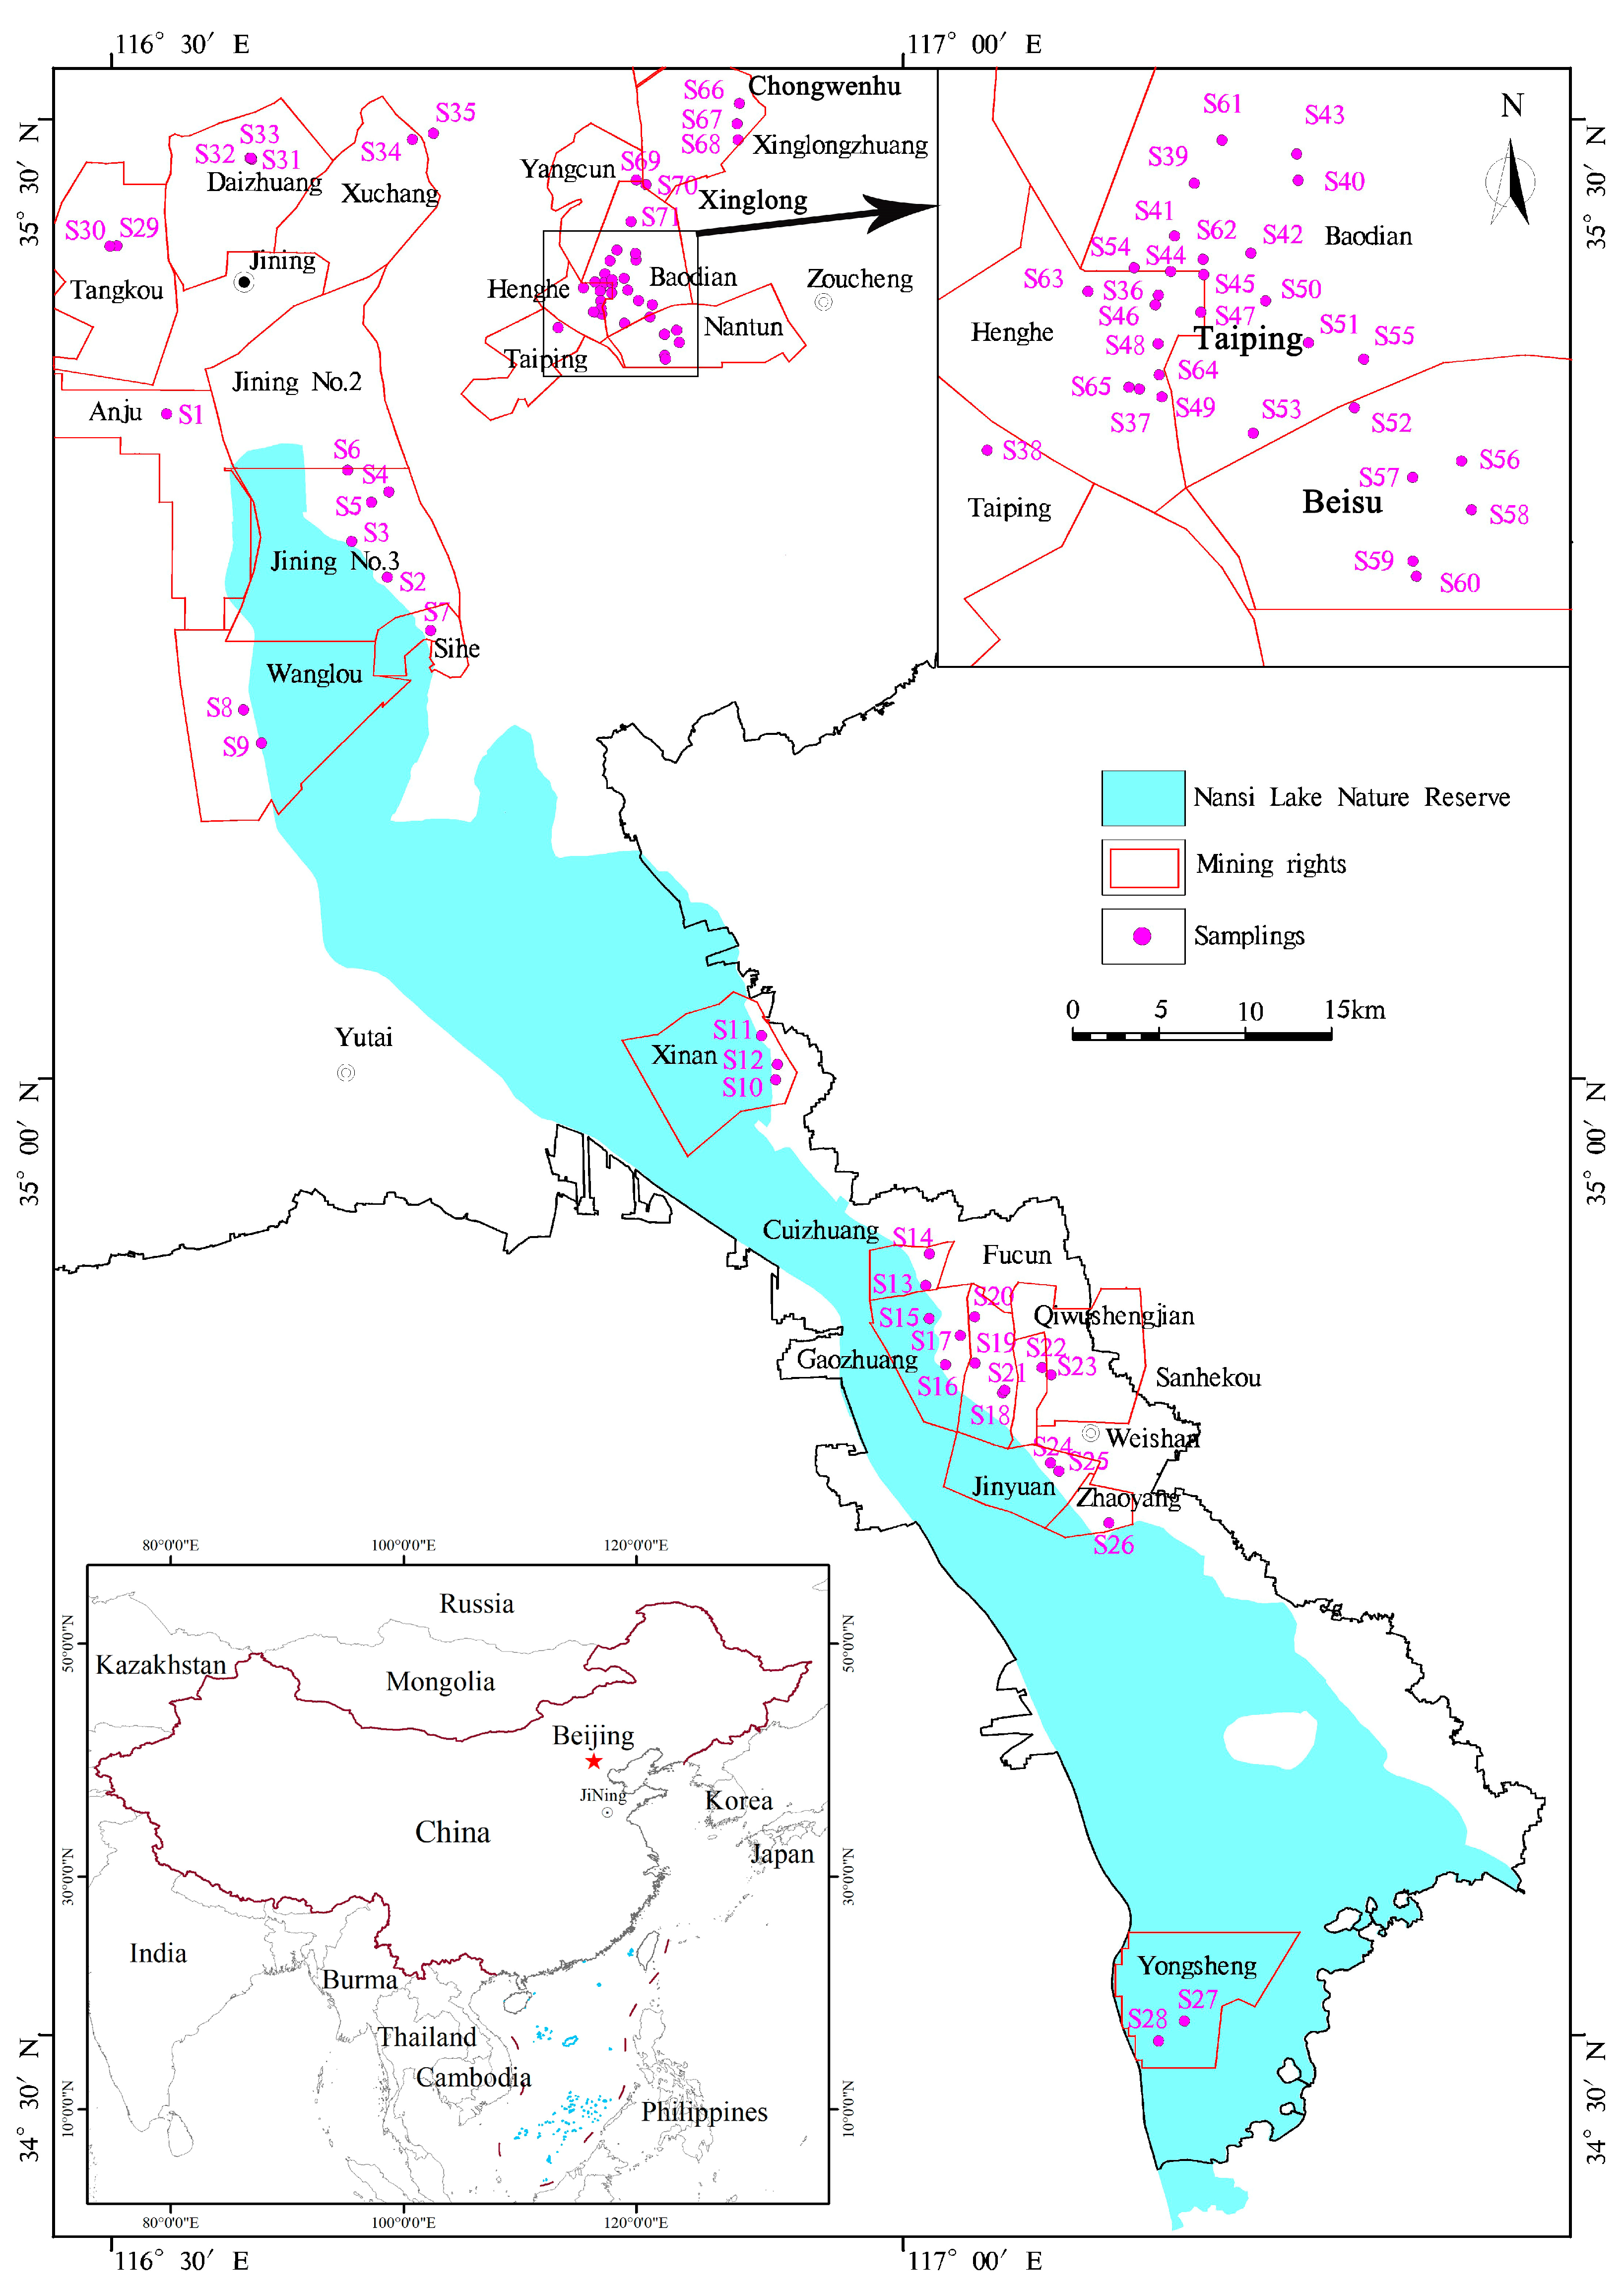
The Nansi Lake Provincial Nature Reserve is located to the south of Jining City, Shandong Province (34°23′54″–35°26′06″ N, 116°23′26″–117°34′08″ E), with an area of about 517 km2 (Figure 1). The district has an optimal geographical location and a convenient transportation system. The well-developed water system belongs to the Nansi Lake water system in the Huaihe River Basin. The study area is located in the accumulation plain area in southwestern Shandong Province. Plain depressions dominate the terrain, and its elevation is high in the northeast and low in the southwest, with an average of 36.5 m. The landform is an alluvial-proluvial plain. The strata in this area belongs to the division of the North China Stratigraphic Region in western Shandong Province. The tectonic unit is located in the Southwest Shandong Uplift of the North China Plate. Nansi Lake is affected by tectonic movements and developed faults. The study area belongs to the warm temperate semi-humid monsoon climate zone, with four distinct seasons, rain and heat in the same season, drought in the spring, flooding in summer, and drought in late autumn. The average annual precipitation is 712 mm, and the average relative humidity is 67.4%. Light and heat are abundant. The annual average temperature is 15.8 °C, the highest temperature appears in June, about 38.6 °C; the lowest temperature appears in December, about –11.4 °C, the maximum frozen soil depth is 0.6 m, and there are 2727 h of annual sunshine. The frost-free period is 199 days, the average wind speed is 1.9 m/s, and the average air pressure is 1011 hPa.
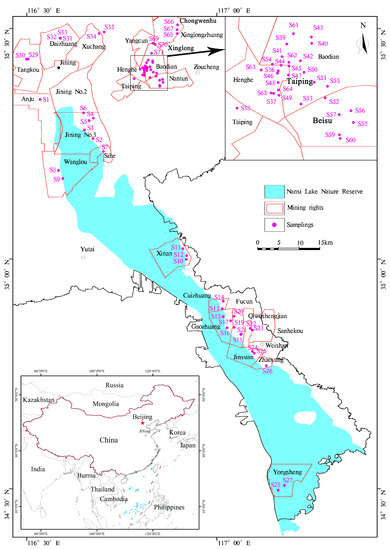
Figure 1.
Overview of study area and distribution of sampling sites.
The study area has a high concentration of coal mines and is rich in coal resources. The total area of mines in the investigated area is 520 km2. The mining rights of coal mines associated with the Nansi Lake Provincial Nature Reserve include eight large-scale coal mines (Anju Coal Mine, Jining No. 3 Coal Mine, Wanglou Coal Mine, Xin’an Coal Mine, Cuizhuang Coal Mine, Gaozhuang Coal Mine, Fucun Coal Mine and Jin Yuan Coal Mine), three medium-sized coal mines (Sihe Coal Mine, Sanhekou Coal Mine and Yongsheng Coal Mine), and one small-scale coal mine (Zhaoyang Coal Mine). Among these, four coal mines have an annual output of more than 2.7 million tons, and Jining No. 3 Coal Mine has a production capacity of 6.6 million tons. The Anju Coal Mine, Cuizhuang Coal Mine, and Sanhekou Coal Mine have withdrawn from the nature reserve. In addition, Yongsheng Coal Mine has not been put into production so far. Due to mining activities, a series of mine-related ecological environment problems have occurred in and around the Nansi Lake Nature Reserve, such as goaf collapse, a sharp drop in groundwater levels, ground subsidence, aquifer damage, the accumulation of waste residue, water and soil contamination, and so on. The ecological environment, soil and water environment and geological environment of the Nansi Lake Nature Reserve and the surrounding areas have become heavily polluted. However, the population adjacent to the study area is dense and highly concentrated. Due to human activities linked to industrial and mining operations, this has brought problems such as cardiovascular disease and cancer, resulting in great risks to human health, productivity and life. The study area plays an important role in supporting the everyday life and work for people nearby, hence studying the heavy metal(loid)s distribution and source apportionment are with major significance.
The sampling points of topsoil (5–15 cm) are located in typical mining areas (Anju Coal Mine, Jining No. 3 Coal Mine, Sihe Coal Mine, Wanglou Coal Mine, Xin’an Coal Mine, Cuizhuang Coal Mine, Gaozhuang Coal Mine, Fucun Coal Mine, Sanhekou Coal Mine, Jinyuan Coal Mine, Zhaoyang Coal Mine, Yongsheng Coal Mine, Tangkou Coal Mine, Daizhuang Coal Mine, Xuchang Coal Mine, Henghe Coal Mine, Taiping Coal Mine, Dongtan Coal Mine, and Baodian Coal Mine) and wetland parks (Beisu Wetland Park, Taiping Wetland Park, Chongwen Lake Wetland Park, and Xinglong Wetland Park) (Figure 1). A Garmin GPS 62 sc was used to record the sites’ position and elevation, and a wooden spoon was used to collect soil randomly on non-rainy days by digging. After that, impurities such as gravel, minerals, and pebbles were removed. The original weight of the soil was more than 1 kg. The soil was stored in a self-sealing polyethylene bag, labeled, and shipped to the laboratory. The samples were then stored at room temperature, away from light and dust.
2.2. Sample Preparation and Chemical Analysis
The topsoil samples were quartered and sieved with a nylon sieve of less than 2 mm to remove sand, gravel, plant debris, and other impurities before being placed in a cool and dark environment at room temperature (20–23 °C) with a relative air humidity of 20–60%. The samples were then naturally air-dried to constant weight. They were finely ground with an agate ball mill and homogenized to meet the requirements of homogeneous and dense materials. Finally, the processed samples were placed in glass bottles with screw caps or polyethylene containers for sealed storage and labeled to indicate the sample information. The soil samples were tested by Shandong Lunan Geological Engineering Survey Institute. The pH was determined by the glass electrode method using a Metter Toledo pH meter [25]. For Cd, Pb, Cu, Ni, Cr and Zn, the topsoil samples were acid-digested in a microwave system (target temperature 180.0 °C, temperature accuracy ±2.5 °C), and then an inductively coupled plasma mass spectrometer (Agilent 7900) was used to determine the concentration [26,27]. In addition, after acid-digested in a microwave system of the topsoil samples, the concentrations of As and Hg were tested by using an atomic fluorescence spectrometer (AFS-8330) [28]. The principle of the method is as follows: after acid-digested in a microwave system of the topsoil samples, the solution enters the atomic fluorescence spectrometer. Under the action of potassium borohydride solution reduction, Arsine is generated and Hg is reduced to atomic state. The ground state atoms are formed in the argon-hydrogen flame, and the atomic fluorescence is generated under the excitation of the emitted light. The atomic fluorescence intensity is proportional to the element content. For the calibration of As and Hg, take 0.50, 1.00, 2.00, 3.00, 4.00 and 5.00 mL of As (Hg) standard solution in a 50 mL volumetric flask. Then add 10.0 mL of thiourea and ascorbic acid mixture, and 5.0 mL of hydrochloric acid (only 2.5 mL hydrochloric acid for Hg). After placing it at room temperature for 30 min, make up to the mark and mix well. The relative standard deviation (%) is 0.67–8.91 for As and 1.44–11.7 for Hg. The relative standard deviation (%) is −7.5–4.7 for As and −12.5–12.5 for Hg. The detection limit of As for this method is 0.01 mg/kg, and the lower limit is 0.04 mg/kg. The detection limit of Hg is 0.002 mg/kg, and the lower limit is 0.008 mg/kg.
2.3. Contamination Assessment and Potential Ecological Risk
The geoaccumulation index (Igeo) was first proposed by Muller to study the heavy metal contamination in sediments [29]. Experts have since widely used it to assess the degree of heavy metal contamination in soil. The Igeo value was calculated as:
where Ci is the measured concentration of heavy metal(loid)s in soil (mg/kg), and Bi is the geochemical background value of reference elements in local soil (mg/kg). The constant 1.5 is used to explain the potential changes in background values. According to the recommended thresholds for Igeo, the contamination level of heavy metal(loid)s can be classified into seven grades (Table S1).
The pollution index (PI) of a single element and the pollution load index (PLI) of all heavy metal(loid)s which contributed to the contamination level were calculated according to the following formulas [30]:
where PI1, PI2, …, PIi are PI of elements 1, 2, …, i. The contamination categories of PI and PLI are described in Table S2.
The potential ecological risk assessment reflects the toxicological effects, the degree of risk, and its response to the environment of heavy metal(loid)s in soil. Following the formulas proposed by Hakanson, the potential ecological risk index of a single metal (Eri) and all metals (RI) can be expressed by Equations (4) and (5) [31]:
where Tri is the toxicity coefficient for a certain heavy metal. The Tri of Hg, As, Cd, Cr, Cu, Ni, Pb, and Zn were 40, 10, 30, 2, 5, 5, 5, and 1, respectively [31]. The ecological risk recommended thresholds and classification standards are summarized in Table S3.
2.4. Positive Matrix Factorization (PMF) Model Analysis
Positive Matrix Factorization (PMF) is a relatively mature and novel quantitative source apportionment mathematical receptor model first proposed by Paatero and Tapper [32] in the field of environmental contamination. It can analyze a wide range of environmental sample data such as aerosols, ambient air poisons, PM2.5, volatile organic compounds, surface water, wet deposition, and sediments [33]. PMF is mainly applied for the identification of source types and the quantitative apportionment of source contributions. Source types are identified by comparing source compositions to configuration profiles; source contributions are used to measure the contribution of each source. The PMF model is essentially a regression modeling method of positive matrix factorization, which assigns and estimates the contribution of pollution sources to soil heavy metal(loid)s by solving the chemical mass balance equation. Based on the principle of factor analysis, the PMF model uses the composition of the source to quantify the contribution of the source to the sample for data analysis. It finds the global minimum objective function through multiple iterations and reduces the value of the residual matrix to be as small as possible to find the most reasonable number of factors and the most optimal factor contributions to ensure that the simulation results and the measured results have an improved relationship. The raw uncertainty values are multiplied by a lognormal distribution with a mean of one and a standard deviation equal to 0.25, 0.50, or 0.75. The generated random multipliers create a perturbation uncertainty matrix [34]. The coefficient of determination (R2) is used to measure the contribution of different sources. The normalized gross error (NGE) and root mean squared error (RMSE) are used for source accuracy estimation. This process is implemented by the positive matrix factorization model (version 5.0) developed by the Environmental Protection Agency.
The PMF model allocates contributions through the following mass balance equation:
where eij is the residual for each sample. The i × j -dimensional data matrix, x, can be decomposed into a factor contribution matrix g and factor distribution matrix f. The indices, i and j, represent samples and chemical substances, respectively. gik is the contribution of factor k to sample i; fkj is the content of chemical substance j in factor k.
The objective function, Q, is given by:
and represents the “goodness of fit” between the predictions and observations. Two versions of Q are exhibited for the model runs. Q(true) is the calculated goodness-of-fit parameter, including all points; Q(robust) is the calculated goodness-of-fit parameter, excluding unfit points, defined as samples with an uncertainty scale residual greater than four. The parameter, uij, is defined as the uncertainty of substance j in soil sample i.
In general, the uncertainty of the solution may be composed of modeling errors, random errors in the data, and rotational ambiguity caused by multiple PMF solutions with similar Q at the same time [35]. The calculation principles and expressions of uncertainties for each specific species are as follows:
where Unc is the uncertainty, σ is the Error Fraction, and MDL is the species-specific method detection limit. If the concentration is greater than the MDL, Unc is estimated by a provided fraction of the MDL and the concentration (Equation (8)); in contrast, if the concentration is less than or equal to the MDL, Unc is calculated by a fixed fraction of the MDL in Equation (9), and species concentrations below the MDL are replaced by half of the MDL [36].
The obvious insufficiency of PMF for source apportionment is that the selection of a reasonable number of factors is not unique and will affect the source apportionment results. When the number of factors is too large, there will be a non-existent source or the source will be decomposed into multiple cases; if the number of factors is too small, multiple sources will be merged into one. Compared with principal component analysis, this method has the advantages of quantifying the source apportionment, avoiding the unexplainable consequences of factor loading, and having its own bootstrap uncertainty analysis function. At the same time, it has strong visualization and easy operation.
3. Results and Discussion
3.1. Contamination and Spatial Distribution of Heavy Metal(loid)s
Descriptive statistics for heavy metal concentrations indicated that the mean and median values of Cd, Cr, and Pb were less than their corresponding background values, while those of Hg, As, Cu, Ni, and Zn were higher than the background values of the Nansi Lake Nature Reserve (Table 1). In particular, for As, Cu and Zn, the proportion of samples with concentrations above the background values was higher than 56%. Moreover, the coefficient of variations generally decreases in the order of Hg > Cd > Cr > As > Cu > Zn > Ni > Pb. Generally speaking, if the mean or median value of a certain heavy metal is higher than its background value and the coefficient of variation is greater than 0.2, we consider that the metal in the soil has been affected by human activities [37]. Furthermore, the spatial distribution map of concentration showed that the heavy metal(loid)s of As, Cu, Zn, Cd and Ni presented a relatively high concentration near coal mines (Figure 2). These heavy metal(loid)s in topsoil have a large spatial variability. In summary, the research area was significantly affected by human activities, especially mining activities. The mean concentration levels of all heavy metal(loid)s were significantly lower than the risk intervention values for soil contamination of development land, indicating that under the existing land use, heavy metal(loid)s did not present unacceptable risks to human health, and no risk control or remediation measures were required [38]. However, only Cr was higher than the risk screening value, which indicated that Cr might pose risks to human health. Moreover, risks to human health from other heavy metal(loid)s are negligible [38]. Further detailed investigation and risk assessment should be carried out to determine its contamination level and risk grade. Overall, the above results showed that Hg, Cr, As, and Cu were the main heavy metal(loid)s of concern in the soils of Nansi Lake construction land.

Table 1.
Descriptive statistics of the heavy metal(loid)s.
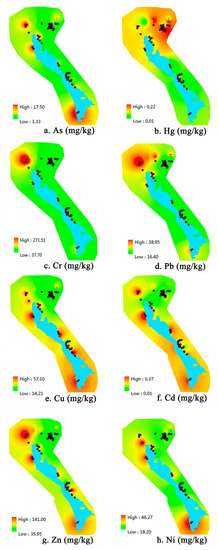
Figure 2.
Spatial distribution of heavy metal(loid) concentrations in the Nansi Lake Nature Reserve.
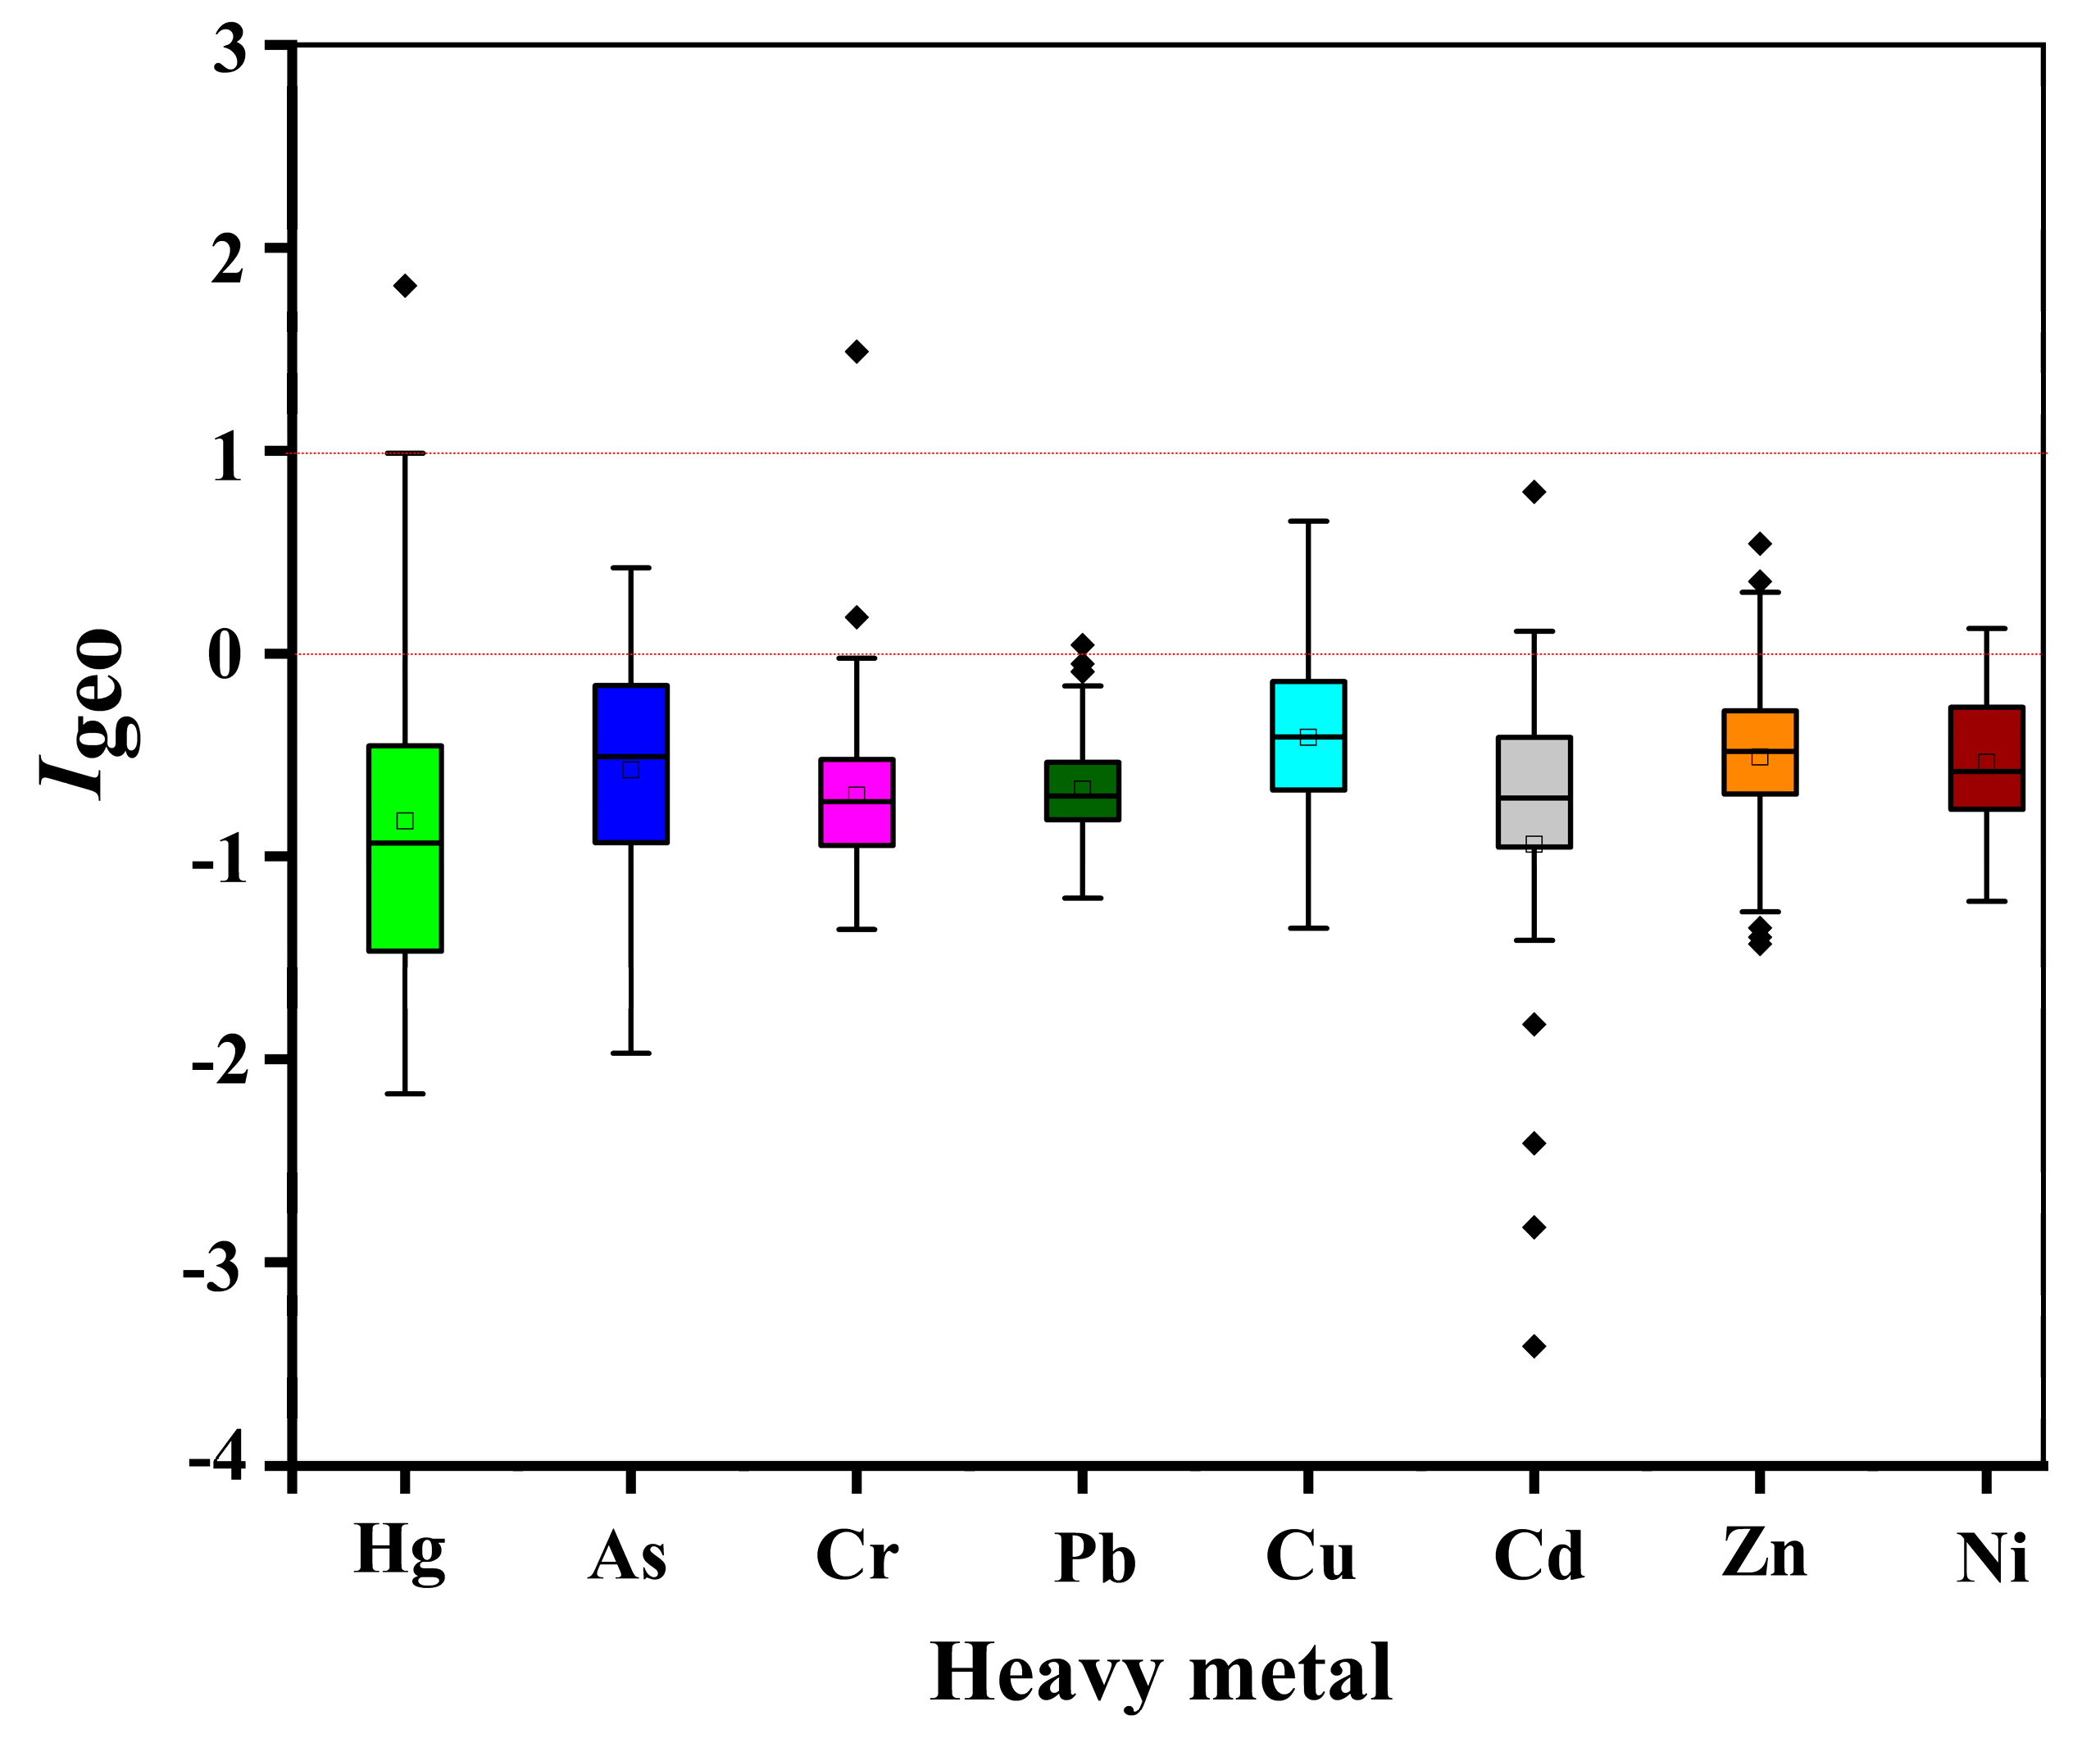
Figure 3 displays the distribution of Igeo values for the eight heavy metal(loid)s based on the classifications in Table S1 and shows that most soil samples were classified as Class 0 (Igeo ≤ 0), indicating that the study area was practically uncontaminated. Moreover, a few samples had Igeo values for Hg and Cr belonging to Class 2 (Moderately contaminated), and Cd and Zn had values belonging to Class 1 (Uncontaminated to moderately contaminated). Overall, the contamination levels of Igeo decreased in the order of Cu > As > Zn > Ni > Cr—Pb—Cd > Hg. These results indicated that human activities probably had a significant impact on the contents of Cu, As, Zn, and Ni.
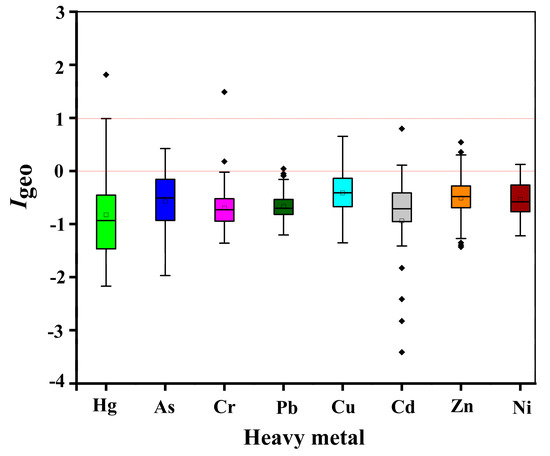
Figure 3.
Box plots for the contamination levels of heavy metal(loid)s.
The decreasing trend of the average PI value of topsoil heavy metal(loid)s in the Nansi Lake Nature Reserve is Cu (1.18) > Zn (1.10) > As (1.08) > Hg (1.02) > Cr (0.97) > Pb (0.96) > Cd (0.91). Except for Hg, the trend was basically consistent with the above Igeo results. It can be seen that the topsoil was subjected to moderate contamination or low contamination of heavy metal(loid)s (Table S2), and the contamination levels of Cu, Zn, and As were relatively high. The pollution load index (PLI) reflected the multi-element contamination enrichment and contamination. From the spatial distribution map of PLI in the study area, PLI values near the coal mines were relatively high, at the level of unpolluted to moderately polluted, which might be attributed to mining activities (Figure 4).
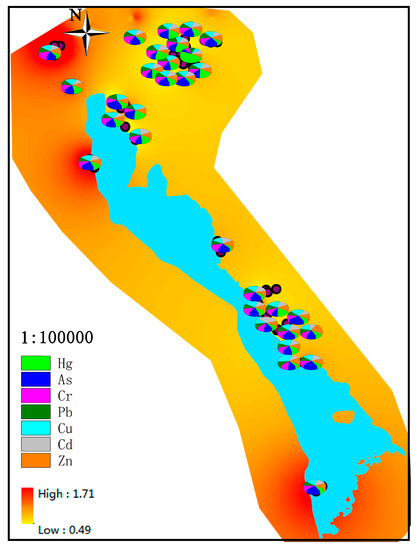
Figure 4.
Spatial distribution of PLI in the Nansi Lake Nature Reserve and the contribution of heavy metal(loid)s from different coal mines to PLI.
The spatial distribution of heavy metal(loid) concentrations and contamination characteristics in the Nansi Lake Nature Reserve showed that the contamination level of Sihe Coal Mine is low. All the coal gangue is used for backfilling underground goafs, realizing zero discharge of gangue. The mine has no seasonal and perennial water accumulation. On 31 December 2018, Sihe coal mine was closed due to policy. At present, there is no boiler waste residue, production waste, mine water and domestic sewage, and the harm to the environment is small. Similar to this, Zhaoyang Coal Mine was closed due to policy on 31 December 2017. At present, there is no coal gangue stacking and solid waste discharge, and the topsoil is less polluted. The As, Cu, Cd, Zn and Ni concentrations of Wanglou Coal Mine are relatively high. The mine has a large field area, huge reserves of resources and high mining intensity, which leads to frequent geological disasters, reduction or extinction of farmland production, goaf subsidence, perennial water accumulation, soil and water pollution. Wanglou Coal Mine produces 69,000 t/a of coal gangue, 637 t/a of boiler ash, and 165 t/a of domestic waste. A temporary gangue dump is set up in the No. 2 well. Affected by wind erosion and precipitation leaching, the dust will pollute the air, soil, and groundwater. Moreover, the concentrations of Cr and Ni in Anju Coal Mine, and Cu and Cd in Xin’an Coal Mine are high. The common characteristics of these two mines are large reserves and mine field area, and high approved production capacity. In addition, in the northwest of Sanhekou Coal Mine Industrial Plaza, there is a gangue dump, covering an area of 1.35 hm2. The coal gangue is 60,000 t/a, and the accumulated amount is as high as 204,000 t. Affected by this, the contents of Cu, Cd and Zn in topsoil is high. On the contrary, the concentrations of heavy metal(loid) in the coal mine agglomeration area in the northeastern part of the study area are low. This area includes four wetland parks, namely Beisu Wetland Park, Taiping Wetland Park, Chongwen Lake Wetland Park, and Xinglong Wetland Park. Wetlands have the functions of humid climate, slowing down water flow, intercepting nutrients, absorbing poisons, purifying water sources and improving water quality. It has significant effects on environmental improvement. The rest of the coal mines have no coal gangue and solid waste piled up, so the heavy metal pollution is not obvious.
The average Eri of heavy metal(loid)s in soil decreased in the order of Hg > Cd > As > Cu > Pb > Cr > Zn (Table 2), which was very different from the results of Igeo and PI. The fundamental reason was that the eco-toxicity of different heavy metal(loid)s was different. Taking Zn and Cd as examples, high concentrations of Zn have the lowest Er, while Cd with low contamination levels has a relatively high Er. It showed that if heavy metal(loid)s are highly toxic, low concentrations of heavy metal(loid)s would still pose a great risk to the ecological environment. On average, a mean risk factor of 85.73 contributed to 93.15% of all soil samples, classified as low ecological risk (RI < 150). Only five points presented moderate ecological risk (150 ≤ RI < 300) (Table S3). The potential ecological risk in the study area was generally low, and Hg has relatively high biological sensitivity and availability. Combined, determining the source of heavy metal(loid)s in the soil of the Nansi Lake Reserve is crucial for contamination control and environmental protection.
Table 2.
Potential ecological risk index of heavy metal(loid)s in the Nansi Lake Ecological Reserve.
3.2. Source Identification Using PCA
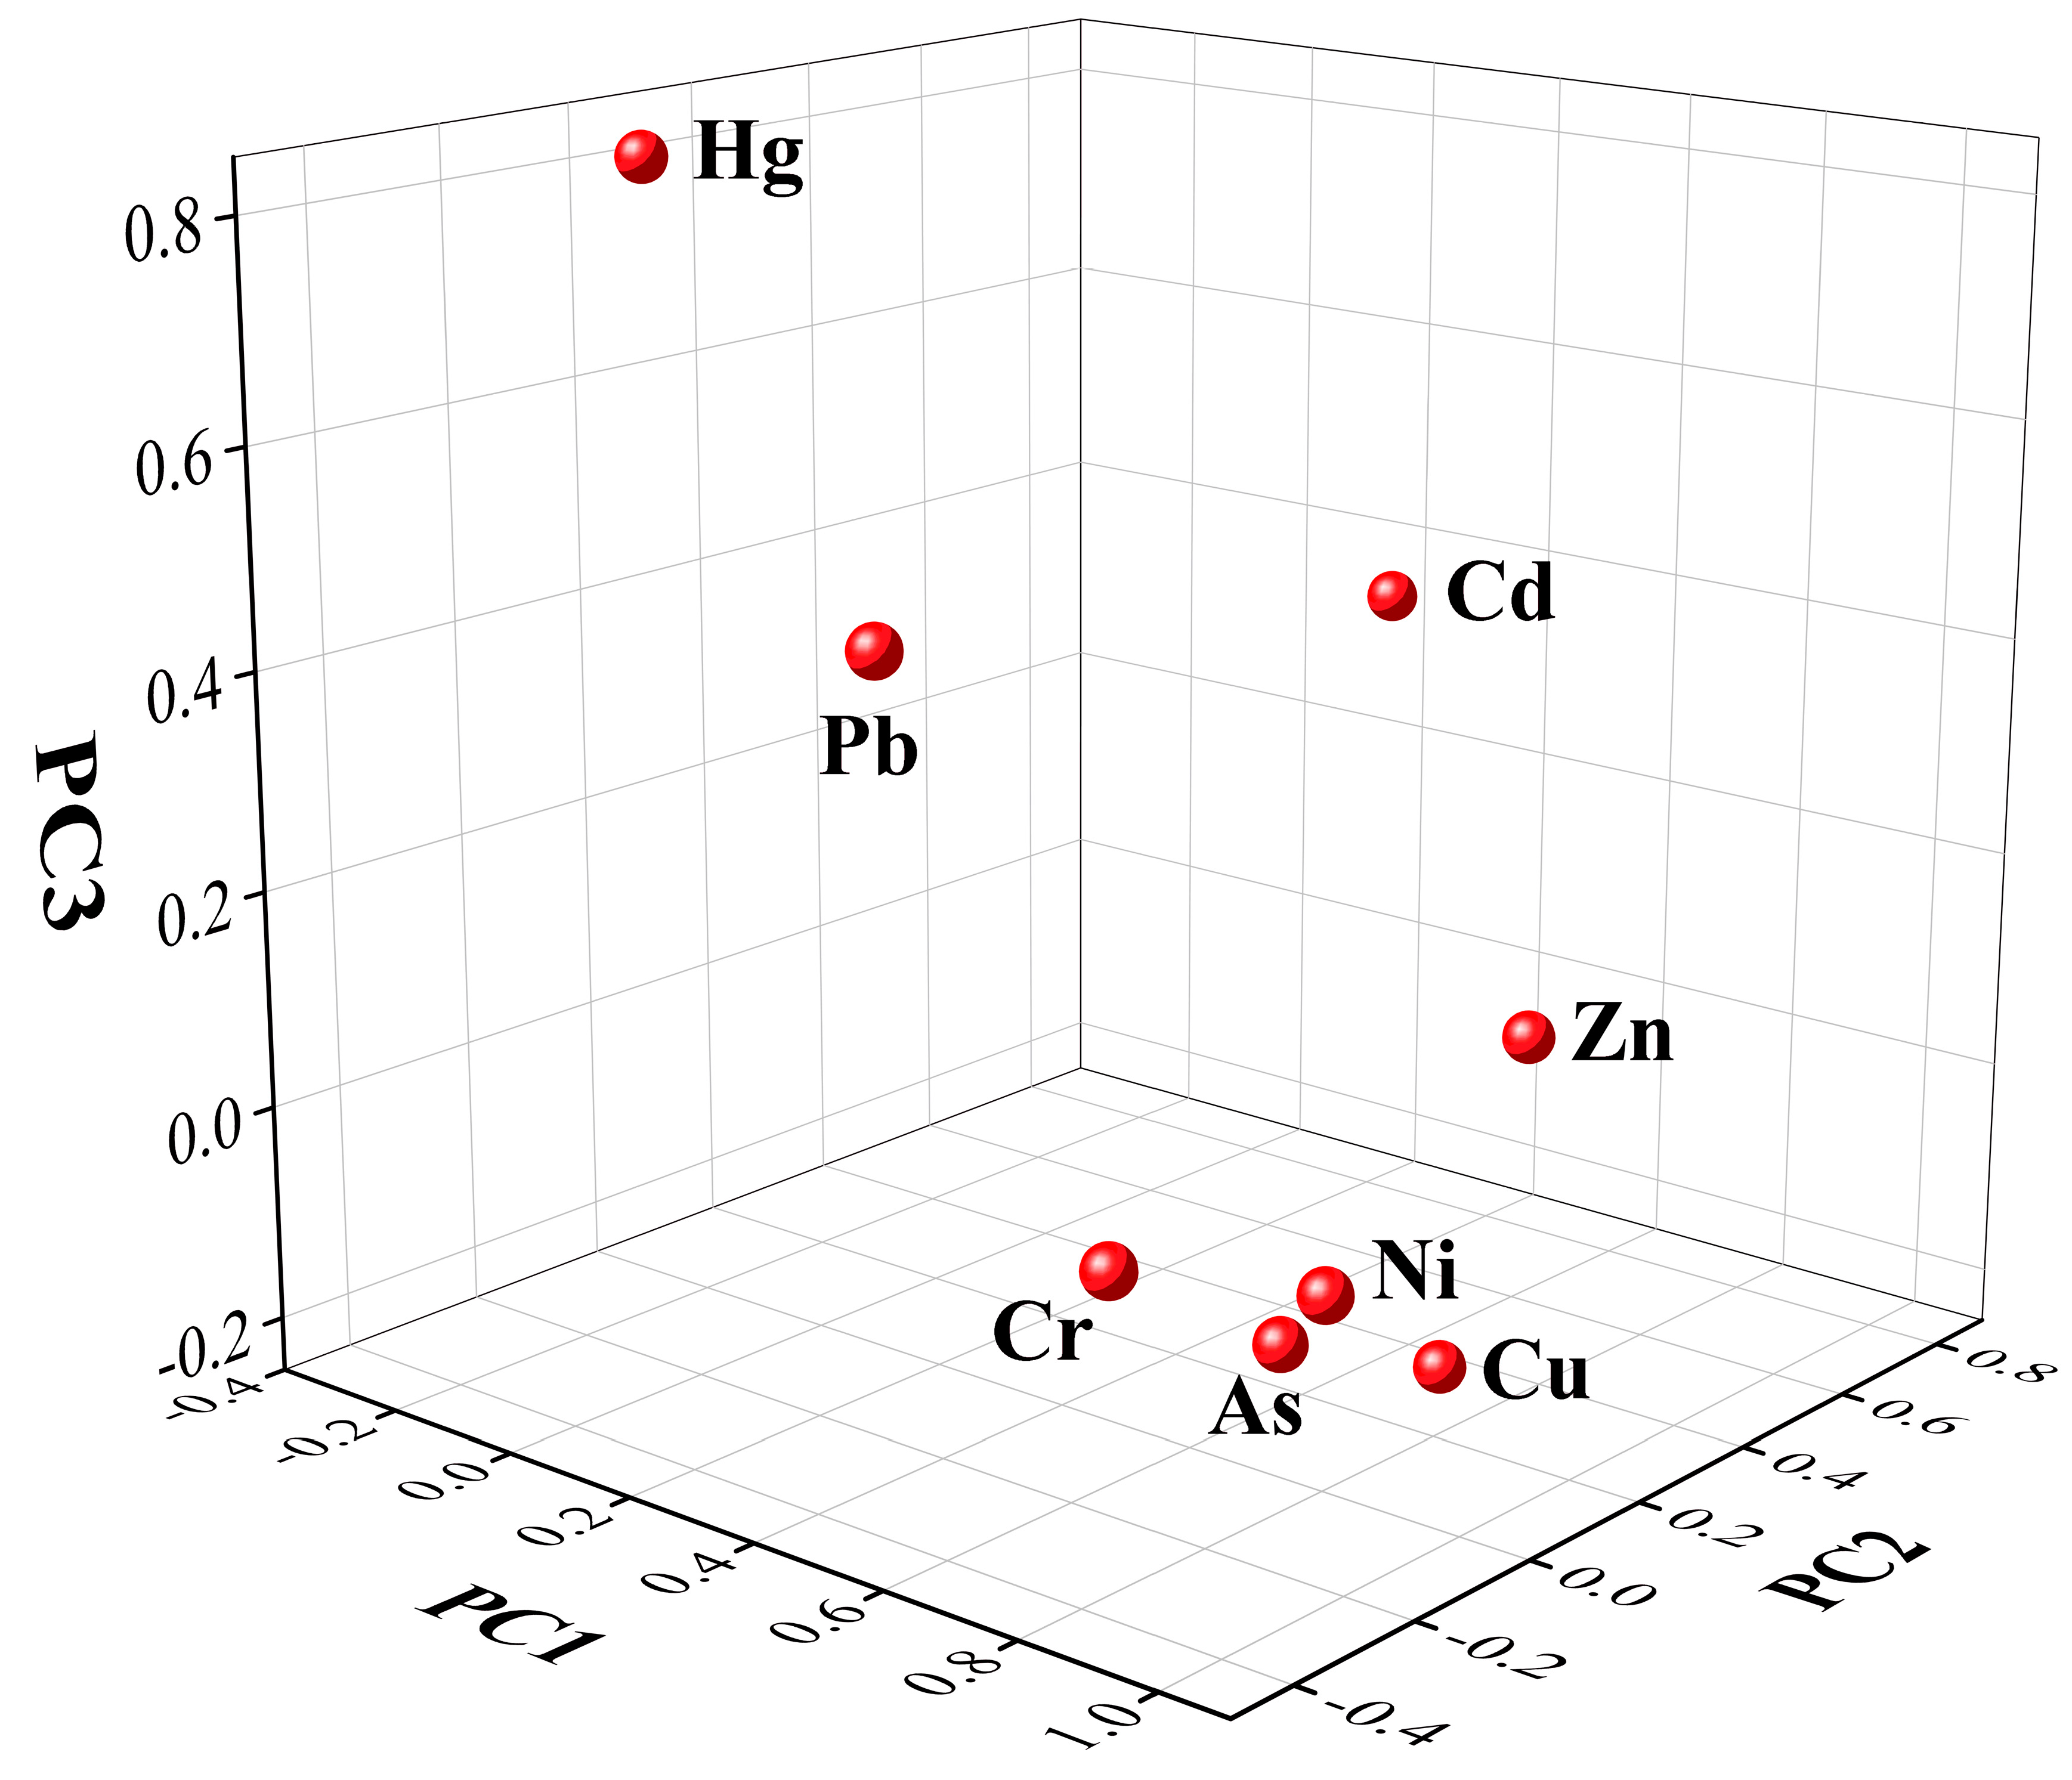
Based on the concept of dimensionality reduction, PCA is an optimal matrix decomposition method that converts the index information into principal components by using the least-squares method to maximize the retention of the original variable information [32]. Table 3 shows the correlation coefficients among eight heavy metal(loid)s in Nansi Lake area soils. Bartlett’s test of sphericity has a p value of 0.000, and the KMO sampling suitability measure is 0.7, which indicates a strong correlation between the metals and suitability for factor analysis. Generally speaking, the closer the positive correlation coefficient between two variables is to one, the stronger the correlation is, and it can be inferred that the two heavy metal(loid)s may come from the same source or are closely related. The correlation coefficients between Ni and Cr, As, Cu, and Zn in Table 3 are 0.924, 0.781, 0.622, and 0.576, respectively. The high correlation coefficients suggested that Ni and the four metals above might come from the same source. In addition, high values of correlation coefficients suggested that As and Cr, Cu, and Zn might have similar origins. Table S4 shows the variance explained by the initial components and the extracted VARIMAX-rotated components from the principal component analysis (PCA) of heavy metal(loid)s in the Nansi Lake area soils. The principal components of PC1, PC2, and PC3 explain 46.305%, 14.656%, and 14.050% of the total variance, respectively, which means that nearly half of the variables can be explained by PC1. The factor loadings in the composition matrix are displayed in Table 4 and Figure 5. The factor loadings above 0.71 (in bold) are generally considered excellent, while loadings below 0.32 (in italics) are considered very poor [39]. The factor loadings of Ni, Cr, As, Zn, and Cu in PC1 were 0.949, 0.838, 0.811, 0.750, and 0.732, respectively. This factor has the largest load on Ni and Cr. Coal mines are concentrated in the study area. Combined with the background values of the Nansi Lake Nature Reserve, it was inferred that Factor 1 is the source of mining activities [40]. However, PC3 was dominated by Hg (0.819), while Cd (0.751) was the main component of PC2. Cd concentrations in topsoil have a large spatial variability. Factor 3 was preliminarily identified as the source of atmospheric deposition due to the volatility of mercury vapor. Cd is closely related to pesticides, chemical fertilizers, phosphate fertilizers, and pesticides; therefore, it is inferred that Factor 2 reflects agricultural contamination sources [22]. Furthermore, the pattern of Pb was relatively vague, evidenced by factor loadings of 0.474 in PC1, −0.372 in PC2, and 0.508 in PC3.
Table 3.
Pearson correlation coefficient matrix.
Table 4.
Composition matrix in the principal component analysis of heavy metal(loid)s in the soil of the Nansi Lake area.
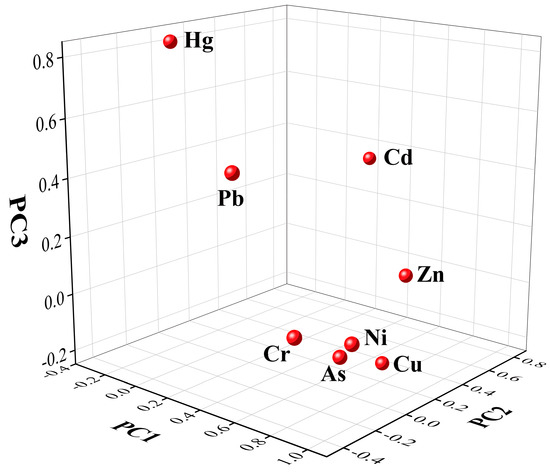
Figure 5.
Source analysis of heavy metal(loid)s by principal component analysis.
3.3. Quantitative Source Apportionment of Heavy Metal(loid)s
Heavy metal(loid)s in the topsoil of coal mines and wetland parks in the Nansi Lake Nature Reserve may originate from human factors such as industry, agriculture, transportation, and other anthropogenic influences, or natural factors such as soil parent material, rock origin, or bioclimatic conditions. PMF models were used to identify major sources of heavy metal(loid)s and quantify their contributions. By setting different numbers of factors, at least 20-factor iterations are performed for each setting to obtain the minimum goodness-of-fit parameter Q(Robust) (855.6) between the observed value and the predicted value, which is close to, or stable, at Q(True) (916.1) and Qexp (341.0) for all points. The best result appeared in the 20th iteration. The classification of the signal-to-noise ratio (S/N) of heavy metal(loid)s is strong, and the optimal number of factors is finally determined to be three, which is consistent with the principal components retained in PCA. The scaled residuals are between minus three and three, showing a normal distribution. The determination coefficients of all heavy metal(loid)s are greater than 0.5, especially the determination coefficients of Hg and Cd, which are as high as 0.995 and 0.988, respectively. The results fit well, indicating that the prediction results of the PMF model can explain the observed data well (Huang et al., 2019; Hu et al., 2020). Figure 6 shows the factor components and contamination source contributions of heavy metal(loid)s derived from the PMF model. Factor 1 accounts for 4.7% of the total source. Hg is a characteristic element, and its contribution rate is 59.2%; Factor 2 accounts for 63.5% of the total source and is dominated by As, Ni, Cr, Pb, Cu, and Zn, whose contribution rates are 70.2%, 65.6%, 63.5%, 61.3%, 60.3%, and 55.8%, respectively. In addition, the load of Cd 79.8% in Factor 3 (31.8%) is the highest (Table 5). Compared with the results in PCA, the indicated metals As, Cr, Cu, Zn, and Ni in Factor 2 are the same as metals in PC1. In addition, Factor 1 and Factor 3 correspond to PC3 and PC2, respectively. This result indicates that PMF and PCA have similar heavy metal traceability results [24]. Hg is contributed mainly by Factor 1. Hg is mainly emitted from industrial sources such as the combustion of fossil fuels or other hydrocarbon-based fuels [21]. Mercury-containing wastewater becomes mercury vapor through volatilization before it enters the soil and sediment around Nansi Lake through the pathway of atmospheric deposition. In Factor 2, As, Ni, Cr, Cu, Zn, and Pb are characteristic elements. These potentially toxic trace elements pose the most significant contamination and potential ecological risk in the topsoil of the Nansi Lake Nature Reserve. Thus, determining the source composition of Factor 2 is most important. Predecessors have conducted a lot of testing and research on the source of heavy metals. Arsenic (As) generally comes from mining activities, metal smelting, wood preservatives, feed additives, domestic waste discharge, industrial sewage, and sludge, and the unreasonable application of agricultural chemicals such as pesticides and fertilizers [41]; Ni comes from coal mining, non-ferrous metal smelting, metal electroplating, the coal chemical industry (including coal-to-gas and coal-to-oil processing); Cr generally comes from rock weathering and metal electroplating; Cu comes from ore smelting, metal mining, fertilizers, pesticides, fruit tree pesticides, fossil fuels, feed additives, motor fuels and components, abrasion, gasoline leakage, sewage and sludge, etc.; Zn mostly comes from industrial waste generated by mining activities, transportation such as automobile tire wear, industrial waste, processing of agricultural chemicals such as manure, phosphate fertilizers, and pesticides [22]; Pb originates from mining activities, combustion of fuels such as coal or leaded gasoline, and steel processing [24,42]. In summary, combining the contamination characteristics of these heavy metal(loid)s and previous research results, the As, Ni, Cr, Cu, Zn, and Pb elements correlated with Factor 2 were mainly sourced from coal mining and processing contamination, coal fossil fuel combustion, and coal gangue dumps. The Cd correlated with Factor 3 mainly originated from agricultural sources, such as pesticide use, chemical fertilizers, phosphate fertilizers, and sewage irrigation [21,22,43].
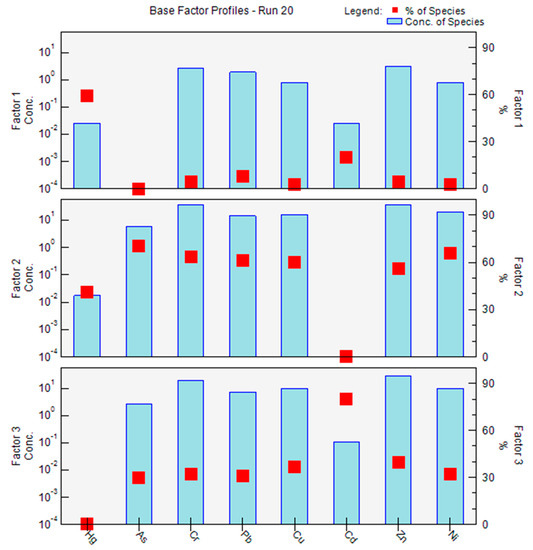
Figure 6.
Factor contents and contamination source contributions of heavy metal(loid)s derived from the PMF model.
Table 5.
The contributions of the three factors estimated by the PMF model.
The obvious shortcoming of the PMF model for source apportionment is that selecting a reasonable number of factors is not unique and will impact the results of source apportionment. If the number is too small, multiple contamination sources with similar contributions or high correlations will be merged into one, and the factor independence will be poor, resulting in the loss of source information. Additionally, there is large uncertainty in the obtained factor contribution, and the contribution degree of metals with a low factor contribution percentage is difficult to determine. Therefore, the PMF still needs to be improved and optimized. Compared with PCA, the advantages of PMF include its ability to quantify the source apportionment of heavy metal contamination in soil, its avoidance of the unexplainable consequences of factor loading, and its bootstrap uncertainty analysis function. Furthermore, it has the abilities of networking, modularization, structuring and self-adaptation, good quantification effects, strong visualization, and easy operation [21]. Collectively, the PMF model can quantitatively evaluate the different sources and contributions of heavy metal(loid)s in the soil of the Nansi Lake Nature Reserve. At the same time, the combination of statistical data analysis, contamination assessment, ecological risk assessment, and PCA and GIS mapping can serve to assist in the interpretation and accurate determination of the source composition of different factors and to minimize, or avoid, the consequences of incorrect traceability results due to similar or highly correlated contamination sources.
3.4. Uncertainty Analysis in Source Apportionment
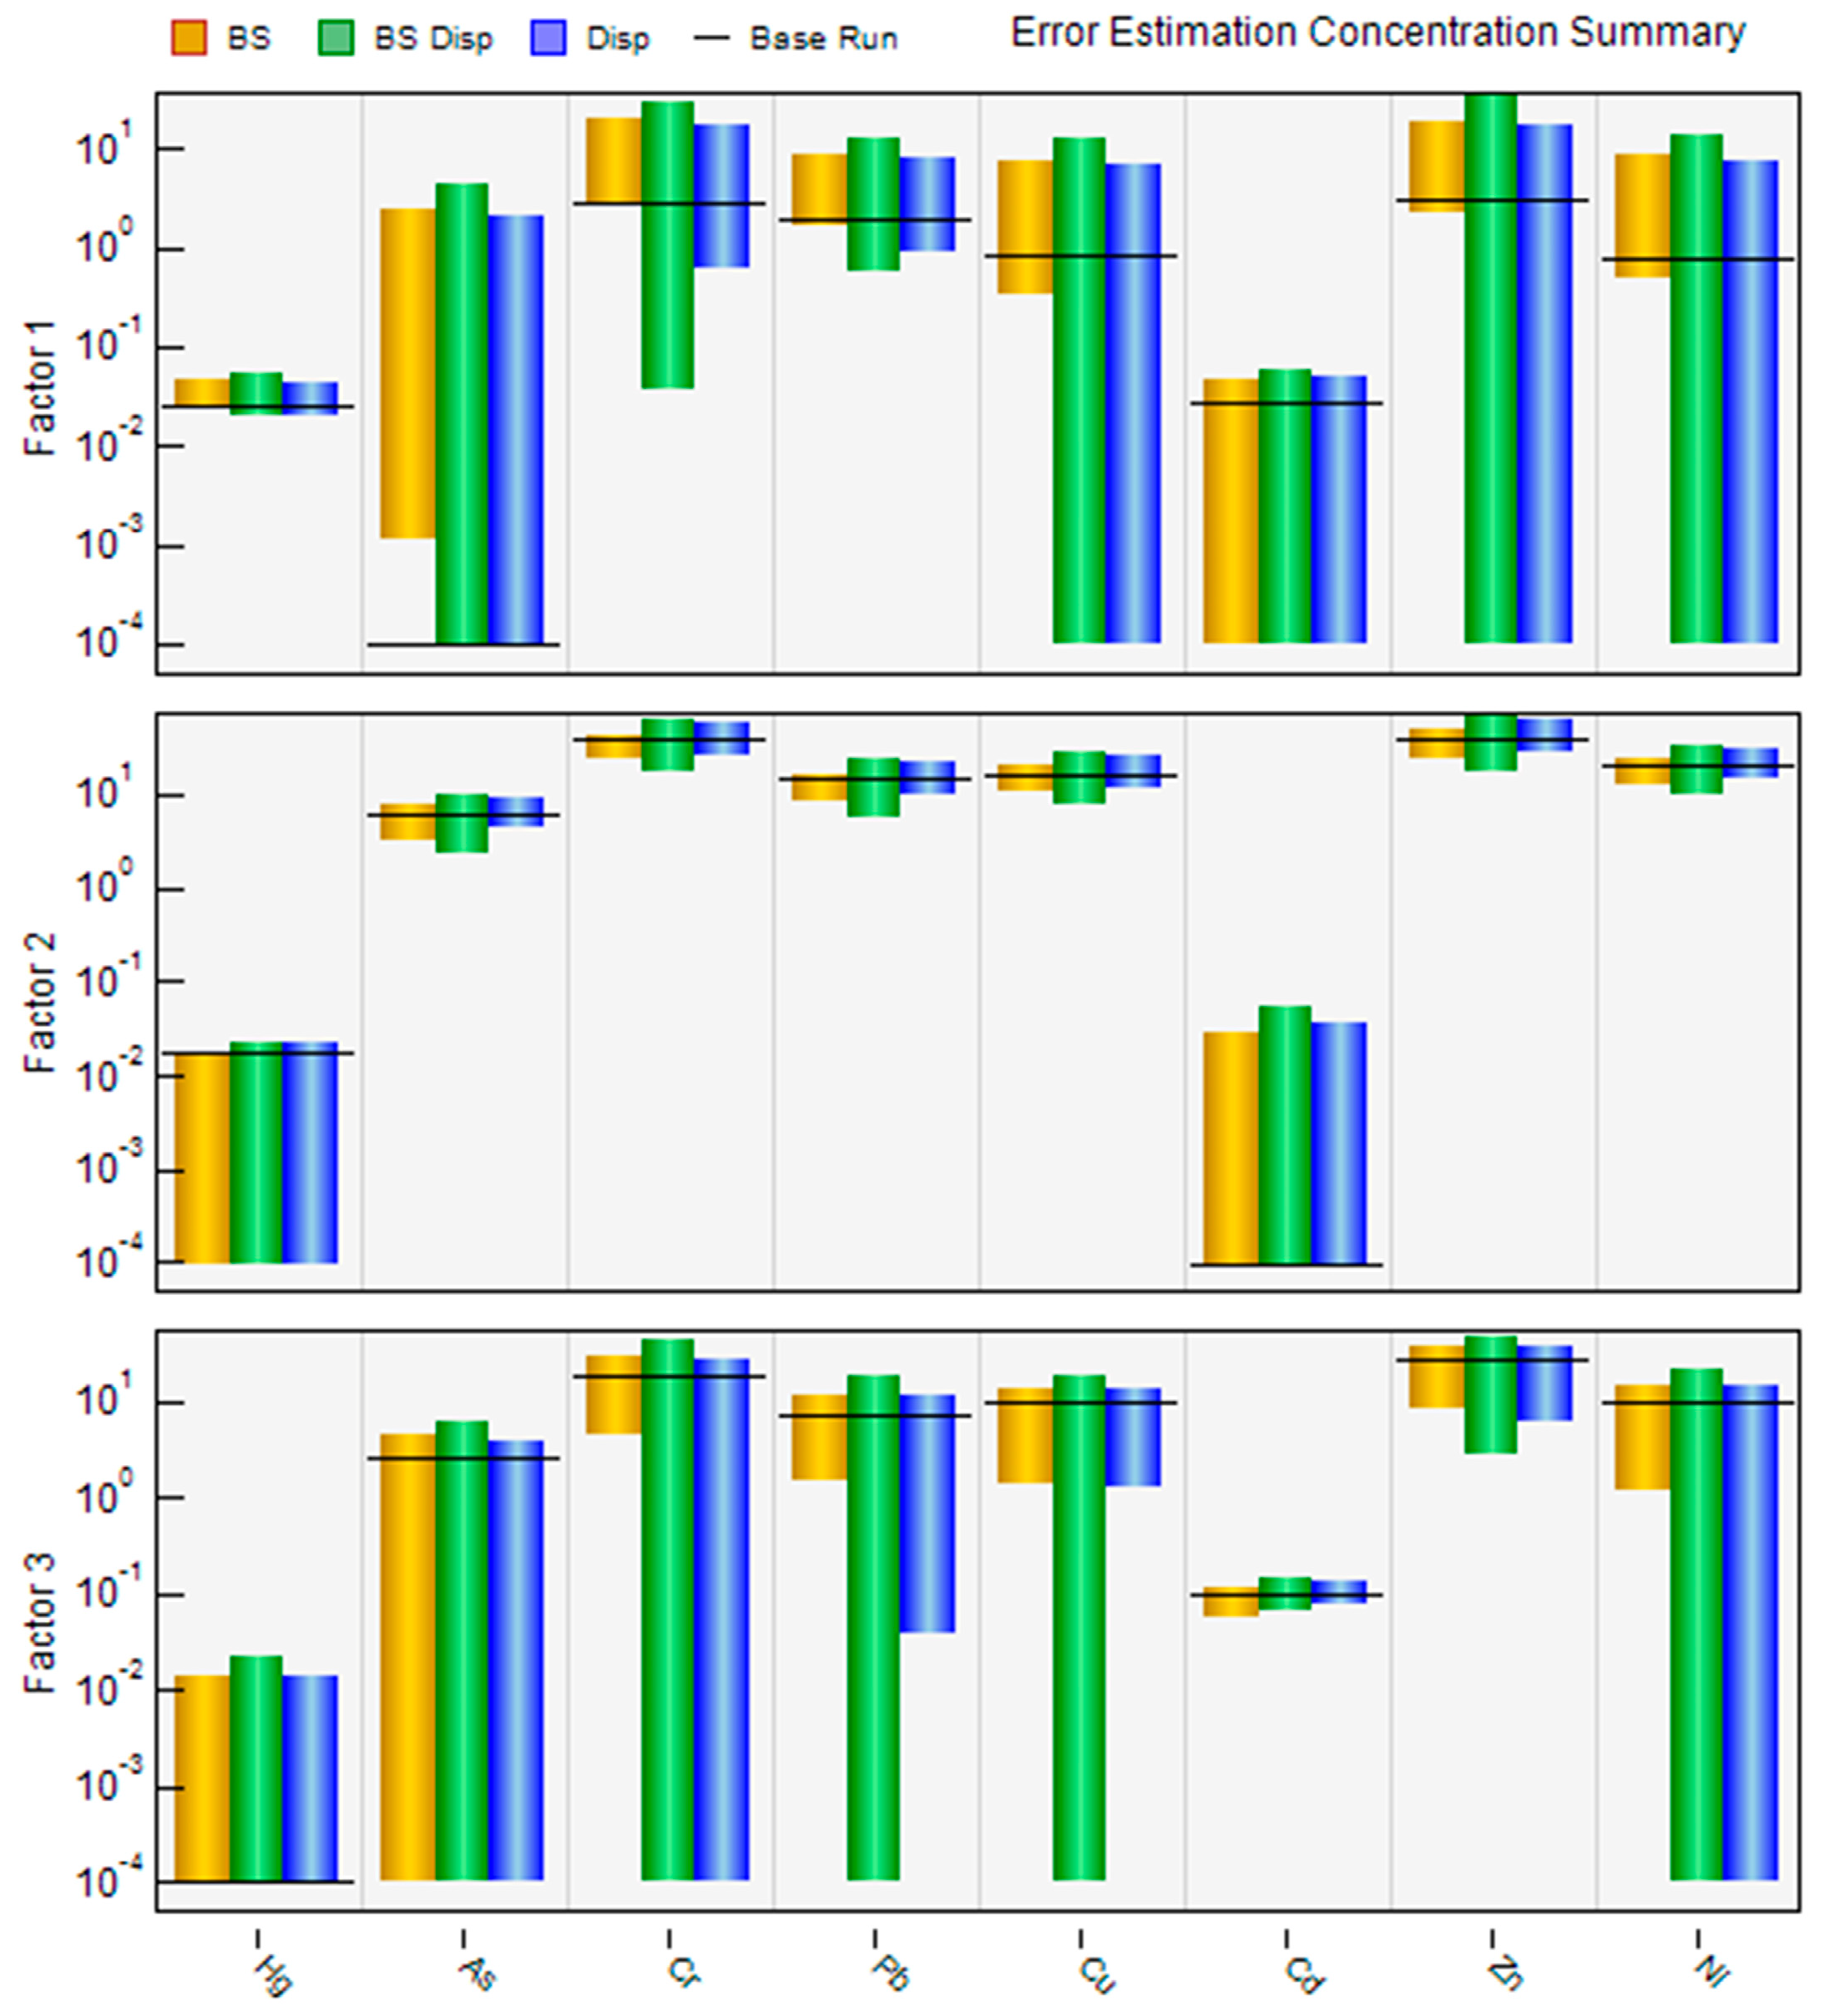
The PMF model judges the uncertainty of heavy metal source apportionment results by running random error (BS), substitution error (DISP), and random and rotational error (BS-DISP), to obtain robust and reliable results. The base run was set to 20, and the number of bootstraps was set to 100, as suggested by the software. Table S5 shows that all bootstrap-run factors were assigned to a base factor, and more than 90% of the base factors are replicated. At the same time, the program is repeatedly run under the constraints of ensuring a minimum value of Q(Robust) and that the classification of all factors has not changed, which indicates that the factor profiles of base runs are reliable [24]. Figure 7 shows the error estimation for the concentration of heavy metal(loid)s for the BS, BS-DISP, and DISP methods. It is evident that there is uncertainty in the factor contributions. The results of the PMF model may be significantly affected by certain measurements of heavy metal(loid)s. Therefore, the delineation of the study area and the selection of samples are crucial for the source apportionment. Due to the magnitude differences in the contents of different heavy metal(loid)s in soil, an interval ratio was introduced to compare the estimation error levels, and uncertainty ranges for all heavy metal(loid)s. Table 6 reflects upon the uncertainty analysis results for factor contributions to the contents of heavy metal(loid)s using the error estimation methods of classical bootstrap (BS) and displacement of factor elements (DISP). The interval ratio values of As in Factor 1, Hg and Cd in Factor 2, Hg and As in Factor 3, based on BS; and Hg and Cd in Factor 2, Hg in Factor 3 based on DISP are all greater than two. This result indicates significant uncertainties in these heavy metal samples, whereas the remaining heavy metal(loid)s have relatively low variability. Therefore, although the PMF model has obvious advantages in identifying the main sources and quantifying their contributions, there is still uncertainty in factor apportionment for individual metals with low contributions. The functionality of the PMF model needs to be improved.
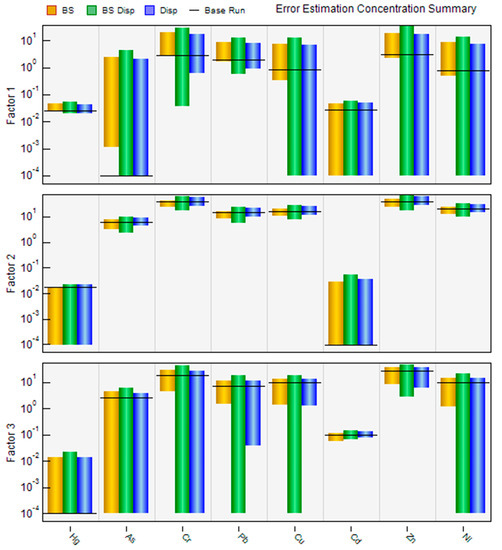
Figure 7.
Summary plot of the error estimation concentration of heavy metal(loid)s for the three factors derived from the PMF model.
Table 6.
Results of uncertainty analysis for factor contributions to the contents of heavy metal(loid)s using the error estimation methods of classical bootstrap (BS) and displacement of factor elements (DISP).
4. Conclusions
Through field studies focusing on sinks of the heavy metal(loid)s (As, Cd, Cr, Hg, Cu, Ni, Pb, and Zn) in topsoil, the mean and median concentrations of Hg, As, Cu, Ni, and Zn were higher than the background values of the Nansi Lake Nature Reserve. Moreover, human activities, especially coal mining, significantly impact the spatial distribution of As, Cu, Zn, Ni, and Hg. This finding necessitates further contamination and potential ecological risk assessments. Following the referenced and optimal geochemical background values in local soils, the elements of Cu, Zn, and As exhibited slightly higher contamination levels than other metals, while the lower concentrations of Hg and Cd are biologically sensitive and effective, resulting in higher eco-toxicity and environmental risks. Appropriate to the contamination situation, PMF modeling and PCA were simultaneously used for quantitative source apportionment. There are similar traceability results of heavy metal(loid)s. Hg mainly comes from industrial sources. Mercury vapor is generated through fuel combustion and mercury-containing wastewater, and then enters the atmosphere in the form of volatilization, and finally enters the soil as a consequence of atmospheric deposition; As, Ni, Cr, Cu, Zn, and Pb mainly come from coal mining and processing, coal fossil fuel combustion, and coal gangue dumps; Cd mainly comes from agricultural sources. In addition, the contribution of contamination sources to the topsoil heavy metal(loid)s estimated by the PMF model is quite different. There are uncertainties in source assignments and factor contributions for heavy metal(loid)s with low concentrations. In summary, along with the processes related to coal mining and ore washing, it becomes necessary to remediate and treat the polluted soil, sediment, and water and further identify and control the contamination sources to reduce the risk of heavy metal contamination in the Nansi Lake Nature Reserve.
Supplementary Materials
The following supporting information can be downloaded at: https://www.mdpi.com/article/10.3390/su14116679/s1.
Author Contributions
Conceptualization, Q.W., Y.Z. (Yifan Zeng) and D.Z.; Formal analysis: D.Z.; Funding acquisition, Q.W. and Y.Z. (Yifan Zeng); Investigation, D.Z. and G.Z.; Methodology, Q.W., Y.Z. (Yifan Zeng), D.Z. and A.M.; Project administration, Y.Z. (Yifan Zeng); Software, Y.Z. (Yao Zhang); Validation, H.W. and X.Z.; Visualization, Y.Z. (Yifan Zeng), S.G. and G.Z.; Writing—original draft, D.Z.; Writing—review & editing, D.Z., Y.Z. (Yifan Zeng) and S.G. All authors have read and agreed to the published version of the manuscript.
Funding
This work was sponsored by the National Natural Science Foundation of China (No. 42072284, No. 42027801, No. 41877186, No. 41972253), the National Key R&D Program of China (2021YFC2902004), the Major Science and Technology Projects of Inner Mongolia Autonomous Region (2020ZD0020-4), Shandong Province Key R&D Program (2020CXGX011403) and the Fundamental Research Funds for the Central Universities (2022YQSH01). Research project on positive impacts of typical abandoned mines in Inner Mongolia support by Natural Resources Department of Inner Mongolia Autonomous Region, Evaluation and prediction of typical coal mine mining subsidence and surface movement rule in Ordos support by Natural Resources Department of Inner Mongolia Autonomous Region.
Institutional Review Board Statement
Not applicable.
Informed Consent Statement
Informed consent was obtained from all subjects involved in the study by the public opinion research agency that carried out the survey.
Data Availability Statement
The datasets used and/or analysed during the current study available from the corresponding author upon reasonable request.
Acknowledgments
We gratefully acknowledge the comments and suggestions made by anonymous reviewers.
Conflicts of Interest
The authors declare that they have no known competing financial interests or personal relationships that could have appeared to influence the work reported in this paper.
References
- USEPA (U.S. Environmental Protection Agency). Soil Screening Guidance: User’s Guide; Office of Solid Waste and Emergency Response: Washington, DC, USA, 1996; p. 20460.
- USEPA (U.S. Environmental Protection Agency). Regional screening levels (RSLs)—Generic Tables. 2019. Available online: https://www.epa.gov/risk/regional-screening-levels-rsls-generic-tables (accessed on 20 May 2022).
- Peng, S.; Dai, M.; Zhang, J.; Zhang, M.; Shi, Q.; Liang, B.; Zheng, T. Dynamics of ecological risks associated with heavy metal(loid)s in sediments during the construction process of the Yangtze River deepwater channel. J. Clean. Prod. 2020, 269, 122231. [Google Scholar] [CrossRef]
- Yu, H.; Gui, H.; Zhao, H.; Wang, M.; Li, J.; Fang, H.; Jiang, Y.; Zhang, Y. Hydrochemical characteristics and water quality evaluation of shallow groundwater in Suxian mining area, Huaibei coalfield, China. Int. J. Coal Sci. Technol. 2020, 7, 825–835. [Google Scholar] [CrossRef]
- Zhang, K.; Li, H.; Han, J.; Jiang, B.; Gao, J. Understanding of mineral change mechanisms in coal mine groundwater reservoir and their influences on effluent water quality: A experimental study. Int. J. Coal Sci. Technol. 2020, 8, 154–167. [Google Scholar] [CrossRef]
- Lewińska-Preis, L.; Szram, E.; Fabiańska, J.; Monika, N.A.; Misz-Kennan, M.; Abramowicz, A.; Kruszewski, Ł.; Kita, A. Selected ions and major and trace elements as contaminants in coal-waste dump water from the Lower and Upper Silesian Coal Basins (Poland). Int. J. Coal Sci. Technol. 2021, 8, 790–814. [Google Scholar] [CrossRef]
- Qiu, H.; Gui, H.; Fang, P.; Li, G. Groundwater contamination and human health risk based on Monte Carlo simulation in a typical mining area in Northern Anhui Province, China. Int. J. Coal Sci. Technol. 2021, 8, 1118–1129. [Google Scholar] [CrossRef]
- Sun, K.; Fan, L.; Xia, Y.; Li, C.; Chen, J.; Gao, S.; Wu, B.; Peng, J.; Ji, Y. Impact of coal mining on groundwater of Luohe Formation in Binchang mining area. Int. J. Coal Sci. Technol. 2021, 8, 88–102. [Google Scholar] [CrossRef]
- Liu, E.; Shen, J.; Yang, L.; Zhang, E.; Meng, X.; Wang, J. Assessment of heavy metal contamination in the sediments of Nansihu Lake Catchment, China. Environ. Monit. Assess. 2010, 161, 217–227. [Google Scholar] [CrossRef]
- Ma, Z.; Chen, K.; Yuan, Z.; Bi, J.; Huang, L. Ecological risk assessment of heavy metal(loid)s in surface sediments of Six Major Chinese freshwater lakes. J. Environ. Qual. 2013, 42, 341–350. [Google Scholar] [CrossRef] [Green Version]
- Liu, Y.; Wang, Q.; Zhuang, W.; Yuan, Y.; Jiao, K.; Wang, M.; Chen, Q. Calculation of Thallium’s toxicity coefficient in the evaluation of potential ecological risk index: A case study. Chemosphere 2018, 194, 562–569. [Google Scholar] [CrossRef]
- Zhuang, W.; Samantha, C.Y.; Alexander, L.F.; Wang, Q.; Song, J.; Liu, Y.; Chen, Q.; Lai, X. Distribution, contamination status, and source apportionment of trace metalsin lake sediments under the influence of the South-to-North Water Transfer Project, China. Sci. Total Environ. 2019, 671, 108–118. [Google Scholar] [CrossRef]
- Liu, E.; Shen, J.; Zhang, E.; Wu, Y.; Yang, L. A geochemical record of recent anthropogenic nutrient loading and enhanced productivity in Lake Nansihu, China. J. Paleolimnol. 2010, 44, 15–24. [Google Scholar] [CrossRef]
- Gu, X.; Zhang, L.; Bo, X. Characteristics of sediments and pore water in Lake Nansi Wetland. Huan Jing Ke Xue 2010, 31, 939–945. (In Chinese) [Google Scholar] [PubMed]
- Xie, Y.; Huang, G.; Li, W.; Li, J.; Li, Y. An inexact two-stage stochastic programming model for water resources management in Nansihu Lake Basin, China. J. Environ. Manag. 2013, 127, 188–205. [Google Scholar] [CrossRef] [PubMed]
- Cong, W.; Sun, X.; Guo, H.; Shan, R. Comparison of the SWAT and InVEST models to determine hydrological ecosystem service spatial patterns, priorities and trade-offs in a complex basin. Ecol. Indic. 2020, 112, 106089. [Google Scholar] [CrossRef]
- Blifford, I.H., Jr.; Meeker, G.O. A factor analysis model of large scale contamination. Atmos. Environ. 1967, 1, 147–157. [Google Scholar] [CrossRef]
- Wang, S.Y. Source Apportionment of PM2.5 in Atmosphere in Changchun Using PMF and PCA/APCS Methods; JiLin University: Changchun, China, 2016. [Google Scholar]
- Watson, J.G.; Robinson, N.F.; Chow, J.C.; Henry, R.C.; Kim, B.M.; Pace, T.G.; Meyer, E.L.; Nguyen, Q. The USEPA/DRI chemical mass balance receptor model. CMB 7.0. Environ. Softw. 1990, 5, 38–49. [Google Scholar] [CrossRef]
- Demir, S.; Saral, A.; Ertürk, F.; Kuzu, L. Combined use of Principal ComponentAnalysis (PCA) and Chemical Mass Balance (CMB) for source identification andsource apportionment in air contamination modeling studies. Water Air Soil Pollut. 2010, 212, 429–439. [Google Scholar] [CrossRef]
- Li, J.; Chen, H.; Teng, Y.; Dong, J. Contamination characteristics and source apportionment of soil heavy metal(loid)s in Lalin River basin. Trans. Chin. Soc. Agric. Eng. 2016, 32, 226–233. [Google Scholar] [CrossRef]
- Chen, J.; Fang, H.; Wu, J.; Lin, J.; Lan, W.; Chen, J. Distribution and source apportionment of heavy metal(loid)s in farmland soils using PMF and lead isotopiccomposition. J. Agro-Environ. Sci. 2019, 38, 1026–1035. [Google Scholar]
- Hou, D.; O’ Connor, D.; Nathanail, P.; Tian, L.; Ma, Y. Integrated GIS and multi-variate statistical analysis for regional scale assessment of heavy metal soil con-tamination: A critical review. Environ. Pollut. 2017, 231, 1188–1200. [Google Scholar] [CrossRef]
- Hu, Y.; He, K.; Sun, Z.; Chen, G.; Cheng, H. Quantitative source apportionment of heavy metal(loid)s in the agricultural soils of an industrializing region and associated model uncertainty. J. Hazard. Mater. 2020, 391, 122244. [Google Scholar]
- DZ/T 0064.1~0064.80-93; Method for Inspection of Underground Water Quality. The Geological and Mining Industry of the People’s Republic of China: Beijing, China, 1993.
- HJ 803-2016; Soil and Sediment—Determination of Aqua Regia Extracts of 12 Metal Elements—Inductively Coupled Plasma Mass Spectrometry. National Environmental Protection of the People’s Republic of China: Beijing, China, 2016.
- DZ/T 0279.3-2016; Analysis Methods for Regional Geochemical Sample—Part 3: Determination of 15 Elements including Barium, Beryllium, Bismuth, etc. by Inductively Coupled Plasma Mass Spectrometry. The Geological and Mining Industry of the People’s Republic of China: Beijing, China, 2016.
- HJ 680-2013; Soil and Sediment—Determination of Mercury, Arsenic, Selenium, Bismuth, Antimony—Microwave Dissolution/Atomic Fluorescence Spectrometry. National Environmental Protection of the People’s Republic of China: Beijing, China, 2013.
- Muller, G. Index of geoaccumulation in sediments of the Rhine River. GeoJournal 1969, 2, 109–118. [Google Scholar]
- Wu, W.; Wu, P.; Yang, F.; Sun, D.; Zhang, D.; Zhou, Y. Assessment of heavy metal pollution and human health risks in urban soils around an electronics manufacturing facility. Sci. Total Environ. 2018, 630, 53–61. [Google Scholar] [CrossRef] [PubMed]
- Hakanson, L. An ecological risk index for aquatic contamination control. A sedimentological approach. Water Res. 1980, 14, 975–1001. [Google Scholar] [CrossRef]
- Paatero, P.; Tapper, U. Analysis of different modes of factor analysis as least squares fit problems. Chemom. Intell. Lab. Syst. 1993, 18, 183–194. [Google Scholar] [CrossRef]
- Brown, S.G.; Wade, K.S.; Hafner, H.R. Multivariate Receptor Modeling Workbook; Sonoma Technology Inc.: Petaluma, CA, USA, 2007. [Google Scholar]
- Christensen, W.F.; Schauer, J.J. Impact of species uncertainty perturbation on the solution stability of positive matrix factorization of atmospheric particulate matter data. Environ. Sci. Technol. 2008, 42, 6015–6021. [Google Scholar] [CrossRef]
- Paatero, P.; Eberly, S.; Brown, S.G.; Norris, G.A. Methods for estimating uncertainty in factor analytic solutions. Atmos. Meas. Techmiques 2014, 7, 781–797. [Google Scholar] [CrossRef] [Green Version]
- Polissar, A.V.; Hopke, P.K.; Paatero, P.; Malm, W.C.; Sisler, J.F. Atmospheric aerosol over Alaska 2. Elemental composition and sources. J. Geophys. Res. 1998, 103, 19045–19057. [Google Scholar] [CrossRef]
- Manta, D.S.; Angelone, M.; Bellanca, A.; Neri, R.; Sprovieri, M. heavy metal(loid)s inurban soils: A case study from the city of Palermo (Sicily), Italy. Sci. Total Environ. 2002, 300, 229–243. [Google Scholar] [CrossRef]
- Ministry of Ecology and Environment (MEE). Soil Environmental Quality. Risk Control Standard for Soil Contamination of Development Land (GB36600-2018); Environmental Science Press: Beijing, China, 2018.
- Nowak, B. Contents and relationship of elements in human hair for a non-in-dustrialised population in Poland. Sci. Total Environ. 1998, 209, 59–68. [Google Scholar] [CrossRef]
- Tri Mursito, A.; Widodo; Nor Arifin, D. Characterization of bio-coal briquettes blended from low quality coal and biomass waste treated by Garant® bio-activator and its application for fuel combustion. Int. J. Coal Sci. Technol. 2020, 7, 796–806. [Google Scholar] [CrossRef] [Green Version]
- Bilal, I.; Abdugheni, A.; Shi, Q.; Liu, S.; Nijat, K.; Li, H. contamination and source identification of heavy metal(loid)s in surrounding soils of Eastern Junggar Coalfield based on PMF model. Trans. Chin. Soc. Agric. Eng. 2019, 35, 185–192. [Google Scholar] [CrossRef]
- Cheng, H.; Hu, Y. Lead (Pb) isotopic fingerprinting and its applications in lead pollution studies in China: A review. Environ. Pollut. 2010, 158, 1134–1146. [Google Scholar] [CrossRef] [PubMed]
- Huang, H.; Lin, C.; Hu, G.; Yu, R.; Hao, C.; Chen, F. Source Appointment of heavy metal(loid)s in Agricultural Soils of Jiulong River Basin Based on Positive Matrix Factorization. Environ. Sci. 2019, 41, 430–437. [Google Scholar] [CrossRef]


Publisher’s Note: MDPI stays neutral with regard to jurisdictional claims in published maps and institutional affiliations. |
© 2022 by the authors. Licensee MDPI, Basel, Switzerland. This article is an open access article distributed under the terms and conditions of the Creative Commons Attribution (CC BY) license (https://creativecommons.org/licenses/by/4.0/).