Article

Diffusion Characteristics and Driving Factors of the Smart Tourism City Policy—Event History Analysis

College of Tourism, Huaqiao University, Quanzhou 362021, China
*
Author to whom correspondence should be addressed.
Sustainability 2022, 14(11), 6685; https://doi.org/10.3390/su14116685
Submission received: 5 May 2022 / Revised: 22 May 2022 / Accepted: 26 May 2022 / Published: 30 May 2022
(This article belongs to the Special Issue Information Systems for Sustainable Tourism)

Abstract

:
It is of great significance to explore the spatial-temporal characteristics and analyze the driving factors of the diffusion of smart tourism city policy, which promotes the adoption of smart tourism city policy and the sustainable development of tourism. We aimed to explore the diffusion law and influencing factors of smart tourism city so as to provide reference for the construction of smart tourism city. By employing the 249 cases in China from 2012 to 2019, we revealed the spatial-temporal characteristics and driving factors influencing the diffusion of smart tourism city policy by employing the event history analysis method. The results reveal that the diffusion of smart tourism city policy presents the typical S-shaped curve in cumulative adoptions over time. Furthermore, the diffusion of smart tourism city policy presents the spatial distribution characteristic of the Hu Line, which spreads from the eastern coastal areas to the central inland areas. Moreover, there are multiple driving sources for the diffusion of smart tourism city policy, among which economic lift force, intellectual support force, technological pull force and demand impetus force are the important driving sources for the policy diffusion.

1. Introduction

Since the 1980s, urban tourism has gradually become one of the most important and worldwide forms of tourism [1] profiting from the rapidly growing demand for urban tourist destinations. In recent years, tourism development provided lots of opportunities and tremendous chances for urban sustainable development [2,3]. However, tourism development not only contributes to urban economic growth but also leads to massive problems [4]. In particular, the over-development of tourism is considered to be a crucial problem in these tourist cities, which has caused negative impacts on the local environment, resources and social culture [5,6]. Considering cities as the spatial place of high-intensity tourism activities, it is sustainability development that is urgent for cities [7]. With the advent of the use of technology in cities [8] and inspired by the idea of smart cities [9,10], many studies shed light on smart tourism cities to help promote the sustainability of tourist cities [11].
In addition, the outbreak of COVID-19 is causing havoc all across the globe, and travel and tourism may be the hardest-hit industry in this pandemic. In a world where COVID-19 is going to stay for a long time [12], the World Tourism Organization [13] asserts the need to act decisively, to restore confidence and to embrace innovation and the digital transformation of global tourism. Smart tourism based on information and communication technologies (ICTs) is driving the sustainable development of tourism post-COVID-19 [12].
Smart tourism might be very similar to intelligent tourism; however, they are essentially different. Intelligence focuses on a technical capability offering more convenient and efficient services to the users. However, smartness can privately perceive users’ needs and provide accurate service information with technological means [14]. Furthermore, intelligence lies in the basic utility of knowledge and information, but smartness is a sublimation of intelligent power anticipating needs [15]. Therefore, we adopted the concept of smart tourism rather than intelligent tourism. Smart tourism is an important mode for promoting the high-quality development of tourism cities [16,17,18], which not only consider residents but also tourists in their efforts to support sustainability and quality of life/visits [10].
Additionally, smart tourism emphasizes the sustainable development of tourist areas [10]. Responsible tourism has played a significant role in the sustainability of the destination [19]. However, responsible tourism is not a synonym for sustainable tourism [20]. Responsible tourism builds on appropriate sustainability-based strategies as a tool to minimize negative social, economic and environmental impacts whilst maximizing the positive effects of tourism development [21].
Previous studies have launched a series of discussions on smart tourism and smart tourism city, mainly focusing on the following aspects. Previous studies argued that the key aspect of smart tourism is the integration of information technology into the physical infrastructure of tourism destination and tourism experience of tourists [10,18], while smart tourism city describes the application of the “smart city” concept and technologies into a tourism context [22]. Smart tourism city requires efforts from a wide range of actors [23], from government entities to independent businesses, to undertake a range of activities. Um and Chung [15] suggested that smart tourism technology has been used in tourist cities, such as smart tourist guides [24,25,26], smart hotels [27,28,29], smart recommendations for tourists [30] and augmented reality technologies [31]. In addition, Mehraliyev et al. [32] claimed the effect of smart tourism on tourists is the hot spot of the current research, which focuses on the effects of smart tourism technologies on tourists including tourist experience [33,34], tourist loyalty [35] and tourist satisfaction [15], as well as the issues of how the development of smart tourism may enhance destinations’ resilience [36] or competitiveness [37].
According to the China National Tourism Administration, officially, smart tourism was treated as the core strategy of Chinese tourism development policy [18] with a total of 33 smart tourism pilot cities from 2012 to 2013 in China. The existing literature on smart-tourism-related research has mainly addressed application [38], construction [39] and the influence [15] of smart tourism, which is profit from the implementation of smart tourism city policy. However, previous studies seem to neglect to analyze the driving force underlying implementation of smart tourism city policy. It is noted that understanding the diffusion and evolution process of smart tourism city policy is necessary and important for cities to achieve sustainable development goals [7] which has been rarely considered before. In addition, we argue that the key to giving full play to the demonstration effect of smart tourism pilot cities is to clarify the driving force of policy diffusion, namely, exploring which driving factors affect policy diffusion.
Based on the above analysis, one of the aims of the paper is to explore the spatial-temporal characteristics of smart tourism city policy, clarify its diffusion process and rules and provide guidance for the subsequent diffusion of tourism policies. In addition, we attempt to reveal the driving source of the diffusion of smart tourism city policy and provide scientific reference for policy diffusion to cultivate driving source. Therefore, this paper studies the smart tourism city policy from the perspective of policy diffusion, which not only deepens the understanding of the driving factors influencing the effect of policy but also contributes to the new understanding of the logic and dynamics of smart tourism city policy diffusion, providing reference for the construction of smart tourism cities and sustainable development of tourism cities. To our knowledge, this study may be the first attempt to clarify the driving forces that influence the diffusion of smart tourism city policy. The study of smart tourism city policy in China will help us understand the policy diffusion patterns during the development of the Chinese cities and further enhance the sustainable development in Chinese cities.
In the following, Section 2 states the theory and hypotheses; Section 3 introduces the data and methods; Section 4 elaborates the results; and Section 5 presents the conclusion and implications.

2. Theory and Hypotheses Proposed

2.1. Policy Diffusion Theory

Policy diffusion theory has become one of the most important theories for studying changes in public policy [40], which stemmed from studying the diffusion of policies among the American states in the late 1960s. Walker [41] not only proposed the concept of policy diffusion but also pointed out that policy diffusion is a process of imitation and innovation of a policy that a government adopts for the first time among state governments. Lucas [42] argued that policy diffusion refers to the process by which a policy is spatially transferred and adopted by other members or government subjects. As the practice of policy diffusion becomes more diversified, the connotation of policy diffusion is further expanded into a process whereby policy choices in the local government are influenced [43]. At present, academic research on policy diffusion has mainly been concentrated in the field of public service, such as utility tunnels [44], electric vehicles [45], water privatization [46], childbirth support [47] and renewable energy [48]. However, few studies have been conducted on smart tourism city policy, even in the tourism industry field. What is more, Huang, Yue, Yang, Su and Chen [40] suggested that smart tourism has become the key to the development of tourism in China. Therefore, we endeavored to provide insights for sustainable urban development via exploring the diffusion of smart tourism city policy in China.
This study of driving factors has been a staple of research on policy diffusion for several decades [43,49,50]. As far as the influencing factors of diffusion are concerned, the adoption of policies by local government is mainly determined by its internal and external factors [49,51]. Internal factors examine the role of conditions inherent to the adopting government including a range of social, economic and political conditions including political culture, population structure, residents’ income level and financial scale [49,52]. External factors are conditions that exist outside of the adopting government but may influence adoption decisions. For example, pressure from the higher government and/or other governmental adopters [53]. In addition, Wejnert [54] categorized the factors involved in the previous studies and put forward an integration model of policy diffusion including three major elements including characteristics of policy subject, such as economic strength, financial capacity, social influence of policy adoption and adopter characteristics; demand characteristics of policy object, emphasizing the social needs of the policy; and characteristics of policy environment referring to geographic settings, societal culture and political conditions. Compared with the internal and external factors, the integration model of policy diffusion is more complete and comprehensive and more suitable for analyzing the influencing factors of policy diffusion [55]. Therefore, this study employed the conceptual framework proposed by Wejnert [54] to investigate the diffusion of smart tourism city policy from the three aspects of policy subject factor, object factor and environmental factor.

2.2. Research Hypotheses

2.2.1. Subject Factor

Whether the subject of policy adoption can provide relevant investment to implement the policy is an important prerequisite for policy adoption. Economic factors have consistently been important across studies of policy diffusion [49,52]. The level of local economic development and financial input contributes to promoting the policy adoption by local government [56], that is, the more developed the economy is, the more likely the city is to adopt the policy [44]. Additionally, according to Boes et al. [57], the city creates the conditions to support the development of smart tourism city through technology applications and communications infrastructure. We argue that it may promote the improvement in local science and technology level due to the proportion of science and technology expenditure increases, which provides the technological foundation for the construction of smart tourism city and then promotes the adoption and implementation of smart tourism city policy. Therefore, this study assumes that the greater financial investment, the higher the possibility of adopting smart tourism city policy. We then propose the following Hypothesis 1 (H1):
H1. 
The larger the fiscal capacity, the more likely local government is to adopt the policy.

2.2.2. Object Factor

From the perspective of policy object factors, Thomas and Streib [58] emphasized that the greater the public demand for the policy, the stronger the willingness of local governments to adopt the policy. It is increasingly difficult for traditional tourism to meet the increasing personalized and complicated demand of tourists in the era of fast-growing wants for information and communication [59]. Tourism is considered as an economic activity with the potential to stimulate local economic growth [60]. Therefore, we deduce that the unmet demand of tourists may restrict the development of local tourism. The application of smart tourism can make good use of modern information technology for meeting tourists’ personal demands [18], which provides intelligent and convenient services for tourists. In addition, smart tourism has become an integral part of the national policy for economic development and overall improvement in tourist service quality with the aid of information technology [61]. Accordingly, we then propose Hypothesis 2 (H2):
H2. 
The higher the tourist demand, the more likely local government is to adopt the policy.

2.2.3. Environmental Factor

The construction of smart tourism city needs intellectual support. On the one hand, Wang and Wei [62] suggested that per capita educational level is an important factor influencing policy diffusion. The implementation of smart tourism city policy involves many aspects, such as platform building and database maintenance, which all depend on professional talent teams. Cities with a high degree of education popularity are more likely to establish technological talent teams, providing a long-term guarantee for the development of smart tourism cities. Additionally, Kiiski and Pohjola [63] observed that more educated people are likely to be faster to adopt new policies than people with less education. On the other hand, human capital, as one of the core components of smart tourism city [64], is conducive to the construction of smart tourism city [65]. Moretti [66] pointed out that San Francisco, with the largest per capita number of college-educated residents in 2000, is the city with the largest per capita stock of human capital. Therefore, we argue that the number of college students in a city can represent the city’s human capital to a certain extent. Namely, the more college students a city has, the richer its human capital is. Based on the above analysis, we then propose Hypothesis 3 (H3) and Hypothesis 4 (H4).
H3. 
The higher the education popularity, the more likely local government is to adopt the policy.
H4. 
The greater the human capital, the more likely local government is to adopt the policy.
As the core means of the development of smart tourism city, advanced science and technology are the key factors driving the development of smart tourism city [11]. Zhao and Zhang [67] argued that smart infrastructure is an important guarantee for the realization of smart tourism city since it can bring more convenient, personalized and intelligent services to tourists [68]. We deduce that the high utilization rate of the smart infrastructure will increase the rate of return of smart tourism city policy implementation [69] due to its convenience for tourists, thus increasing the possibility of the government adopting the policy. In addition, Gajdosik [70] claimed that technology is a necessary condition to create smart tourism city. Intelligent technologies are changing tourists’ experiences and are generating a smart tourism model [38]. It is the portable terminal equipment that makes smart tourism more convenient, which may become the main carrier of smart tourism city in the future [71]. We assert that with the help of an intelligent platform and portable terminal equipment, the construction of smart tourism city will be more convenient and more conducive to adopting the smart tourism city policy. We then propose Hypothesis 5 (H5) and Hypothesis 6 (H6).
H5. 
The better the smart infrastructure, the more likely local government is to adopt the policy.
H6. 
The more terminal equipment, the more likely local government is to adopt the policy.
Therefore, based on the above-mentioned hypotheses, we design the research conceptual framework in this study (Figure 1).

3. Data Collection and Methodology

3.1. Dependent Variable

This study took the adoption of smart tourism city policy as its dependent variable. According to the suggestion of the traditional event history analysis (EHA), we operationalized the dependent variable as a binary variable. If a city adopted smart tourism city policy in year t, then the dependent variable was coded as 1; otherwise, it was coded as 0.
The National Tourism Administration of China announced the first batch of 18 national smart tourism pilot cities in May 2012, marking the official launch of smart tourism city construction. A few cities were dropped from observations due to a lack of statistical data for some years. Therefore, based on the consideration of the appropriateness, comparability and data accessibility, we employed China’s prefecture-level cities as the units of analysis. The dependent variable covered 249 cities at the prefecture-level cities from 2012 to 2019, including Wuhan, Chengdu, Nanjing and Xiamen. Information on the dependent variable was collected from the official websites of Chinese city governments by searching the websites of local governments with “smart tourism city” and “the name of prefecture-level cities & smart tourism city” as the keywords.

3.2. Independent Variable

To measure the factors influencing the diffusion of smart tourism city policy, we focused on the economic lift force, intellectual support force, technological pull force and demand impetus force. Firstly, economic lift force is measured as the fiscal capacity of the city, which is defined as the financial level of the city’s investment in technology and is measured by expenditure for science and technology in the previous year. Additionally, intellectual support force focuses on education popularity and human capital. We measured education popularity and human capital by the expenditure for education in the previous year and number of students in regular institutions of higher education in the previous year. As for technological pull force, considering the pulling effect of smart infrastructure and terminal equipment, revenue from telecommunication services in the previous year and number of subscribers of mobile telephones at year end in the previous year were selected to measure. Lastly, demand impetus force focuses on the driving effect of tourist demand and is measured by tourism revenue in the previous year. Due to the large difference in the values of each variable, in order to ensure the comparability of data, the above variables were logarithmically transformed with base e in this study. Data sources for independent variables included the China City Statistical Yearbook and Statistical Bulletin on National Economic and Social Development. Table 1 provides the descriptions, measures and sources for each independent variable.

3.3. Event History Analysis

This study employed event history analysis to examine factors influencing the local government’s adoption of smart tourism city policy. This analytic technique has been widely employed to understand the occurrence of dynamic social phenomena [49,72]. Event history analysis provides an advantage over traditional logistic regression models by allowing for the analysis of time-dependent variables, taking explicitly into account the length of time until the event occurs and providing an estimate of the risk of an event occurring at any given time period [73]. Because the dependent variable observed in the study was binary, it was generally estimated using a logit model. Therefore, this study employed the influencing factor model of the diffusion of smart tourism city policy as follows:
L o g i t ( p i , t ) = β 0 + β 1 t e c h i , t 1 + β 2 e d u i , t 1 + β 3 s t u i , t 1 +   β 4 t e l e i , t 1 + β 5 u s e r i , t 1 + β 6 r e v i , t 1
where p i , t represents the probability of city i adopting the policy in the year t, β 0 is the intercept, and β m (m = 1, 2, …, 6) is the regression coefficient. The other variables are related variables involved in this study, and the specific meanings are shown in Table 1. Ultimately, data on the 249 cities in China from 2012 to 2019 were summed up as 1564 samples, which were employed to be analyzed in this study.

4. Results

4.1. Temporal Characteristics of Policy Diffusion

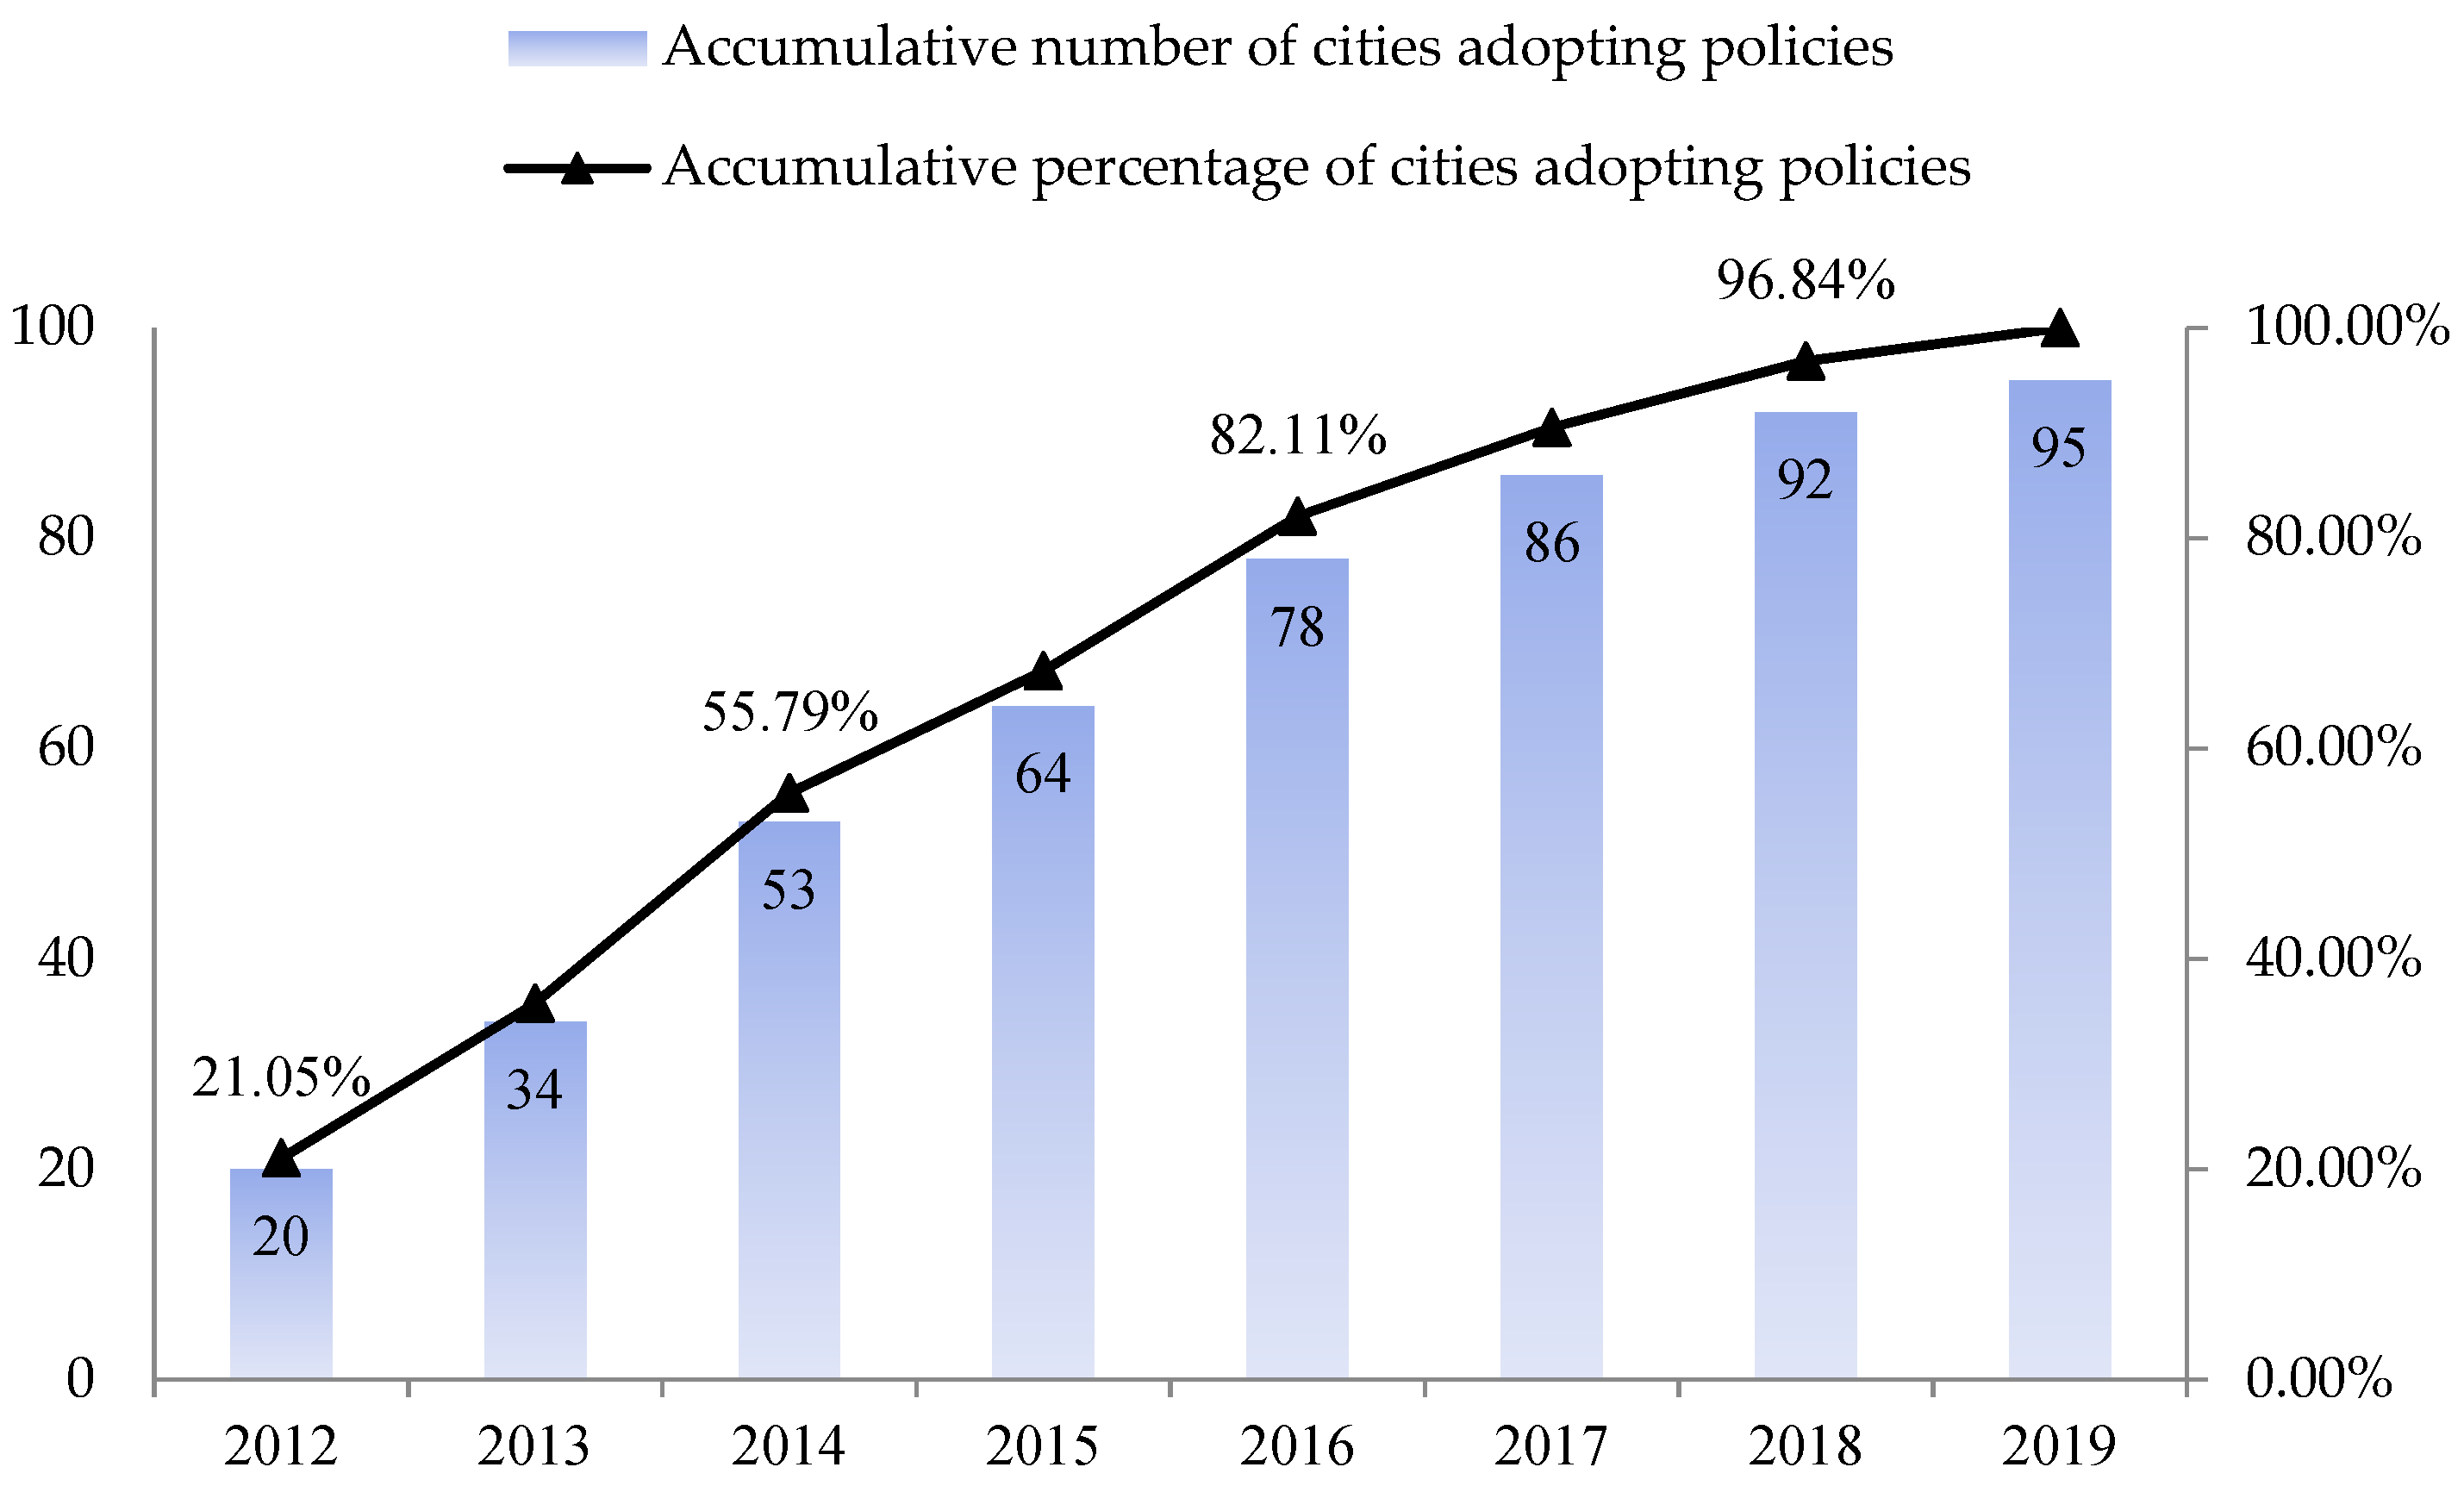
Since the National Tourism Administration in China announced the first batch of national smart tourism cities in 2012, many provincial and municipal governments also started to adopt smart tourism city policy. Figure 2 shows the diffusion curve of smart tourism city in China from 2012 to 2019. Smart tourism city policy slowly spread from 2012 to 2013, and only some prefecture-level cities adopted the smart tourism city policy; from 2013 to 2017, this policy shows the characteristics of rapid diffusion. We argue that the recognition of this policy deepened in prefecture-level cities in the period, which become the rapid development stage of the policy; the spread of the policy slows from 2017 to 2019, with fewer cities adopting it. Therefore, in our observation period (2012–2019), 95 cities in China already adopted the smart tourism city policy, and the overall trend of smart tourism city policy diffusion is “slow–fast–slow down again”, which fits the typical S-shaped curve of cumulative frequency distribution [74,75].

4.2. Spatial Characteristics of Policy Diffusion

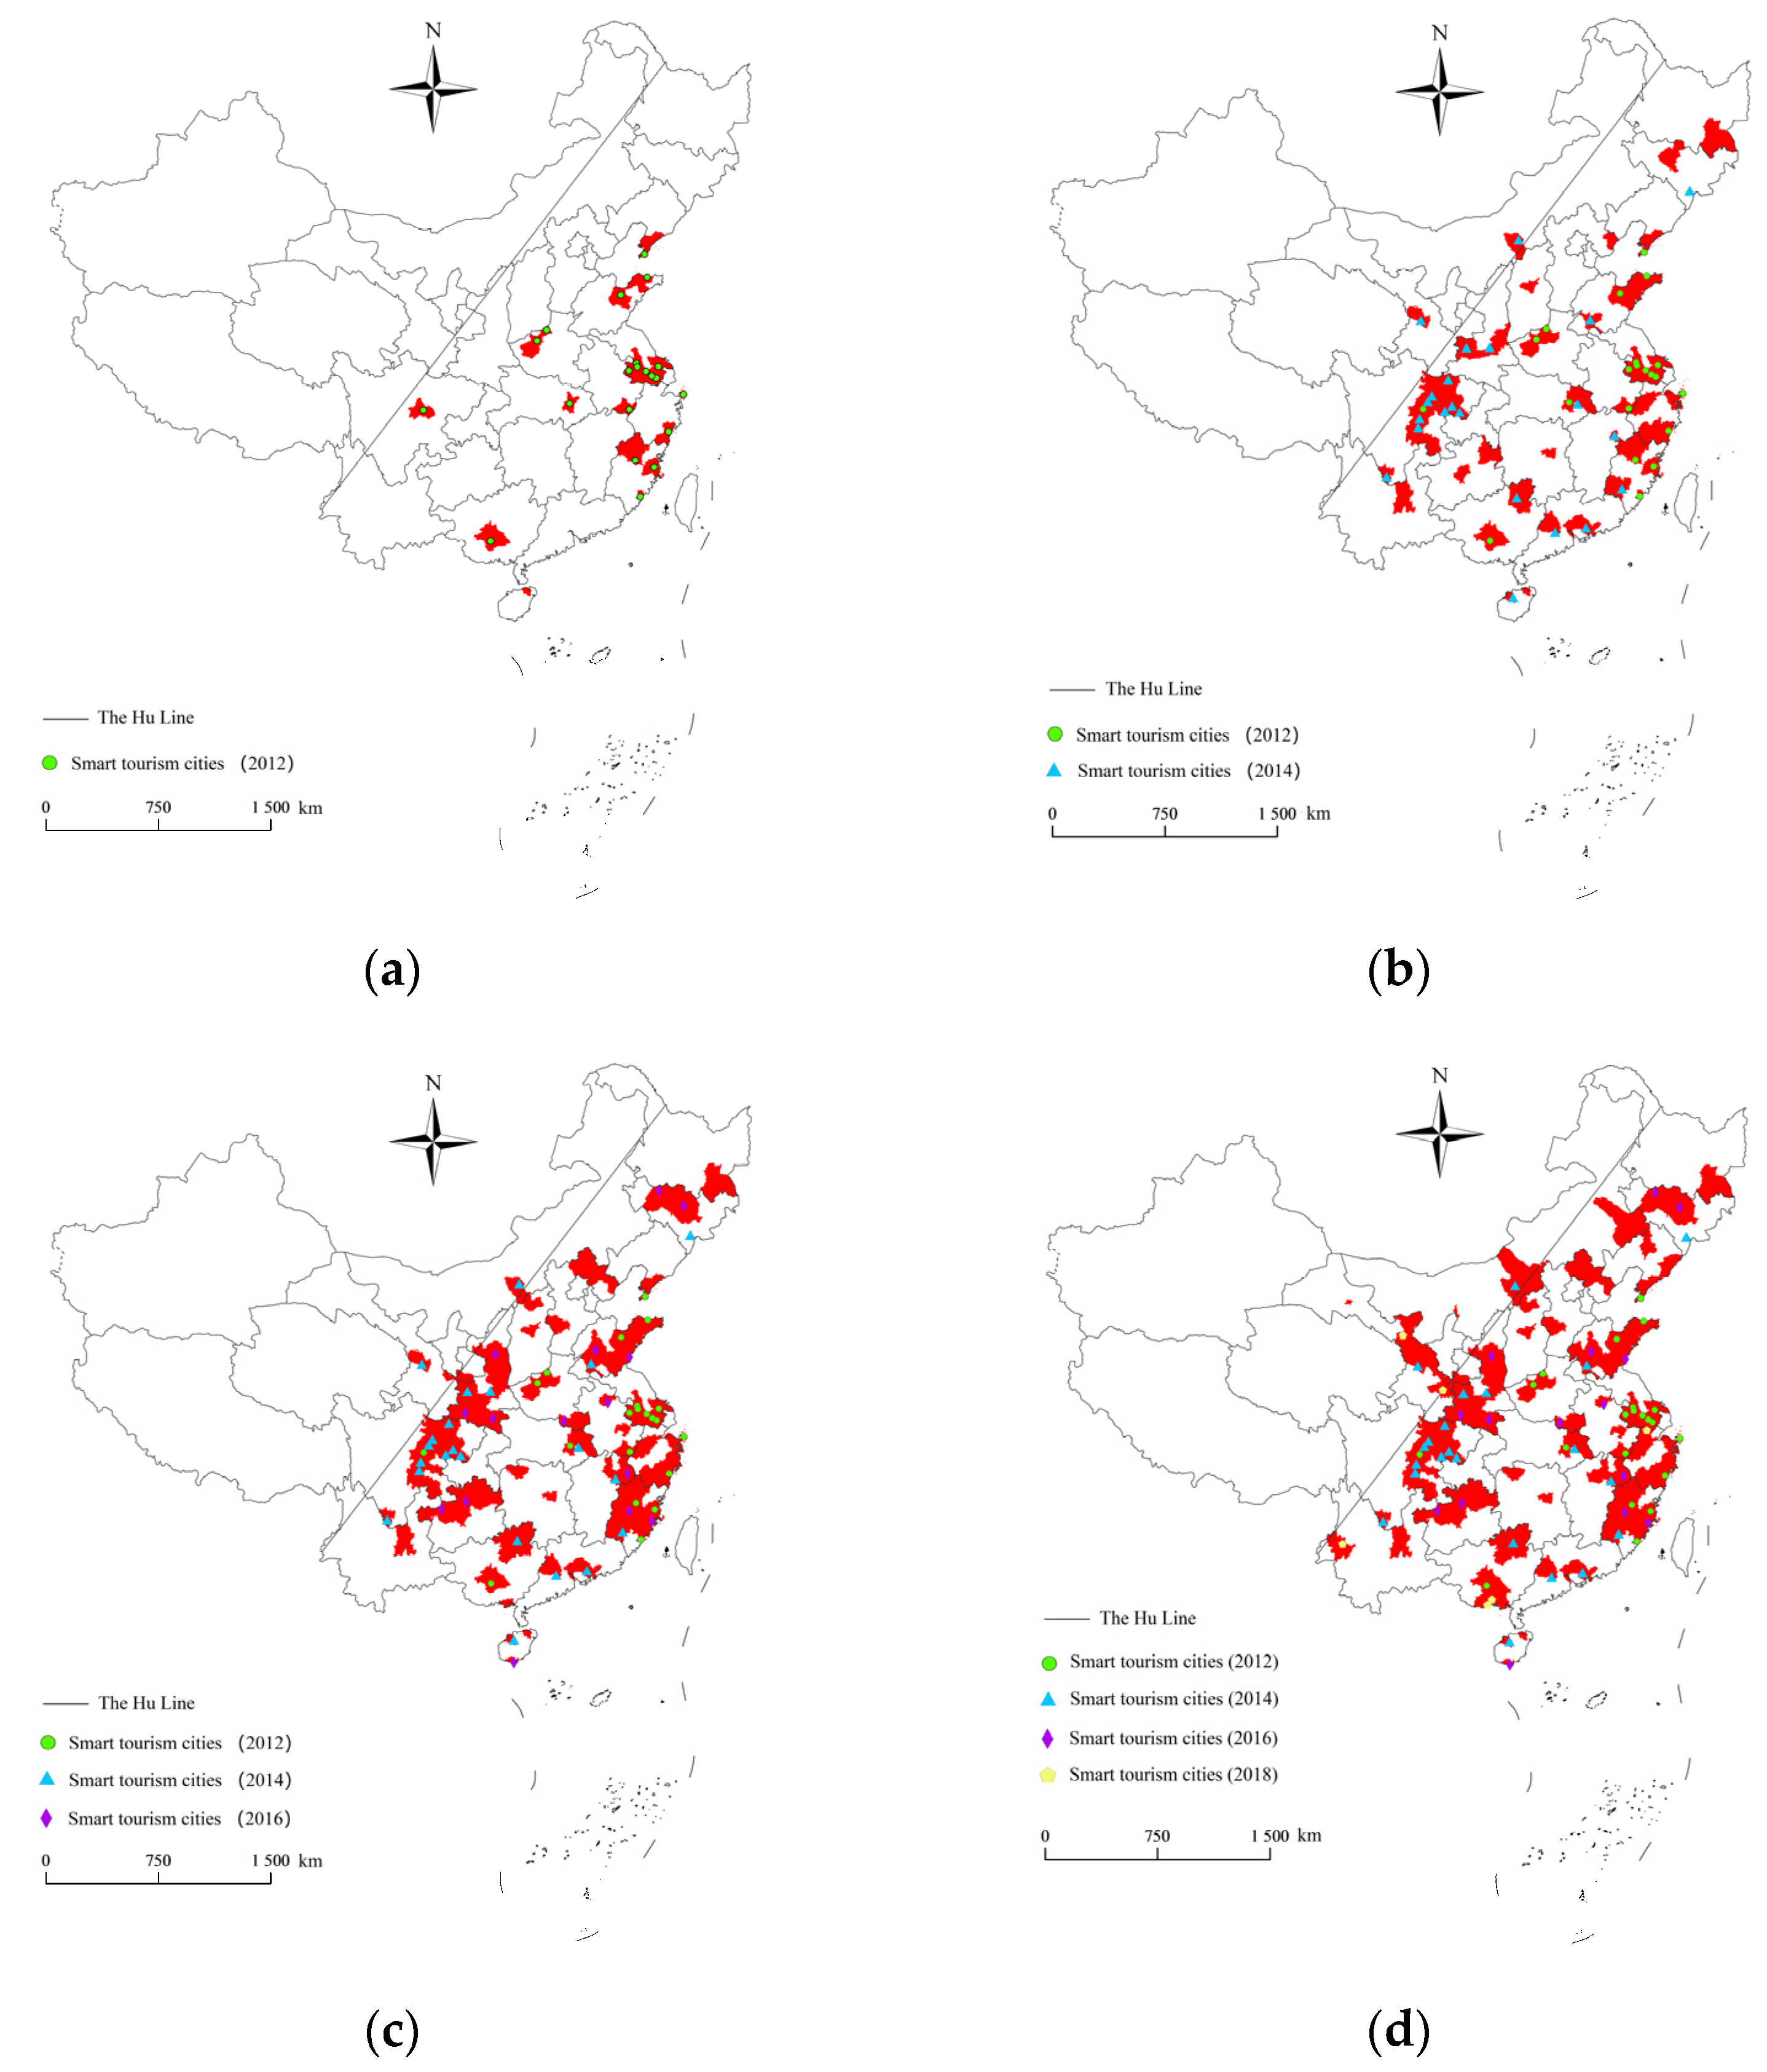
This study employed the natural breakpoint classification method based on ArcGIS software to reveal the spatial distribution of smart tourism city policy diffusion in China in 2012, 2014, 2016 and 2018 (Figure 3). The results display the smart tourism city policy diffusion in China is spreading significantly. Specifically, from 2012 to 2014, the number of cities adopting smart tourism city policy increased, with developed cities in the eastern coastal areas as the core, such as Nanjing, Hangzhou, Suzhou and Xiamen being prominent, scattered in Fujian, Jiangsu and Zhejiang, and Shandong, which gradually diffused to the flake distribution. Additionally, the policy gradually moved to the central region and obviously spread in Yunnan, Guizhou and Sichuan. From 2014 to 2016, the number of cities adopting the smart tourism city policy increased significantly, and the contiguous distribution pattern of Yunnan, Guizhou, Sichuan and Eastern China increased, while the distribution area of Jilin, Hebei, Shaanxi and Guangxi expanded slightly. From 2016 to 2018, the diffusion of smart tourism city policy slowed down again, only spreading in regions such as Inner Mongolia, Gansu and Liaoning.
To sum up, smart tourism city policy presents obvious spatial diffusion characteristics. The policy presents a trend of diffusion from the eastern coastal areas to the central inland areas. Additionally, the policy is spreading around the first batch of national smart tourism cities such as Xiamen, Suzhou and Wuxi. In addition, the spatial diffusion of smart tourism city policy conforms to the distribution characteristics of the Hu Line; namely, the west of the Hu Line is scattered, and the east of the Hu Line is clustered.

4.3. Descriptive Statistics and Correlational Analysis

The descriptive statistical analysis and the correlations among variables are illustrated in Table 2. Education popularity, human capital and tourism demand have great differences, and their standard deviations are 1.13, 1.23 and 1.02, respectively. The differences of other variables are small, indicating that the degree of dispersion among variables is obvious. The main independent variables concerned in the study are significantly correlated with the adoption of smart tourism city policy. Except for the high correlation between fiscal capacity and terminal equipment (γ = 0.85, p < 0.01), the absolute value of the correlation between other independent variables was less than 0.8. Moreover, in order to avoid the impact of multicollinearity among variables on the accuracy of model estimation results, the variance inflation factor (VIF) was employed to test the collinearity of each variable. The maximum value of the VIF of variables is 6.91, which is lower than the multicollinearity warning value of 10 [76], indicating that there is no serious multicollinearity problem among variables.

4.4. Driving Factors of Policy Diffusion

As shown in Table 3, Models 1 to 4 are the regression results of economic lift force, intelligence support force, technological pull force and demand impetus force, respectively. In Model 5, the effects of all driving factors are together analyzed. The models perform best in terms of goodness of fit (i.e., it has the largest value of the log-likelihood function and chi-squared).
According to Model 1, fiscal capacity (H1) has a significant positive impact (β = 0.304, p < 0.01) on the adoption of smart tourism city policy by local governments. In Model 5, fiscal capacity still has a significant positive impact (β = 0.278, p < 0.1) on the policy diffusion. The strong economic strength of a region could provide a stable material guarantee for the construction and operation of smart tourism city. Therefore, the expenditure for science and technology, referring to economic lifting force, positively influenced the policy adoption of government, supporting Hypothesis 1.
Concerning demand impetus force, the effect of tourist demand (H2) on smart tourist city policy diffusion presented in Model 4 (β = 0.656, p < 0.01) and Model 5 (β = 0.548, p < 0.01) is significantly positive, supporting H2, which suggests that tourist demand is the important factor promoting the smart tourist city policy diffusion. With the diversified tourist demand, tourists have higher requirements for the experience quality of the destination. The local governments, with the help of smart tourism city policy, can develop steadily in the fierce tourism market, provide tourists with more convenient services, meet their personalized needs and enhance their tourism experience. In addition, the implementation of smart tourism city policy can quickly discover the needs of tourists with the help of a big data platform, thereby achieving accurate management of tourist demand.
As for the intellectual support force, both education popularity (H3) and human capital (H4) positively affect the adoption of smart tourism city policy. Specifically, in Model 2, human capital has a significant influence on the adoption of smart tourism city policy (β = 0.544, p < 0.01), supporting H4. However, the positive effect of education popularity on the policy diffusion of smart tourism city is not significant (β = 0.031, p > 0.1), and thus H3 is not supported. Furthermore, in Model 5, the positive impact of education popularity (β = 0.173, p > 0.1) and human capital (β = 0.4390, p < 0.01) on policy adoption remains robust. Therefore, we infer that professional talent teams are needed for the early preparation and later operation of smart tourism city. The number of students in regular institutions of higher education indicates the rich degree of intellectual resources in the city, which can provide human resources guarantee for the government to adopt policies. The expenditure for education includes not only higher education but also pre-school education, compulsory education and secondary education, with higher education accounting for only a part of the expenditure.
From the perspective of technological pull force, smart infrastructure (H5) and terminal equipment (H6) positively influence the adoption of smart tourism city but not significantly. In Model 3, the regression coefficients of smart infrastructure and terminal equipment are 0.054 and 0.685, respectively. Additionally, in Model 5, both smart infrastructure (β = 0.079, p > 0.1) and terminal equipment (β = 0.247, p > 0.1) also do not significantly affect the policy adoption. Thus, we claim that H4a and H4b are not supported. We infer that although the number of subscribers of mobile telephones and telecommunication services can explain the development level of regional information technology and utilization rate of smart tourism facilities to a certain extent, the beneficiaries are more local urban residents than tourists. However, the adoption of smart tourism city policy should pay more attention to the benefits and use of long-distance tourists.
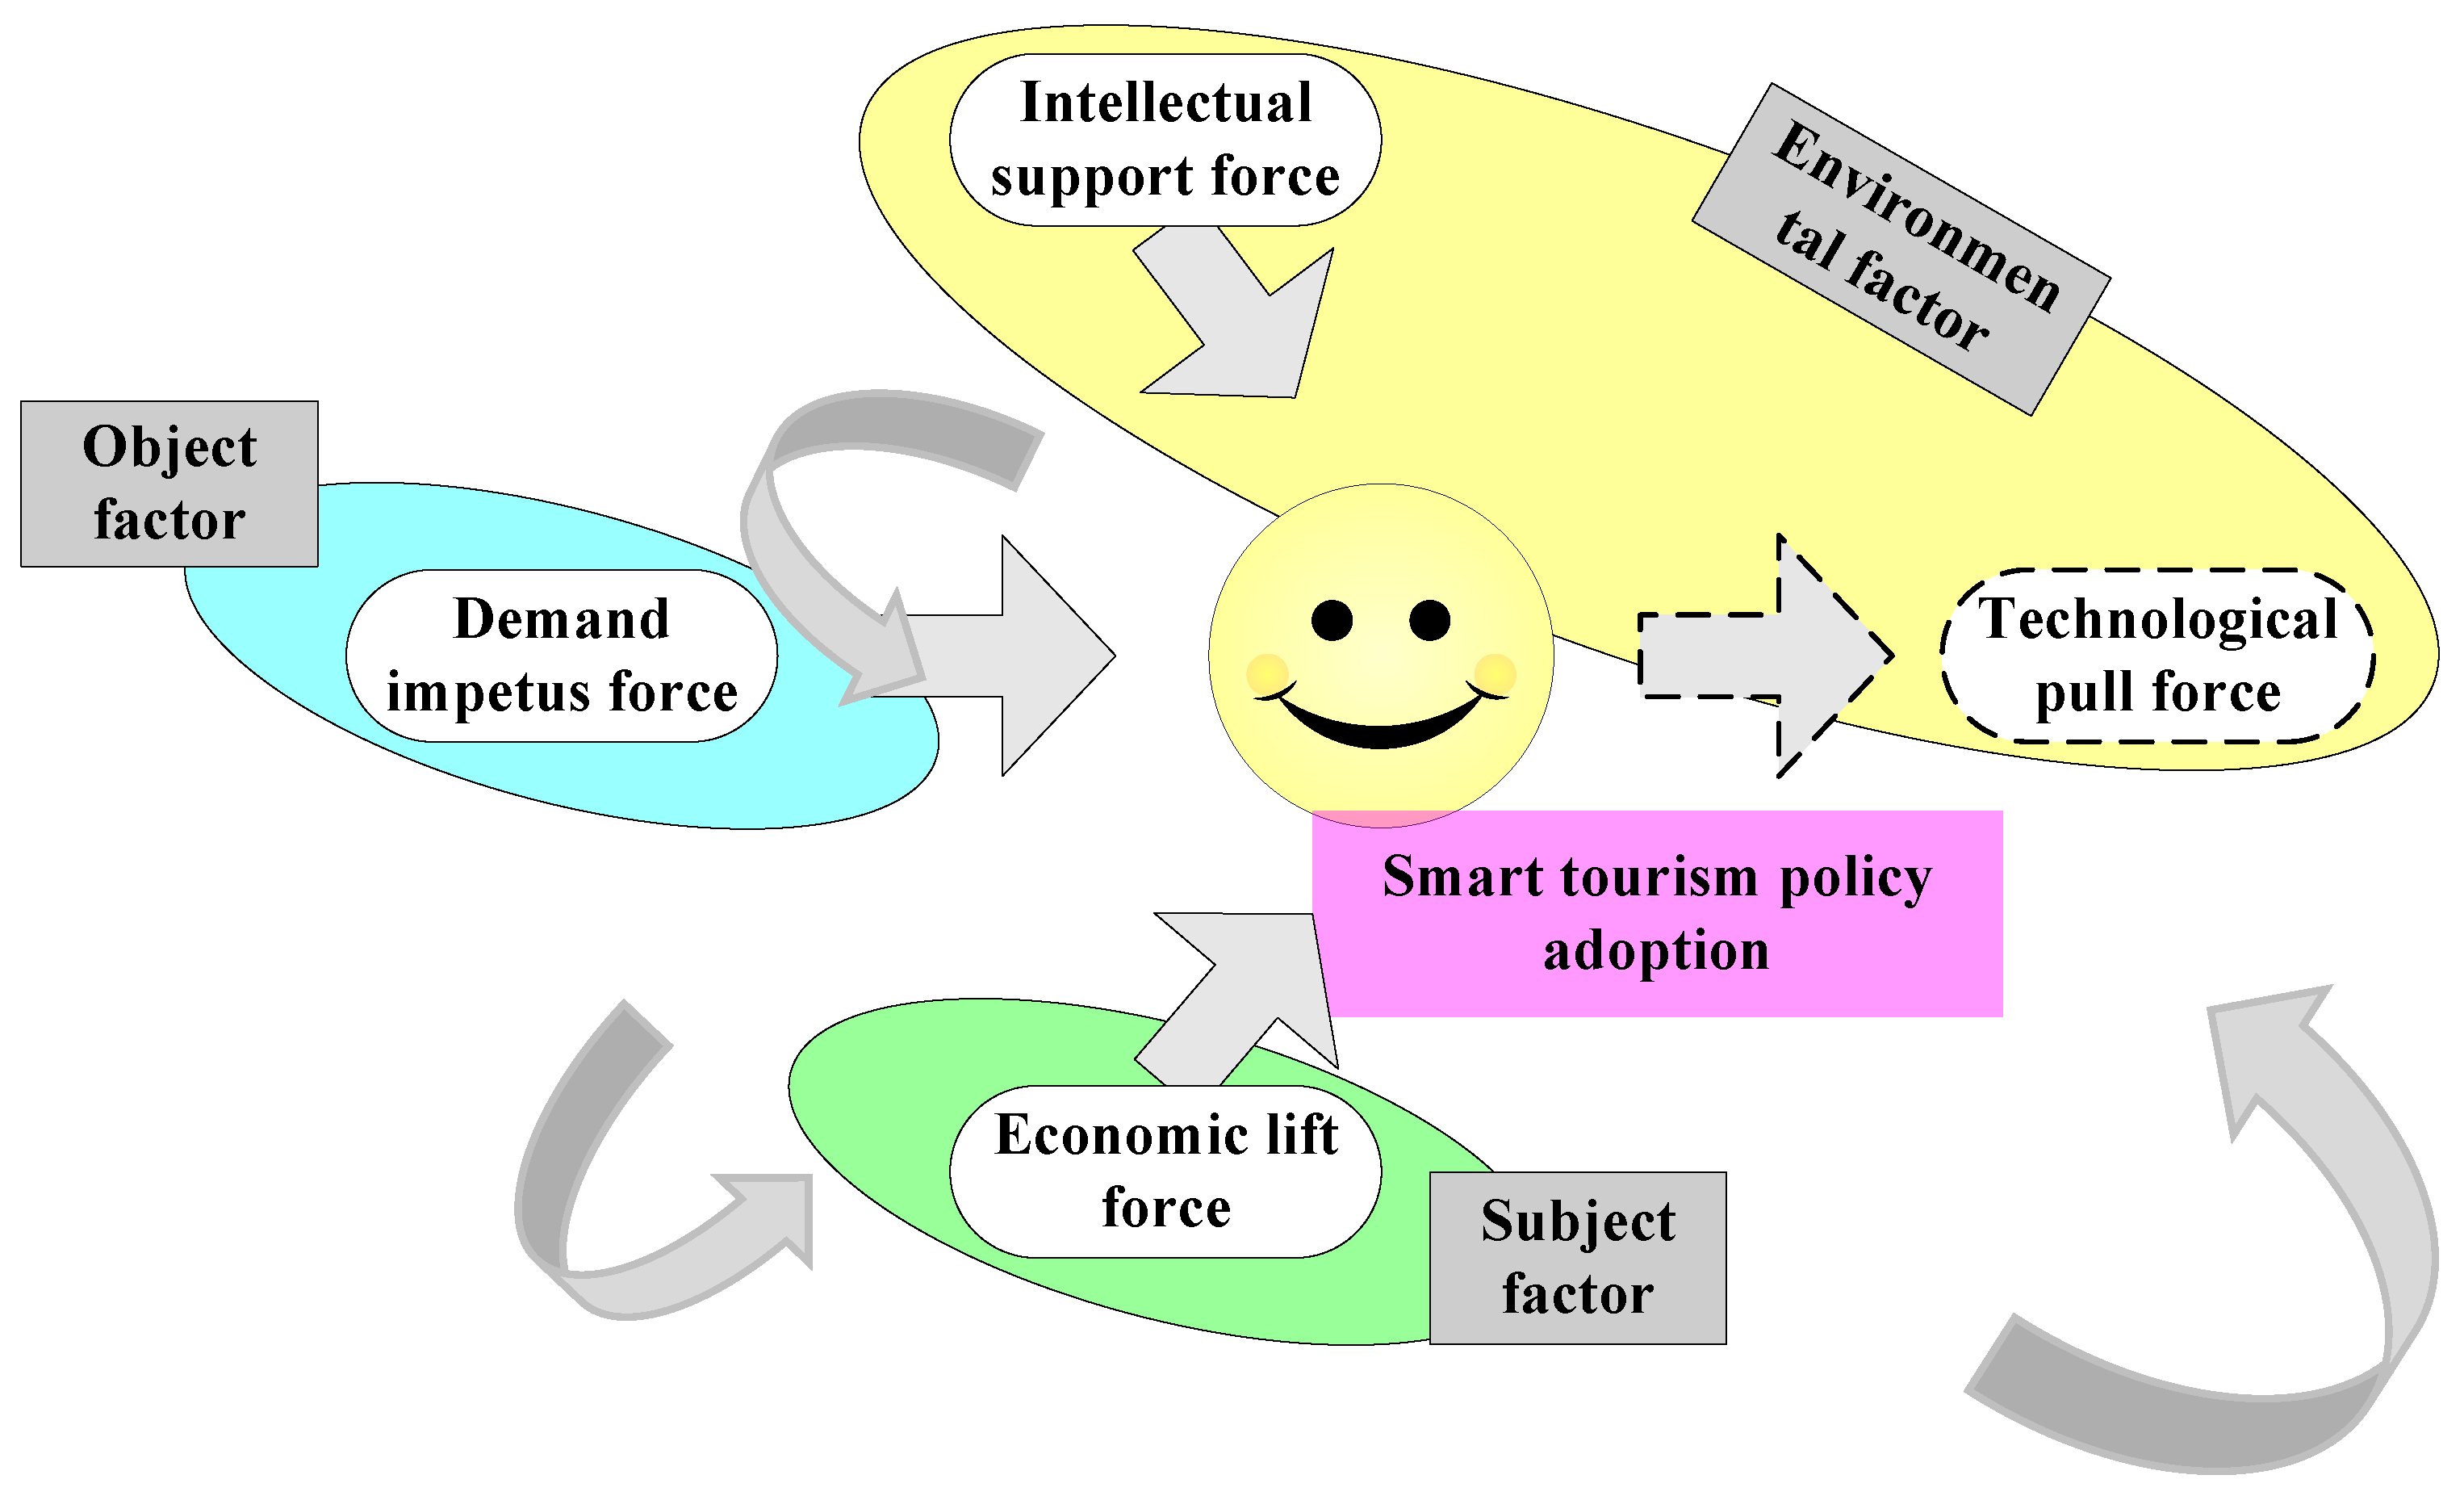
To sum up, the diffusion of smart tourism city policy is influenced by multiple driving forces, including demand impetus force, intelligence support force and economic lift force (Figure 4). However, technological pull force does not significantly promote the diffusion of smart tourism city policy. Therefore, we deduce that technology may no longer be an important factor that significantly affects the construction of smart tourism city.

5. Conclusions and Implications

5.1. Conclusions and Discussion

The premise of achieving sustainable development of smart tourism city is to understand the diffusion mechanisms of smart tourism city policy. This study not only analyzed the diffusion characteristics of smart tourism city policy from the spatial-temporal perspective with a dataset of 249 prefecture-level cities in China but also employed event history analysis to examine the impact of economic lift force, intellectual support force, technological pull force and demand impetus force on the diffusion of smart tourism city policy and discovered several conclusions as follows.
First, in terms of temporal dimension, the diffusion of smart tourism city policy is gradual, presenting the typical S-shaped curve in cumulative adoptions over time consistent with the previous results [74,75,77], which further extend the applicable boundary of the S-shaped curve of cumulative frequency distribution.
Second, the diffusion of smart tourism city policy in China presents obvious spatial characteristics with an evolution from the eastern coastal areas to inland areas in central China. In addition, the spatial distribution conforms to the spatial characteristics of the Hu Line, forming contiguous clusters and distribution in the east of the Hu Line where population and economic activities are intensive and scattered in the west of the Hu Line where science and technology development is relatively backward, which also broadens the application boundary of the Hu Line.
Third, the diffusion of smart tourism city policy in China is mainly influenced by multiple factors, including economic lift force, intellectual support force, technological pull force and demand impetus force. Specifically, fiscal capacity, human capital and tourist demand play a positive role in promoting the policy adoption, and tourist demand plays an important role in promoting the policy practice [58]. Human capital determines the absorptive capacity of local policies, which can provide information technology needed for the construction of smart tourism cities [65]. Moreover, we argue that regions with a certain amount of financial security tend to be more able and motivated to implement new policies [78]. Education popularity, smart infrastructure and terminal equipment have a positive effect on policy adoption but not significant. Human resource is an important factor affecting the adoption of smart tourism city policy [75]. We argue that there is a close connection between human resource and education popularity; however, education popularity cannot promote policy practice in the study, which indicates that talent cultivation in specific areas in the region requires to be improved. Additionally, the popularization of information technology can improve the tourist experience; however, the beneficiaries of revenue from telecommunication services and number of subscribers of mobile telephones at year end selected in this study may be more inclined to local residents than tourists. Thereby, we believe that this is an important reason for the insignificant effect of technological pull factors and the policy adoption.

5.2. Research Implication

Smart tourism cities are the future, and there have been scattered attempts in the literature to examine and explore the strategies employed to develop and implement them. The study offers new knowledge that could be used by policymakers involved in sustainable smart tourism cities to develop the required conditions and substructures for the effective implementation of sustainable smart tourism cities. Therefore, on the basis of revealing the driving sources of smart tourism city policy diffusion in China, this study puts forward the following optimization suggestions.
This study indicates that the smart tourism city policy is spread around the first batch of smart tourism city. We notice that the central government plays an important role in promoting the new policy. Therefore, the central government should not only take the lead in implementing new policy but also become a model for provincial and prefecture-level governments to give full play to their guiding role. Meanwhile, the study further suggests that the areas adopted by the smart tourism city policy are mostly concentrated in the east of the Hu Line. Therefore, according to the principle of regional balance, the central government can promote policy implementation through policy pilot, gradually spread from the eastern region to the western region and then spread the policy to the whole country, thus promoting the sustainable development of smart tourism city.
Smart tourism is essential for strengthening tourism competitiveness and maximizing visitor satisfaction, thus providing practical implications for promoting sustainable development of tourist cities. Therefore, in addition to considering the spatial and temporal characteristics of smart tourism city policy diffusion, further relevant suggestions can be made in terms of the driving factors affecting smart tourism city policy diffusion. Specifically, superior government should give guidance and increase resources to support the adoption of policies by local governments. At the same time, the local governments should increase financial investment in relevant areas to ensure that policies are implemented in place. It is also very important to introduce technology-oriented professionals. The government can cooperate with universities and technology-oriented enterprises to train technology-oriented professionals. In addition, it is necessary to improve its information technology level, integrate information with the tourism industry, build digital tourism and smart tourism platforms and give full play to the role of information technology in policy diffusion to meet the diversified needs of tourists.
Additionally, based on the analysis of the domestic and international policy diffusion theory and exploration of the current circumstances of China’s smart tourism city, we constructed a driving mechanism of smart tourism city policy diffusion. To our knowledge, this study not only may be the first attempt to explore the driving mechanism of smart tourism city policy diffusion in China, which verified the feasibility and applicability of the integration model of policy diffusion proposed by Wejnert [54], extending it to the smart tourism city in China. This driving mechanism may be beneficial to promoting the adoption of smart tourism city policy and the sustainable development of tourism, before and after the mitigation of COVID-19.
Even though this study contributed to the literature about policy diffusion and sustainable urban development, we still hope future studies will address the limitations of this study to deepen our understanding of policy diffusion among cities. Due to the availability of data, some key driving factors selected for affecting policy diffusion of smart tourism city may not cover all influencing factors. It would be desirable to include more driving forces, such as hierarchical effect [75], which helps to dig into the motivational bases of policy adoption. Second, there may be interaction effects between different influencing factors on policy diffusion [79]. Furthermore, different influencing factors may have different effects at different periods [53]. Thereby, future research can further investigate the role of influencing factors at different periods and analyze the interaction effect between influencing factors. Third, the measurement method of smart tourism city policy through the dichotomous variable in this study can only reflect the adoption situation, which has certain limitations. However, there are differences in the degree and effect of policy implementation in different cities. Therefore, the policy adoption and effective implementation can be worth further exploration in the future.

Author Contributions

Writing–original draft, Y.J.; Writing–review & editing, J.Y. All authors have read and agreed to the published version of the manuscript.

Funding

Research funded by Open Fund project of Digital Fujian Tourism Big Data Institute in 2020 (DFJTBDRI2020102).

Institutional Review Board Statement

Not applicable.

Informed Consent Statement

Informed consent was obtained from all subjects involved in the study.

Data Availability Statement

The datasets used and/or analyzed during the current study are available from the first author on reasonable request at [email protected].

Conflicts of Interest

The authors declare no conflict of interest.

References

  1. Ashworth, G.; Page, S.J. Urban tourism research: Recent progress and current paradoxes. Tour. Manag. 2011, 32, 1–15. [Google Scholar] [CrossRef]
  2. Pearce, D.G. An integrative framework for urban tourism research. Ann. Tour. Res. 2001, 28, 926–946. [Google Scholar] [CrossRef]
  3. Zheng, W.; Jia, H.; Lin, C.; Wang, W.; Yu, B. Using a heuristic approach to design personalized urban tourism itineraries with hotel selection. Tour. Manag. 2020, 76, 103956. [Google Scholar] [CrossRef]
  4. Wang, J.; Huang, X.; Gong, Z.; Cao, K. Dynamic assessment of tourism carrying capacity and its impacts on tourism economic growth in urban tourism destinations in China. J. Destin. Mark. Manag. 2020, 15, 100383. [Google Scholar] [CrossRef]
  5. Graymore, M.L.M.; Sipe, N.G.; Rickson, R.E. Sustaining Human Carrying Capacity: A tool for regional sustainability assessment. Ecol. Econ. 2010, 69, 459–468. [Google Scholar] [CrossRef]
  6. Saveriades, A. Establishing the social tourism carrying capacity for the tourist resorts of the east coast of the Republic of Cyprus. Tour. Manag. 2000, 21, 147–156. [Google Scholar] [CrossRef]
  7. Yang, Z.; Yang, H.; Wang, H. Evaluating urban sustainability under different development pathways: A case study of the Beijing-Tianjin-Hebei region. Sustain. Cities Soc. 2020, 61, 102226. [Google Scholar] [CrossRef]
  8. Antwi-Afari, P.; Owusu-Manu, D.-G.; Ng, S.T.; Asumadu, G. Modeling the smartness or smart development levels of developing countries’ cities. J. Urban Manag. 2021, 10, 369–381. [Google Scholar] [CrossRef]
  9. Jucevičius, R.; Patašienė, I.; Patašius, M. Digital Dimension of Smart City: Critical Analysis. Procedia—Soc. Behav. Sci. 2014, 156, 146–150. [Google Scholar] [CrossRef] [Green Version]
  10. Gretzel, U.; Sigala, M.; Xiang, Z.; Koo, C. Smart tourism: Foundations and developments. Electron. Mark. 2015, 25, 179–188. [Google Scholar] [CrossRef] [Green Version]
  11. Shafiee, S.; Ghatari, A.R.; Hasanzadeh, A.; Jahanyan, S. Developing a model for sustainable smart tourism destinations: A systematic review. Tour. Manag. Perspect. 2019, 31, 287–300. [Google Scholar] [CrossRef]
  12. Mohanty, P.; Hassan, A.; Ekis, E. Augmented reality for relaunching tourism post-COVID-19: Socially distant, virtually connected. Worldw. Hosp. Tour. Themes 2020, 6, 753–760. [Google Scholar] [CrossRef]
  13. UNWTO. UNWTO Launches Global Guidelines to Restart Tourism; UNWTO: Madrid, Spain, 2020. [Google Scholar]
  14. Um, T.; Chung, N. Does smart tourism technology matter? Lessons from three smart tourism cities in South Korea. Asia Pac. J. Tour. Res. 2021, 26, 396–414. [Google Scholar] [CrossRef]
  15. Li, Y.; Hu, C.; Huang, C.; Duan, L. The concept of smart tourism in the context of tourism information services. Tour. Manag. 2017, 58, 293–300. [Google Scholar] [CrossRef]
  16. Bastidas, A.; Sánchez-Fernández, J.; Casado-Aranda, L.-A. The Past, Present, and Future of Smart Tourism Destinations: A Bibliometric Analysis. J. Hosp. Tour. Res. 2020, 45, 529–552. [Google Scholar] [CrossRef]
  17. Caragliu, A.; Bo, C.D.; Nijkamp, P. Smart cities in Europe. J. Urban Technol. 2009, 18, 65–82. [Google Scholar] [CrossRef]
  18. Lazaroiu, G.C.; Roscia, M. Definition methodology for the smart cities model. Energy 2012, 47, 326–332. [Google Scholar] [CrossRef]
  19. Paul, V.; Rupesh, K. Responsible tourism: A strategy for grass root level empowerment. Innov. Issues Approaches Soc. Sci. (IIAAS) 2013, 7, 54–71. [Google Scholar]
  20. Mihalic, T. Sustainable-responsible tourism discourse—Towards ‘responsustable’ tourism. J. Clean. Prod. 2016, 111, 461–470. [Google Scholar] [CrossRef] [Green Version]
  21. Frey, N.; George, R. Responsible tourism management: The missing link between business owners’ attitudes and behaviour in the Cape Town tourism industry. Tour. Manag. 2010, 31, 621–628. [Google Scholar] [CrossRef]
  22. Wang, X.; Li, X.R.; Zhen, F.; Zhang, J. How smart is your tourist attraction? Measuring tourist preferences of smart tourism attractions via a FCEM-AHP and IPA approach. Tour. Manag. 2016, 54, 309–320. [Google Scholar] [CrossRef]
  23. Morrison, A.; Coca-Stefaniak, J.A. Sustainable tourism in urban destinations. Int. J. Tour. Cities 2021, 7, 881–886. [Google Scholar]
  24. Owaied, H.H.; Farhan, H.A.; Al-Hawamdeh, N.; Al-Okialy, N. A Model for Intelligent Tourism Guide System. J. Appl. Sci. 2011, 11, 342–347. [Google Scholar] [CrossRef] [Green Version]
  25. Cacho, A.; Mendes-Filho, L.; Alves, D.E.; Moura, B. Mobile tourist guide supporting a smart city initiative: A Brazilian case study. Int. J. Tour. Cities 2016, 2, 164–183. [Google Scholar] [CrossRef]
  26. Ruíz, M.A.C.; Bohorquez, S.T.; Molano, J.I.R. Colombian Tourism: Proposal App to Foster Smart Tourism in the Country. J. Comput. Theor. Nanosci. 2017, 23, 10533–10537. [Google Scholar] [CrossRef]
  27. Leung, R. Smart hospitality: Taiwan hotel stakeholder perspectives. Tour. Rev. 2018, 74, 50–62. [Google Scholar] [CrossRef]
  28. Siguaw, J.; Enz, C.; Namasivayam, K. Adoption of information technology in U.S. Hotels: Strategically driven objectives. J. Travel Res. 2000, 39, 192–201. [Google Scholar] [CrossRef]
  29. Šerić, M.; Gil-Saura, I. ICT, IMC, and Brand Equity in High-Quality Hotels of Dalmatia: An Analysis From Guest Perceptions. J. Hosp. Mark. Manag. 2012, 21, 821–851. [Google Scholar] [CrossRef]
  30. Goossen, M.; Meeuwsen, H.; Franke, J.; Kuyper, M. My ideal tourism destination: Personalized destination recommendation system combining individual preferences and GIS data. Inf. Technol. Tour. 2009, 11, 17–30. [Google Scholar] [CrossRef]
  31. Jung, T.; Chung, N.; Leue, C. The determinants of recommendations to use augmented reality technologies: The case of a Korean theme park. Tour. Manag. 2015, 49, 75–86. [Google Scholar] [CrossRef]
  32. Mehraliyev, F.; Chan, R.C.C.; Choi, Y.; Koseoglu, M.A.; Law, R. A state-of-the-art review of smart tourism research. J. Travel Tour. Mark. 2020, 37, 78–91. [Google Scholar] [CrossRef]
  33. Jeong, M.; Shin, H.H. Tourists’ Experiences with Smart Tourism Technology at Smart Destinations and Their Behavior Intentions. J. Travel Res. 2019, 59, 1464–1477. [Google Scholar] [CrossRef]
  34. Lee, H.; Lee, J.; Chung, N.; Koo, C. Tourists’ happiness: Are there smart tourism technology effects? Asia Pac. J. Tour. Res. 2018, 23, 486–501. [Google Scholar] [CrossRef]
  35. Azis, N.; Amin, M.; Chan, S.; Aprilia, C. How smart tourism technologies affect tourist destination loyalty. J. Hosp. Tour. Technol. 2020, 11, 603–625. [Google Scholar] [CrossRef]
  36. Gretzel, U.; Scarpino-Johns, M. Destination resilience and smart tourism destinations. Tour. Rev. Int. 2018, 22, 263–276. [Google Scholar] [CrossRef]
  37. Dey, B.; Sarma, M.K. Information source usage among motive-based segments of travelers to newly emerging tourist destinations. Tour. Manag. 2010, 31, 341–344. [Google Scholar] [CrossRef]
  38. Gretzel, U.; Zhong, L.; Koo, C. Application of smart tourism to cities. Int. J. Tour. Cities 2016, 2. [Google Scholar] [CrossRef]
  39. Koo, C.; Shin, S.; Gretzel, U.; Hunter, W.C.; Chung, N. Conceptualization of smart tourism destination competitiveness. Asia Pac. J. Inf. Syst. 2016, 26, 561–576. [Google Scholar] [CrossRef]
  40. Huang, C.; Yue, X.; Yang, M.; Su, J.; Chen, J. A quantitative study on the diffusion of public policy in China: Evidence from the S&T finance sector. J. Chin. Gov. 2017, 2, 235–254. [Google Scholar]
  41. Walker, J.L. The Diffusion of Innovations among the American States. Am. Political Sci. Rev. 1969, 63, 880–899. [Google Scholar] [CrossRef] [Green Version]
  42. Lucas, A. Public Policy Diffusion Research: Integrating Analytic Paradigms. Sci. Commun. 1983, 4, 379–408. [Google Scholar] [CrossRef]
  43. Shipan, C.R.; Volden, C. Policy Diffusion: Seven Lessons for Scholars and Practitioners. Public Adm. Rev. 2012, 72, 788–796. [Google Scholar] [CrossRef] [Green Version]
  44. Sun, H.; Su, J.; Ma, L. The diffusion of the utility tunnel policy: Evidence from Chinese cities. Util. Policy 2021, 72, 101271. [Google Scholar] [CrossRef]
  45. Zimm, C. Improving the understanding of electric vehicle technology and policy diffusion across countries. Transp. Policy 2021, 105, 54–66. [Google Scholar] [CrossRef]
  46. Ruiz-Villaverde, A.; Chica-Olmo, J.; Gonzalez-Gomez, F. Do small municipalities imitate larger ones? Diffusion of water privatization policies. Urban Water J. 2018, 15, 138–149. [Google Scholar] [CrossRef]
  47. GiHeon, K.; Inseok, S. A Study on the Impact of Policy Learning on Policy Diffusion: Focusing on Childbirth Support Policy. Korea Assoc. Policy Stud. 2014, 23, 1–266. [Google Scholar]
  48. Cia Alves, E.E.; Steiner, A.; de Almeida Medeiros, M.; da Silva, M.E.A. From a breeze to the four winds: A panel analysis of the international diffusion of renewable energy incentive policies (2005–2015). Energy Policy 2019, 125, 317–329. [Google Scholar] [CrossRef]
  49. Berry, F.S.; Berry, W.D. State Lottery Adoptions as Policy Innovations: An Event History Analysis. Am. Political Sci. Rev. 1990, 84, 395–415. [Google Scholar] [CrossRef] [Green Version]
  50. Biggers, D.R.; Hanmer, M.J. Who Makes Voting Convenient? Explaining the Adoption of Early and No-Excuse Absentee Voting in the American States. State Politics Policy Q. 2015, 15, 192–210. [Google Scholar] [CrossRef]
  51. Tolbert, P.S.; Zucker, L.G. Institutional Sources of Change in the Formal Structure of Organizations: The Diffusion of Civil Service Reform, 1880–1935. Adm. Sci. Q. 1983, 28, 22–39. [Google Scholar] [CrossRef] [Green Version]
  52. Satterthwaite, S.B. Innovation and Diffusion of Managed Care in Medicaid Programs. State Local Gov. Rev. 2002, 34, 116–126. [Google Scholar] [CrossRef]
  53. Walker, R.M.; Avellaneda, C.N.; Berry, F.S. Exploring The Diffusion Of Innovation Among High And Low Innovative Localities. Public Manag. Rev. 2011, 13, 95–125. [Google Scholar] [CrossRef]
  54. Wejnert, B. Integrating Models of Diffusion of Innovations: A Conceptual Framework. Annu. Rev. Sociol. 2002, 28, 297–326. [Google Scholar] [CrossRef] [Green Version]
  55. Li, J.; Zhang, W. Research on the Diffusion of Government Purchase Service Policies—Event History Analysis Based on 31 Provinces’ Data of China. China Soft Sci. 2019, 60–67. [Google Scholar]
  56. Sugiyama, N.B. Theories of Policy Diffusion: Social Sector Reform in Brazil. Comp. Political Stud. 2008, 41, 193–216. [Google Scholar] [CrossRef]
  57. Boes, K.; Buhalis, D.; Inversini, A. Conceptualising Smart Tourism Destination Dimensions. Inf. Commun. Technol. Tour. 2015, 2015, 391–403. [Google Scholar]
  58. Thomas, J.C.; Streib, G. The New Face of Government: Citizen-Initiated Contacts in the Era of E-Government. J. Public Adm. Res. Theory 2003, 13, 83–102. [Google Scholar] [CrossRef]
  59. Yang, Z.; Jin, F.; Shou, J.; Yang, Y. Landscape planning and design of tourist highway service area under the background of all-for-one tourism system. IOP Conf. Ser. Earth Environ. Sci. 2019, 304, 032092. [Google Scholar] [CrossRef]
  60. Cárdenas-García, P.J.; Rivero, M.S.; Pulido-Fernández, J.I. Does Tourism Growth Influence Economic Development? J. Travel Res. 2013, 54, 206–221. [Google Scholar] [CrossRef]
  61. Gretzel, U.; Koo, C.; Sigala, M.; Xiang, Z. Special issue on smart tourism: Convergence of information technologies, experiences, and theories. Electron. Mark. 2015, 25, 175–177. [Google Scholar] [CrossRef]
  62. Wang, H.; Wei, S. Temporal and Spatial Evolution Mechanisms in Local Government Information Transparency System and Their Implications—Based on the Theory of Policy Diffusion. J. Northeast. Univ. (Soc. Sci.) 2015, 17, 600–605, 612. [Google Scholar]
  63. Kiiski, S.; Pohjola, M. Cross-country diffusion of the Internet. Inf. Econ. Policy 2002, 14, 297–310. [Google Scholar] [CrossRef] [Green Version]
  64. Boes, K.; Buhalis, D.; Inversini, A. Smart tourism destinations: Ecosystems for tourism destination competitiveness. Int. J. Tour. Cities 2016, 2, 108–124. [Google Scholar] [CrossRef]
  65. Savić, J.; Pavlović, G. Analysis of factors of smart tourism development in Serbia. Hotel Tour. Manag. 2018, 6, 81–91. [Google Scholar] [CrossRef]
  66. Moretti, E. Human Capital Externalities in Cities. Handb. Reg. Urban Econ. 2004, 2243–2291. [Google Scholar]
  67. Zhao, L.; Zhang, D. Research on the path of revitalizing rural tourism from the perspective of smart tourism. E3S Web Conf. 2021, 251, 03037. [Google Scholar] [CrossRef]
  68. Adler, J.L.; Blue, V.J. Toward the design of intelligent traveler information systems. Transp. Res. Part C Emerg. Technol. 1988, 6, 157–172. [Google Scholar] [CrossRef]
  69. Ji, J.; Song, Y. A Research on Innovation Diffusion of Government Online Service Policy—An Event History Analysis Based on Data of 32 Prefecture-Level Cities. J. Intell. 2020, 39, 134–143. [Google Scholar]
  70. Gajdosik, T. Smart Tourism: Concepts and Insights from Central Europe. Czech J. Tour. 2018, 7, 25–44. [Google Scholar] [CrossRef] [Green Version]
  71. Su, K.; Li, J.; Fu, H. Smart city and the applications. In Proceedings of the 2011 International Conference on Electronics, Communications and Control (ICECC), Ningbo, China, 9–11 September 2011; pp. 1028–1031. [Google Scholar]
  72. Mooney, C.Z.; Lee, M.-H. Legislative morality in the American states: The case of pre-Roe abortion regulation reform. Am. J. Political Sci. 1995, 39, 599–627. [Google Scholar] [CrossRef]
  73. Bennett, D.S. Parametric Models, Duration Dependence, and Time-Varying Data Revisited. Am. J. Political Sci. 1999, 43, 256–270. [Google Scholar] [CrossRef]
  74. Nicholson-Crotty, S. The Politics of Diffusion: Public Policy in the American States. J. Politics 2009, 7, 192–205. [Google Scholar] [CrossRef]
  75. Brown, L.A.; Cox, K.R. Empirical regularities in the diffusion of innovation. Ann. Assoc. Am. Geogr. 1971, 61, 551–559. [Google Scholar] [CrossRef]
  76. Yoder, K.A.; Whitbeck, L.B.; Hoyt, D.R. Event History Analysis of Antecedents to Running Away from Home and Being on the Street. Am. Behav. Sci. 2001, 45, 51–65. [Google Scholar] [CrossRef]
  77. Gray, V. Innovation in the States: A Diffusion Study. Am. Political Sci. Rev. 1973, 67, 1174–1185. [Google Scholar] [CrossRef]
  78. Berry, F.S. Innovation in Public Management: The Adoption of Strategic Planning. Public Adm. Rev. 1994, 54, 322–330. [Google Scholar] [CrossRef]
  79. Zhang, Y. From State to Market: Private Participation in China’s Urban Infrastructure Sectors, 1992–2008. World Dev. 2014, 64, 473–486. [Google Scholar] [CrossRef]
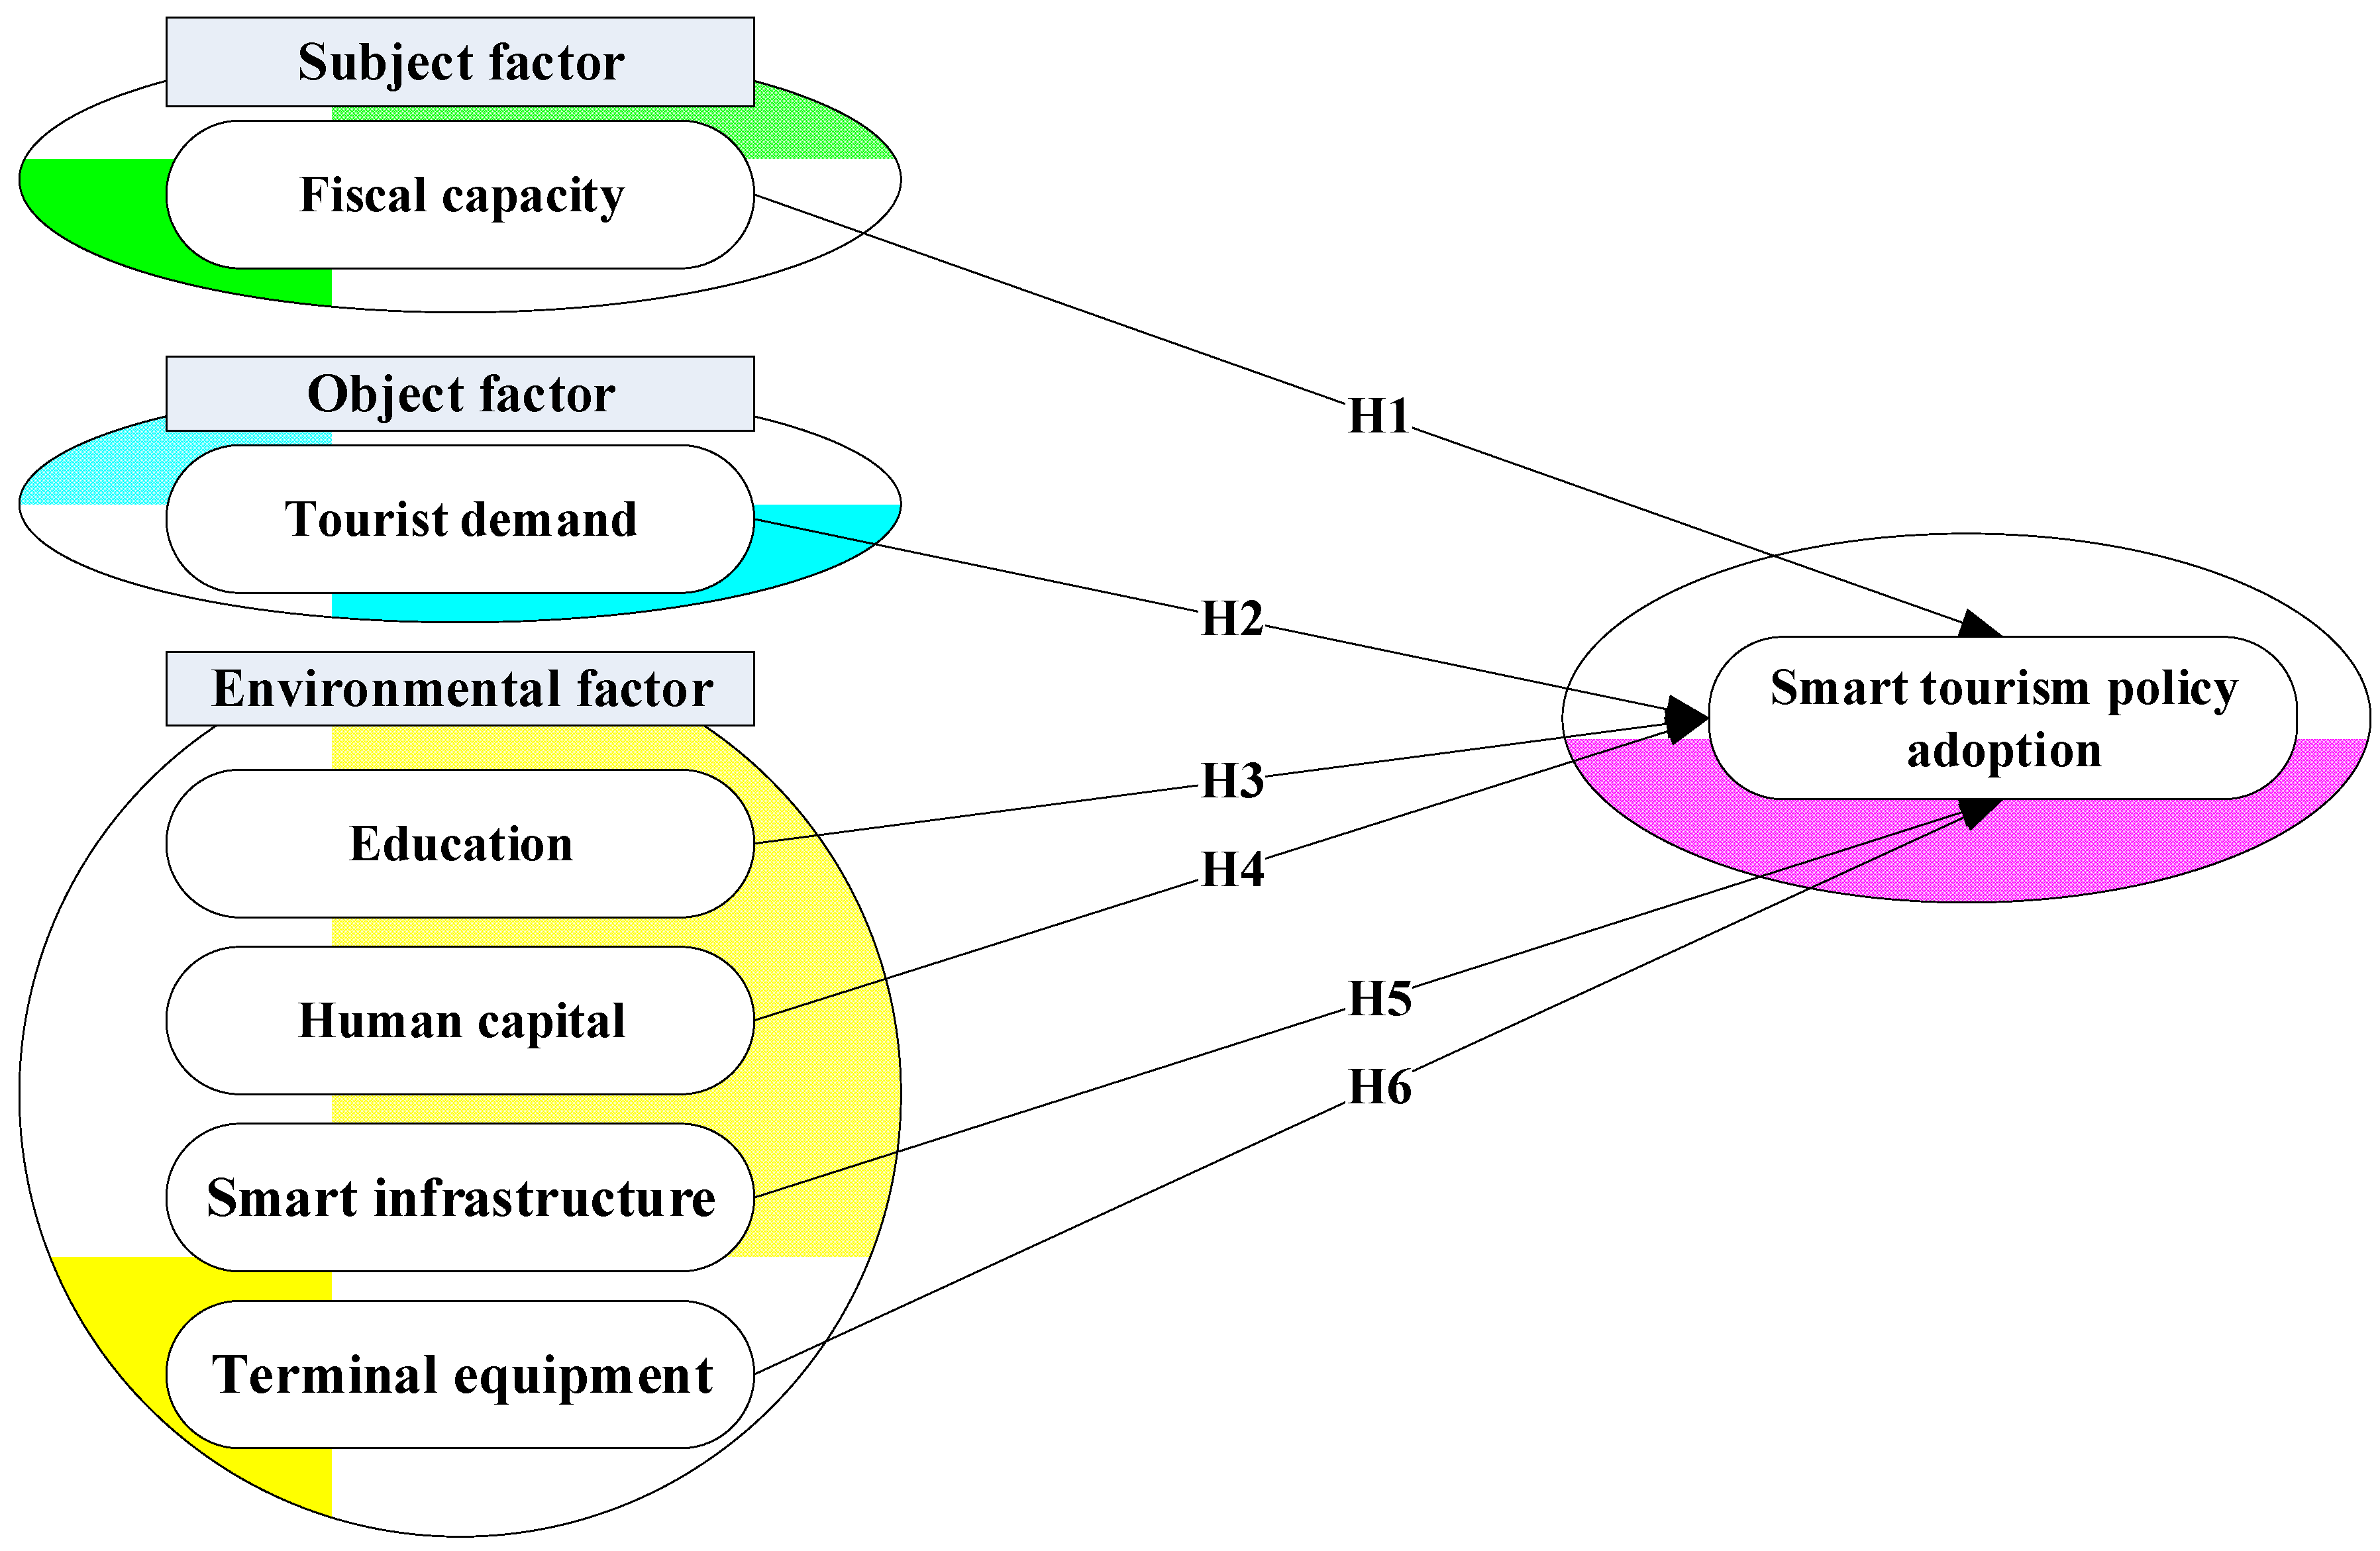
Figure 1. The conceptual model.
Sustainability 14 06685 g001
Figure 2. Temporal characteristics of smart tourism city policy diffusion in China.
Sustainability 14 06685 g002
Figure 3. Spatial characteristics of smart tourism city policy diffusion in China. (a) 2012; (b) 2014; (c) 2016; (d) 2018.
Sustainability 14 06685 g003
Figure 4. Driving mechanism of smart tourism city policy diffusion. Note: the dotted line indicates that the force effect is not significant.
Sustainability 14 06685 g004
Table 1. Variable settings and sources.
VariablesDescriptionsMeasuresData Sources
Dependent variable
AdoptionAdoption of smart tourism city policy 1, if a city adopts smart tourism city policy in this year, otherwise, 0Official Websites of City Governments
Independent variables
ELFTechFiscal capacityExpenditure for science and technology (CNY 10,000)China City Statistical Yearbook
ISFEduEducation popularityExpenditure for education (CNY 10,000)China City Statistical Yearbook
StuHuman capitalNumber of students in regular institutions of higher education (person)China City Statistical Yearbook
TPFTeleSmart infrastructureRevenue from telecommunication services (CNY 10,000)China City Statistical Yearbook
UserTerminal equipmentNumber of subscribers of mobile telephones at year end (10,000 households)China City Statistical Yearbook
DIFRevTourist demandTourism revenue (CNY 100 million)Statistical Bulletin on National Economic and Social Development
Note: ELF = Economic lift force; ISF = Intellectual support force; TPF = Technological pull force; DIF = Demand impetus force.
Table 2. Descriptive statistics and correlational analysis.
VariablesNMSDMinMaxVFIAdoptTechEduStuTeleUserRev
Adopt15640.060.2401 1.00
Tech156410.081.136.6513.832.360.09 ***1.00
Edu156412.930.74−0.9914.622.620.08 ***0.61 ***1.00
Stu156410.241.233.5913.752.160.15 ***0.62 ***0.56 ***1.00
Tele156412.300.849.3114.963.670.11 ***0.64 ***0.66 ***0.64 ***1.00
User15645.6450.673.478.025.800.12 ***0.69 ***0.78 ***0.70 ***0.85 ***1.00
Rev15645.0341.021.537.561.920.14 ***0.64 ***0.55 ***0.55 ***0.57 ***0.60 ***1.00
Note: The values of the independent variables in the table are the logarithmic results; N = Observations, M = Mean, SD = Standard deviation, Min = Minimum value, Max = Maximum value, VFI = Variance inflation factor; *** p < 0.01.
Table 3. Event history analysis based on binary logit regression.
VariablesModel 1Model 2Model 3Model 4Model 5
ELFTech0.304 *** (3.34) 0.278 * (1.90)
ISFEdu 0.031 (0.16) 0.173 (0.97)
Stu 0.544 *** (4.97) 0.439 *** (3.11)
TPFTele 0.054 (0.21) 0.079 (0.30)
User 0.685 ** (2.16) 0.247 (0.64)
DIFRev 0.656 *** (5.45)0.548 *** (3.30)
Constant−5.852 *** (−6.14)−8.087 *** (−3.92)−7.383 *** (−3.98)−6.219 *** (−9.19)−5.632 ** (−2.33)
N15641564156415641564
Log-likelihood−352.643−339.871−346.946−341.671−333.630
Chi-squared11.04 ***36.58 ***22.43 ***32.98 ***49.06 ***
Note: ELF = Economic lift force; ISF = Intellectual support force; TPF = Technological pull force; DIF = Demand impetus force; the regression coefficient is in parentheses, and the standard error is in parentheses; * p < 0.1, ** p < 0.05, *** p < 0.01.
Publisher’s Note: MDPI stays neutral with regard to jurisdictional claims in published maps and institutional affiliations.