
A Resilient and Nature-Based Drinking Water Supply Source for Saline and Arsenic Prone Coastal Aquifers of the Bengal Delta


Abstract
:1. Introduction
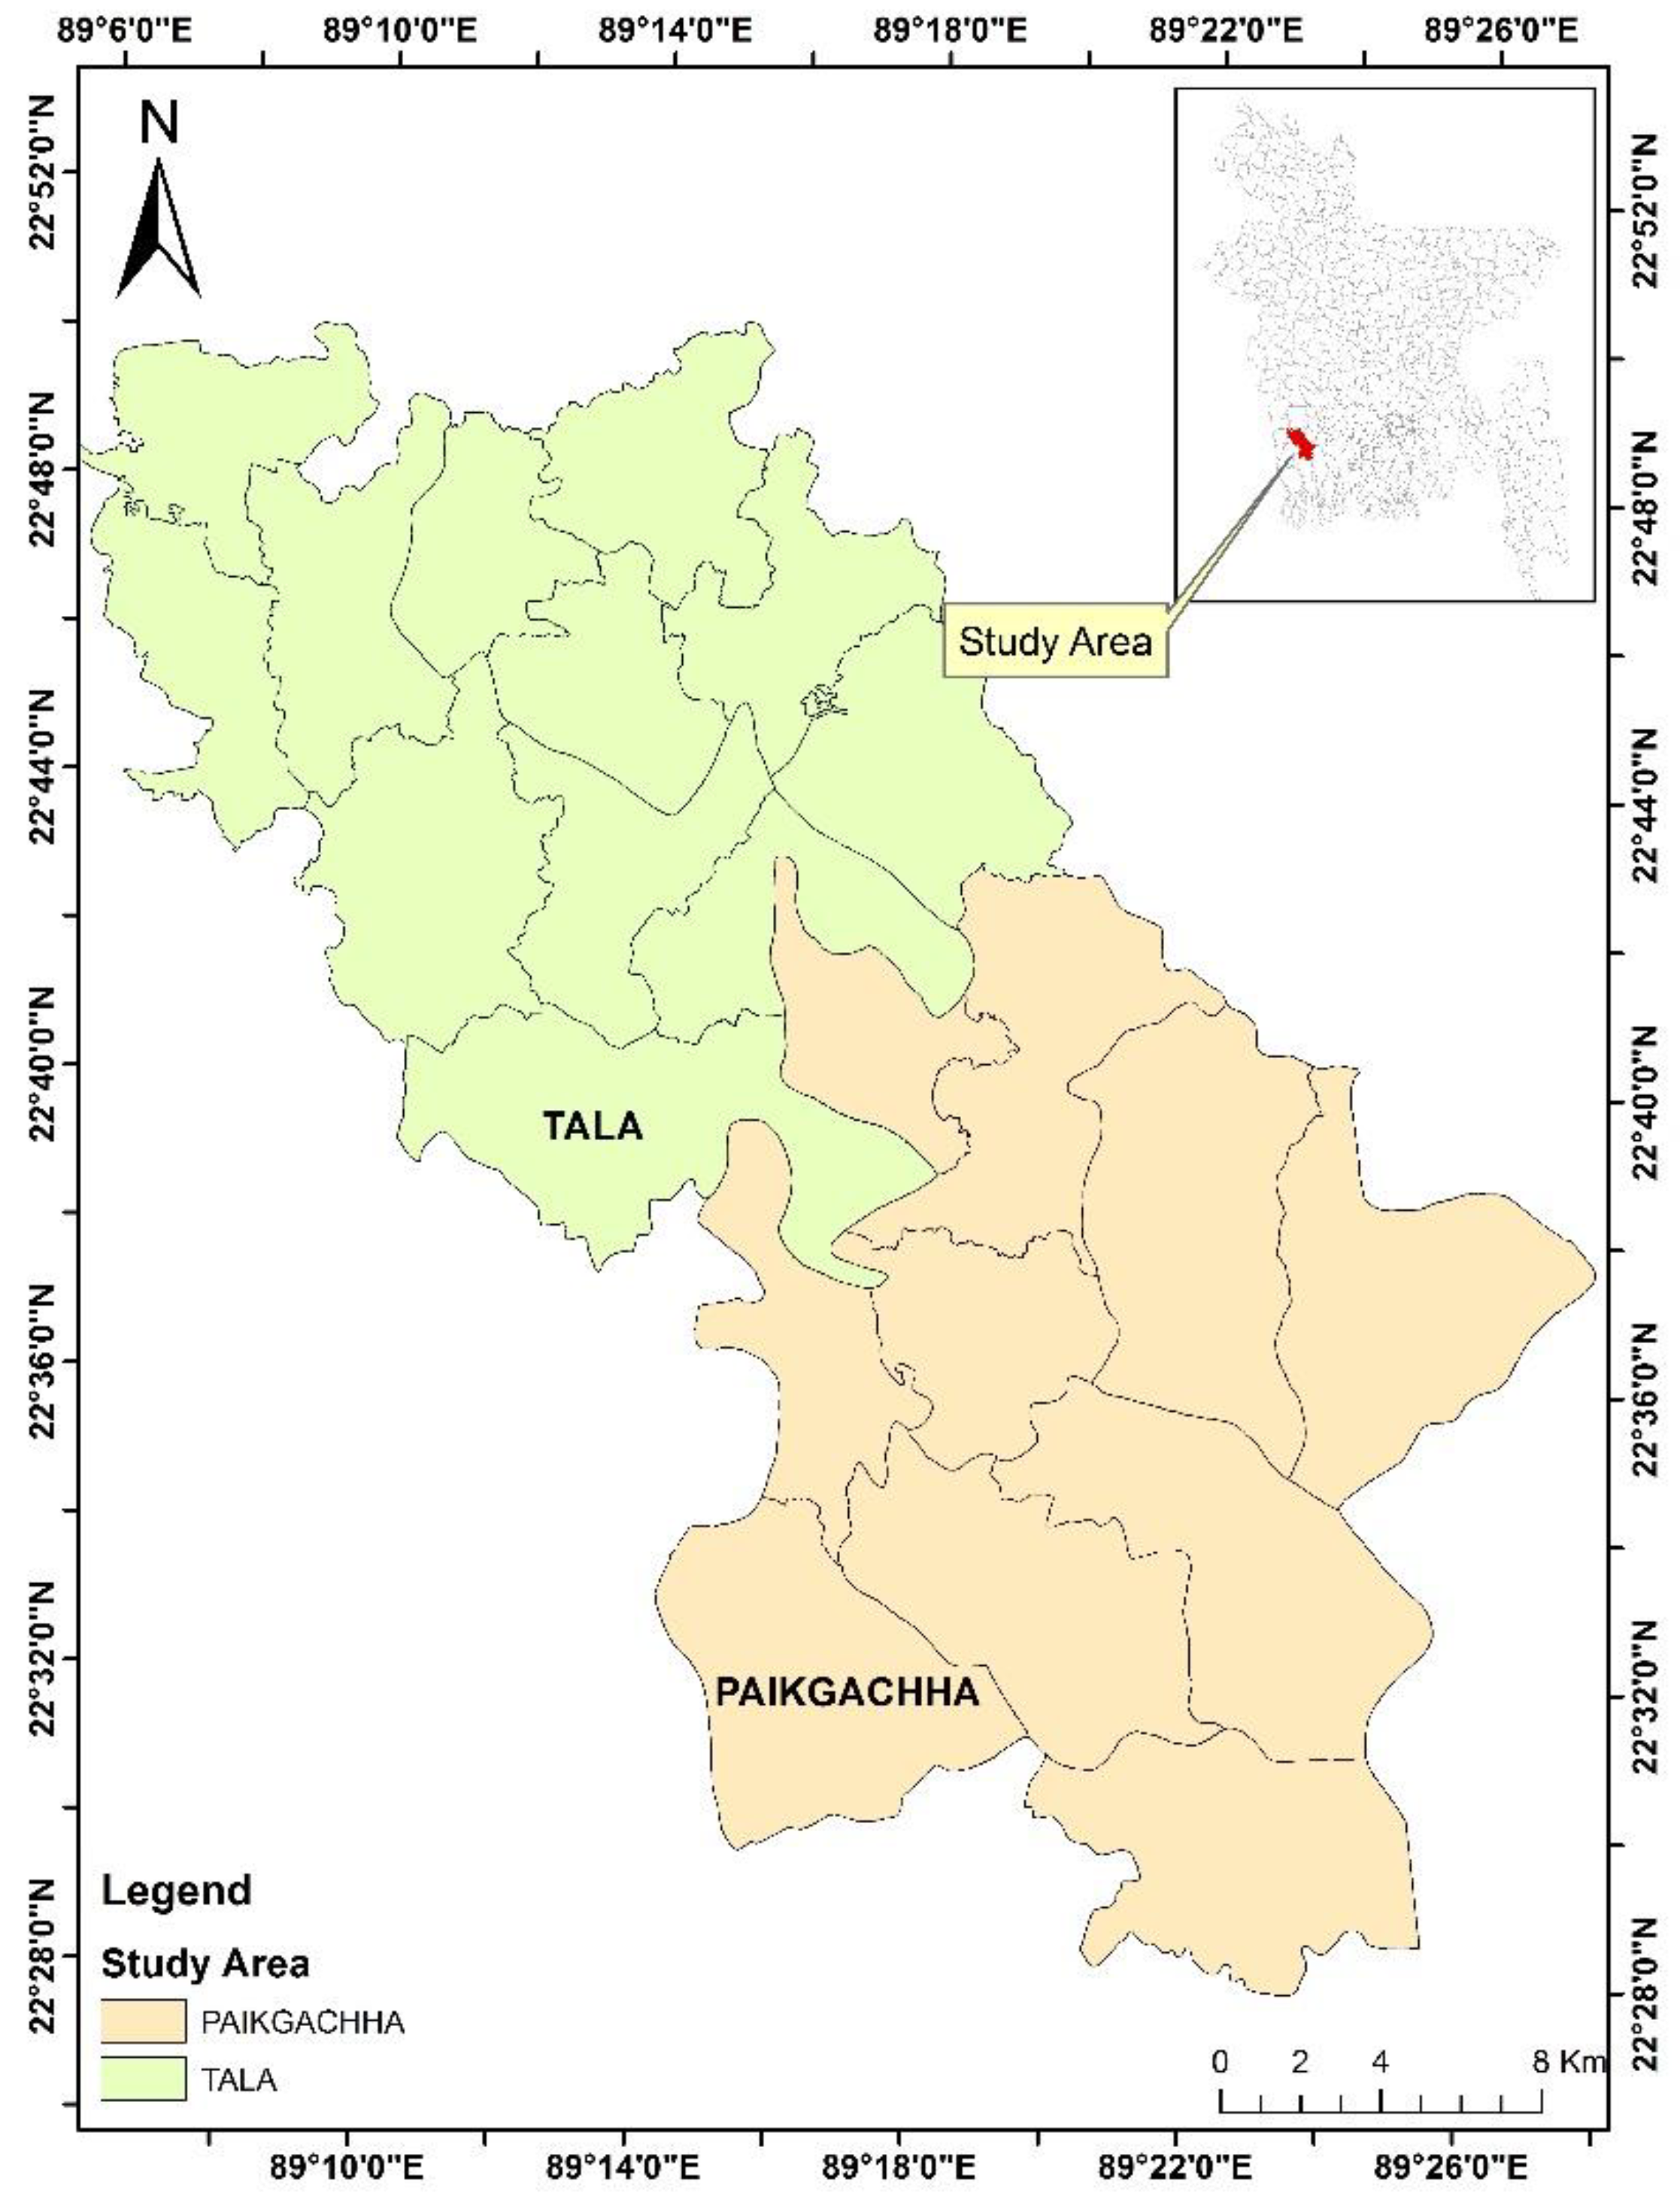
2. Study Area
Hydrogeologic Settings of the Study Area
3. Methodology
3.1. Assessment of Socioeconomic Status
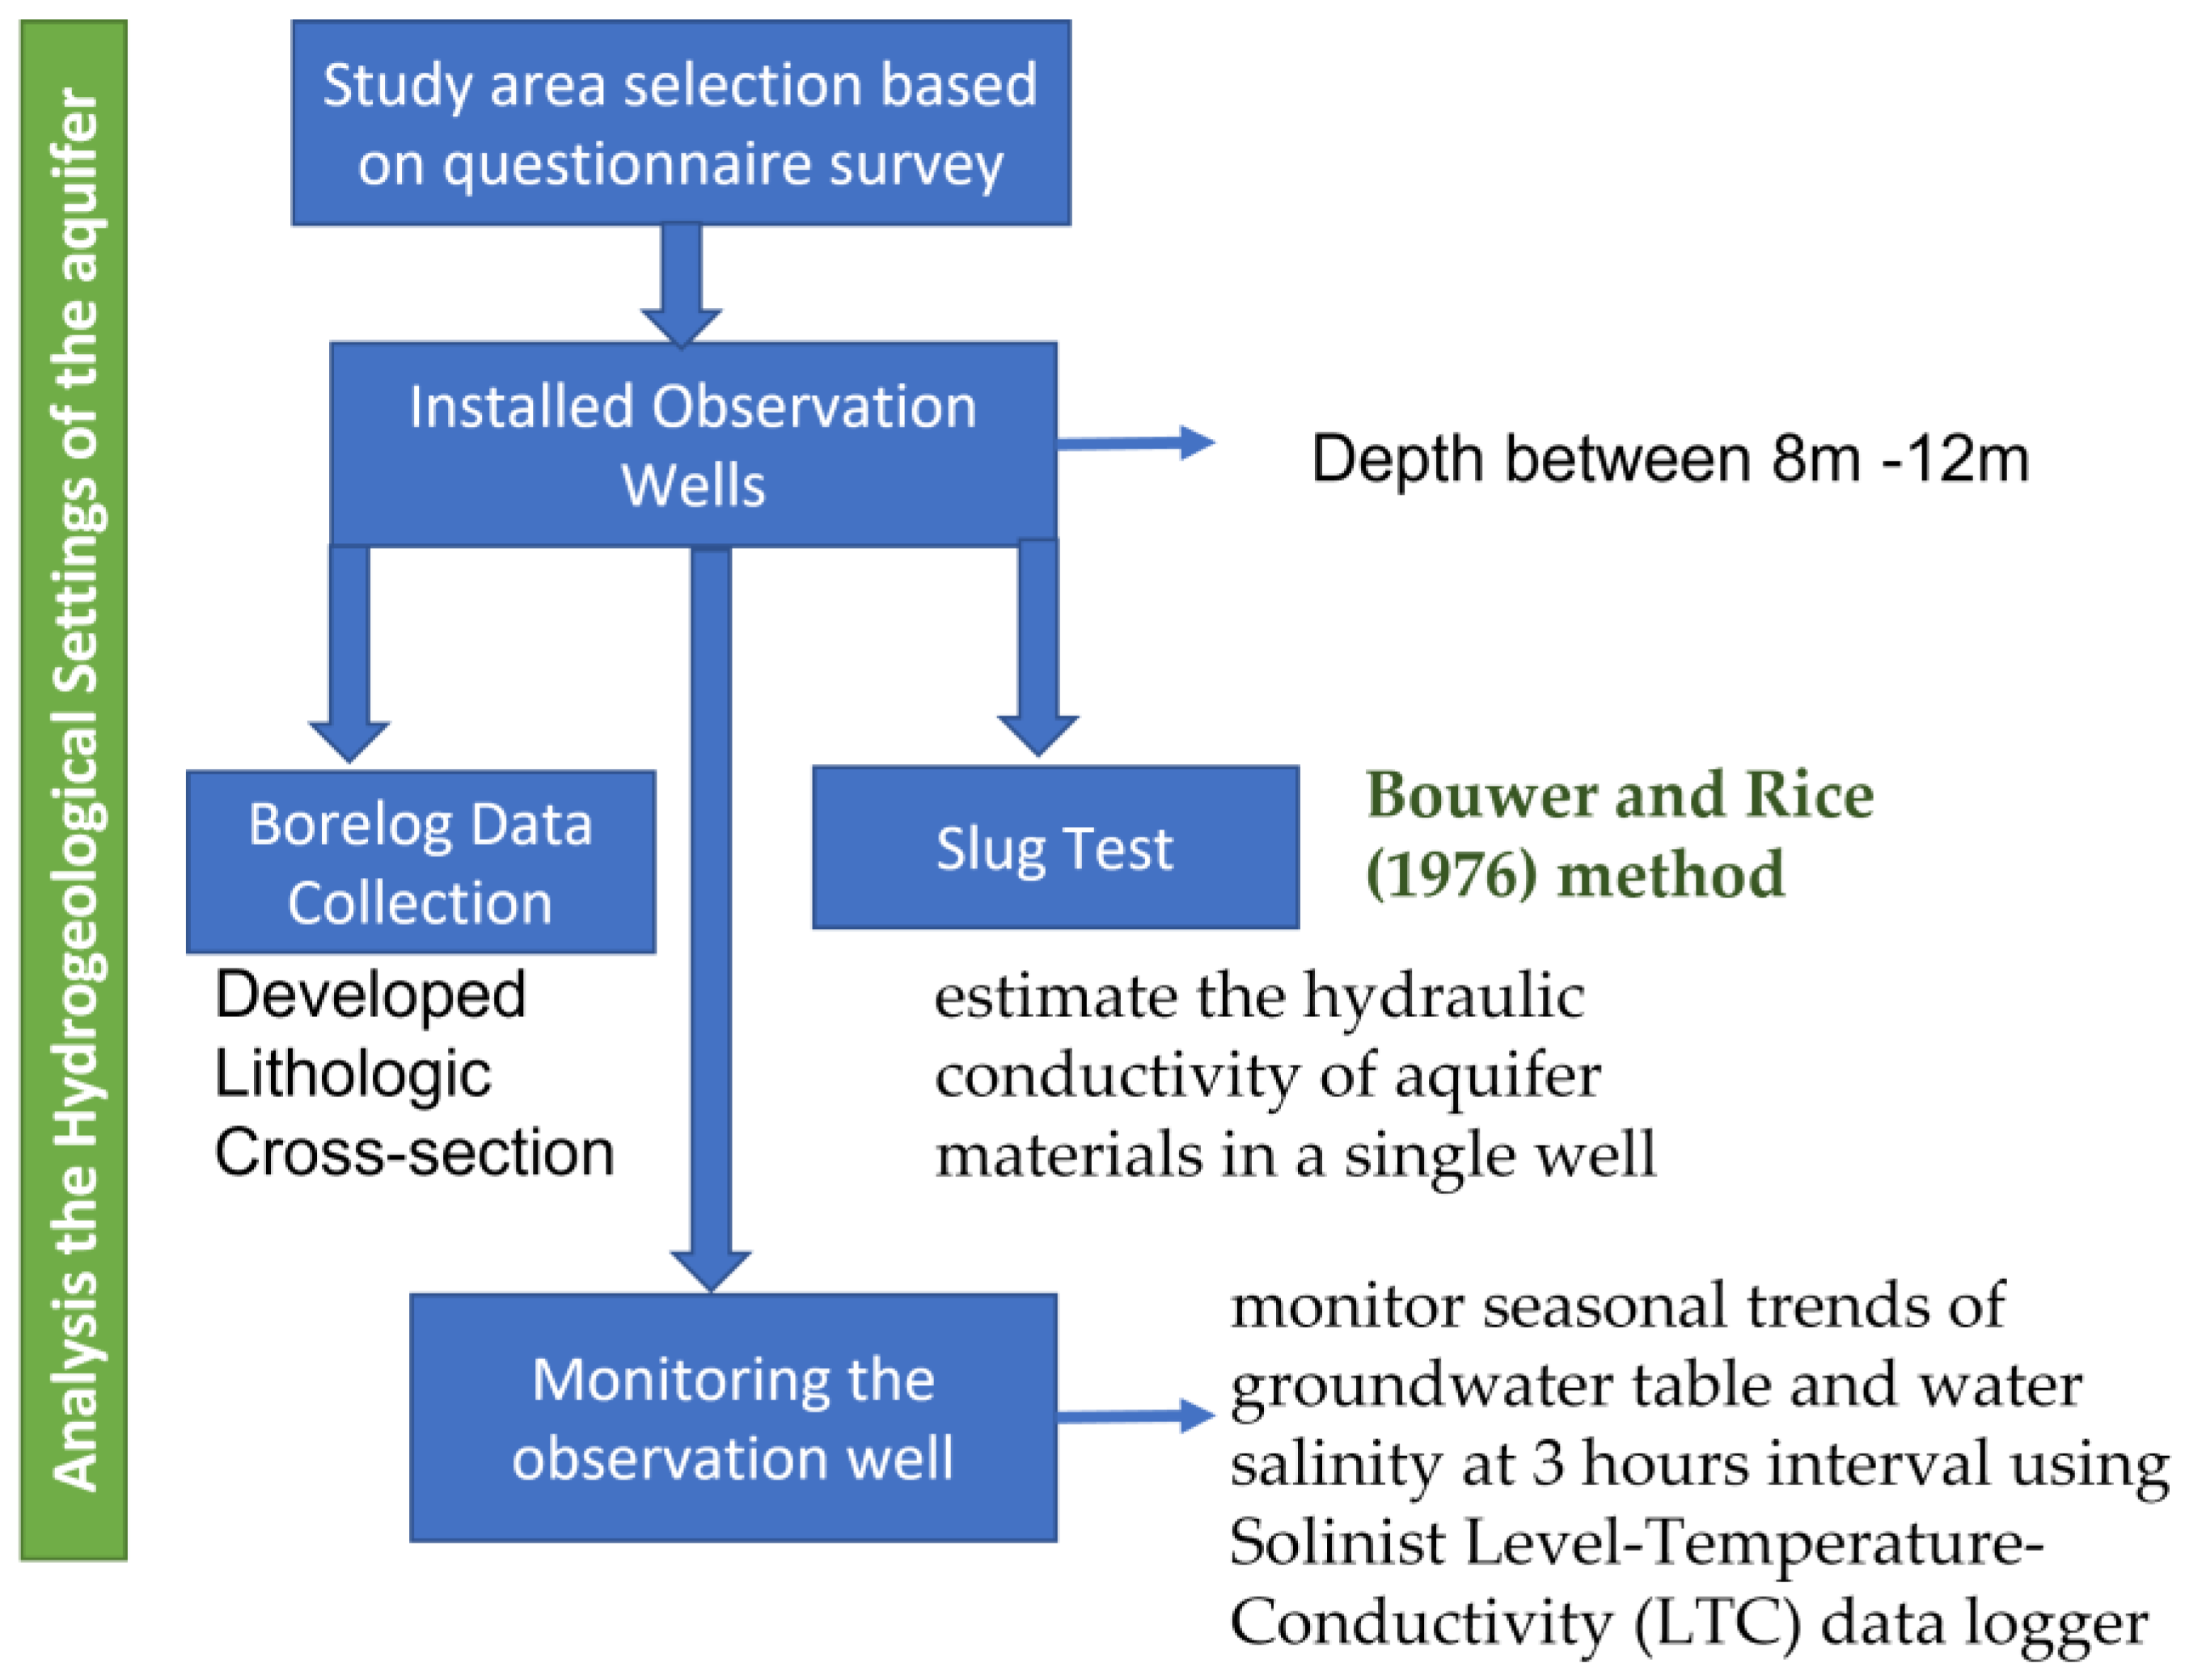
3.2. Analysis of the Hydrogeological Settings
3.3. Analysis of the Geochemical Parameters
4. Results and Discussion
4.1. Assessment of Social Challenges through Questionnaire Survey
4.2. Hydrogeologic Settings Analysis
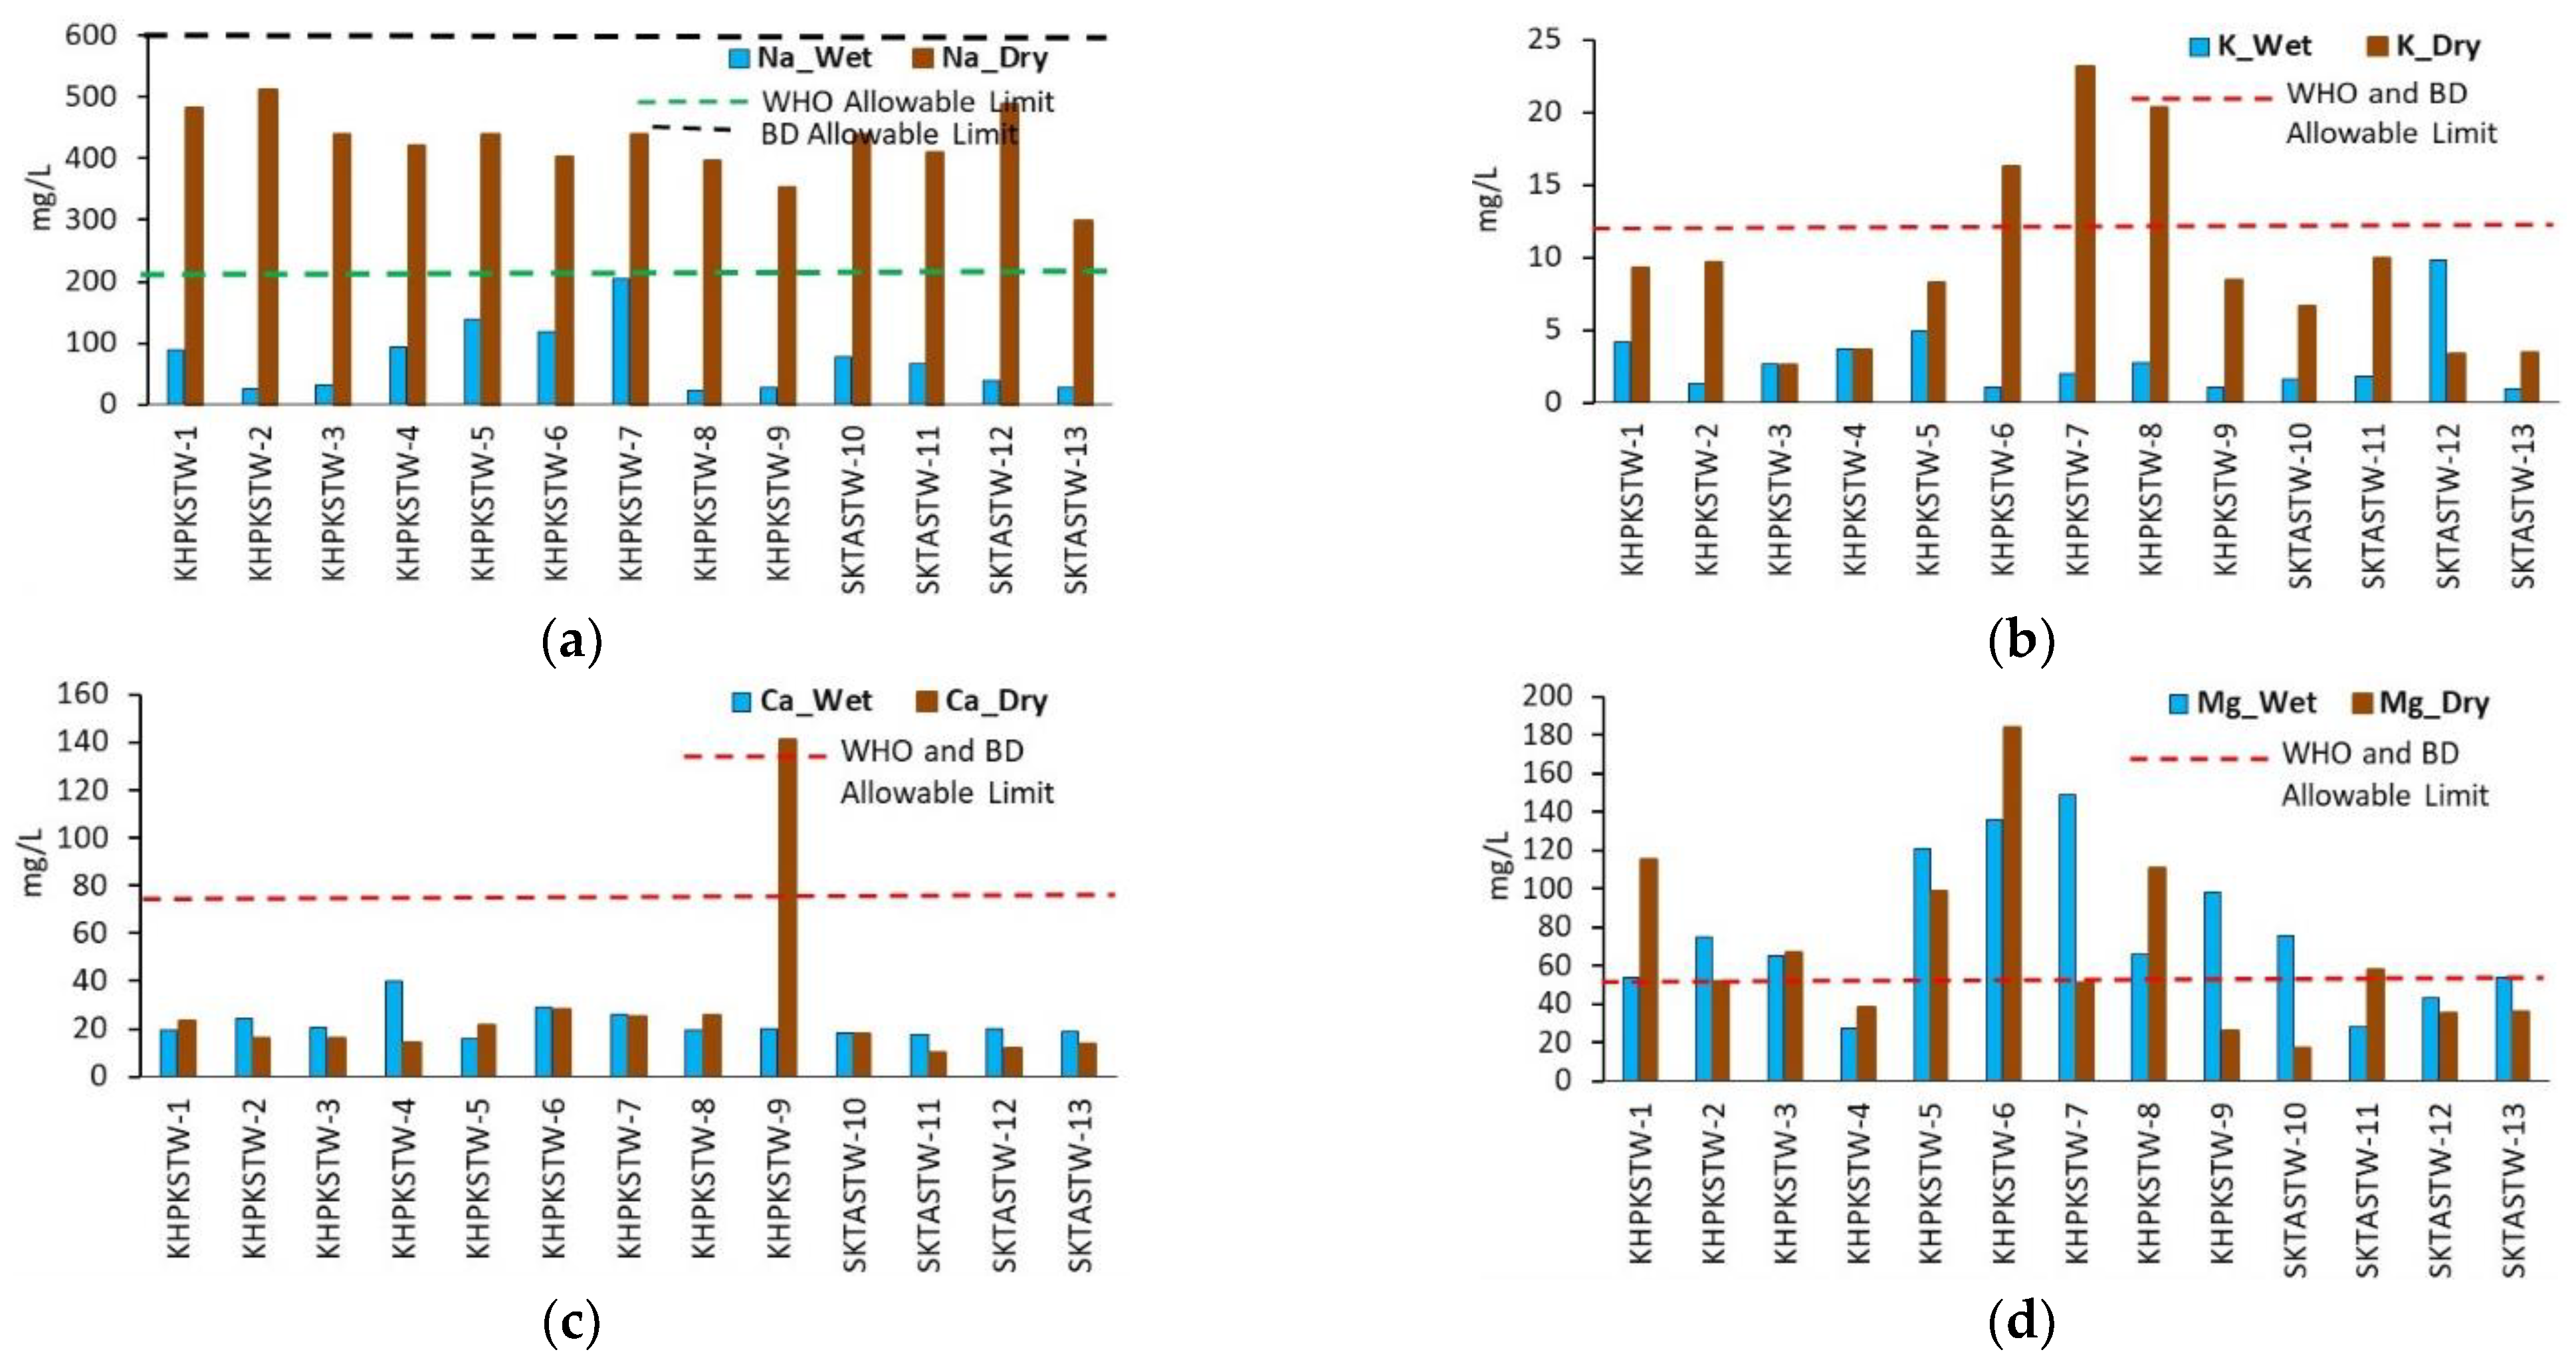
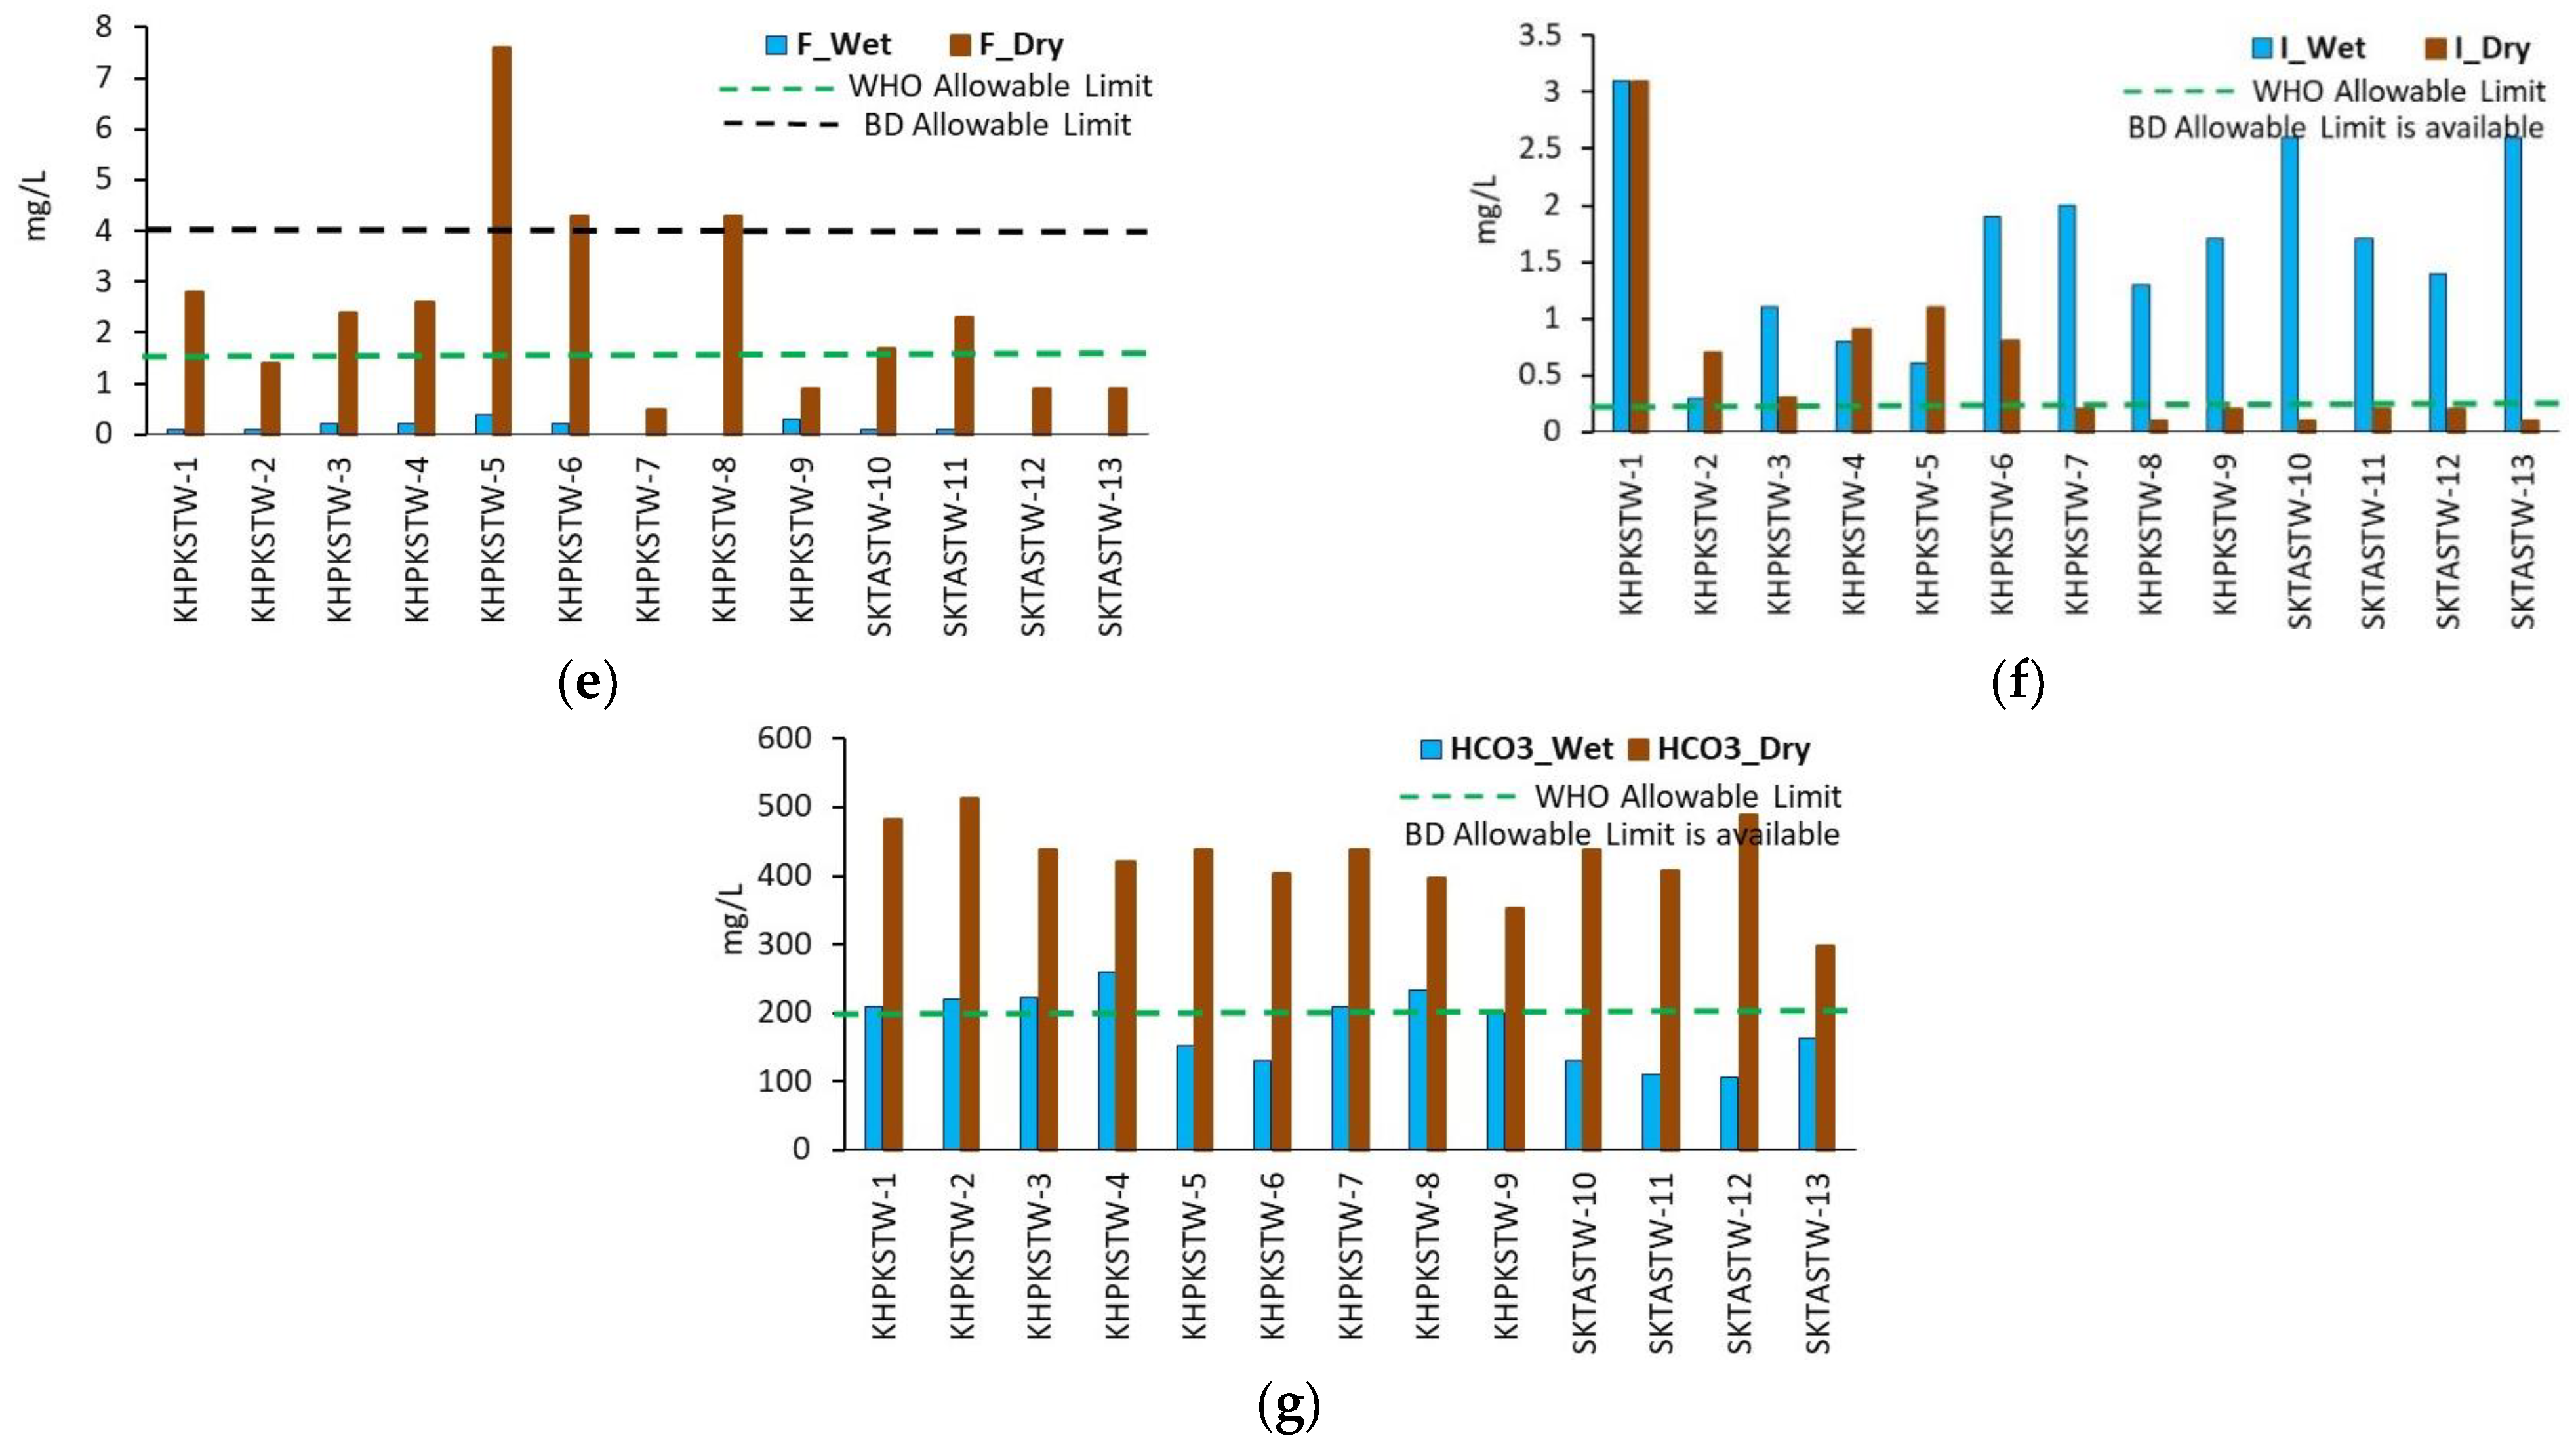
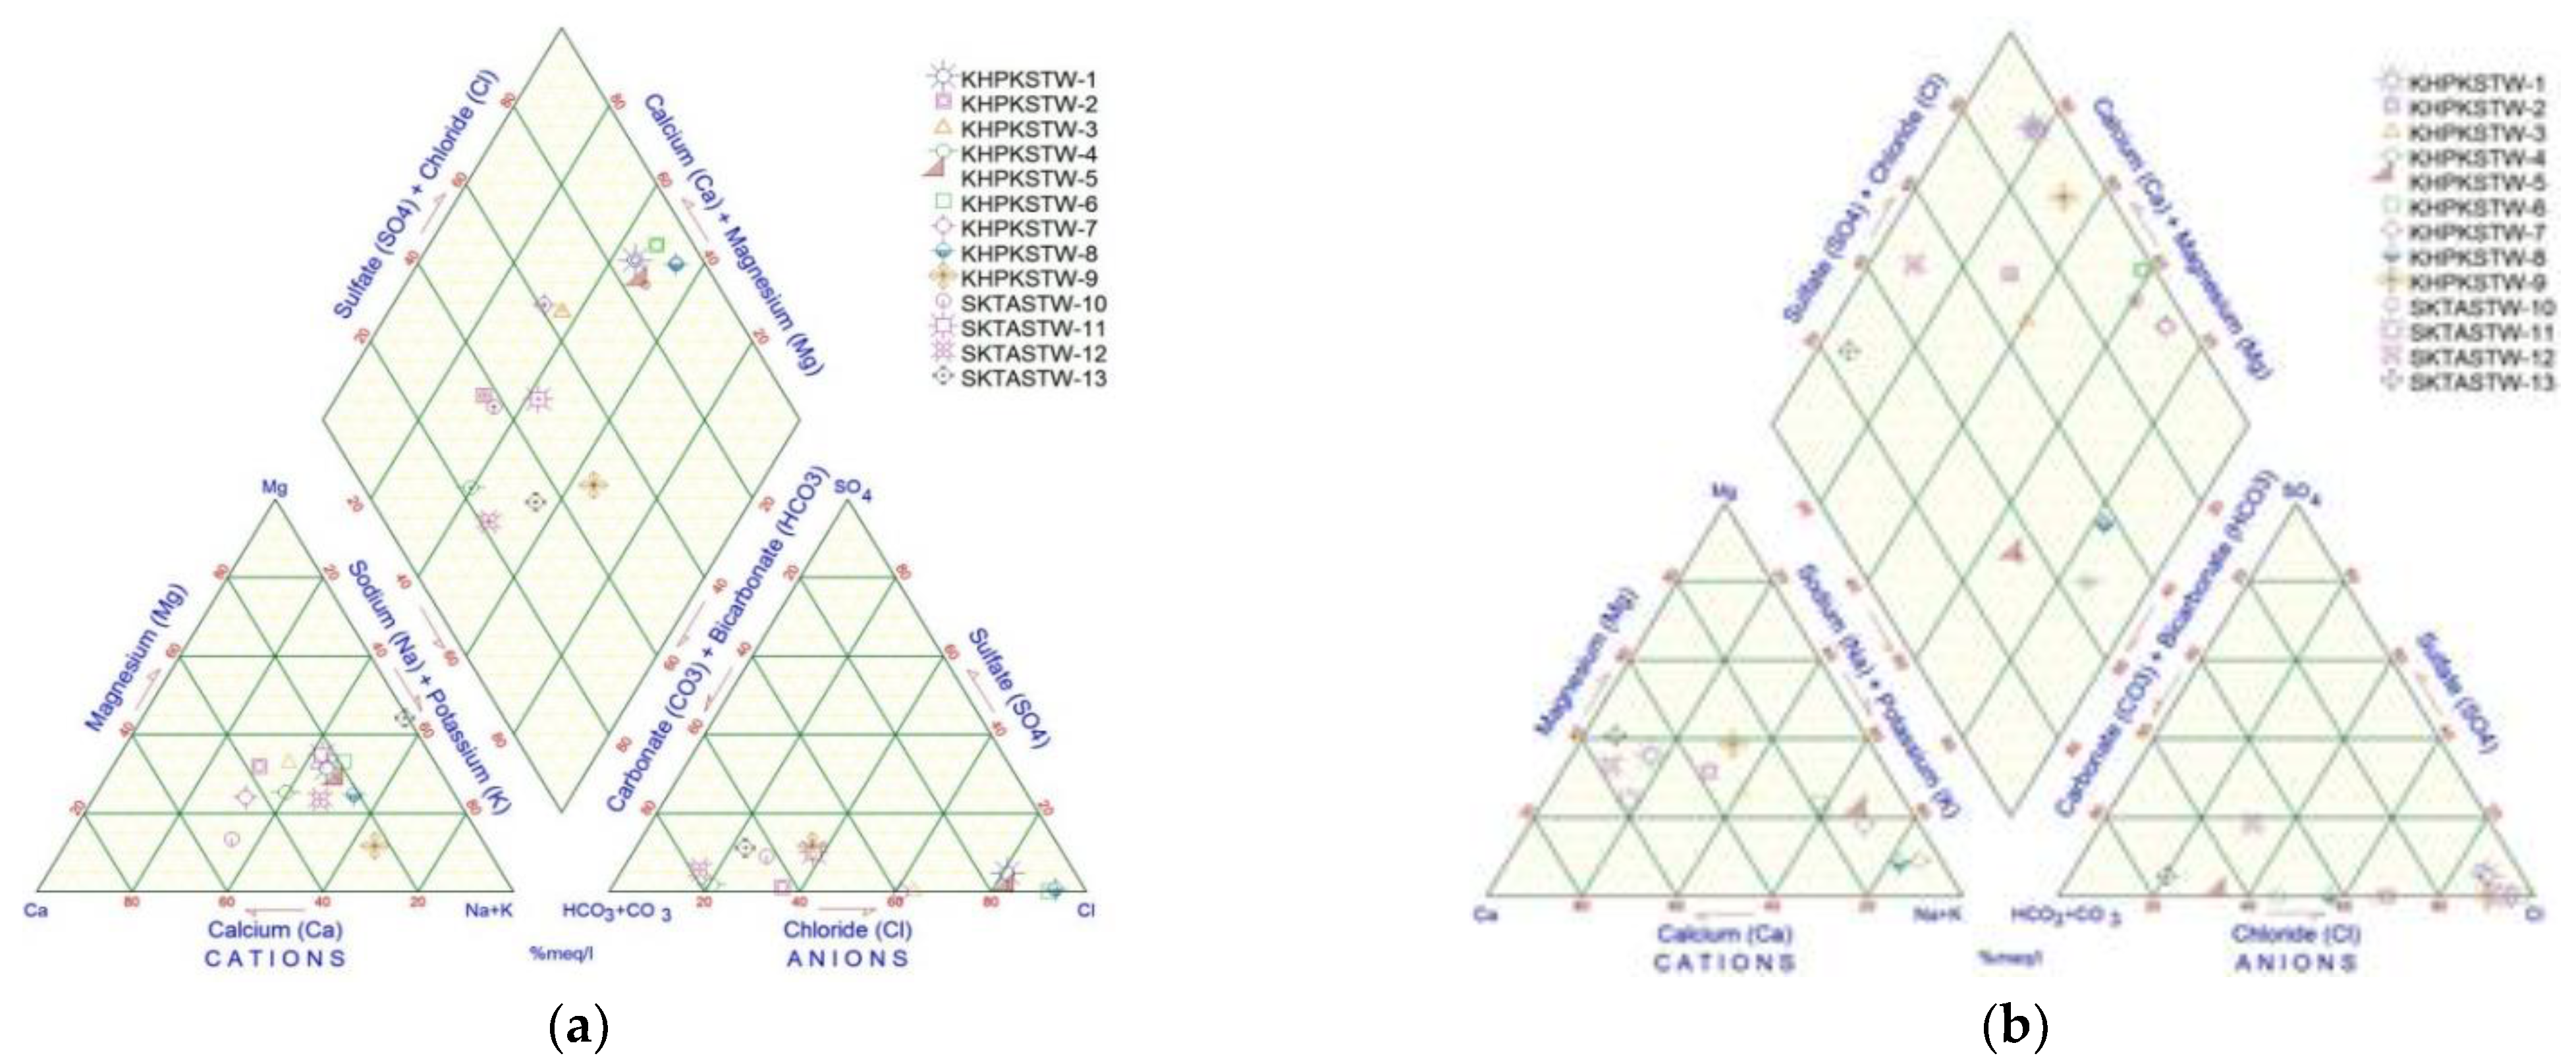
4.3. Groundwater Chemistry
4.4. Depth Distribution of Salinity
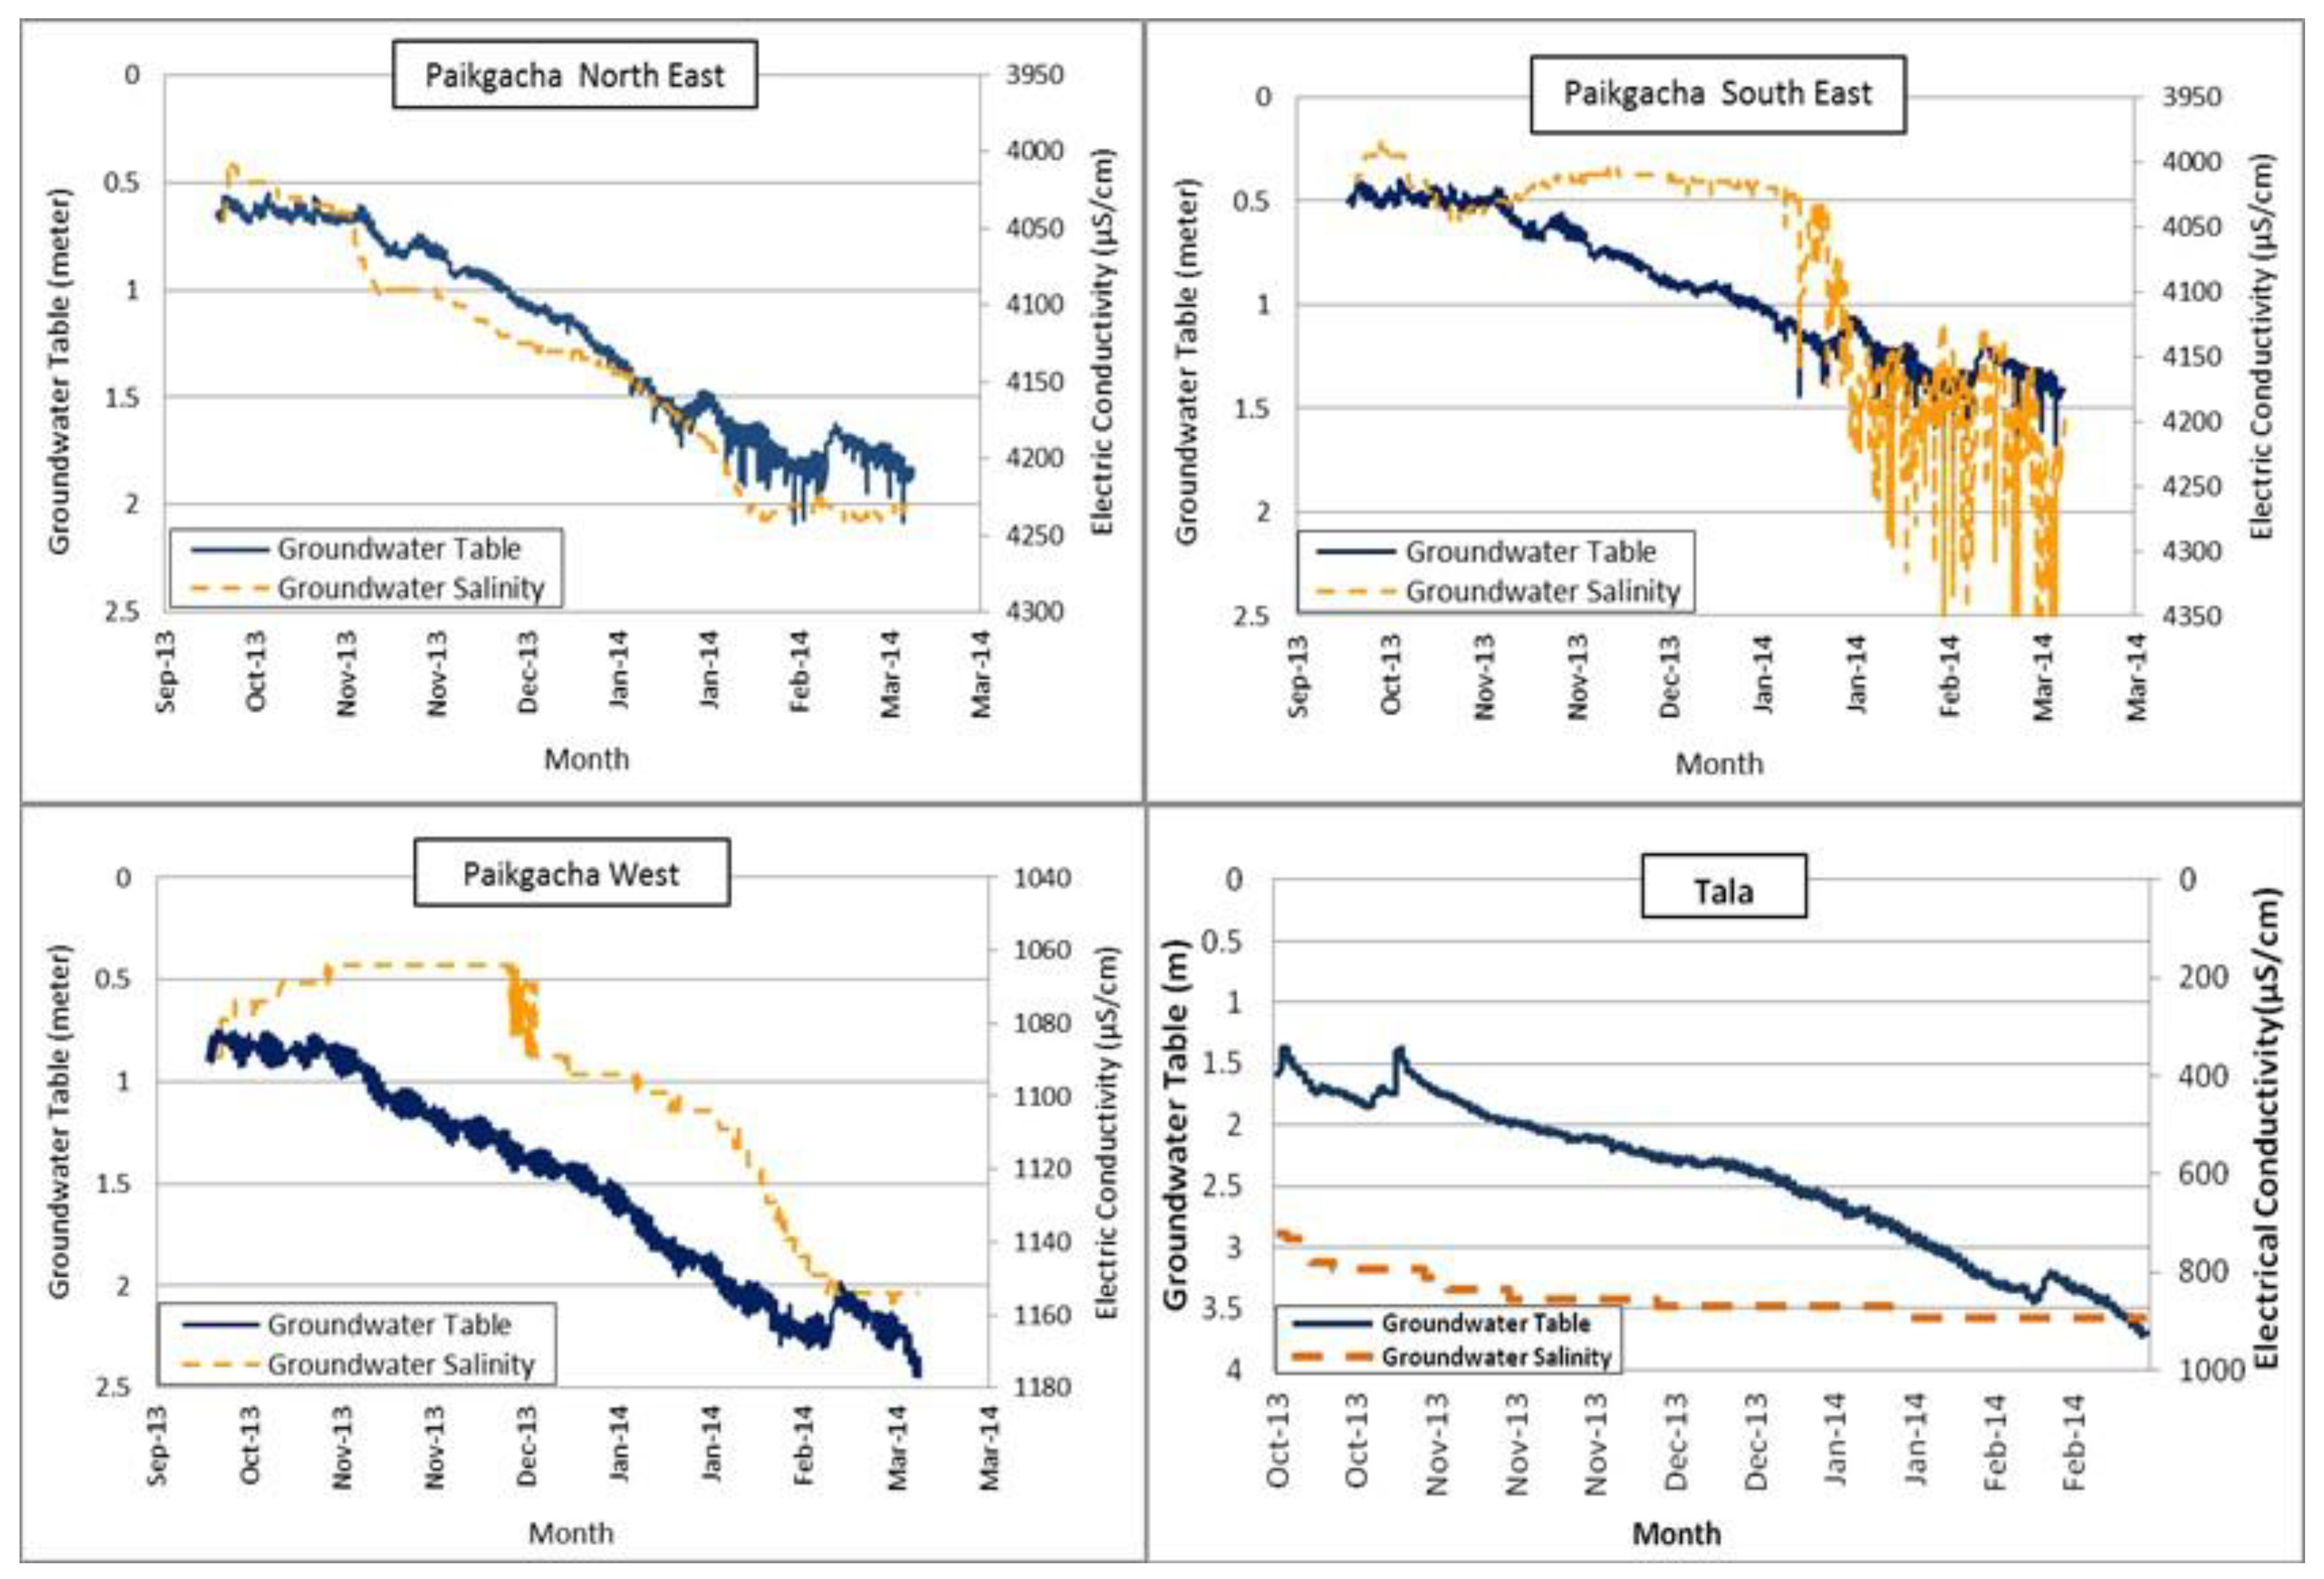
4.5. Seasonal Fluctuation of Water Table and Salinity
5. Recommended Solutions
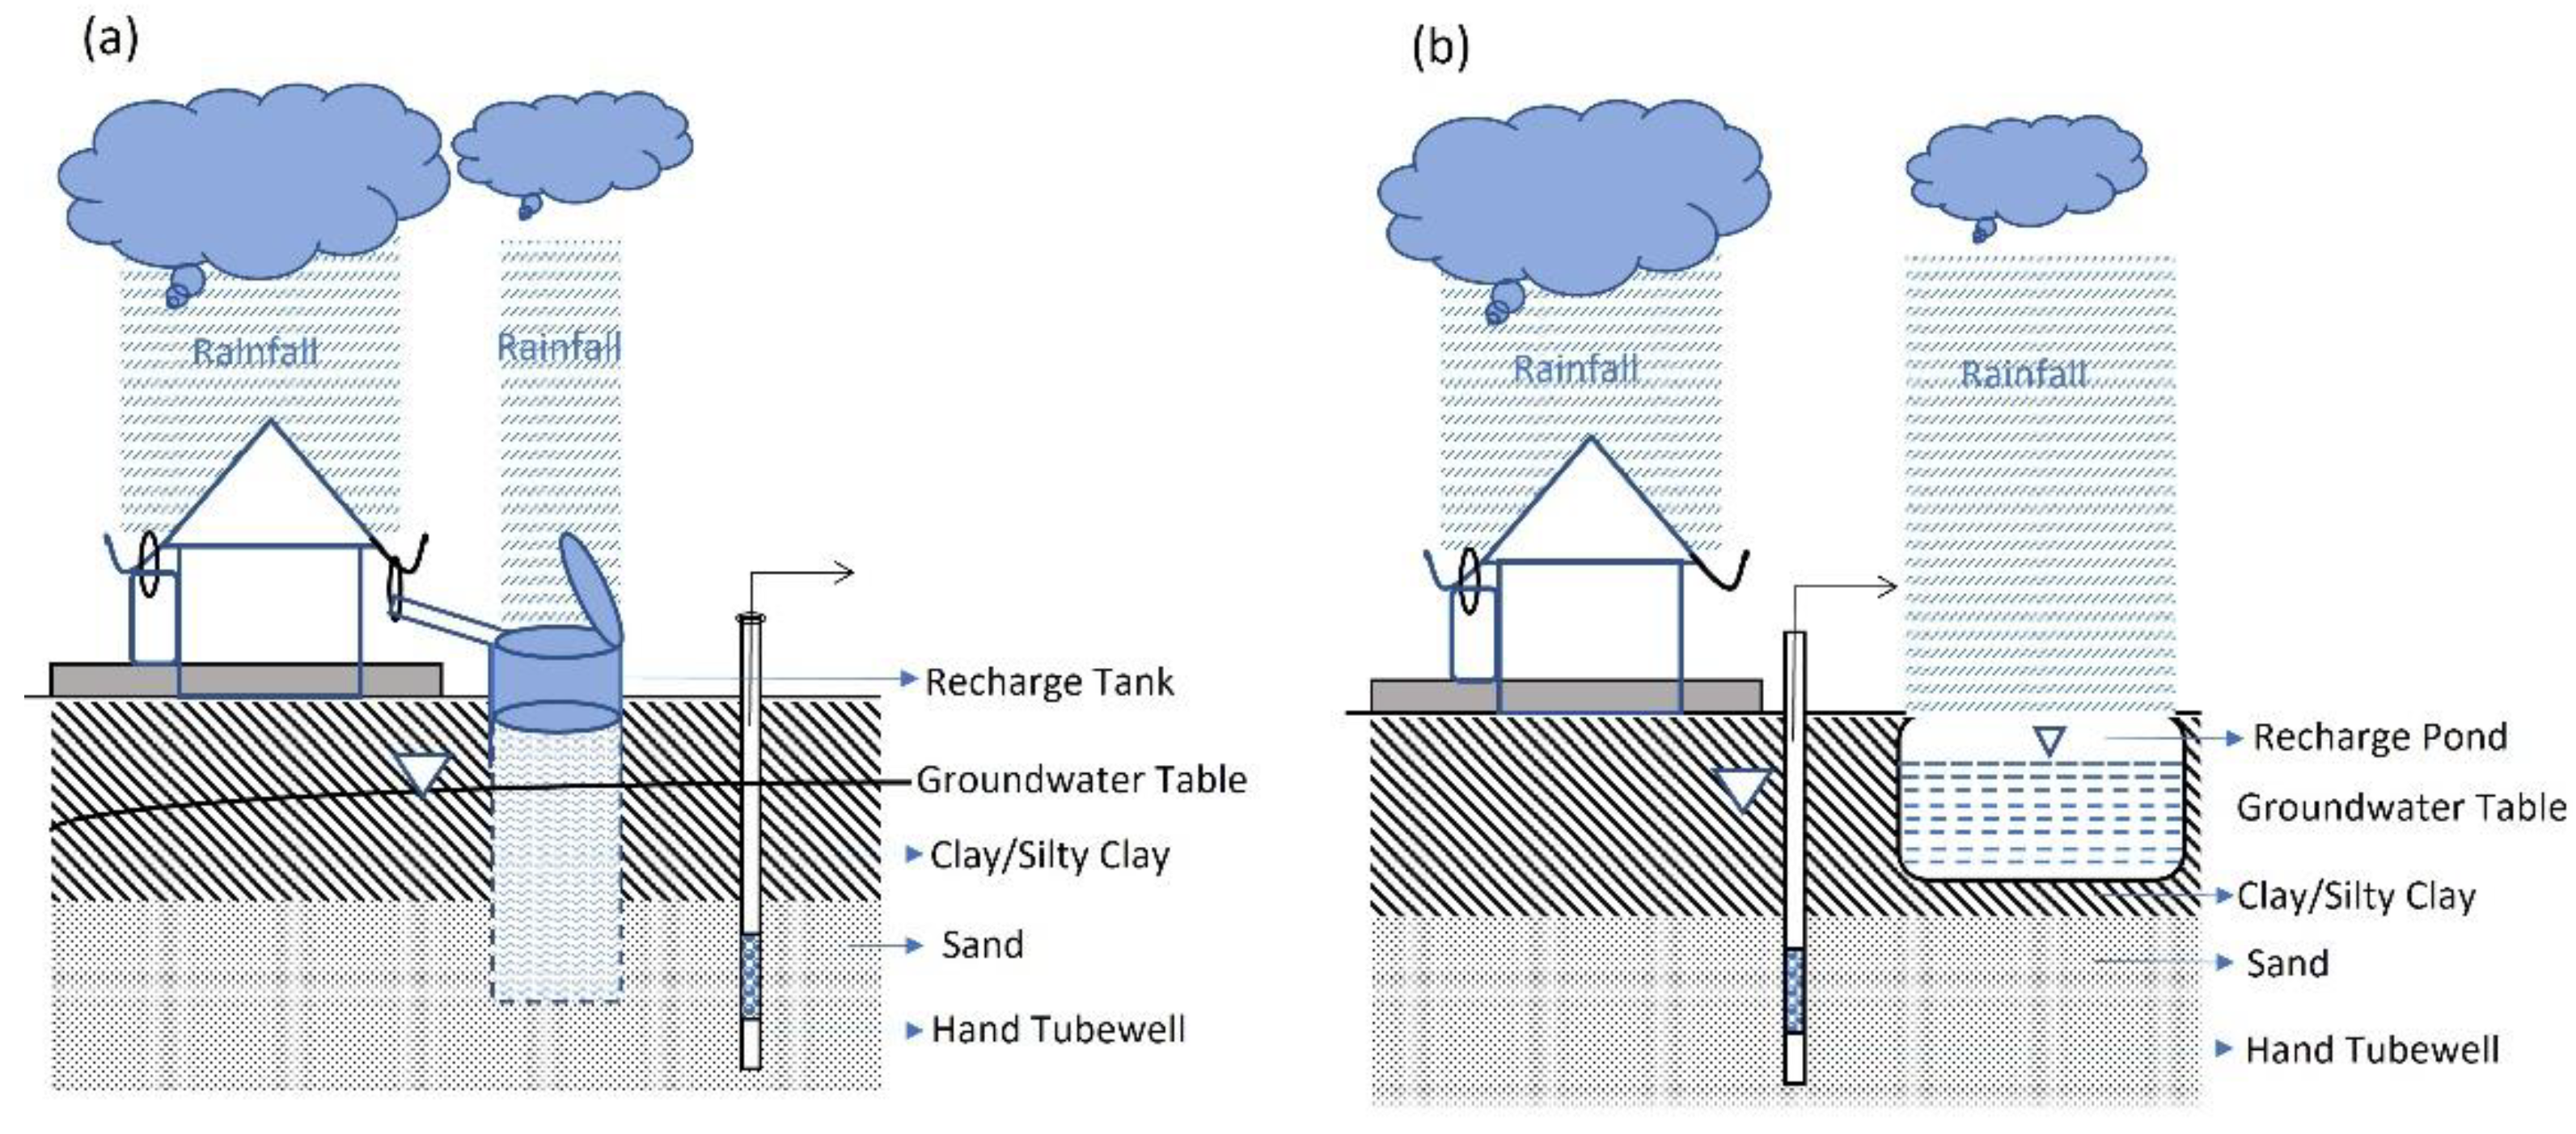
5.1. Managed Aquifer Recharge (MAR)
5.2. Willingness to Pay for Fresh and Safe Drinking Water
6. Conclusions
Author Contributions
Funding
Institutional Review Board Statement
Informed Consent Statement
Data Availability Statement
Acknowledgments
Conflicts of Interest
References
- Pradhanang, S.; Jahan, K. Urban Water Security for Sustainable Cities in the Context of Climate Change. In Water, Climate and Sustainability; John Wiley & Sons, Inc.: Hoboken, NJ, USA, 2021; Chapter 14; pp. 213–224. [Google Scholar]
- Ahmed, B.; Kelman, I.; Fehr, H.; Saha, M. Community resilience to cyclone disasters in coastal Bangladesh. Sustainability 2016, 8, 805. [Google Scholar] [CrossRef] [Green Version]
- Ahmed, N.; Diana, J.S. Threatening “white gold”: Impacts of climate change on shrimp farming in coastal Bangladesh. Ocean. Coast. Manag. 2015, 114, 42–52. [Google Scholar] [CrossRef]
- Mahmudul, H.; Islam, A.; Aziz, H.; Jahangir, A.; Mehedi, H.P. Groundwater vulnerability assessment in Savar upazila of Dhaka district, Bangladesh—A GIS-based DRASTIC modeling. Groundw. Sustain. Dev. 2019, 9, 100220. [Google Scholar]
- Jahan, K. Delineating suitable aquifers for agricultural and drinking water supply in Southwest coastal area. PG Diploma Thesis, Institute of Water and Flood Management, Bangladesh University of Engineering and Technology, Dhaka, Bangladesh, 2013. [Google Scholar]
- Ahsan, M.N.; Warner, J. The socio-economic vulnerability index: A pragmatic approach for assessing climate change led risks—A case study in the southwestern coastal Bangladesh. Int. J. Disaster Risk Reduct. 2014, 8, 32–49. [Google Scholar] [CrossRef]
- Mallick, B.; Ahmed, B.; Vogt, J. Living with the risks of cyclone disasters in the southwestern coastal region of Bangladesh. Environments 2017, 4, 13. [Google Scholar] [CrossRef]
- Becker, M.; Papa, F.; Karpytchev, M.; Delebecque, C.; Krien, Y.; Khan, J.U.; Ballu, V.; Durand, F.; le Cozannet, G.; Islam, A.K.M.S.; et al. Water level 703 changes, subsidence, and sea level rise in the Ganges–Brahmaputra–Meghna delta. Proc. Natl. Acad. Sci. USA 2020, 117, 1867–1876. [Google Scholar] [CrossRef]
- Nicholls, R.J.; Hutton, C.W.; Adger, W.N.; Hanson, S.E.; Rahman, M.M.; Salehin, M. Ecosystem Services for Well-Being in Deltas: Integrated Assessment for Policy Analysis; Springer: Berlin/Heidelberg, Germany, 2018. [Google Scholar]
- Bhuiyan, M.A.E.; Yang, F.; Biswas, N.K.; Rahat, S.H.; Neelam, T.J. Machine Learning-Based Error Modeling to Improve GPM IMERG Precipitation Product over the Brahmaputra River Basin. Forecasting 2020, 2, 248–266. [Google Scholar] [CrossRef]
- Institute of Water Modelling. Use Existing Data on Available Digital Elevation Models to Prepare Useable Tsunami and Storm Surge Inundation Risk Maps for the Entire Coastal Region; IWM: Dhaka, Bangladesh, 2009. [Google Scholar]
- Yu, W.; Mozaharul, A.; Ahmadul, H.; Abu Saleh, K.; Ruane, A.; Rosenzweig, C.; Major, D.; Thurlow, J. Climate Change Risks and Food Security in Bangladesh; Routledge: Abingdon, UK, 2010; ISBN 97818497113026497. [Google Scholar]
- Anwar, M.S.; Rahman, K.; Bhuiyan, M.A.E.; Saha, R. Assessment of Sea Level and Morphological Changes along the Eastern Coast of Bangladesh. J. Mar. Sci. Eng. 2022, 10, 527. [Google Scholar] [CrossRef]
- Abdullah, H.M.; Muraduzzaman, M.; Islam, I.; Miah, M.G.; Rahman, M.M.; Rahman, A.; Ahmed, Z. Spatiotemporal dynamics of new land development in Bangladesh coast and its potential uses. Remote Sens. Appl. Soc. Environ. 2019, 14, 191–199. [Google Scholar] [CrossRef]
- Mozumder, M.R.H.; Michael, H.A.; Mihajlov, I.; Khan, M.R.; Knappett, P.S.K.; Bostick, B.C. Origin of groundwater arsenic in a rural Pleistocene aquifer in Bangladesh depressurized by distal municipal pumping. Water Resour. Res. 2020, 56, e2020WR027178. [Google Scholar] [CrossRef]
- MLGRDC. Sector Development Plan (FY 2011-25)—Water Supply and Sanitation Sector in Bangladesh; MLGRDC: Dhaka, Bangladesh, 2011. [Google Scholar]
- Fischer, A.; Hope, R.; Manandhar, A.; Hoque, S.; Foster, T.; Hakim, A. Risky responsibilities for rural drinking water in-stitutions: The case of unregulated self-supply in Bangladesh. Glob. Environ. Change 2020, 65, 102152. [Google Scholar] [CrossRef]
- Khan, M.M.N.; Hossain, A.T.M.Z.; Haldar, P.K.; Mondal, M.S.H. Promoting community based adaptation to combat climate change impacts—Practices, approaches and models. In Proceedings of the 2nd Regional Conference on Disaster Risk Reduction and Climate Change Adaptation, Khulna, Bangladesh, November 2014; pp. 59–66. [Google Scholar]
- Haque, S.A. Salinity problems and crop production in coastal regions of Bangladesh. Pak. J. Bot. 2006, 38, 1359–1365. [Google Scholar]
- BWDB-UNDP. Groundwater Survey: The Hydrogeological Conditions of Bangladesh; UNDP: New York, NY, USA, 1982. [Google Scholar]
- Bhattacharya, P.; Chatterjee, D.; Jacks, G. Occurrence of Arsenic contaminated groundwater in alluvial aquifers from the delta plains, eastern India: Options for safe drinking water supply. Water Resour. Dev. 1997, 13, 79–92. [Google Scholar] [CrossRef]
- Papazotos, P.; Vasileiou, E.; Perraki, M. Elevated groundwater concentrations of arsenic and chromium in ultramafic environments controlled by seawater intrusion, the nitrogen cycle, and anthropogenic activities: The case of the Gerania Mountains, NE Peloponnese, Greece. Appl. Geochem. 2001, 121, 104697. [Google Scholar] [CrossRef]
- Nickson, R.; McArthur, J.; Burgess, W.; Ahmed, K.M.; Ravenscroft, P.; Rahman, M. Arsenic poisoning of Bangladesh groundwater. Nature 1998, 395, 338. [Google Scholar] [CrossRef]
- Ravenscroft, P.; McArthur, J.M.; Hoque, B.A. Geochemical and palaeohydrological controls on pollution of groundwater by arsenic. In Arsenic Exposure and Health Effects; Chappell, W.R., Abernathy, C.O., Calderon, R.L., Eds.; Elsevier: Oxford, UK, 2001; pp. 53–77. [Google Scholar]
- Van Geen, A.; Zheng, Y.; Versteeg, R.; Stute, M.; Horneman, A.; Dhar, R.; Steckler, M.; Gelman, A.; Small, C.; Ahsan, H.; et al. Spacial variability of arsenic in 6000 tubewells in a 25 km2 area of Bangladesh. Water Resour. Res. 2003, 39, 1140. [Google Scholar] [CrossRef] [Green Version]
- Yan, X.-P.; Kerrich, R.; Hendry, M.J. Distribution of arsenic (III), arsenic (V) and total inorganic arsenic in pore waters from a thick till and clay rich aquitard sequence, Saskatchewan, Canada. Geochim. Cosmochim. Acta. 2000, 62, 2637–2648. [Google Scholar] [CrossRef]
- Climate Change Cell (CCC). Assessment of Sea Level Rise on Bangladesh Coast through Trend Analysis; Climate Change Cell 706; Department of Environment, Ministry of Environment and Forests: Dhaka, Bangladesh, 2016. [Google Scholar]
- SMRC. The Vulnerability Assessment of SAARC Coastal Region Ude to the Sea Level Rise: Bangladesh Case Study; SAARC Meteorological Research Center: Dhaka, Bangladesh, 2003. [Google Scholar]
- Acharyya, S.K.; Chakraborty, P.; Lahiri, S.; Raymahashay, B.C.; Guha, S.; Bhowmik, A. Arsenic poisoning in the Ganges delta. Nature 1999, 401, 545. [Google Scholar] [CrossRef]
- Sarwar, M.G.M. Sea-Level Rise along the Coast of Bangladesh. In Disaster Risk Reduction Approaches in Bangladesh; Shaw, R., Mallick, F., Islam, A., Eds.; Springer: Tokyo, Japan, 2013. [Google Scholar]
- Khandker, H. Mean sea level in Bangladesh. Mar. Geod. 1997, 20, 69–76. [Google Scholar] [CrossRef]
- Khan, T.M.A.; Singh, O.P.; Rahman, M.S. Recent sea level and sea surface temperature trends along the Bangladesh coast in relation to the frequency of intense cyclones. Mar. Geod. 2000, 23, 103–116. [Google Scholar]
- Rahman, A.F.; Danilo, D.; Bassil, E. Response of the Sundarbans coastline to sea level rise and decreased sediment flow: A remote sensing assessment. Remote Sens. Environ. 2011, 115, 3121–3128. [Google Scholar] [CrossRef]
- Saha, S.K.; Monsur, H. Sea level changes due to climate change–Facts and fiction. J. Nepal Geol. Soc. 2007, 36, 30. [Google Scholar]
- Bangladesh Water Development Board (BWDB). Hydrogeological Study and Mathematical Modelling to Identify Sites for Installation of Observation Well Nest; Bangladesh Water Development Board (BWDB) and Institute of Water Modelling (IWM): Dhaka, Bangladesh, 2013; Volume 5. [Google Scholar]
- BWDB. List of Observation Wells, Automatic Water Level Recorders and Groundwater Sampling Stations under Ground Water Hydrology Division-II; Bangladesh Water Development Board: Dhaka, Bangladesh, 2001; p. 130. [Google Scholar]
- Zahid, A.; Jahan, K.; Ali, M.H.; Ahmed, N.; Islam, M.K.; Rahman, A. Distribution of Groundwater Salinity and Its Seasonal Variability in the Coastal Aquifers of Bengal Delta. In Impact of Climate Change on Socio-economic Conditions of Bangladesh; Zahid, A., Hassan, M.Q., Islam, R., Samad, Q.A., Khan, M.S., Haque, R., Eds.; Alumni Association of German Universities in Bangladesh: Dhaka, Bangladesh, 2013; pp. 170–193. [Google Scholar]
- Islam, A.R.M.T.; Ahmed, N.; Bodrud-Doza, M.; Chu, R. Characterizing groundwater quality ranks for drinking purposes in Sylhet district, Bangladesh, using entropy method, spatial autocorrelation index and geostatistics. Environ. Sci. Pollut. 2017, 24, 26350–26374. [Google Scholar] [CrossRef] [PubMed]
- Dowling, C.B.; Poreda, R.J.; Basu, A.R. The Groundwater Geochemistry of the Bengal: Weathering, Chemsorption and Trace Metal Flux to the Oceans. Geochim. Cosmochim. Acta 2003, 67, 2117–2136. [Google Scholar] [CrossRef]
- Islam, A.R.M.T.; Islam, H.M.T.; Mia, U.M.; Khan, R.; Habib, M.A.; Bodrud-Doza, M.; Siddique, M.A.B.; Chu, R. Co-distribution, possible origins, status and potential health risk of trace elements in surface water sources from six major river basins, Bangladesh. Chemosphere 2020, 249, 126180. [Google Scholar] [CrossRef] [PubMed]
- Huq, S.; Ayers, J. Climate Change Impacts and Responses in Bangladesh. In DG Internal Policies of the Union Policy Department Economic and Scientific Policy; European Parliament: Brussels, Belgium, 2008; Available online: https://www.europarl.europa.eu/RegData/etudes/etudes/join/2008/400990/IPOLCLIM_ET(2008)400990_EN.pdf. (accessed on 8 April 2022).
- Plan International. Life under Water: When Monsoon Season Strikes in Bangladesh. 2021. Available online: https://plancanada.ca/monsoon-season-in-bangladesh (accessed on 8 April 2022).
- Agarwala, S.; Ota, T.; Ahmed, A.U.; Smith, J.; Alast, M.V. Development and Climate Change in Bangladesh: Focus on Coastal Flooding and the Sundarbans. 2003. Available online: https://www.oecd.org/env/cc/21055658.pdf (accessed on 8 April 2022).
- Bakr, M.A. Quaternary Geomorphic Evolution of the Brahmanbaria-Noakhali Area; Geological Survey of Bangladesh: Dakha, Bangladesh, 1977. [Google Scholar]
- Morgan, J.P.; McIntire, W.G. Quaternary geology of the Bengal Basin, East Pakistan and India. Geol. Soc. Am. Bull. 1959, 70, 319–342. [Google Scholar] [CrossRef]
- Edmunds, W.M.; Ahmed, K.M.; Whitehead, P.G. A review of arsenic and its impacts in groundwater of the Ganges–Brahmaputra–Meghna Delta, Bangladesh. Environ. Sci. Processes Impacts 2015, 17, 1032–1046. [Google Scholar] [CrossRef]
- Ahmed, M.F.; Ahuja, S.; Alauddin, M.; Hug, S.J.; Lloyd, J.R.; Pfaff, A.; Pichler, T.; Salitkov, C.; Stute, M.; Van Geen, A. Ensuring safe drinking water in Bangladesh. Science 2006, 314, 1687–1688. [Google Scholar] [CrossRef] [Green Version]
- Bouwer, H.; Rice, R.C. A Slug Test for Determining Hydrolic Conductivity of Unconfined Aquifers with Completely or Partially Penetrating Wells. Water Resour. Res. 1976, 12, 423–428. [Google Scholar] [CrossRef] [Green Version]
- World Health Organization. Guidelines for Drinking-Water Quality, 4th ed.; World Health Organization: Geneva, Switzerland, 2011; Available online: https://apps.who.int/iris/handle/10665/44584 (accessed on 8 April 2022).
- DoE. Final Report Geospatial Technology Based Water Quality Monitoring System for Bangladesh; Department of Environment: Dhaka, Bangladesh, 2016. [Google Scholar]
- WHO. Guideline for Drinking Water Quality, 4th ed.; World Health Organization: Geneva, Switzerland, 2007; Volume 1, p. 515. [Google Scholar]
- Basavaraddi, S.; Kouser, H.; Puttaiah, E. Sodium Toxicity in Ground Water and its Hazardous Effect on Life–A Study in Tiptur Town and its Surrounding Areas. Glob. Adv. Res. J. Microbiol. 2012, 1, 149–154. [Google Scholar]
- US Environmental Protection Agency. Drinking Water Advisory: Consumer Acceptability Advice and Health Effects Analysis on Sodium. 2003. Available online: https://www.epa.gov/sdwa/recommendations-national-drinking-water-advisory-council-us-epa-its-national-small-systems (accessed on 8 April 2022).
- Appelo, C.A.J.; Postma, D. Geochemistry, Groundwater and Pollution; CRC Press: Boca Raton, FL, USA, 1999; p. 535. [Google Scholar]
- Berner, R.A. Principles of Chemical Sedimentology; McGraw-Hill: New York, NY, USA, 1971; p. 240. [Google Scholar]
- Tesorieroa, A.J.; Spruilla, T.B.; Eimersb, J.L. Geochemistry of shallow ground water in coastal plain environments in the southeastern United States: Implications for aquifer susceptibility. Appl. Geochem. 2004, 19, 1471–1482. [Google Scholar] [CrossRef]
- Van Beek, C.G.E.M.; Hettinga, F.A.M.; Straatman, R. The effects of manure spreading and acid deposition upon groundwater quality in Vierlingsbeek, the Netherlands. Int. Assoc. Hydrol. Sci. Publ. 1989, 185, 155–162. [Google Scholar]
- Zheng, Y.; Stute, M.; Van Geen, A.; Gavrieli, I.; Dhar, R.; Simpson, H.J.; Schlosser, P.; Ahmed, K.M. Redox control of arsenic mobilization in Bangladesh groundwater. Appl. Geochem. 2004, 19, 201–214. [Google Scholar] [CrossRef]
- Fetter, C.W. Applied Hydrogeology; Prentice Hall: New York, NY, USA, 1994; 691p. [Google Scholar]
- Hounslow, A.W. Water Quality Data, Analysis and Interpretation; Lewis Publishers: Poole, UK, 1995. [Google Scholar]
- Garrels, R.M. Genesis of some ground waters from igneous rocks. In Researches in Geochemistry; Abelson, P.H., Ed.; John Wiley and Sons: New York, NY, USA, 1967; pp. 405–421. [Google Scholar]
- Alloway, B.J.; Ayres, D.C. Chemical Principles of Environmental Pollution; Chapman and Hall: London, UK, 1997. [Google Scholar]
- Freeze, R.A.; Cherry, J.A. Groundwater; Prentice-Hall Inc.: New Jersey, NJ, USA, 1979; p. 604. [Google Scholar]
- Basta, N.T.; Ryan, J.A.; Chaney, R.L. Trace Element Chemistry in Residual-Treated Soil: Key Concepts and Metal Bioavailability. J. Environ. Qual. 2005, 34, 49–63. [Google Scholar] [CrossRef] [PubMed] [Green Version]
- Reddy, K.R.; Patrick, W.H. Effect of alternate aerobic and anaerobic conditions on redox potential, organic matter decomposition, and nitrogen loss in a flooded soil. Soil Biol. Biochem. 1975, 7, 87–94. [Google Scholar] [CrossRef]
- Davranche, M.I.; Bollinger, J.C. A Desorption–Dissolution Model for Metal Release from Polluted Soil under Reductive Conditions. J. Environ. Qual. 2001, 30, 1581–1586. [Google Scholar] [CrossRef]
- Tareq, S.M.; Safiullah, S.; Anawar, H.M.; Rahman, M.M.; Ishizuka, T. Arsenic pollution in groundwater: A self-organizing complex geochemical process in the deltaic sedimentary environment, Bangladesh. Sci. Total Environ. 2003, 313, 213–226. [Google Scholar] [CrossRef]
- Koenigs, F.F.R. A Sawah Profile Near Bogor (Java); Institute for Soil Research: Bogor, Indonesia, 1950. [Google Scholar]
- Mitsuchi, M. Permeability series of lowland paddy soils in Japan. JARQ 1975, 9, 28–33. [Google Scholar]
- Moormann, F.R.; Breeman, N.V. Soil forming processes in Aquatic rice lands. In Rice: Soil, Water, Land; International Rice Research Institute: Los Banos, Philippines, 1978; Chapter 5. [Google Scholar]
- Zahid, A.; Hassan, M.Q.; Balke, K.-D.; Flegr, M.; Clark, D.W. Groundwater chemistry and occurrence of arsenic in the Meghna floodplain aquifer, southeastern Bangladesh. J. Environ. Geol. 2008, 54, 1247–1260. [Google Scholar] [CrossRef]
- Soulsby, C.; Chen, M.; Ferrier, R.C. Hydrogeochemistry of shallow groundwater in an upland Scottish catchment. Hydrol. Processes 1998, 12, 1111–1127. [Google Scholar] [CrossRef]
- World Bank-USGS. Implications of Climate Change for Fresh Groundwater Resources in Coastal Aquifers in Bangladesh; The World Bank, South Asia Region: Almaty, Kazakhstan, 2010; 105p. [Google Scholar]
- Dillon, P. Future Management of Aquifer Recharge. Hydrogeol. J. 2005, 13, 313–316. [Google Scholar] [CrossRef]
- Scanlon, B.R.; Healy, R.W.; Cook, P.G. Choosing appropriate techniques for quantifying groundwater recharge. Hydrogeol. J. 2002, 10, 18–39. [Google Scholar] [CrossRef]
- Lerner, D.N.; Issar, A.S.; Simmers, I. Groundwater Recharge. A Guide to Understanding and Estimating Natural Recharge; Verlag Heinz Heise: Hannover, Germany, 1990; p. 345. [Google Scholar]
- De Vries, J.J.; Simmers, I. Groundwater recharge: An overview of processes and challenges. Hydrogeol. J. 2002, 10, 5–17. [Google Scholar] [CrossRef]
- Healy, R.W.; Cook, P.G. Using groundwater levels to estimate recharge. Hydrogeol. J. 2002, 10, 91–109. [Google Scholar] [CrossRef]
- Meinzer, O.E. The Occurrence of Groundwater in the United States with a Discussion of Principles; University of Chicago: Chicago, IL, USA, 1923; p. 321. [Google Scholar]
- Meinzer, O.E.; Stearns, N.D. A Study of Groundwater in the Pomperaug Basin, Connecticut; US Geological Survey: Reston, VA, USA, 1929; pp. 73–146. [Google Scholar]


| Sampling Procedure | |||
| Groundwater samples were collected in 500-mL polystyrene bottles, and chemical analyses followed standard guidelines (APHA 2005). After pumping the wells for 15–20 min, samples were collected and filtered through 0.45-lm membranes to avoid debris. To preserve the samples for trace metal analysis, they were acidified with concentrated HNO3 (AR grade: 60–61% and density:1.38 kg/L) and stored at 4 °C. | |||
| Physical Parameter | |||
| Parameter | Instrument | ||
| Temperature (°C) pH Electrical conductivity (EC) Total dissolved solids (TDS | Portable Multi-Meter Hach, Sens ION, MM150 | ||
| Chemical Parameter | |||
| Parameters | Instrument | Method | |
| Cations | Sodium (Na+), Potassium (K+), Magnesium (Mg2+), Calcium (Ca2+) | Atomic Absorption Spectrophotometer (Varian AAS, 680FS), USA | Default AAS Method |
| Anions | Nitrate (NO3) Sulfate (SO42−) Phosphate (PO43−) Fluoride (F−) | UV-VIS spectrophotometer, USA | Default Method |
| Chloride (Cl−) | Hach digital titrator, USA | HACH method 8207 | |
| Bicarbonate (HCO3−) | Manual Titration | HCL titration | |
| Trace Metals | Manganese (Mn) | Spectrophotometer at 560 nm (DR 2800, HACH USA | 1-(2-pyridylazo)-2-naphthol method (0.006–0.7 mg/L) |
| Iron (Fe) | Spectrophotometer (DR 2800, HACH USA) at 562 nm | FerroZine iron reagent method (0.009–1.4 mg/L) | |
| Halogen Group | Iodine (I) | Spectrophotometer (DR 2800, HACH USA) at 530 nm | N,N-diethyl-p-phenylenediamine method (0.07–7.00 mg/L) |
| Bromine (Br) | Spectrophotometer (DR 2800, HACH USA) | N,N-diethyl-p-phenylenediamine method (0.05–4.50 mg/L) at 530 nm | |
| Elements | WHO (2011) Standards (mg/L) | Bangladesh (BD) Standards (mg/L) |
|---|---|---|
| Magnesium (Mg) | 50 | 50 |
| Calcium (Ca) | 75 | 75 |
| Manganese (Mn) | 0.5 | 0.5 |
| Bromide (Br) | <6 | - |
| Iodide (I) | 0.02 | - |
| Bi-carbonate (HCO3−) | 200 | - |
| Sulfate (SO42−) | 250 | 400 |
| Fluoride (F) | 1.5 | 4.0 |
| Nitrate (NO3−) | 50 | 10 |
| Chloride (Cl) | 250 | 150–600 |
| Iron (Fe) | 0.3 | 1.0 |
| Sodium (Na) | 200 | 600 |
| Potassium (K) | 12 | 12 |
| Indicator | Weightage | Percentage (%) |
|---|---|---|
| Education | 3 | |
| Literate | 30 | |
| Illiterate | 70 | |
| Main Occupation | 2 | |
| Farming | 45 | |
| Labor | 35 | |
| Business | 15 | |
| Service | 5 | |
| Household Income | 1 | |
| Ultra-poor | 65 | |
| Poor | 25 | |
| Non-poor | 10 | |
| Source of Drinking water | 4 | |
| Community Tubewell | 70 | |
| Personal Tubewell | 25 | |
| Other | 5 | |
| Health Issue | 1 | 90 |
| Willingness to Pay | 2 | |
| Agreed | 70 | |
| Not Agreed | 30 |
| Well ID | Total Depth (m) | GWT from the Surface (m) | Installed Strainer | Thickness (m) | |
|---|---|---|---|---|---|
| Top Zone | Aquifer | ||||
| KHPKSTW-6 | 10.37 | 0.50 | (8.7–9.8) | (0–4.8) | (4.9–10.4) |
| KHPKSTW-7 | 12.2 | 0.90 | 8–10.5 | 0–7.6 | 7.61–12.2 |
| KHPKSTW-8 | 8.5 | 1.6 | 4.8–7.6 | 0–2.5 | 2.5–8.5 |
| SKTASTW-13 | 12.2 | 0.65 | 4.5–9.15 | 0–9.15 | 9.2–12.2 |
Publisher’s Note: MDPI stays neutral with regard to jurisdictional claims in published maps and institutional affiliations. |
© 2022 by the authors. Licensee MDPI, Basel, Switzerland. This article is an open access article distributed under the terms and conditions of the Creative Commons Attribution (CC BY) license (https://creativecommons.org/licenses/by/4.0/).
Share and Cite
Jahan, K.; Zahid, A.; Bhuiyan, M.A.E.; Ali, I. A Resilient and Nature-Based Drinking Water Supply Source for Saline and Arsenic Prone Coastal Aquifers of the Bengal Delta. Sustainability 2022, 14, 6703. https://doi.org/10.3390/su14116703
Jahan K, Zahid A, Bhuiyan MAE, Ali I. A Resilient and Nature-Based Drinking Water Supply Source for Saline and Arsenic Prone Coastal Aquifers of the Bengal Delta. Sustainability. 2022; 14(11):6703. https://doi.org/10.3390/su14116703
Chicago/Turabian StyleJahan, Khurshid, Anwar Zahid, Md Abul Ehsan Bhuiyan, and Iqbal Ali. 2022. "A Resilient and Nature-Based Drinking Water Supply Source for Saline and Arsenic Prone Coastal Aquifers of the Bengal Delta" Sustainability 14, no. 11: 6703. https://doi.org/10.3390/su14116703
APA StyleJahan, K., Zahid, A., Bhuiyan, M. A. E., & Ali, I. (2022). A Resilient and Nature-Based Drinking Water Supply Source for Saline and Arsenic Prone Coastal Aquifers of the Bengal Delta. Sustainability, 14(11), 6703. https://doi.org/10.3390/su14116703