Article

Spatiotemporal Variations in Light Precipitation Events in the Yellow River Basin, China, and Relationships with Large-Scale Atmospheric Circulation Patterns

1
School of Management Science and Engineering, Guizhou University of Finance and Economics, Guiyang 550025, China
2
Guizhou Green Development Strategy High-End Think Tank, Guizhou University of Finance and Economics, Guiyang 550025, China
*
Authors to whom correspondence should be addressed.
Sustainability 2022, 14(12), 6969; https://doi.org/10.3390/su14126969
Submission received: 23 April 2022 / Revised: 2 June 2022 / Accepted: 6 June 2022 / Published: 7 June 2022
(This article belongs to the Section Air, Climate Change and Sustainability)

Abstract

:
Light precipitation events are an essential feature of rainfall for agricultural production, risk prediction of drought or flood disasters, and natural resource management in a certain area. We investigated the spatiotemporal variations in light precipitation events with intensities of 0.1–10 mm/day, based on daily precipitation data for the Yellow River Basin (YRB), China, during 1960–2018, and explored their relationships with large-scale atmospheric circulation patterns (LSACPs) and altitude. For further analysis of the changes in the light precipitation events, we classified light rain (0.1 ≤ P < 10.0 mm/day) into five grades of intensity by using equal interval division. Results indicate that the mean annual light precipitation amount and days were 182.7 mm and 80 days, respectively, from 1960 to 2018 over the YRB, accounting for 39.2% and 85.2% of the total annual precipitation amount and days, respectively. Both the amount of light rain and the number of light precipitation days declined by −1.3 mm/decade and −1.4 days/decade, respectively, and suggested that most rain events were of low intensity (0.1 ≤ P < 2.0 mm/day). Light precipitation events mainly occurred in the upper and middle reaches of the YRB and decreased from the southwest to the north. Additionally, changes in light rain events appear to be complex and possibly related to LSACPs and altitude. We found that the LSACPs were a possible mechanism for light precipitation events in the YRB over the past decades. With increasing elevation, light precipitation events decreased significantly throughout the study period. Thus, the decrease in precipitation days mainly occurred at lower altitudes in the YRB. The results also reflect the complexity of regional climate change in the YRB because atmospheric circulation related to climate phenomena not only causes the complex variation in precipitation but also changes its altitude dependence.

1. Introduction

Precipitation is a cornerstone of the hydrological cycle and a major trigger of extreme weather events such as droughts and floods [1]. As global warming intensifies, heavy precipitation events are likely to intensify and become more frequent in most regions [2]. Studies have shown, for example, that annual precipitation very likely increased in Asia [3], North America [4,5], and Eurasia [6,7] over the last half-century, accompanied by more heavy and less light precipitation. Some scholars believed that light rain is closely negatively related with heavy precipitation and that light rain events decrease to some extent with the increase in heavy precipitation events [8,9]. Some researchers have also demonstrated an increasing trend in precipitation intensity along with fewer rainy days [10,11]. Furthermore, light precipitation days contributed the most to the decreasing trend of heavy rain days, and the precipitation frequency decreased by 66% [12]. Changes in such events can greatly affect the rate of change in annual precipitation because they account for a disproportionately high percentage of the annual total rainfall [13,14]. However, the characteristic of daily precipitation at a certain station is mainly affected by light events, whereas heavy precipitation events account for only a small part of the annual total precipitation frequency [14]. It is potentially useful to analyze the frequencies of precipitation events with different intensities to understand the effects of a warming climate on the precipitation characteristics.
Light precipitation is considered an important factor influencing drought control, can directly affect soil moisture content and water conservation, and help to reduce the frequency of drought, especially in arid and semi-arid areas [15]. Jiang et al. investigated changes in rainfall intensity from different parts of China and found that light precipitation events have been decreasing across the country in the context of continued warming of the global climate [16]. The proportion of light precipitation to total precipitation and light precipitation days to total precipitation days increased from southeast to northwest China, and light precipitation days accounted for more than 60% of the total precipitation days [12,15,17]. Additionally, a reduction in the number of light precipitation days was observed in most regions of China [12,18,19], and a lower intensity of light rain was associated with a much more significant reduction in the amount and number of light rain days [14]. Similarly decreasing trends in the number of light precipitation days from 1973 to 2009 were reported in Europe, North America, and Asia [20,21]. Although changes in light precipitation events have received wide attention, there is no universal or precise standard definition of a light precipitation event. A fixed percentile (relative threshold) method, which eliminates the unfavorable factors of applying the same standard over different areas, has been used to explore the characteristics of light precipitation at different stations in China [8,9,10]. Wen et al. (2016) used the percentile threshold method to define light precipitation events and investigated trends in light rain events on a global scale [8,9]. Some scholars have also suggested using an intensity of 0.1 ≤ P < 10.0 mm/day as a standard for evaluating the homogeneity of daily precipitation series [11,22,23]. Qian et al. defined light precipitation events as those with intensities of <10.0 mm/day [22]. Zhang et al. reported that thresholds reported in most areas were approximately 1–5 mm/day; generally, the thresholds for low latitudes or wetter regions were greater than those for higher latitudes or arid and semi-arid regions [23]. The relative thresholds and range for light precipitation intensity are not broadly applicable to certain regions, and for any given study it is necessary to define a “light precipitation event” as appropriate for the local situation.
These studies have demonstrated that light precipitation events can be used for a wide variety of hydrological cycles and as an early warning tool for disaster prevention in relation to drought within an area [11,19,22,23]. In addition, the relationship between aerosols and light precipitation has been investigated to determine possible causes for changes in light precipitation [18,20], with the conclusion that changes in light rain could be attributed to increases in aerosol concentration. Studies in various regions of the world have revealed the influences of large-scale circulation changes on light precipitation events [14,19], climate change, and hydrological variations [24,25]. These approaches reveal possible mechanisms affecting light rainfall variation from a climatic perspective; however, they are still highly uncertain. In summary, the effect of warming on the variation in light rain events is not well understood. In particular, some of the relationships and physical mechanisms involved need to be further addressed, including the relationships between the spatiotemporal changes in light precipitation events and altitude influences on light rain events in certain areas, which have rarely been investigated. Additionally, some studies around the world have revealed the influences of the large-scale circulation changes on weather regimes, climate change, and hydrological variations [24,25,26]. China is mainly influenced by the East Asian Monsoon climate; it has recently been recognized that the East Asian Monsoon is significantly influenced by the El Niño–Southern Oscillation (ENSO), the Pacific Decadal Oscillation (PDO) [27], the Arctic Oscillation (AO) [25], and the North Atlantic Oscillation (NAO) [24]. Thus, these large-scale atmospheric circulation patterns (LSACPs) may influence regional climate change.
In this study, we used the Yellow River Basin (YRB) as an example to document the spatiotemporal changes in light precipitation events and the impacts on them of topographical factors, using the daily precipitation dataset from 66 stations in the YRB during 1960–2018. Two principal objectives of this study are to: (1) explore the spatiotemporal variability in light precipitation events in the YRB; (2) understand the impact of altitude on light precipitation events over the YRB. Climate change in China is affected by the LSACPs (for example, the Arctic Oscillation (AO), North Atlantic Oscillation (NAO), Pacific Decadal Oscillation (PDO), and El Niño–Southern Oscillation (ENSO) [24,25,28], so these are likely to affect precipitation changes in this study area. Hence, the third objective of this study is (3) to investigate whether LSACPs (ENSO, NAO, AO, and PDO) are the dominant mechanisms behind changes in the occurrence of light precipitation events in the YRB. The results will be helpful for hydro-climatic understanding and for potentially improving preparedness for flood or drought disasters in the YRB region.

2. Materials and Methods

2.1. Study Area and Data Description

The Yellow River, known as the ‘Mother River of China’, is the second longest in China and has a drainage area of 79.5 × 10⁴ km2 and a total river length of 5464 km (Figure 1). From the source of the Yellow River to its mouth, the river flows through three different topographic elevations [29]. The terrain of the Yellow River Basin (YRB) is low in the east and high in the west, and is dominated by mountains in the upper and middle reaches of the Yellow River, and plains and hills in the middle and lower reaches [30]. The annual precipitation in most parts of the basin is between 200 and 650 mm, with more than 650 mm in the southern (lower) parts of the middle and upper reaches. These elements, with large annual and seasonal variations in the climatic elements, significantly affect the climate of different regions in the YRB.
This study used daily rainfall data from 1960 to 2018 provided by meteorological stations of the National Climate Center of the China Meteorological Administration (https://www.nmic.gov.cn, accessed on 10 November 2020). To ensure the consistency of the observational data, a year in the dataset was considered missing if more than 5% of days in the year were missing from the dataset. For station data with a low rate of missing data (≤5%), supplementary corrections were made through interpolation from adjacent stations, covering the times before and after the missing dates. Finally, data from 66 surface stations in the YRB were selected as appropriate for this analysis. The possible associations between light precipitation events and LSACPs were analyzed using multiple regression. The ENSO, PDO, NAO, and AO indices were obtained at a monthly scale from the National Oceanic and Atmospheric Administration’s National Centers for Environmental Information (https://www.ncei.noaa.gov, accessed on 10 November 2020). In this study, we averaged monthly values to calculate the annual mean.

2.2. Methods

2.2.1. Definition of Light Precipitation Events

A precipitation event is usually defined as a day with a total precipitation of ≥0.1 mm [14], and light precipitation is usually based on daily data using the definition of 0.1–10 mm/day [11,17,22]. This criterion is in accordance with the precipitation classification standards of the China Meteorological Administration (CMA). Some scholars further define a light precipitation event as 0.1 ≤ P < 10.0 mm/day. (Refs. [15,17,25]. Wu et al. adopted the CMA precipitation grade standards to measure daily precipitation rates and classified rain into five grades of intensity: light (0.1 ≤ P < 10.0 mm/day), moderate (10.0 ≤ P < 25.0 mm/day), heavy (25.0 ≤ P < 50.0 mm/day), storm (50.0 ≤ P < 100.0 mm/day), and downpour (≥100.0 mm/day) [15,18]. The same method can be applied to classify light precipitation into five grades of intensity: grade 1 (G1) (0.1 ≤ P < 2.0 mm/day), G2 (2.0 ≤ P < 4.0 mm/day), G3 (4.0 ≤ P < 6.0 mm/day), G4 (6.0 ≤ P < 8.0 mm/day), and G5 (8.0 ≤ P < 10.0 mm/day) [19,23]). In this study, we analyzed the light precipitation events for days with precipitation less than 10 mm/day. The light precipitation assessment index (LPAI) proposed by Li et al. was used for the magnitude and frequency in such events [19]. For one event at a given station, the LPAI can be calculated as follows
LPAI = G1D1 + G2D2 + G3D3 + G4D4 + G5D5
where Gi represents the specific grade of light precipitation (i = 1, …, 5) and Di is the number of days of light precipitation at said grade. For example, for a light precipitation event that lasted five days with precipitation amounts of 1.2, 2.4, 4.5, 8.8, and 9.6 mm, its LPAI is G1(1) ∙ D1(1) + G2(2) ∙ D2(1) + G3(3) ∙ D3(1) + G4(4) ∙ D4(0) + G5(5) ∙ D5(2) = 1 × 1 + 2 × 1 + 3 × 1 + 4 × 0 + 5 × 2 = 16.

2.2.2. Trend Analysis

The non-parametric Mann-Kendall (M−K) test and Sen’s slope estimates were applied to identify trends in light precipitation events for the YRB. The M−K test is widely used in climate change research for assessing the significance of monotonically increasing or decreasing trends (e.g., [3,24,31]). The M-K test is based on the hypothesis that the expected change in the series is a monotonic trend. The null hypothesis H0 is that in a series of data, {xi, i = 1, 2, …, n}, xi is independent and equally distributed. The alternative hypothesis H1 is that a monotonic trend exists in X. The M-K test statistic is calculated as
S = i = 1 n 1 j = i + 1 n sgn ( x j x i )
where the xj are sequential data, n is simple size, and
sgn ( x j x i ) = { + 1 , x j > x i 0 , x j = x i 1 , x j < x i
The statistics S is approximately normally distributed when n ≥ 8, with the mean and the variance as follows
E(S) = 0
σ   2 = V ( S ) = [ n ( n 1 ) ( 2 n + 5 ) i = 1 n t i i ( i 1 ) ( 2 i + 5 ) ] 18
where ti is the number of ties of extent i. The standardized test statistic Zc for one-tailed test is estimated as
Z c = { S 1 V a r ( S ) , S > 0 0 , S = 0 S + 1 V a r ( S ) , S < 0
It produces two important parameters: the magnitude of the slope (change per unit time) in a time series and the statistic Zc that represents the direction of the trend. Positive or negative Zc indicate increasing or decreasing trends, respectively. The testing took place at a specific α significance level. In this study, significance levels of α = 0.01 and α = 0.05 were used. Sen’s slope is used to identify the magnitude of trend in a dataset [32]. The method is non-parametric and is not sensitive to outliers. For a dataset with xi and xj as the sample data points, Sen’s slope is calculated using Equation (7).
Sen slope = medea { ( x _ i x _ j ) / ( j i )       : i < j }
For a confidence level of 95%, we calculated lower and upper intervals (xL and xU, respectively) with respect to the number of pairs of time series elements (N) and standard deviation of M-K test (σ).
x L = N k 2
x U = N k 3
where k is the product of critical Z statistics and standard deviation of M-K test.
The M-K method assesses the existence and significance of a trend, and also reveals abrupt changes and the approximate starting point of a trend in climate [28,31]. The temporal and spatial variations in light precipitation events were analyzed using Origin Pro 9.0, SPSS 26.0, ArcGIS 10.2, and MATLAB R2020a.

2.2.3. Correlation Analysis

Four climate indices (NAO, AO, PDO, and ENSO) were used to evaluate the influence of LSACPs on light precipitation events in the YRB. The presence of a statistically significant relationship between light precipitation events and NAO, AO, PDO, and ENSO was evaluated by simple linear regression, and statistically significant relationships between light precipitation events and climate indices were investigated by using the Poisson regression model. The counts in year i are denoted as Ni, and it was assumed that Ni has a conditional Poisson distribution with the rate of occurrence parameter λi as follows
P ( N i = k | λ i ) = e λ i λ i k k !   ( k = 0 ,   1 ,   2   )  
Increasing or decreasing trends were identified by verifying the assumption of a linear relationship between λi and t.
λi = exp (β0 + β1ti)
where β1 < 0 denotes a decreasing trend and β1 > 0 represents an increasing trend. Additionally, the trend was significant when β1 differed from 0 at the 5% significance level [24,25,33].

3. Results and Discussion

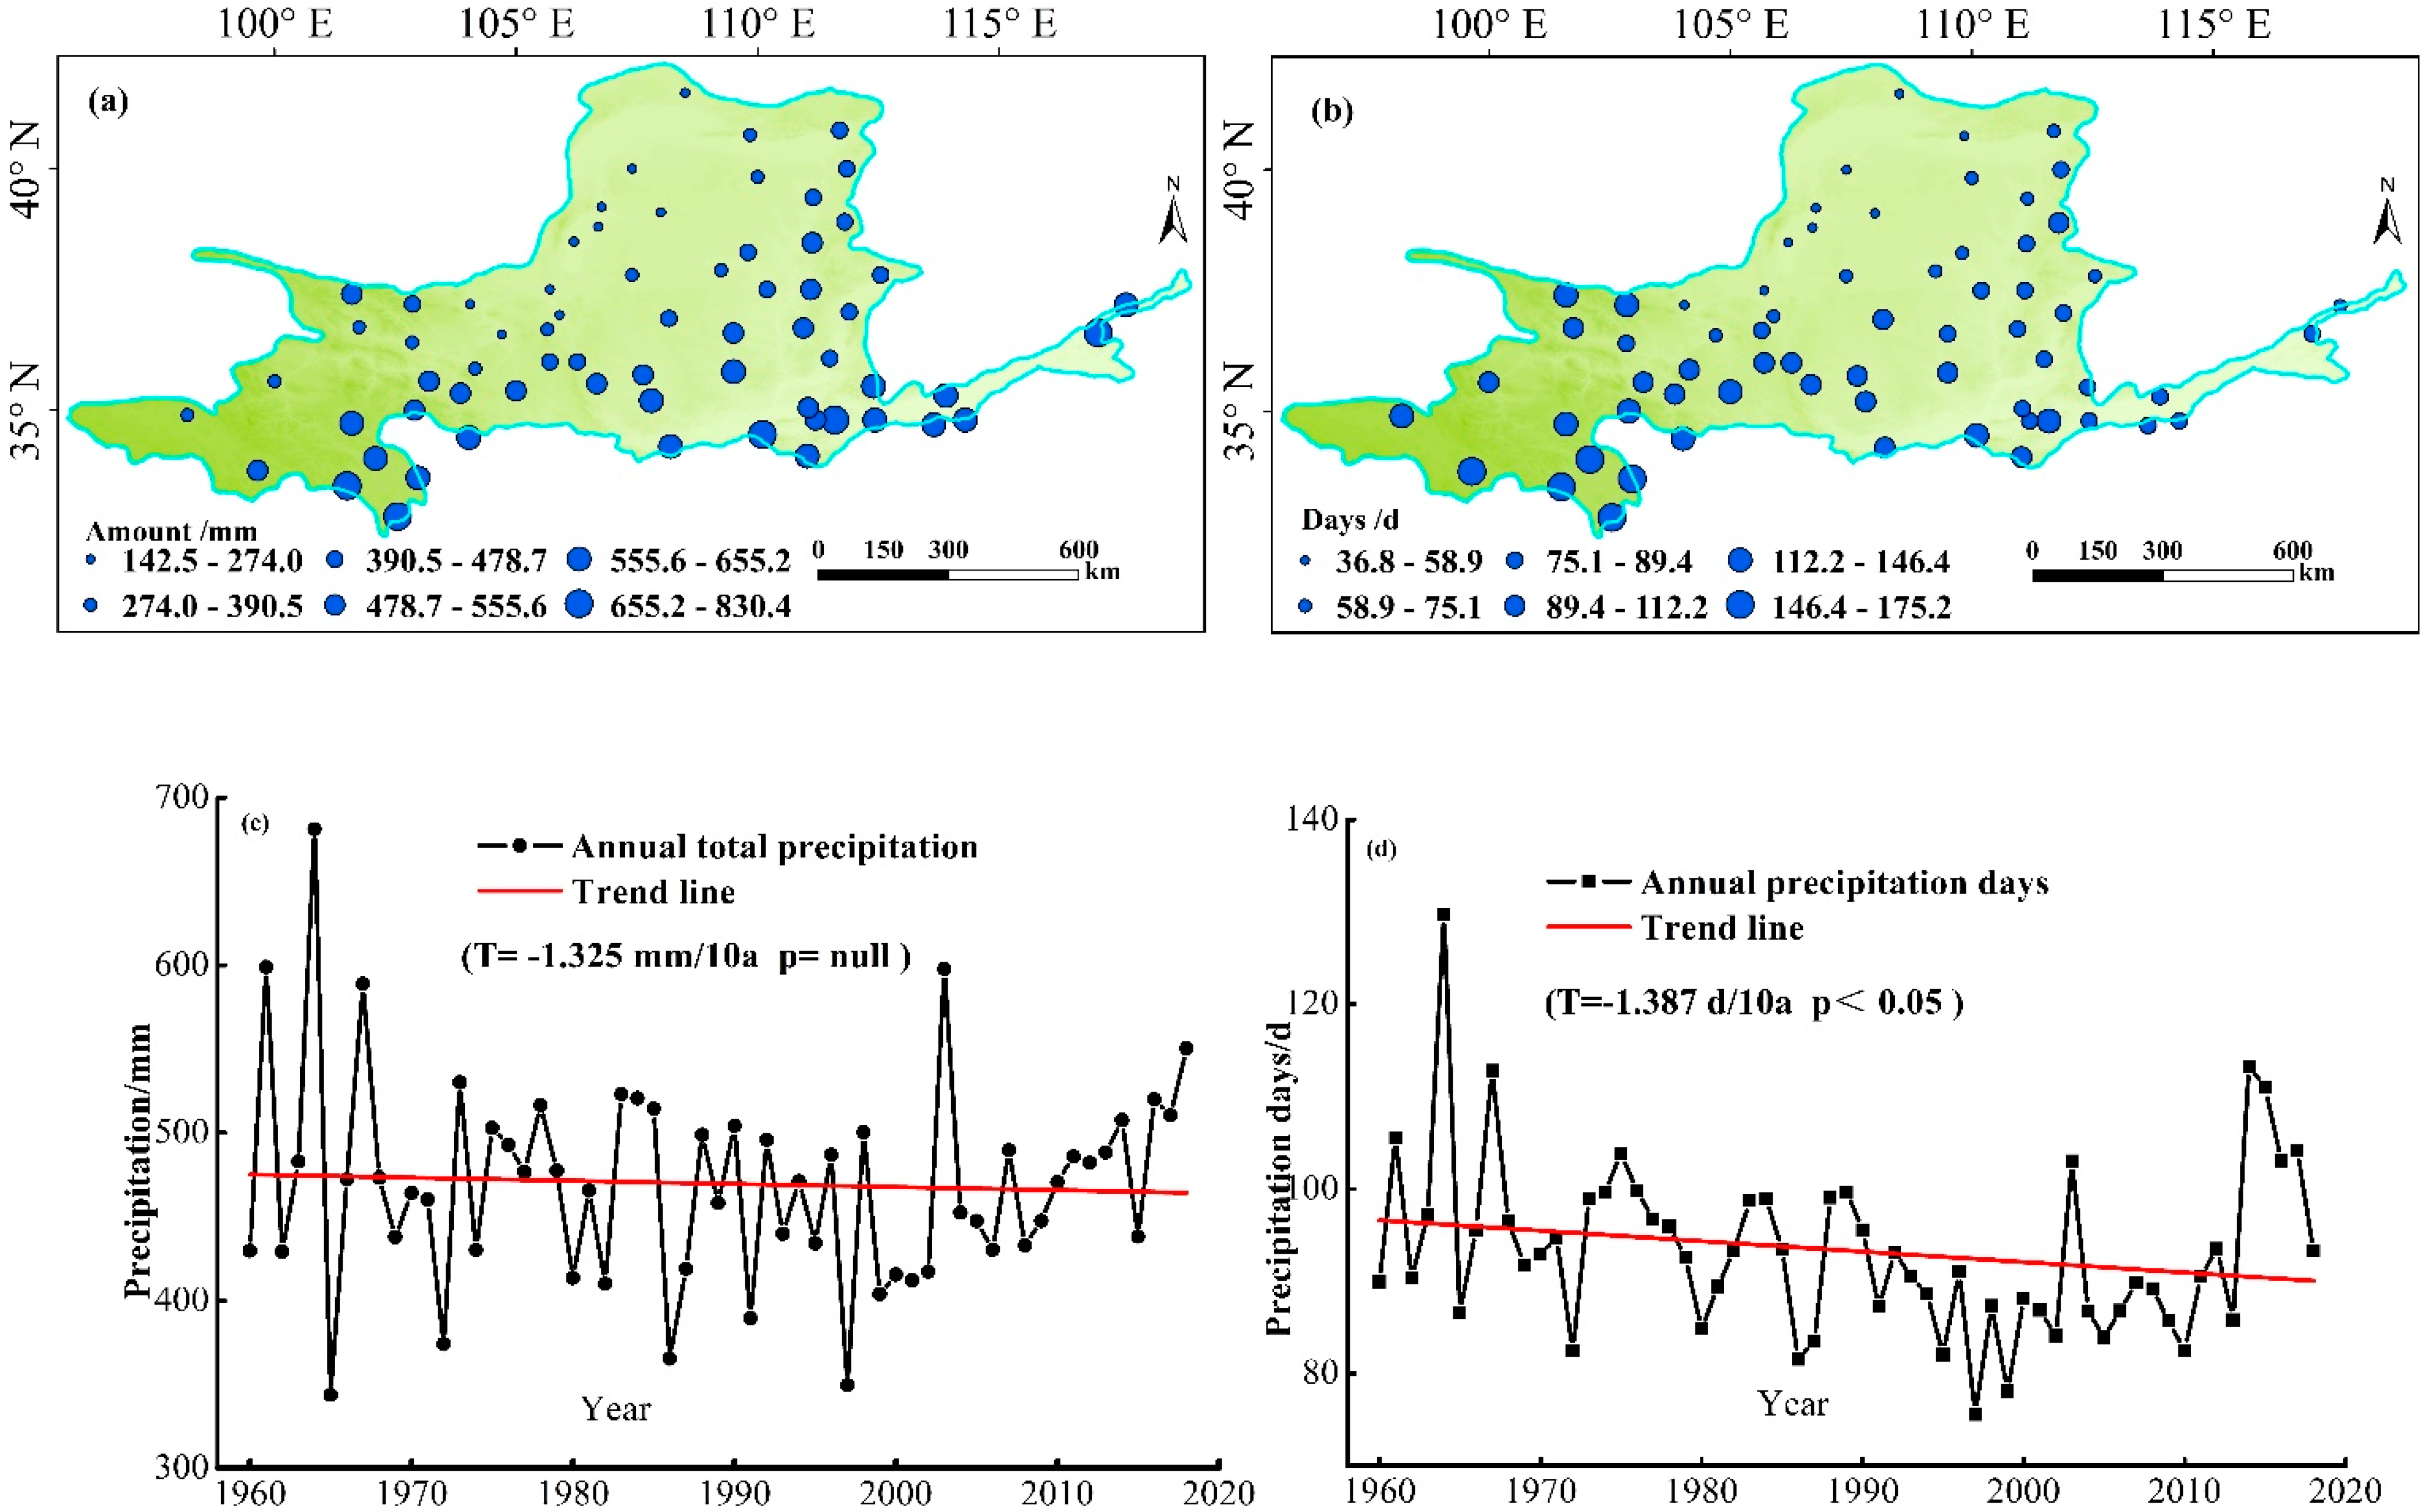
3.1. Spatiotemporal Variations in Annual Precipitation

The spatial distribution of the average annual precipitation decreased from south to north in the YRB (Figure 2a), and was lower than 800 mm/yr over most of the basin. Only small regions (Huashan and Luanchuan) in the southern and eastern parts of the YRB had values greater than 800 mm/y. The annual average number of precipitation days showed a southwest to northeast gradient (Figure 2b), decreasing from >110 days in the west to <80 days in the east. The distribution of annual precipitation was very uneven due to arid and semi-arid climate conditions. Due to socio-economic development, the water supply of the YRB is subject to heavy demands [34], especially as it flows through the Loess Plateau, an ecologically fragile region in North China. The time series of the annual average precipitation over all sites in the YRB exhibited a decreasing trend of 1.33 mm/decade, but it was not significant from 1960 to 2018 (Figure 2c). The lowest annual precipitation was only 343.7 mm in 1965, which was lower than the mean annual precipitation (469.9 mm). The number of precipitation days showed a significantly decreasing trend, reaching 1.38 d/decade over the YRB (Figure 2d). The average annual precipitation days was 93 d at all meteorological stations.

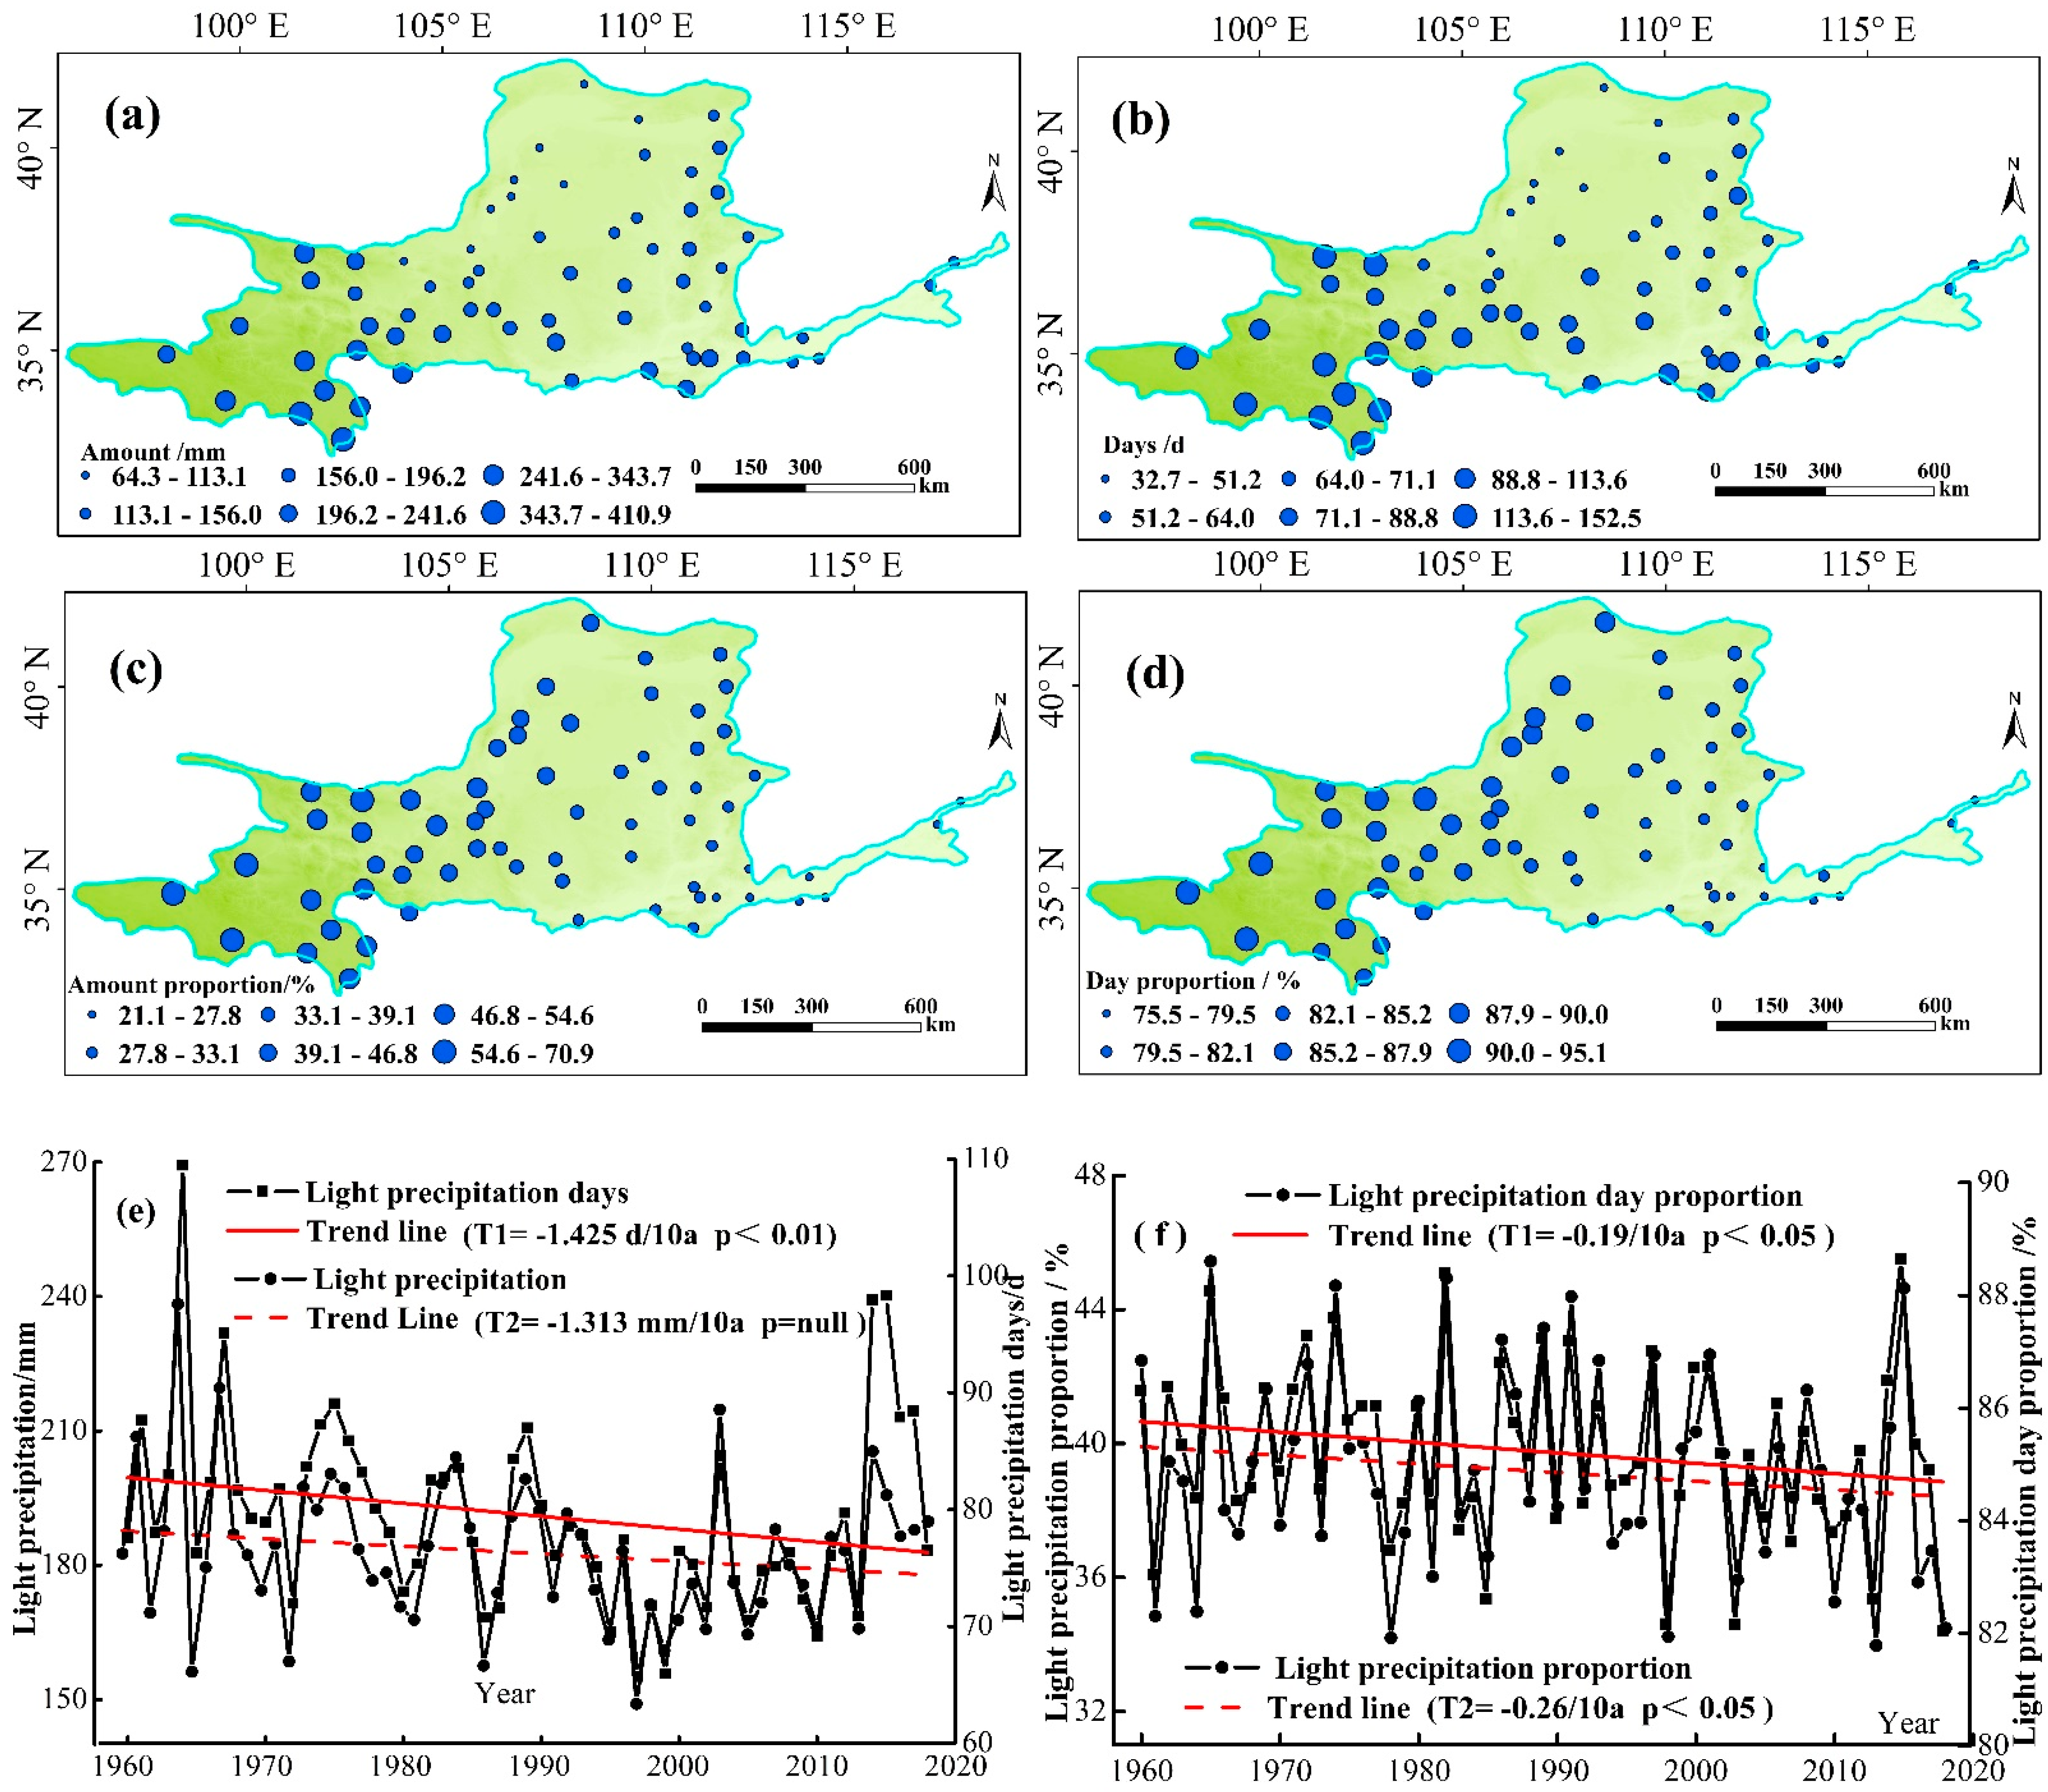
3.2. Spatiotemporal Variations in Light Precipitation

Figure 3 presents the spatiotemporal variations in the mean annual amount of light precipitation and mean number of light rain days from 1960 to 2018 in the YRB. As shown in Figure 3a,b, the spatial variations in the amount and number of days for annual light rain were consistent, with a gradual decrease from west to east. The maximum total annual light precipitation (410.9 mm) was observed in the southwestern part of the YRB, represented by Jiuzhi in Qinghai and Hongyuan in Sichuan (394.5 mm) (Figure 3a). The minimum total annual light precipitation was observed in the central region of the YRB, represented by Linhe (64.3 mm) in Inner Mongolia and Huinong (77.3 mm) in Ningxia. The number of light rain days in the southwest region was more than 153 days in Hongyuan, whereas the central region (Linhe) showed lower values (<33 days) (Figure 3b). Southwest parts of the region saw up to 100 days of light rain, while relatively low values (<70 days) were concentrated in northeastern parts of the region. Thus, the spatial distributions of the amount and number of days of light precipitation were similar.
We also found that the spatial changes in the number of light precipitation days were consistent with the spatial changes in the overall number of precipitation days in the YRB. The spatial distribution of the light rain amounts and days as proportions of the total precipitation amounts and days exhibited declining and similar trends from southwest to northeast in the study area (Figure 3c,d). The mean annual light precipitation amount and days were 182.7 mm and 80 days, respectively, from 1960 to 2018 over the YRB, accounting for 39.2 and 85.2% of the total annual precipitation amount and days, respectively (Figure 3e,f). The amount of light rain was greatest in 1964 (238.3 mm), with 109 light rain days, and lowest in 1997 (149.0 mm), with 66 light rain days. The findings of this study indicate that large amounts of light rain were associated with more light rain days, and vice versa. On the whole, the light precipitation in the YRB decreased by approximately 1.3 mm/decade over the entire study period, and the linear trends were not statistically significant. The decreasing trend was more significant for the average number of light precipitation days than for the amounts of light precipitation. The average number of light precipitation days in the YRB decreased significantly at the rate of 1.4 days/decade (p < 0.05) (Figure 3e). Additionally, the amount of light precipitation as a proportion of the total decreased to a greater extent than the number of light precipitation days as a proportion of the total during the study period (Figure 3f).
The light precipitation amounts and days encompass about 35.0–45.4% and 82–89% of the total precipitation amounts and days of the research region, respectively. Although light precipitation only accounts for 39% of the total precipitation amount, the number of light precipitation days accounts for 85% of the total precipitation days. That is to say, most rain events in the YRB are light precipitation events.
In order to further understand the changes in light precipitation events, we divided light precipitation into five intensity levels (G1–G5) using equal interval division.

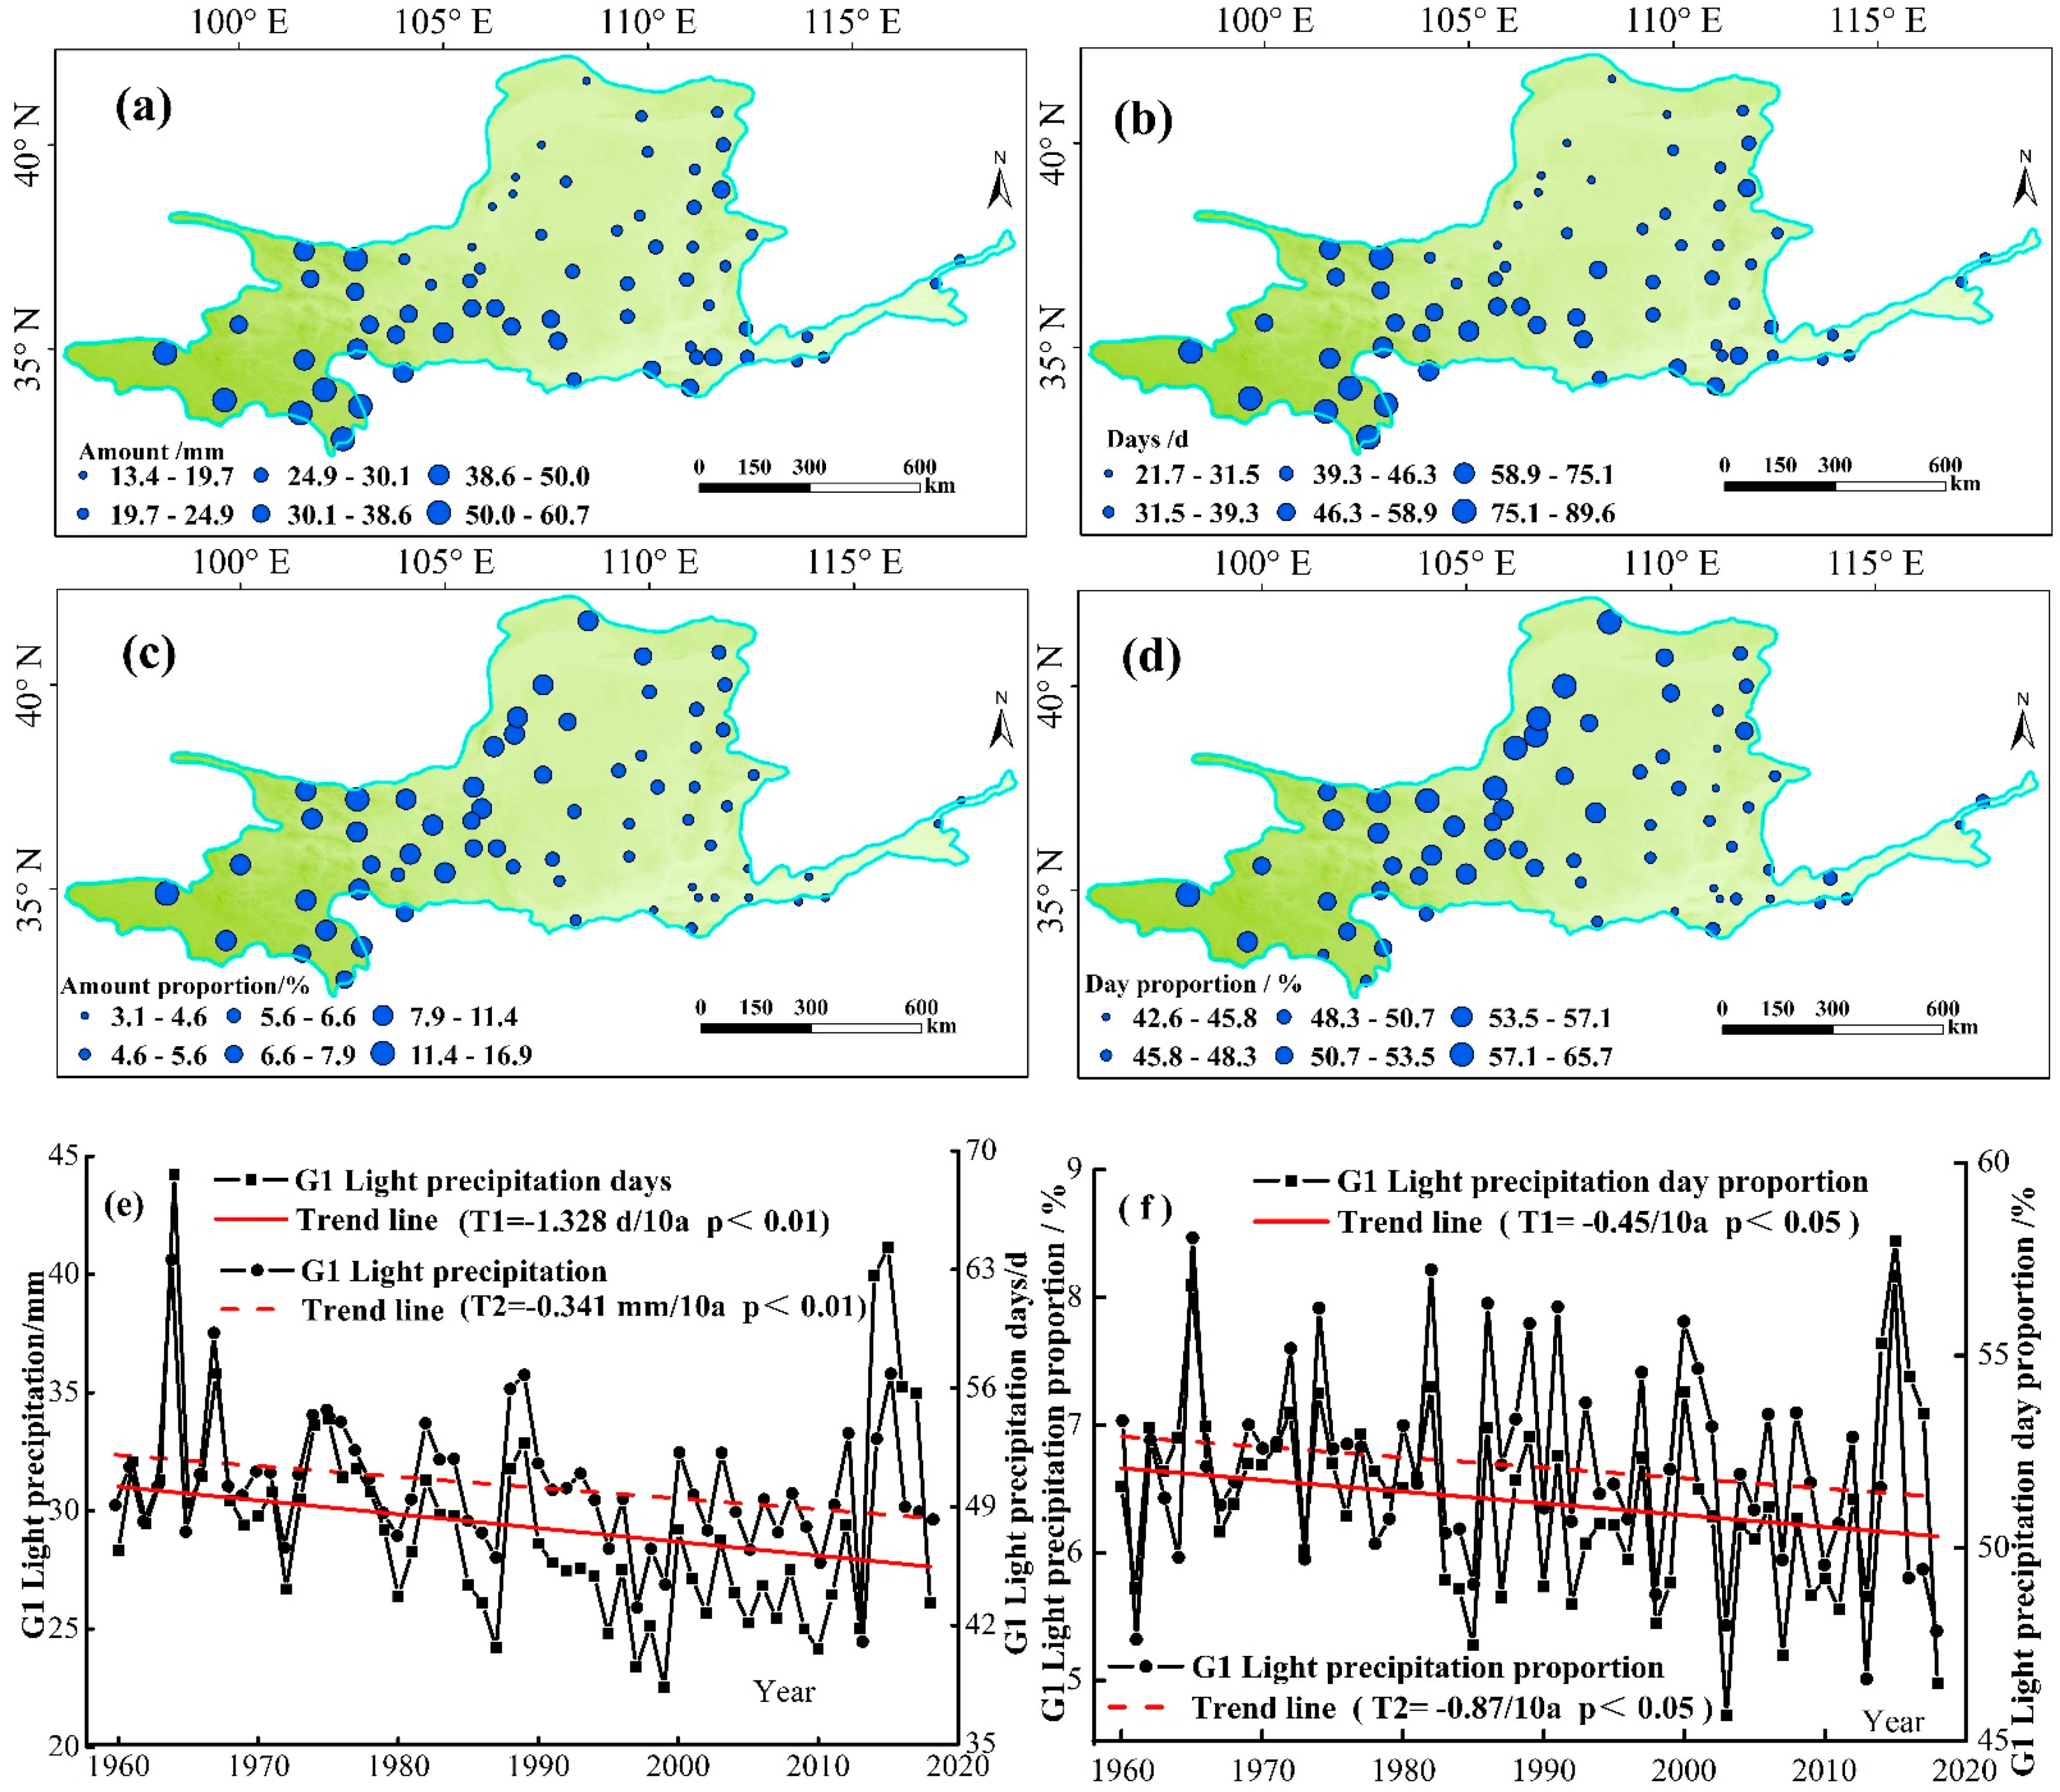
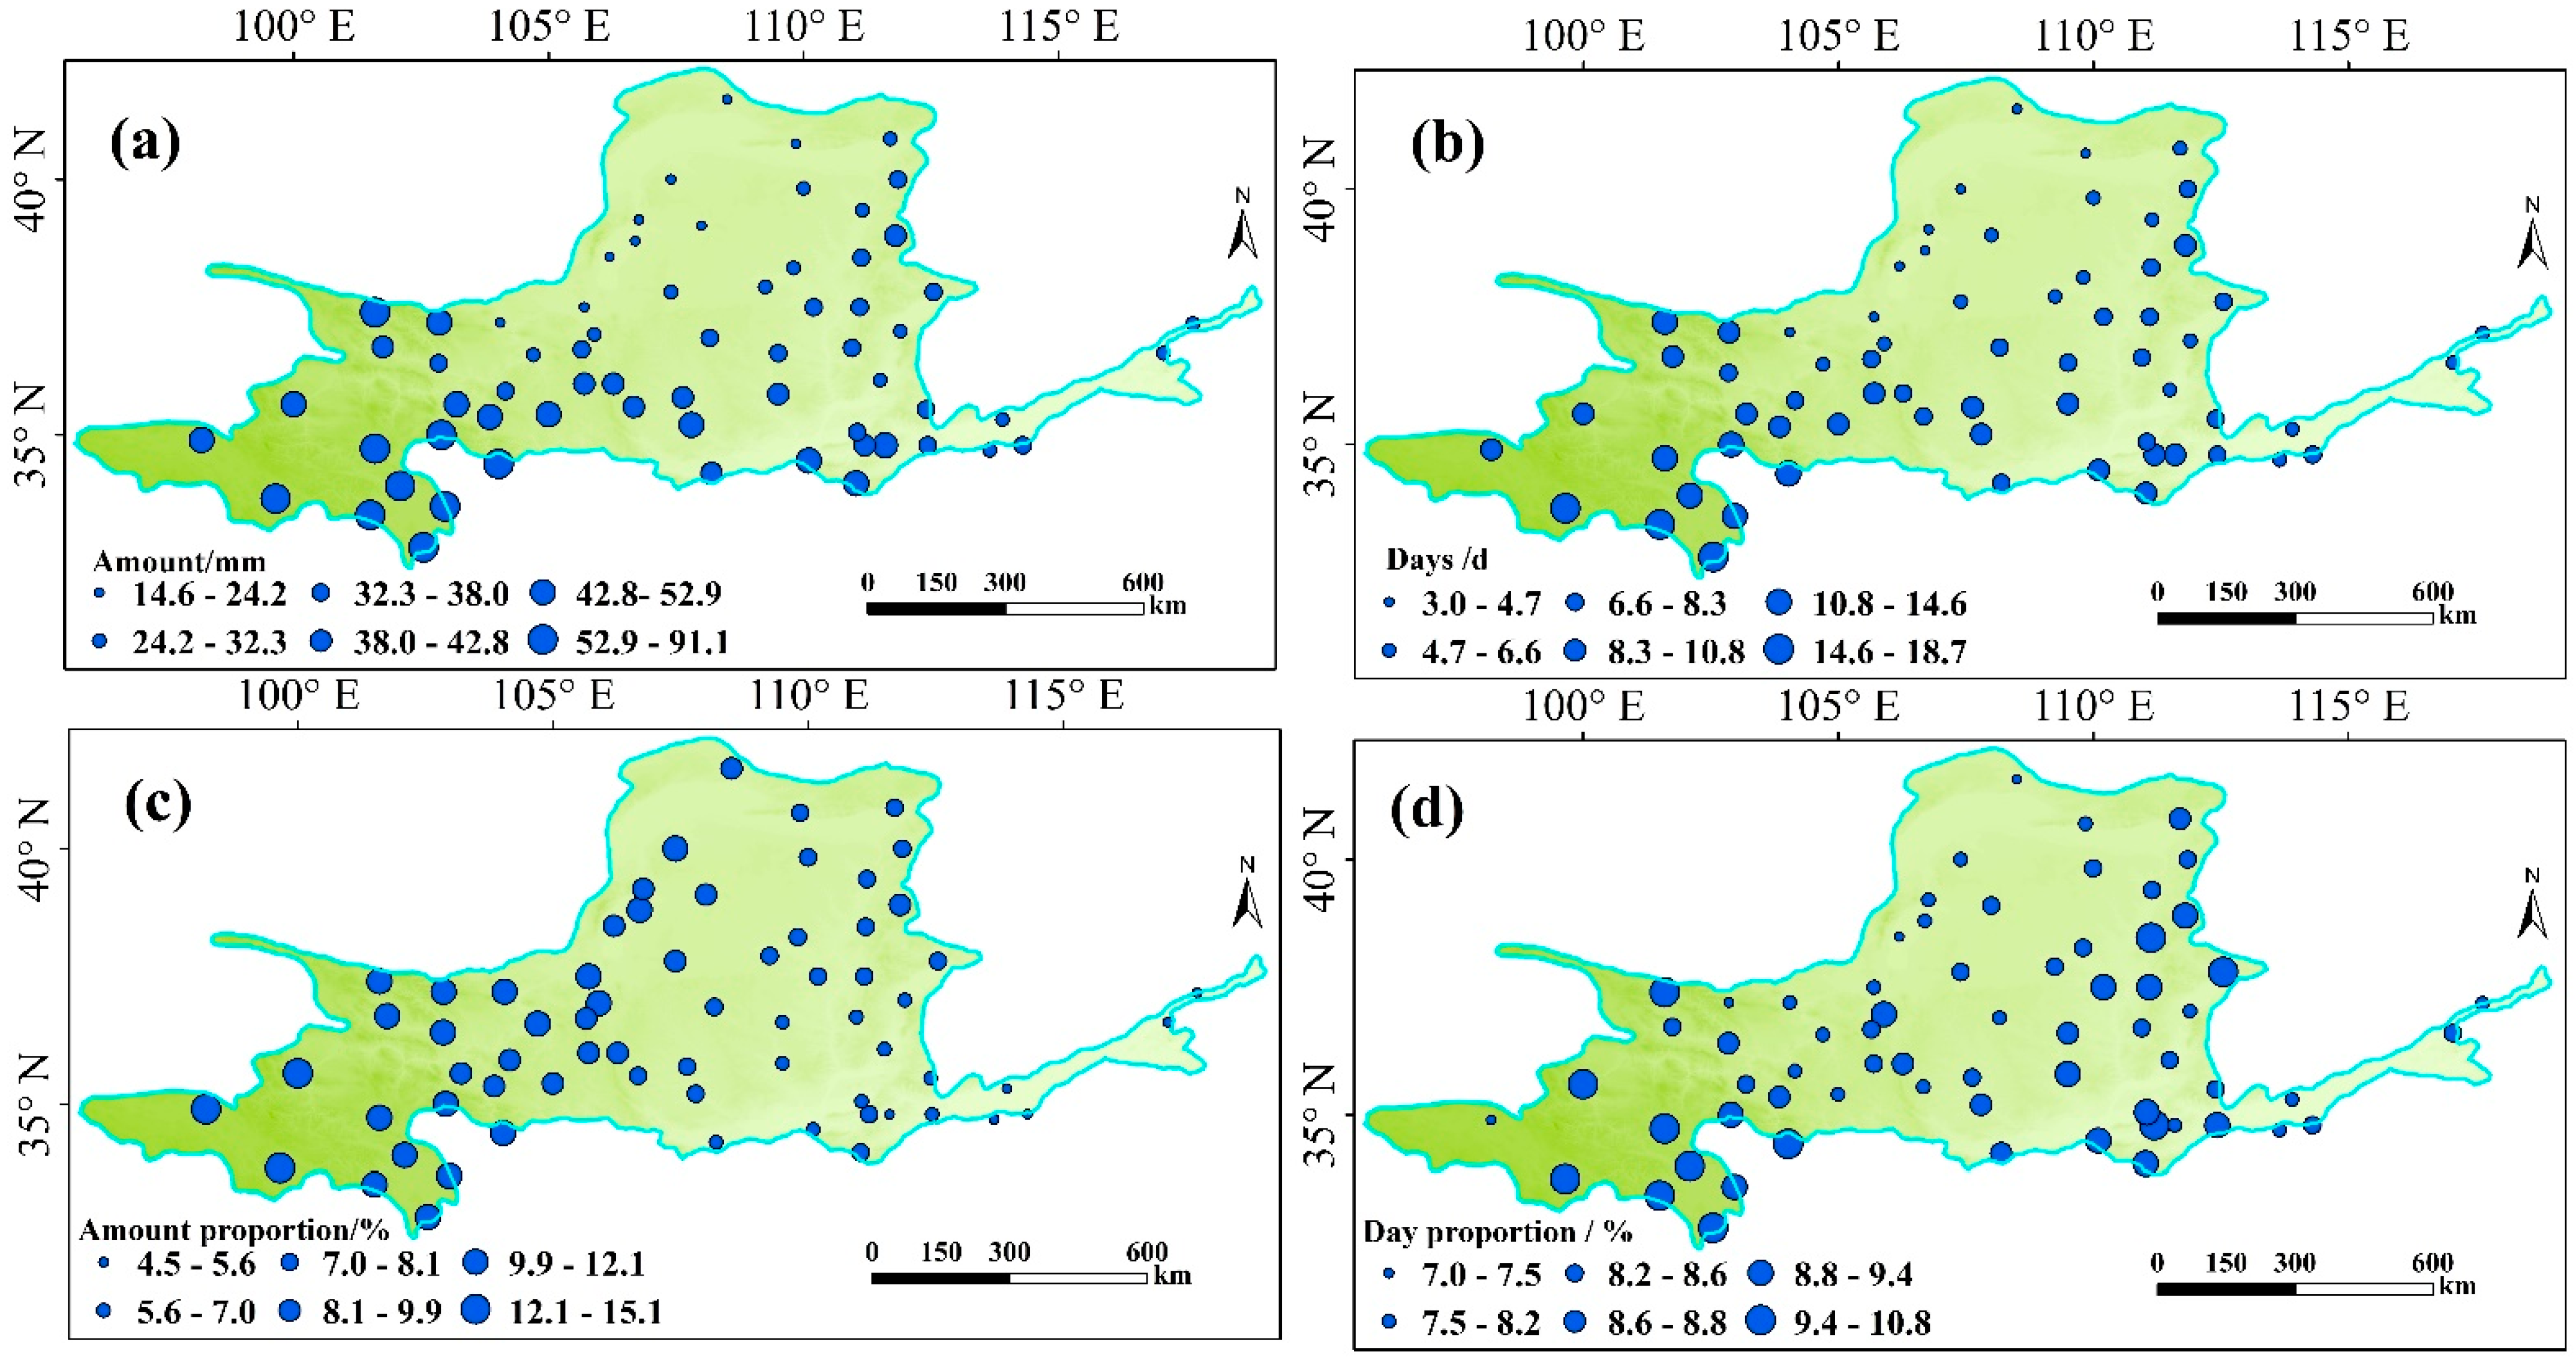
3.2.1. Spatiotemporal Variations in G1 Light Precipitation Events

The spatiotemporal changes in the G1 light precipitation events over the YRB are shown in Figure 4. The amount of G1 light precipitation showed an obvious zonal distribution (Figure 4a), with low values (<20 mm) in the north-central part of the region and high values in the southwest (>55 mm), similar to the spatial distribution of light rain overall, as shown in Figure 3a. Low values of G1 light rain were located in the north–central part of the region, and they corresponded to those with low values of the total amount of light precipitation. This further confirmed that the north-central part of the YRB mainly experienced light rain. The spatial distribution of the number of G1 light precipitation days was similar to that of the G1 light precipitation amounts (Figure 4b). The G1 light rain amount was highest in Dari (60.7 mm), with 90 G1 light precipitation days, and lowest in Linhe (13.4 mm), with 22 light precipitation days. These results indicate that greater G1 light rain amounts were associated with more G1 light precipitation days. The G1 light precipitation amount as a proportion of the total precipitation amount ranged from approximately 3.4–17.4% (Figure 4c), while days of G1 light precipitation accounted for more than 51.2% of the total light precipitation days (Figure 4d). Linear regression indicated that the annual mean G1 light precipitation amount and number of G1 days over the study area showed decreasing trends (Figure 4e). The amount of G1 light precipitation declined at the rate of 0.34 mm/decade during the study period, and the linear trend was statistically significant at the 0.01 level. Similarly, the G1 light precipitation days decreased by 1.33 d/decade from 1960 to 2018, and the linear trend was statistically significant at the 0.01 level. As shown in Figure 4f, the annual average amounts and days of G1 light precipitation as proportions of the total precipitation amounts and days decreased at a rate of 0.87%/decade and 0.45%/decade, respectively, over the entire study period. The annual mean G1 light precipitation amounts and days as proportions of the total precipitation amounts and days were 6.7% and 51%, respectively. This manifests that days with intensity 0.1–2 mm/day accounted for more than half of the total light rain (0.1 ≤ P < 10 mm/day) over the YRB, although they accounted for a small proportion of the total light precipitation.

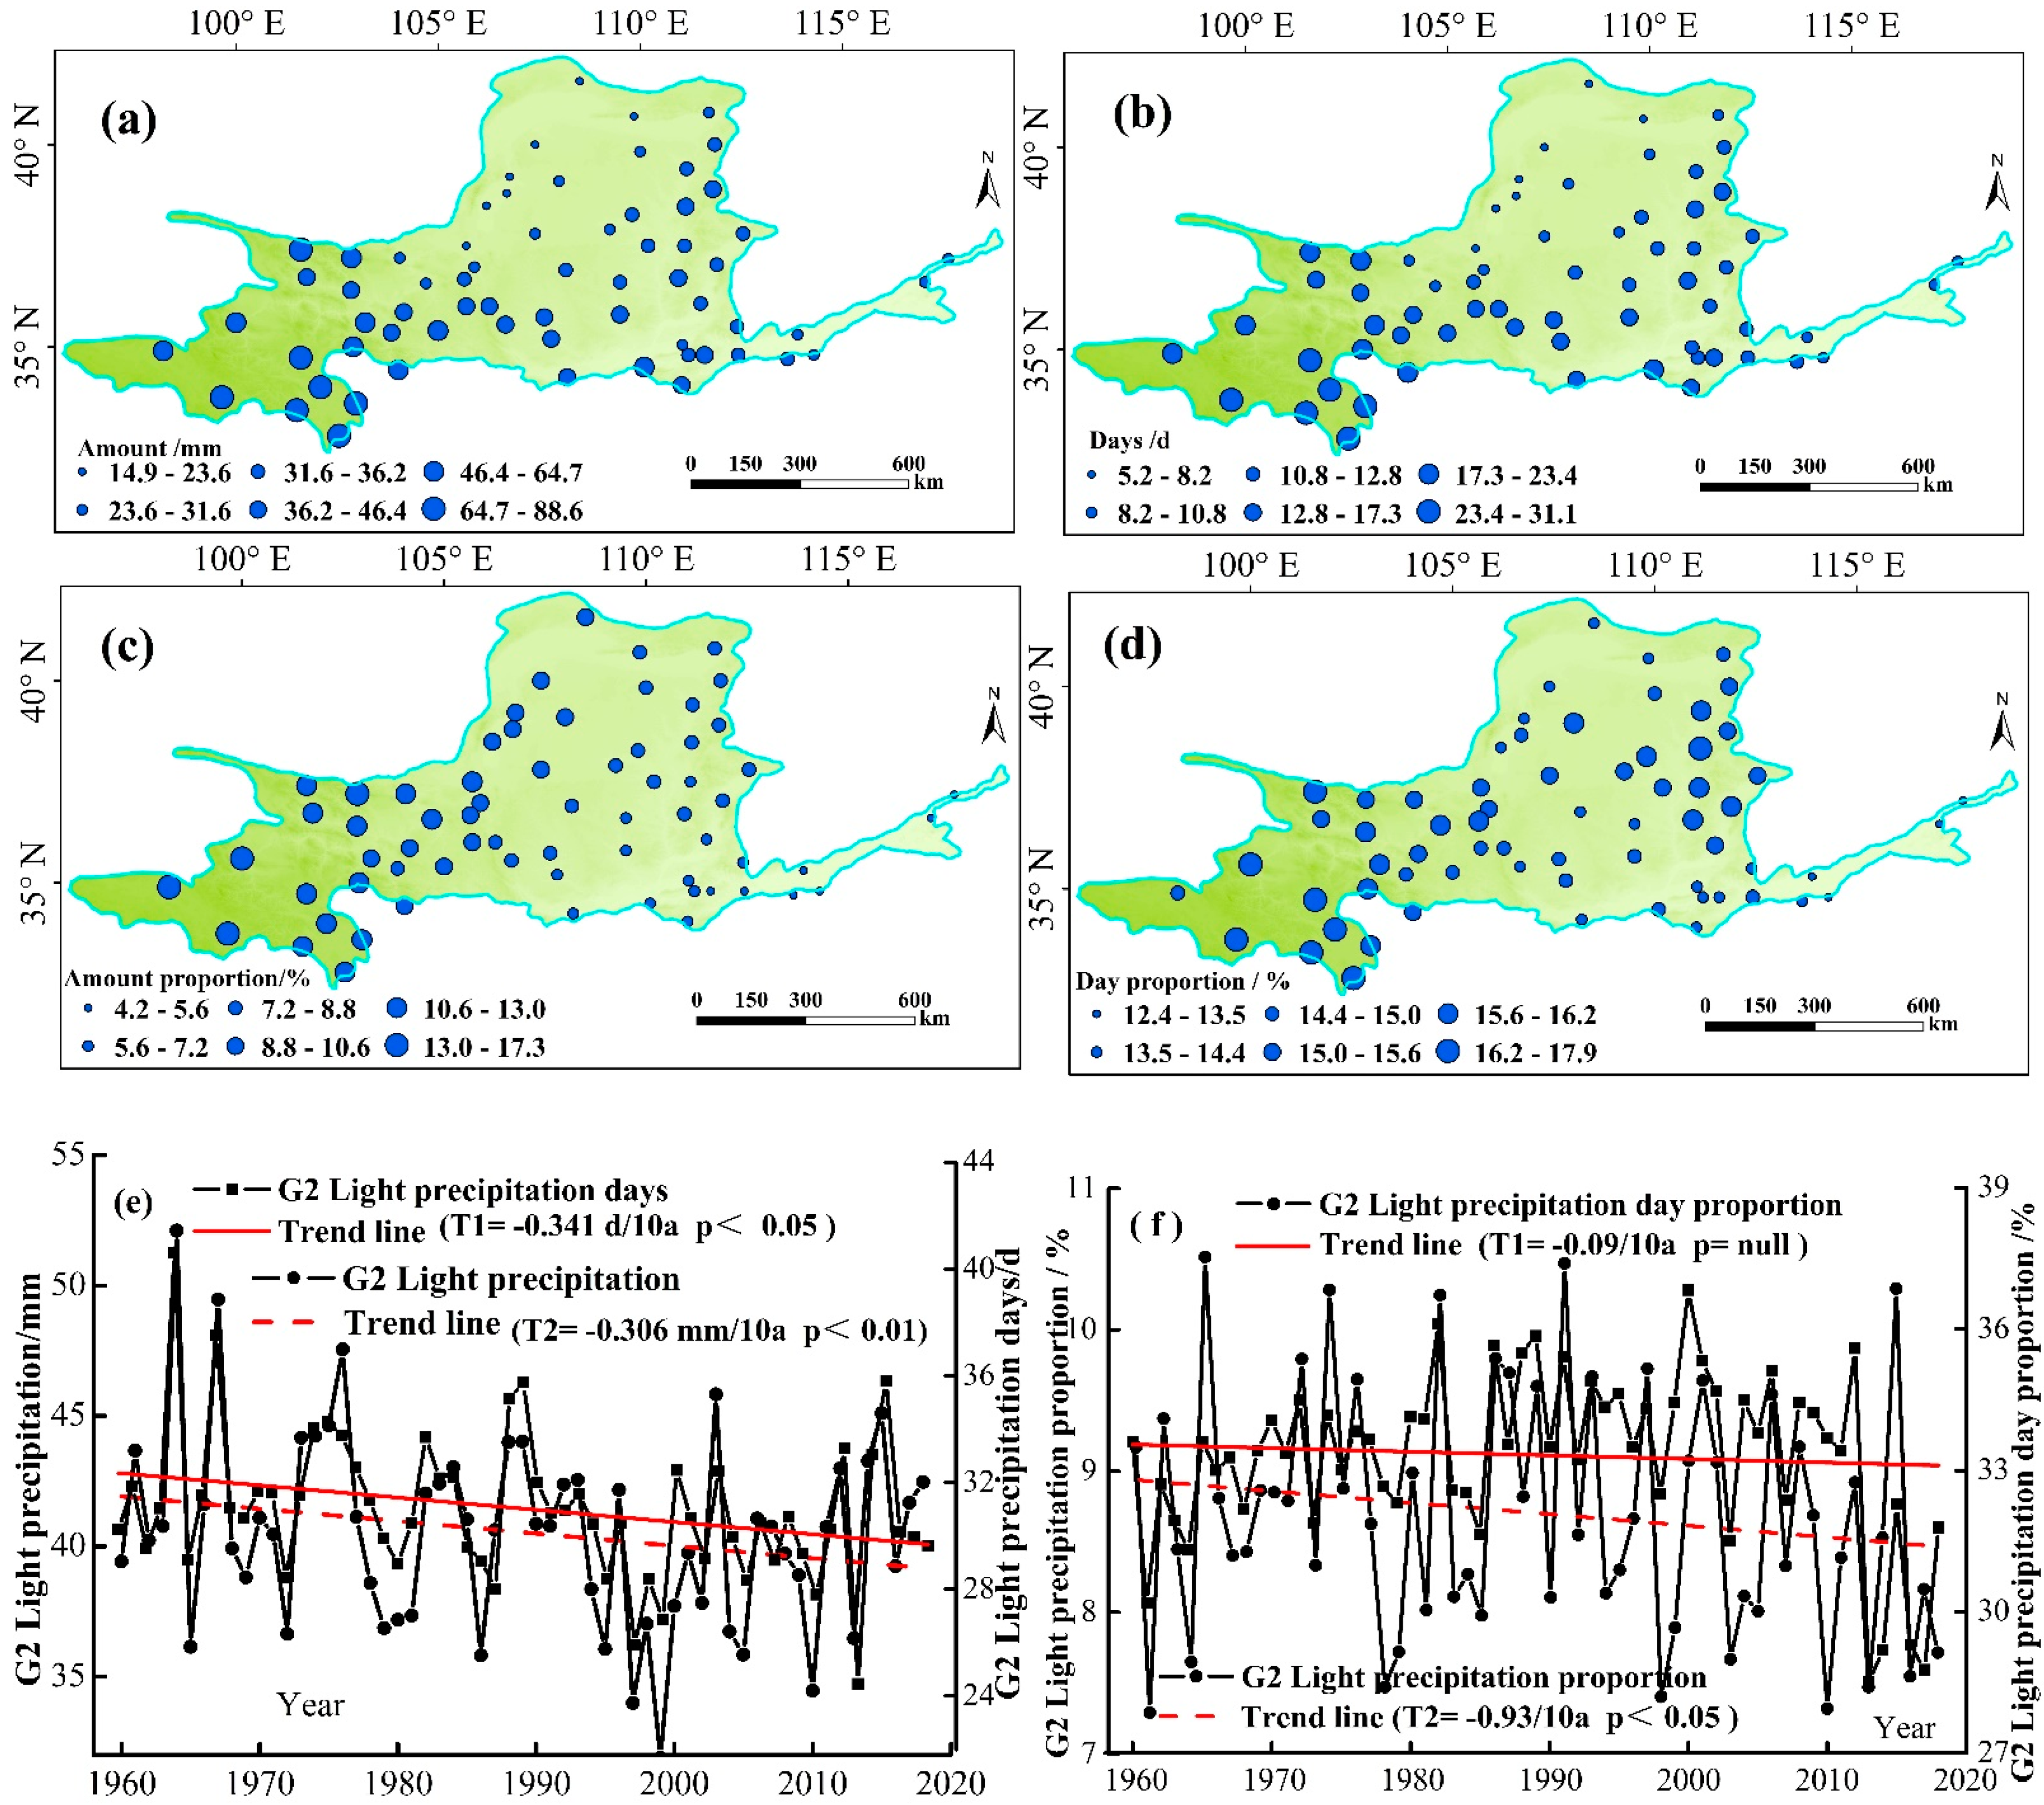
3.2.2. Spatiotemporal Variations in G2 Light Precipitation Events

Figure 5 shows the spatiotemporal changes in the G2 light precipitation events from 1960 to 2018 in the YRB. The amount of G2 light precipitation varied considerably with a zonal distribution (Figure 5a). The amount of G2 light precipitation ranged from 14.9 to 88.6 mm, decreasing from west to east and south to north of the study area. Higher values for the amount of G2 light precipitation from 1960 to 2018 were mostly found in the southwestern part of the YRB (Figure 5a), while lower values were mainly found in the central regions. The spatial pattern of the number of G2 light precipitation days was very similar to that of the G2 light precipitation amounts (Figure 5b), which demonstrates that the more G2 precipitation the region received, the more G2 days it experienced. The spatial variations in the amounts and days of G2 light precipitation as proportions of the total precipitation amounts and days were similar (Figure 5c,d). The proportion of G2 light precipitation amounts and days fell from 17.7% to 4.6% and 17.9% to 12.6%, respectively, and gradually decreased from the north to the southeast. Both the amounts and days of G2 light precipitation decreased significantly at 0.31 mm/decade and 0.34 days/decade, respectively (Figure 5e). The annual average amounts and days of G2 light precipitation were 40.5 mm and 31 days, respectively (Figure 5e). These decreasing trends were weaker in intensity than those observed with G1. The proportions of annual mean G2 light precipitation amounts and days were 8.7% and 33%, respectively (Figure 5f). Although the annual mean G2 light precipitation amount as a proportion of the total precipitation amounts and days is slightly greater than that of G1 (6.7% for G1 and 8.7% for G2), the proportion of G2 light rain days was much lower than that of G1 (51% in G1 and 33% in G2).

3.2.3. Spatiotemporal Variations in G3 Light Precipitation Events

As shown in Figure 6a, there was an obvious difference between the west and east in the spatial distribution of amounts of G3 light precipitation. Minimum G3 light precipitation amounts (<24.2 mm) appeared in the central-northern parts of the YRB with a tendency to increase towards the southwest parts of the region (>52.9 mm) (Figure 6a). The spatial pattern of the number of G3 light precipitation days was consistent with that of the G3 light precipitation amounts (Figure 6b). The annual mean G3 light precipitation amounts and days range from 14.6 to 91.1 mm and from 3 to 19 days, with averages of 39.9 mm and 8 days, respectively. The spatial distribution of the amounts and days in the annual mean G3 light precipitation were in accordance with those of G2 (maximum in the southwest and minimum in the north and east). The spatial patterns of G3 and G2 light precipitation amounts and days as proportions of total precipitation amounts and days were similar (Figure 5c,d and Figure 6c,d). The inter-annual variations in G3 light precipitation amounts and days were relatively consistent over the whole region; both decreased slowly at a rate of −0.28 mm/decade and −0.06 day/decade, respectively (Figure 6e). The average annual amount of G3 light precipitation (39.9 mm) was basically equal to that of G2 (40.5 mm), but there were only 8 days of G3 (approximately 57% of G2).
As shown in Figure 6f, the annual average amounts of G3 light precipitation as proportions of the total precipitation amounts and days decreased significantly at a rate of 0.68%/decade over the entire study period. However, the proportions of the annual average days of G3 light precipitation showed an obvious increasing trend at a rate of 0.8%/decade. The proportions of annual mean G3 light precipitation amounts and days are 8.5% and 8.8%, respectively. The annual average proportion of G3 amount is basically equal to that of G2, but there are fewer G3 days than G2 (33%).

3.2.4. Spatiotemporal Variations in G4 Light Precipitation Events

The spatial distribution of the annual mean G4 light precipitation declined from southwest to northeast over the study region (Figure 7a). Relatively larger values (>68.2 mm) were observed in the southwest region (in Hongyuan and Jiuzhi) and smaller values (<21.3 mm) were observed in the central region (in Linhe and Huinong). The spatial variation in the annual average number of G4 light precipitation days was the same as that of the amounts, decreasing from >10 d in the southwest to <3 d in the central area (Figure 7b). The amounts of G4 light precipitation as proportions of the total precipitation amounts fell from 13.2% to 4.4% and gradually decreased from the north to the southeast (Figure 7c) with a similar spatial pattern to the amounts of G3 light precipitation as proportions of the total precipitation amounts (Figure 6c). The number of G4 light precipitation days as a proportion of the total precipitation days ranged from 4.1 to 7.8% and the smallest proportion was concentrated in the north-central region (Figure 7d). Both the amounts and days of G4 light precipitation decreased over the study period, with rates of −0.34 mm/decade and −0.03 day/decade, respectively (Figure 7e). The annual mean amounts of G4 light precipitation as proportions of the total precipitation amounts showed a weakly increasing trend at a rate of 0.14%/decade, whereas the number of days of G4 light precipitation as proportions of the total precipitation days decreased at a rate of 0.71%/decade from 1960 to 2018 over the study area (Figure 7f). The annual mean amounts and days of G4 light precipitation as proportions of the total precipitation amounts and days were 8.0% and 5.8%, respectively.

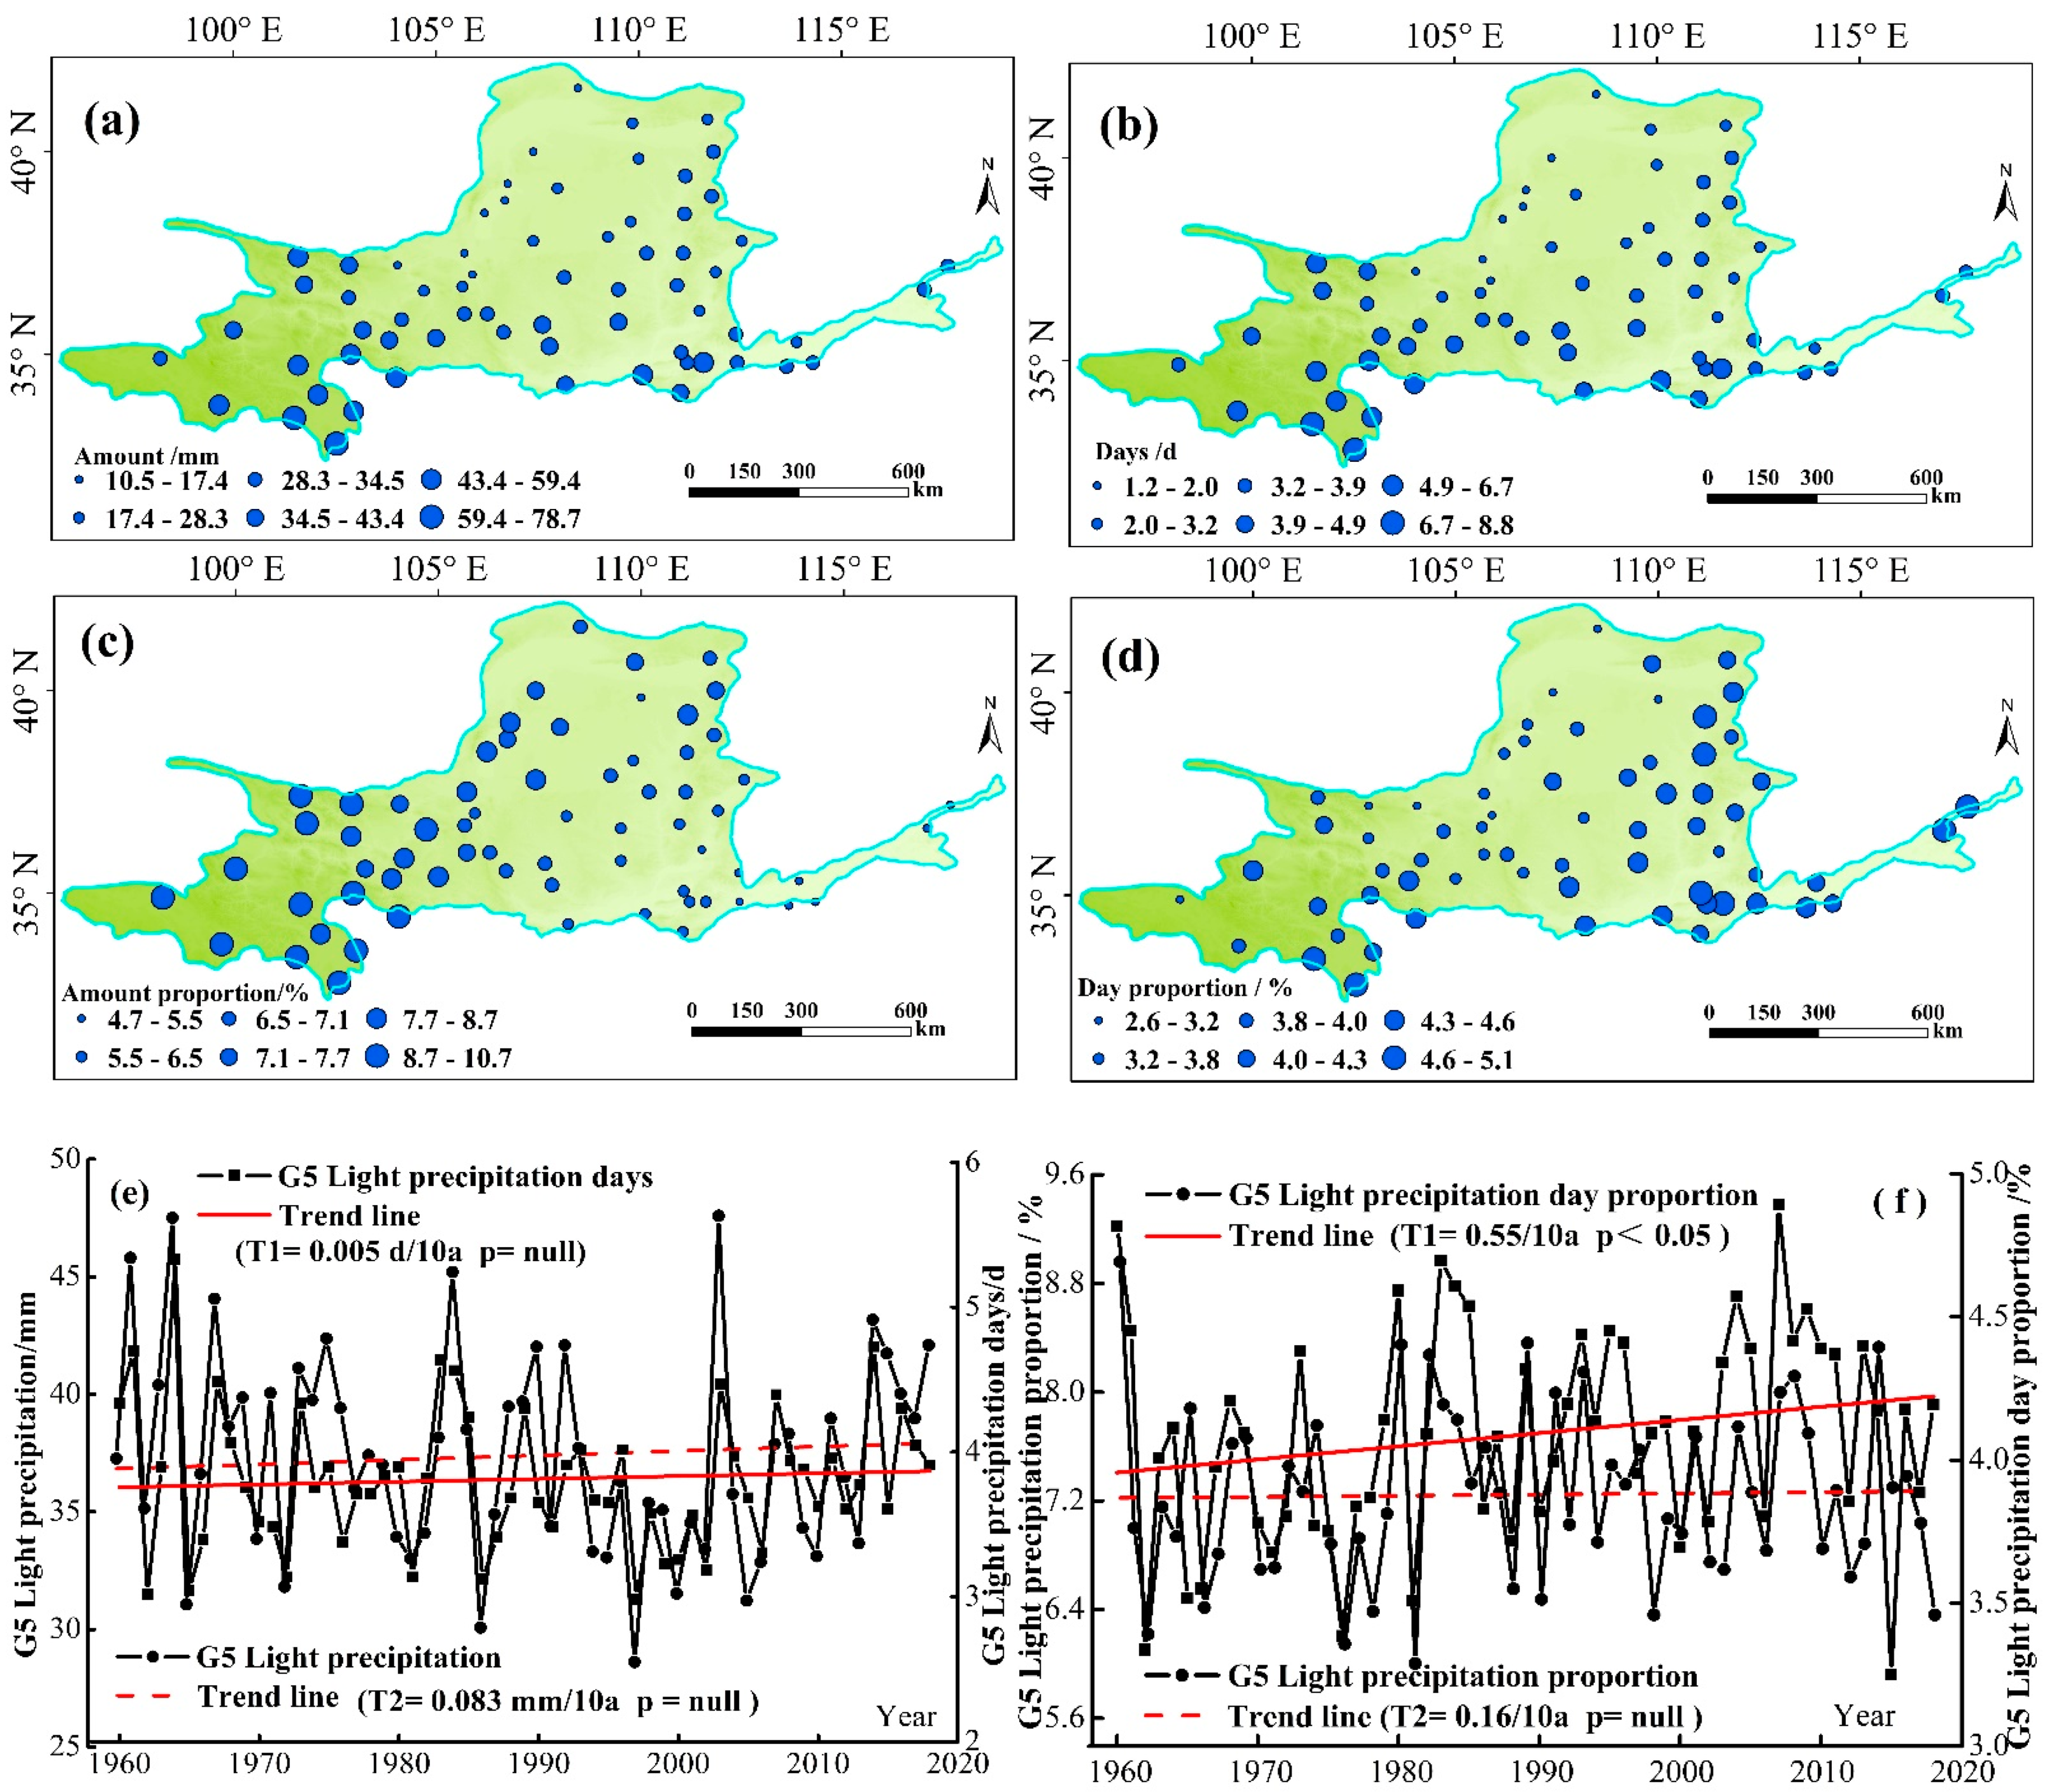
3.2.5. Spatiotemporal Variations in G5 Light Precipitation Events

The spatiotemporal variations in the amounts and days of G5 light precipitation are shown in Figure 8, and these patterns were largely the same as those of G4 (Figure 7a,b). The maximum values for the amounts and days of G5 light precipitation (>59.4 mm and 5 days, respectively) were observed in the southwest and decreased to the north (<17.4 mm and 3 days) of the area. The amount of G5 light precipitation as a proportion of the total precipitation amounts ranged from 5.0 to 10.8% (Figure 8c), while the number of days of G5 light precipitation accounted for more than 4.1% of the total light rain days (Figure 8d). Both the amounts and days of G5 light precipitation slightly increased (not significantly) over the study period, but the magnitudes of inter-annual variations were large (Figure 8e). The amounts of G5 light precipitation as proportions of the total precipitation amounts slightly increased over the study period, whereas the number of G5 days as a proportion of the total precipitation days increased at a rate of 0.55%/decade from 1960 to 2018 (Figure 8f). The annual mean amounts and days of G5 light precipitation (33.9 mm and 4 days, respectively) were roughly the same as those of G4 (37.4 mm and 5 days).

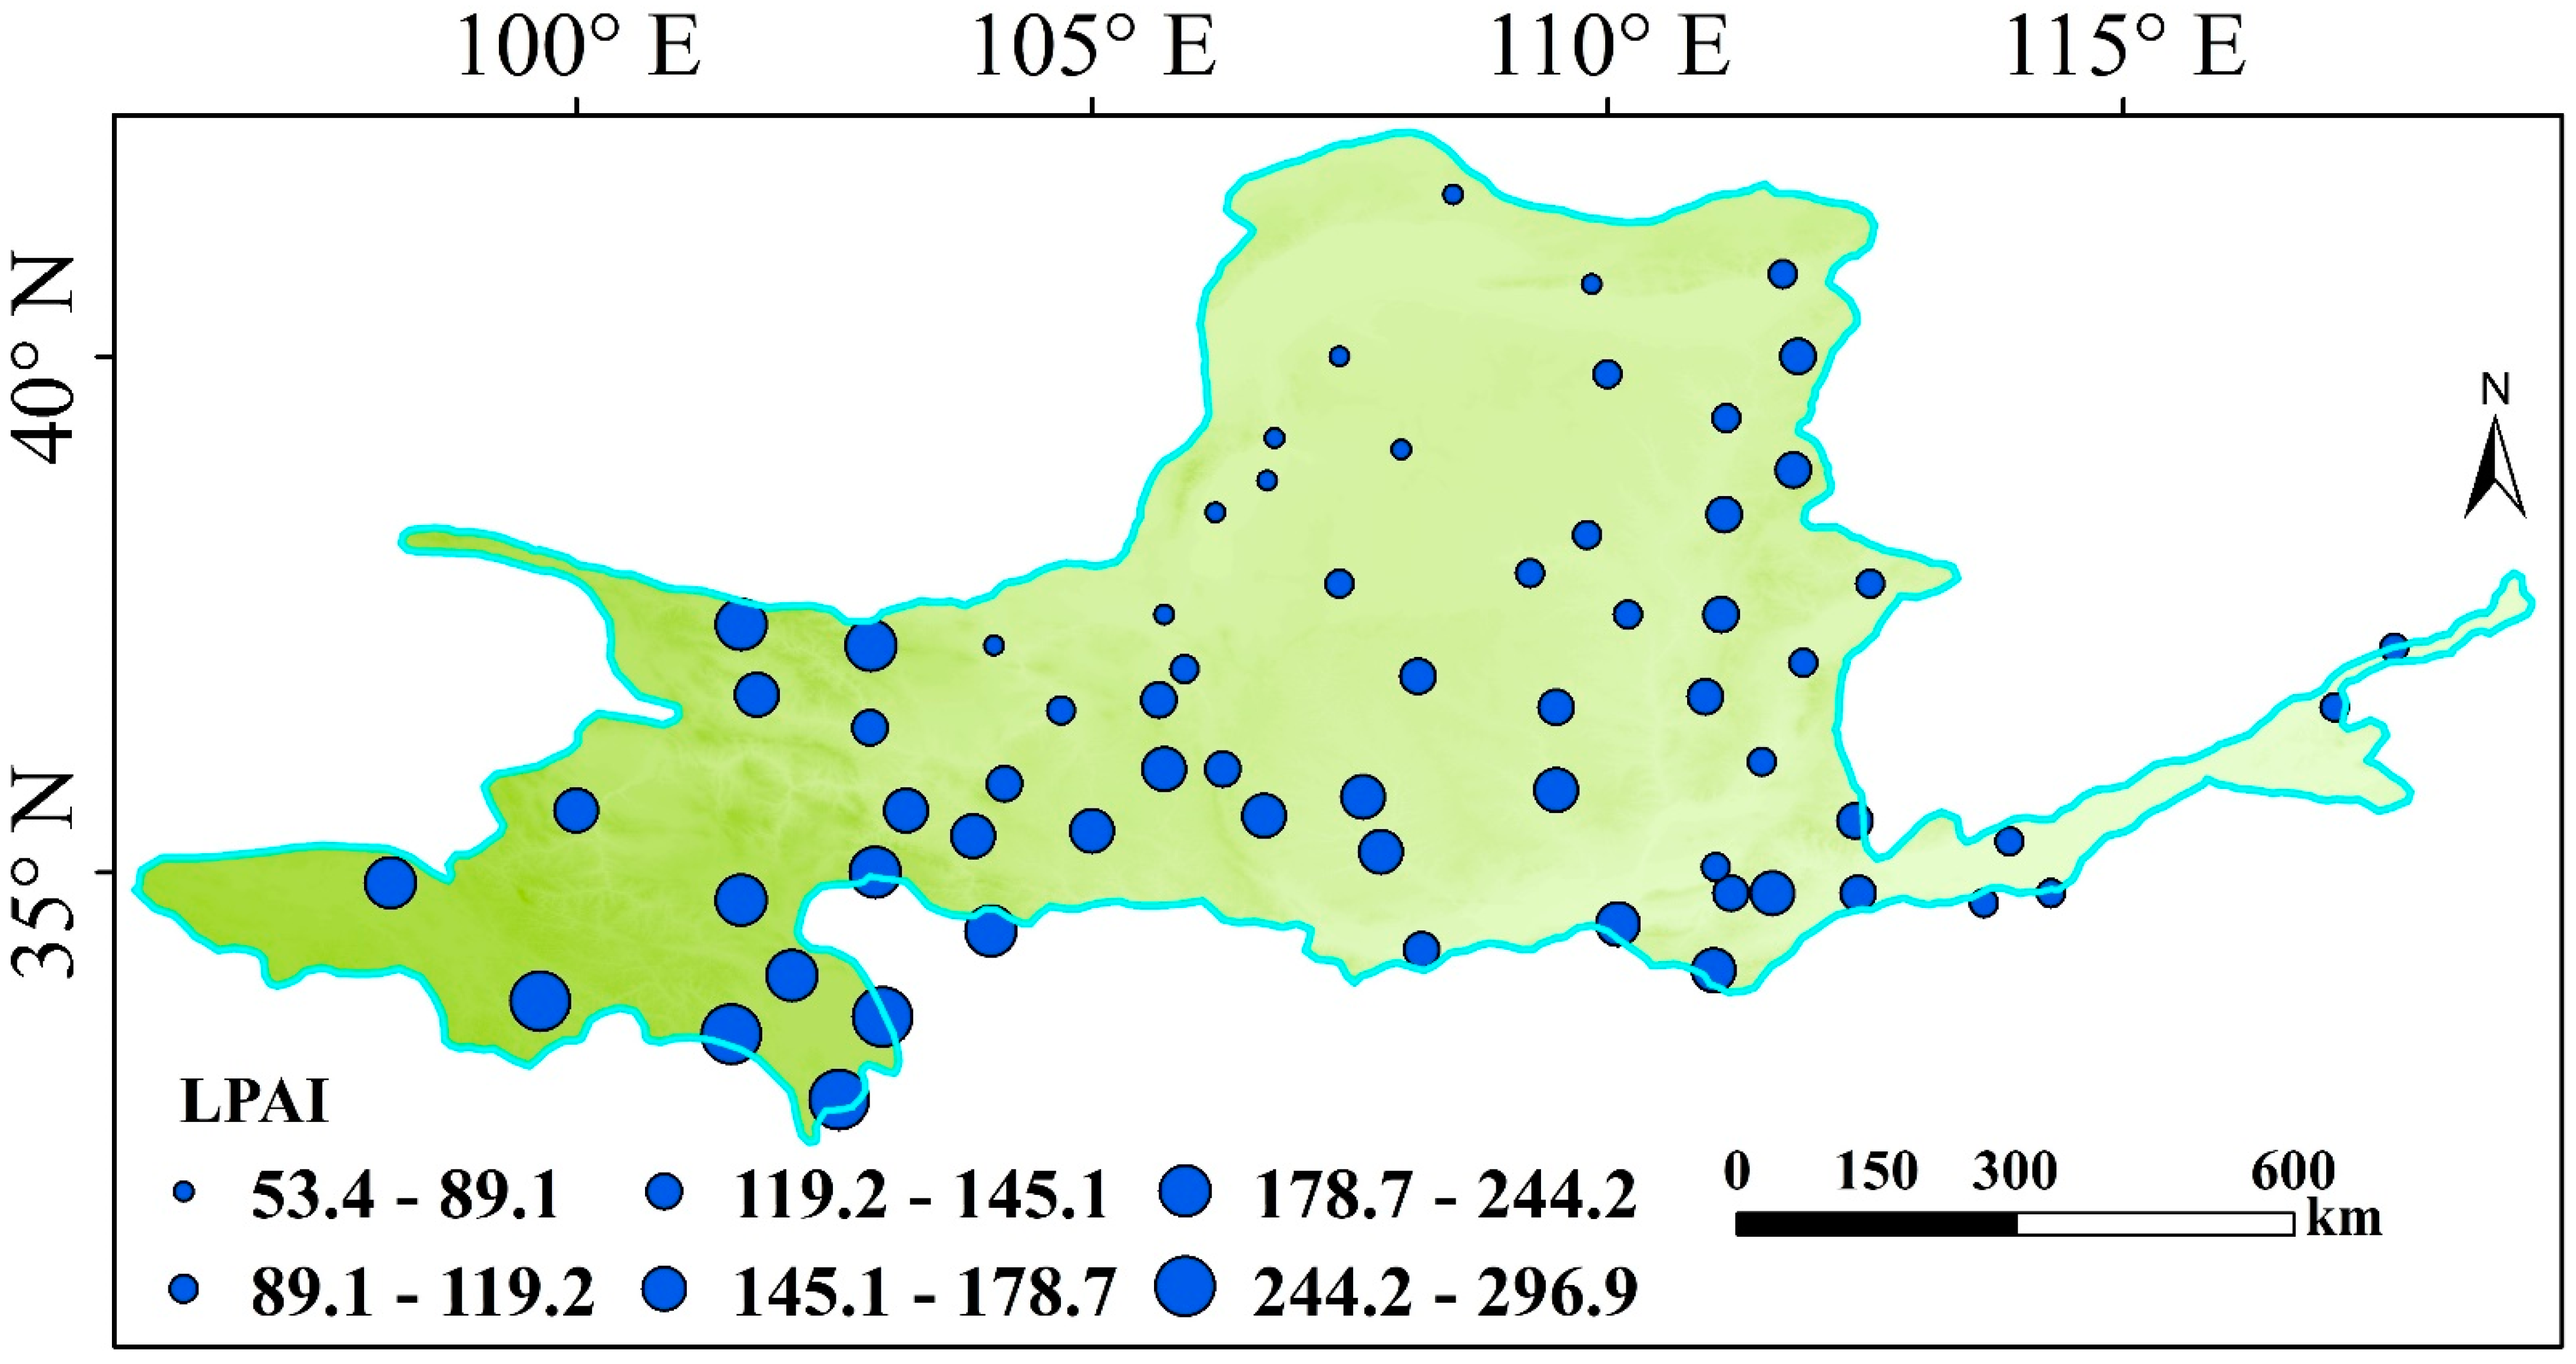
3.3. The Spatial Distribution of the Light Precipitation Assessment Index

To analyze the spatial characteristics of different intensities of the light precipitation events over the YRB, we calculated the light precipitation assessment index (LPAI) for the entire study region. The spatial distributions of the LPAI (Figure 9) were parallel to those of the amounts and days of light rain events (shown in Figure 3a,b), namely, the LPAI declined in a trend from the southwest of the study region to the central and north areas. The LPAI maximum was observed in the southwestern part of the YRB, represented by Jiuzhi in Qinghai, Hongyuan, and Sichuan. The minimum LPAI value was observed in the central region of the YRB, which was represented by Linhe in Inner Mongolia and Huinong in Ningxia. Through spatial analysis of the LPAI, we can more accurately understand that light rain events were more common in the southeast over the YRB compared to the northwest. According to the analysis of the LPAI and the different grades of precipitation, we can conclude that the amount of G1 light precipitation accounted for the least amount (31.0 mm) but the most precipitation days (48 days), which accounted for 48% of the total light precipitation days. The amounts and days of light precipitation from G2 to G5 gradually decreased.

3.4. Mutation Analysis of the Light Precipitation Events

We performed a mutation test analysis to investigate trends for different grades of precipitation (G1–G5) over the YRB from 1960 to 2018 by applying the M-K method with a 0.01 significance level. A mutation in G1 light precipitation occurred in 1988 (Table 1); namely, the G1 light precipitation amount decreased after 1988. Before 1988, the G1 amount was 31.8 mm, and it was 30.5 mm after 1988, thus it reduced by 1.3 mm following mutation (Table 1). A mutation in G2 occurred in 1978. Similarly, mutations in G3–G5 light precipitation occurred in 1986, 1970, and 1987, respectively. Significant differences in mutation for G1–G5 light precipitation across the region led to different levels of reduction (Table 1). The years of abrupt change for G1–G5 light precipitation ranged from 1970 to 1988. These results also manifested that this study area has been sensitive to climate change during recent years.

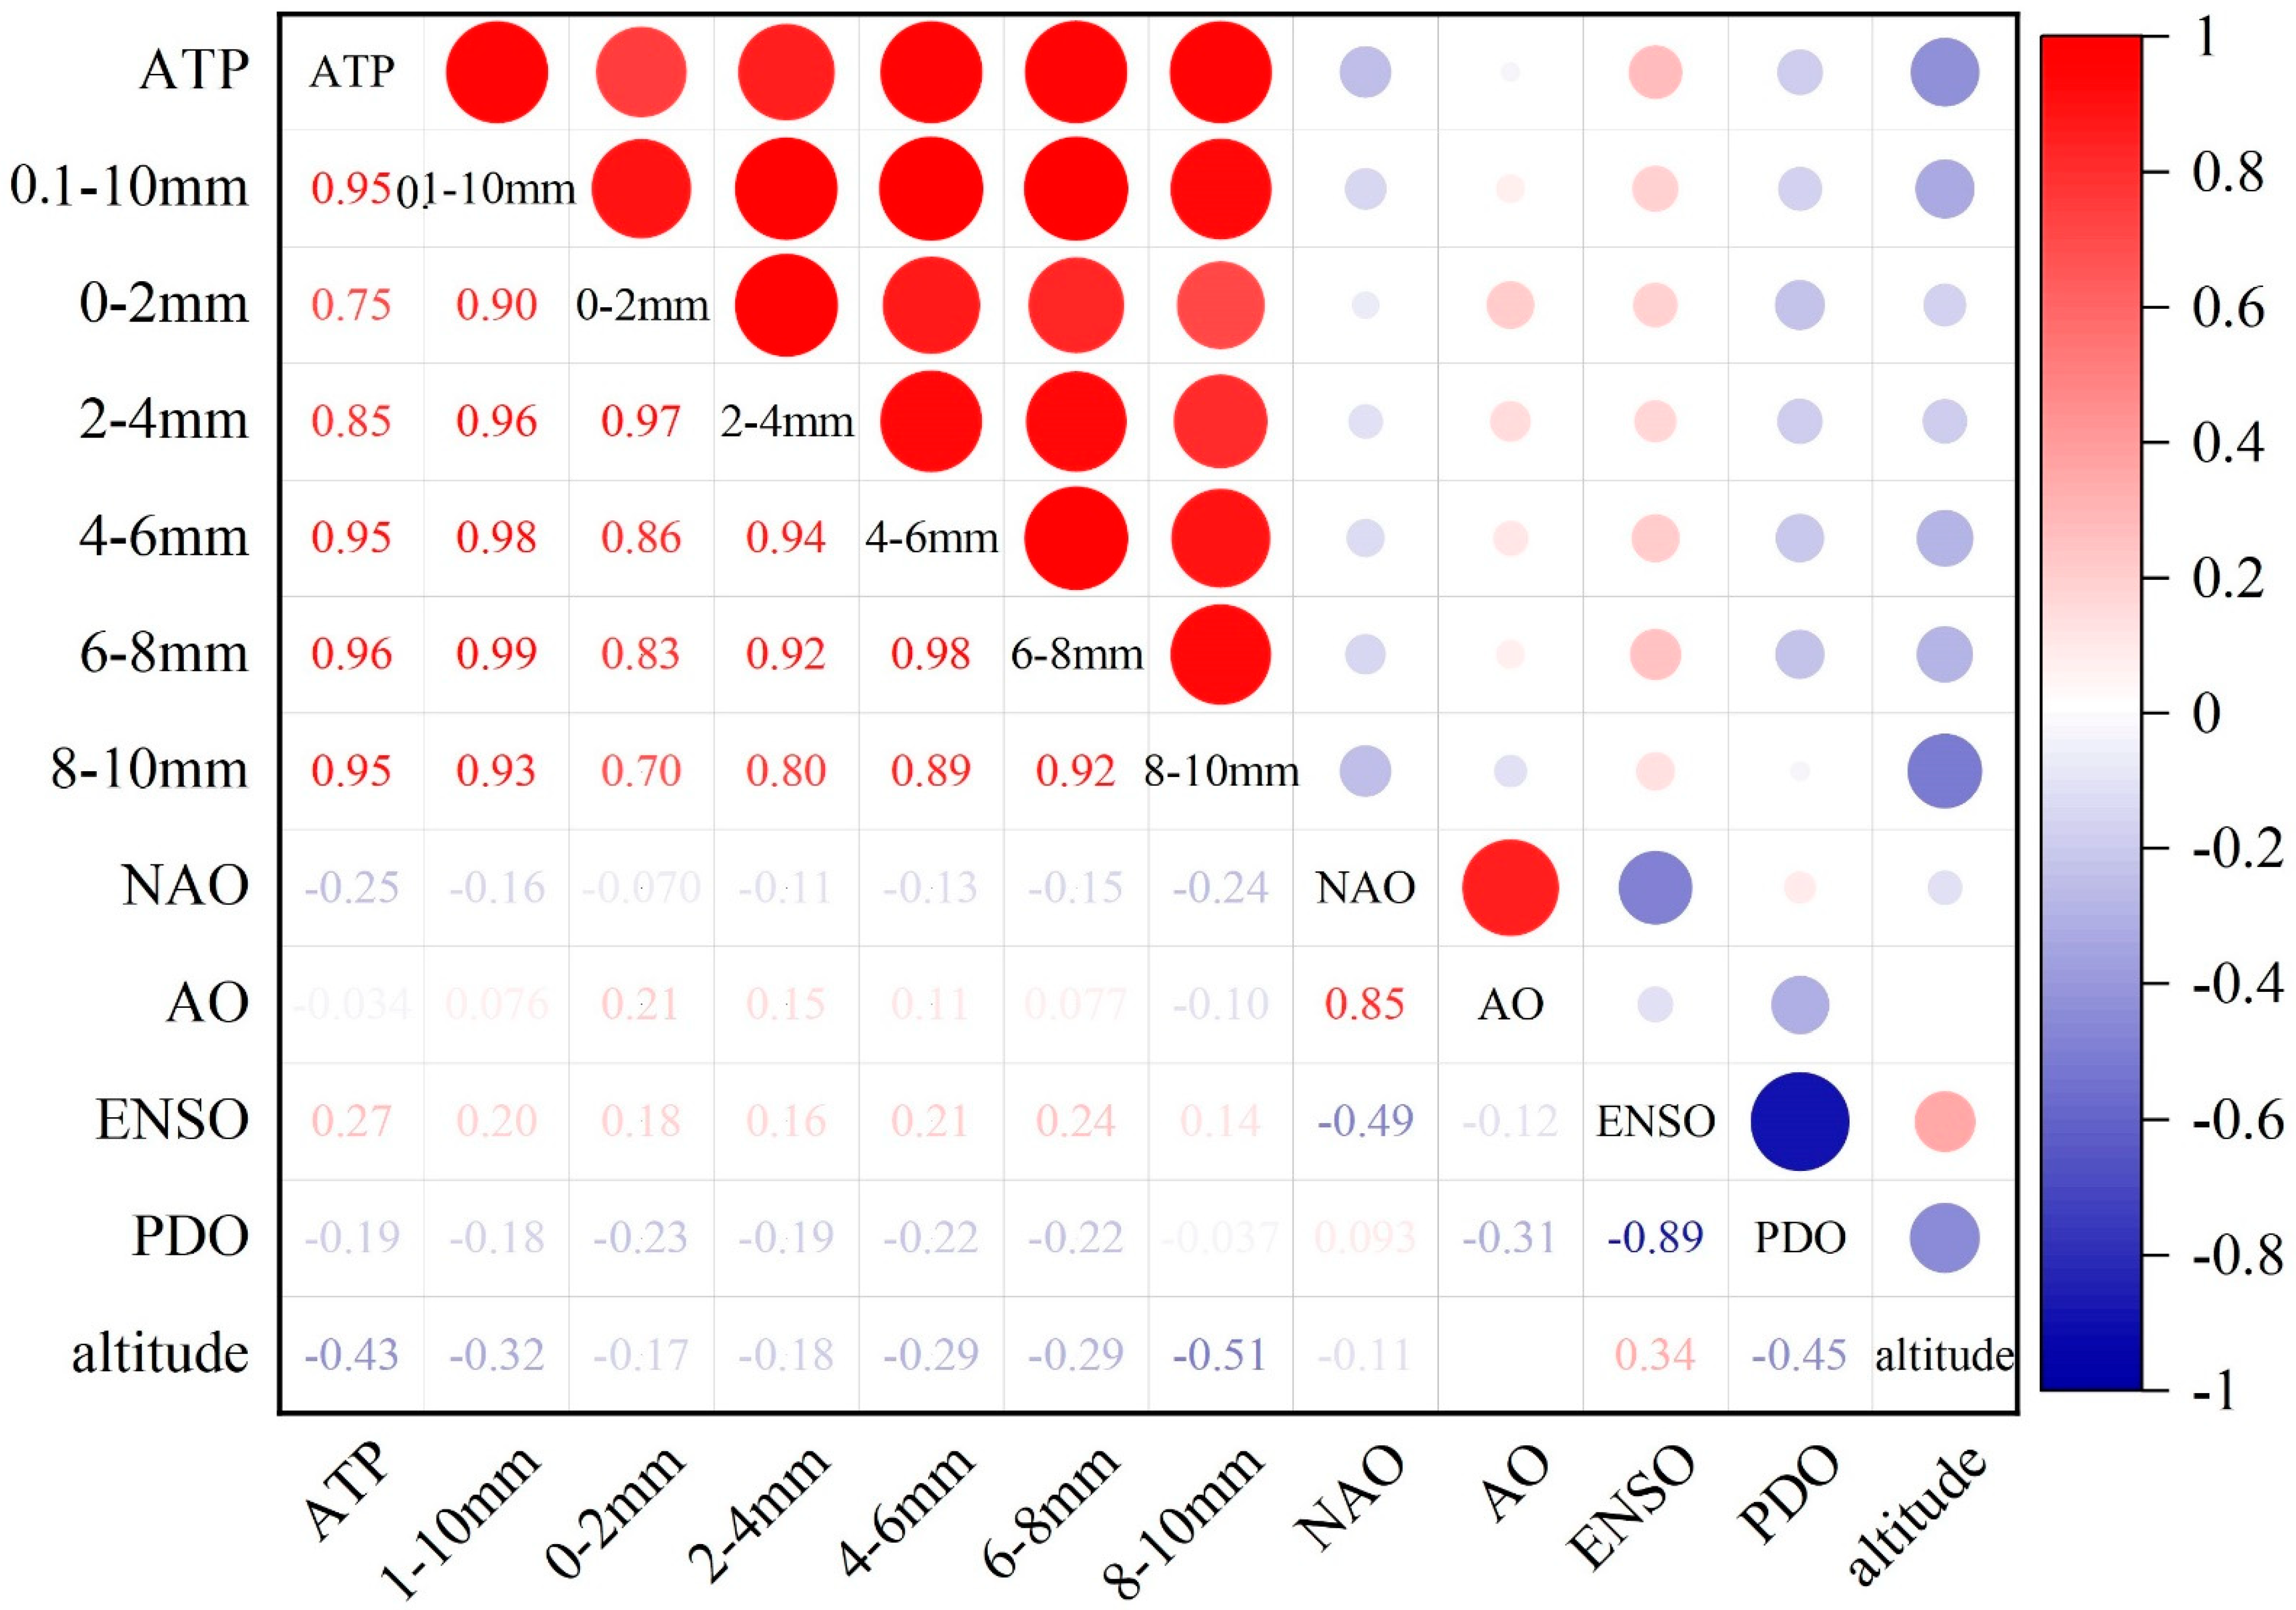
3.5. Relationships between Large-Scale Atmospheric Circulation Patterns, Elevation, and Light Precipitation

Figure 10 shows the correlation coefficients among the four climate indices, elevation, and light precipitation. The G1–G5 categories of light precipitation were significantly (at the 1% level) positively correlated with annual total precipitation (ATP). The NAO and PDO were negatively correlated with ATP, light precipitation (0.1 ≤ P < 10 mm), and G1–G5 light precipitation from 1960 to 2018 and the correlation coefficients of these are not statistically significant. Abnormal development of large-scale atmospheric circulation patterns often leads to abnormal weather phenomena. The ENSO significantly showed positive correlation with ATP, while showing insignificant positive correlations between the ENSO and light precipitation (0.1 ≤ P < 10 mm), and G1–G5 light precipitation. The AO was positively correlated with light precipitation (0.1 ≤ P < 10 mm) and G1–G4 light precipitation during 1960–2018, and negative correlations between the AO and ATP and G5 light precipitation were not significant. The PDO showed negative correlations with light precipitation (0.1 ≤ P < 10 mm) and G1–G5 light precipitation, while showing significant positive correlations between the AO and light precipitation (0.1 ≤ P < 10 mm), and G1–G5 light precipitation. The relationship between G1–G5 light precipitation and the ENSO is closer than that of the NAO and PDO, which implied the contribution of the ENSO is greater than that of the NAO and PDO for the occurrence of G1–G5 light precipitation over the YRB (Figure 10). There were negative correlations between elevation and ATP, light precipitation, and G1–G5 from 1960 to 2018. With increasing elevation, ATP, light precipitation, and G3–G5 light precipitation decreased significantly (p < 0.05), which showed that the decrease in precipitation days mainly occurred at lower altitudes over the YRB. Altitude determines the vertical distribution of energy and water, possibly affecting regional precipitation change [25]. The results also reflect the complexity of regional climate change in the YRB because atmospheric circulations not only lead to the complex variation in precipitation but also change the altitude dependence of rain.

4. Discussion

This study analyzed the spatiotemporal variations in light precipitation events and their connections to large-scale atmospheric circulation patterns (LSACPs, e.g., ENSO, NAO, PDO, and AO) over the whole YRB from 1960 to 2018. There were no significant changes in ATP or light precipitation amounts during 1960–2018 in this basin. By analyzing the ATP, we found a difference in the precipitation between the north and south, and the precipitation also changed from the south to the middle reach of the YRB. Zhang et al. reported that the spatial distributions of the average annual reference evapotranspiration exhibited an increasing trend from southwest to northeast over the YRB [35]. This result is inconsistent with our studies. The southeastern portion of the YRB received more precipitation because it is close to the sea and has low elevation. Dore reported that the increases in precipitation over middle and high latitude land areas in the northern hemisphere have a strong correlation with the increases in total cloud amount [36]. Previous studies also found that total cloud cover, solar irradiance, and air temperature are strongly correlated with changes in light precipitation [14,18]. Although the amount of precipitation contributed by light rain only accounted for 39.2% of total precipitation in this study area, the number of light rain days (0.1 ≤ P < 10 mm/day) accounted for approximately 85.2% of the total number of rainy days. Therefore, we infer that the majority of precipitation events in the study region were light rain events, and the main reason for the decrease in precipitation days was the significant decrease in light rain days. The reasons for this phenomenon are as follows: first, the variation in and complexity of the terrain created different regional climate characteristics, which also resulted in the spatial differences in the ATP and light precipitation events over the YRB. The basin flows through the Qinghai–Tibet Plateau with altitudes of 2000–5000 m, the Loess Plateau with altitudes of 500–2000 m, and the North China Plain; therefore, the underlying surface and topography of the basin are complex [30]. Such complex topographical conditions significantly affect the spatial distribution of light precipitation events in the YRB. Second, the monsoon and Tibetan Plateau influence precipitation processes [37], with further impacts on the transformation of light precipitation events in the YRB.
Comparing the results of the present study with those of previous studies [18,19,23,38], we set the light rain event threshold to 0.1 ≤ P < 10.0 mm/day and found a significant decrease in the amount and number of days of light rain over the study area. However, this threshold of 0.1 ≤ P < 10 mm/day did not accurately reflect the variations in light rain events. To reflect the variation in light precipitation in the YRB more accurately, we divided the threshold into five grades of light precipitation (G1–G5). The G1 light precipitation accounted for only 6.7% of the total amount of precipitation, but the number of days of G1 light rain accounted for more than 51.2% of the total precipitation days. Therefore, we believe that the threshold (0.1 ≤ P < 2 mm/day) is more useful as a light precipitation standard for the YRB. The current study is also in agreement with the research reported by Liu et al. [14]. Furthermore, we investigated possible reasons for variations in light precipitation events and found that altitude and LSACPs (ENSO, AO, NAO, and PDO) exhibited positive and negative correlations with light precipitation events. The whole study area is affected by multiple climate indexes, indicating that the influence of one climate index is always regulated by other climate indexes. We conclude that LSACPs were a possible mechanism for light precipitation events in the past decades. Li et al. found increased precipitation frequency at higher altitudes and a decreasing trend at lower altitudes in Southwest China [39]. Some studies also indicated that the atmospheric circulation change is an important mechanism affecting the heat and moisture transportation in some regions of China [3,39]. The results also reflect the complexity of regional climate change in YBR because atmospheric circulation not only causes the complex variation in precipitation but also changes its altitude dependence. Therefore, it is necessary to analyze the influence of global climate indices on light rain events and to understand and predict the regional response of rain to variations in global climate indices.

5. Conclusions

In this study, we focus on the changes in the characteristics of light precipitation events (0.1 ≤ P < 10 mm/day) over the YRB from 1960 to 2018 and their connections to large-scale atmospheric circulation patterns (LSACPs) and elevation. The amount and days of light precipitation accounted for 39% and 85% of the total precipitation amount and days, respectively. We infer that the majority of precipitation events in the study region were light rain events, and the main reason for the decrease in precipitation days in the study period was due to the significant decrease in light rain days. Therefore, light rain events are potentially an important indicator of climate change in the YRB. We divided light rain into five grades of intensity (G1–G5) using equal interval division and explored the spatiotemporal variations in G1–G5 light precipitation events. The number of G1 (0.1 ≤ P < 2 mm/day) days accounted for 51.2% of the total precipitation days, and the trends of decreasing light rain can be attributed to changes in G1 events because the decline in light rain amounts and days for G1 is more obvious than that of other grades of intensity (G2–G5). Additionally, we investigated possible reasons for the variations in light precipitation events and found that the altitude and climate phenomena (ENSO, AO, NAO, and PDO) were correlated (positively or negatively) with the light precipitation events in the past decades. With increasing elevation, annual total precipitation, light precipitation, and G3–G5 light precipitation decreased significantly (p < 0.05), which showed that the decrease in precipitation days mainly occurred at lower altitudes over the YRB. Thus, changes in light precipitation events appear to be complex and may be related to global atmospheric characteristics and altitude. The results of this study have considerable and significant implications for water resource planning, disaster preparedness, and the mitigation of risk regarding droughts or floods in the study area.

Author Contributions

Material preparation, data collection, and analysis were performed by K.Z., Y.J. and J.P., K.Z. and Y.J. contributed to the study conception and design. The first draft of the manuscript was written by H.Z. and J.P. All authors have read and agreed to the published version of the manuscript.

Funding

This work was jointly supported by (1) the National Natural Science Foundation of China (42163001), (2) the Science & Technology Planning Projects of Guizhou Province (Qian-Kehe-Jichu-zk [2021]-Yiban189), and (3) the Science & Technology of Young Talents Development Project of Higher Institutions in Guizhou Province (Qian-Jiaohe-KY [2021]139).

Institutional Review Board Statement

Not applicable.

Informed Consent Statement

Not applicable.

Data Availability Statement

The data are not publicly available due to the confidentiality of the research projects.

Conflicts of Interest

The authors declare no conflict of interest.

References

  1. Mohammadi, B.; Vaheddoost, B.; Mehr, A.D. A spatiotemporal teleconnection study between Peruvian precipitation and oceanic oscillations. Quat. Int. 2020, 565, 1–11. [Google Scholar] [CrossRef]
  2. IPCC. Climate Change 2021: The Physical Science Basis. Contribution of Working Group I to the Sixth Assessment Report of the Intergovernmental Panel on Climate Change; Cambridge Press: Cambridge, UK, 2021. [Google Scholar]
  3. Guan, Y.; Zheng, F.; Zhang, X.; Wang, B. Trends and variability of daily precipitation and extremes during 1960–2012 in the Yangtze River Basin, China. Int. J. Clim. 2017, 37, 1282–1298. [Google Scholar] [CrossRef]
  4. Bettolli, M.L.; Solman, S.A.; da Rocha, R.P.; Llopart, M.; Gutierrez, J.M.; Fernández, J.; Olmo, M.E.; Lavin-Gullon, A.; Chou, S.C.; Rodrigues, D.C.; et al. The CORDEX Flagship Pilot Study in southeastern South America: A comparative study of statistical and dynamical downscaling models in simulating daily extreme precipitation events. Clim. Dyn. 2021, 56, 1589–1608. [Google Scholar] [CrossRef]
  5. Groisman, P.Y.; Bulygina, O.N.; Yin, X.; Vose, R.S.; Gulev, S.K.; Hanssen-Bauer, I.; Førland, E. Recent changes in the frequency of freezing precipitation in North America and Northern Eurasia. Environ. Res. Lett. 2016, 11, 045007. [Google Scholar] [CrossRef]
  6. Ye, H.; Fetzer, E.J.; Wong, S.; Lambrigtsen, B.H. Rapid decadal convective precipitation increase over Eurasia during the last three decades of the 20th century. Sci. Adv. 2017, 3, e1600944. [Google Scholar] [CrossRef] [Green Version]
  7. Chernokulsky, A.; Kozlov, F.; Zolina, O.; Bulygina, O.N.; Mokhov, I.I.; Semenov, V.A. Observed changes in convective and stratiform precipitation in Northern Eurasia over the last five decades. Environ. Res. Lett. 2019, 14, 045001. [Google Scholar] [CrossRef]
  8. Wen, G.; Huang, G.; Hu, K.; Qu, X.; Tao, W.; Gong, H. Changes in the characteristics of precipitation over northern Eurasia. Arch. Meteorol. Geophys. Bioclimatol. Ser. B 2014, 119, 653–665. [Google Scholar] [CrossRef]
  9. Wen, G.; Huang, G.; Tao, W.; Liu, C. Observed trends in light precipitation events over global land during 1961–2010. Arch. Meteorol. Geophys. Bioclimatol. Ser. B 2016, 125, 161–173. [Google Scholar] [CrossRef]
  10. Liu, B.; Xu, M.; Henderson, M.; Qi, Y. Observed trends of precipitation amount, frequency, and intensity in China, 1960–2000. J. Geophys. Res. Atmos. 2005, 110, D08103. [Google Scholar] [CrossRef]
  11. Wu, J.; Zhang, L.; Zhao, D.; Tang, J. Impacts of warming and water vapor content on the decrease in light rain days during the warm season over eastern China. Clim. Dyn. 2015, 45, 1841–1857. [Google Scholar] [CrossRef]
  12. Fu, J.; Qian, W.; Lin, X.; Chen, D. Trends in graded precipitation in China from 1961 to 2000. Adv. Atmos. Sci. 2008, 25, 267–278. [Google Scholar] [CrossRef]
  13. Michaels, P.J.; Knappenberger, P.C.; Frauenfeld, O.W.; Davis, R.E. Trends in precipitation on the wettest days of the year across the contiguous USA. Int. J. Clim. 2004, 24, 1873–1882. [Google Scholar] [CrossRef]
  14. Liu, B.; Xu, M.; Henderson, M. Where have all the showers gone? Regional declines in light precipitation events in China, 1960–2000. Int. J. Clim. 2011, 31, 1177–1191. [Google Scholar] [CrossRef]
  15. Wu, J.; Ling, C.; Zhao, D.; Zhao, B. A counterexample of aerosol suppressing light rain in Southwest China during 1951–2011. Atmos. Sci. Lett. 2016, 17, 487–491. [Google Scholar] [CrossRef]
  16. Jiang, Z.; Shen, Y.; Ma, T.; Zhai, P.; Fang, S. Changes of precipitation intensity spectra in different regions of mainland China during 1961–2006. J. Meteorol. Res. 2014, 28, 1085–1098. [Google Scholar] [CrossRef]
  17. Fu, C.; Dan, L. Trends in the different grades of precipitation over South China during 1960–2010 and the possible link with anthropogenic aerosols. Adv. Atmos. Sci. 2014, 31, 480–491. [Google Scholar] [CrossRef]
  18. Wu, J.; Zhang, L.; Gao, Y.; Zhao, D.; Zha, J.; Yang, Q. Impacts of cloud cover on long-term changes in light rain in Eastern China. Int. J. Clim. 2017, 37, 4409–4416. [Google Scholar] [CrossRef]
  19. Li, K.F.; Cao, L.G.; Zhou, Z.C.; Jiao, L.; Wang, N.; Liu, R. Characteristics and Cause Analysis of Variations in Light Precipitation Events in the Central and Eastern Tibetan Plateau, China, During 1961–2019. Chin. Geogr. Sci. 2022, 32, 155–173. [Google Scholar] [CrossRef]
  20. Qian, Y.; Gong, D.; Leung, R. Light rain events change over North America, Europe, and Asia for 1973–2009. Atmos. Sci. Lett. 2010, 11, 301–306. [Google Scholar] [CrossRef]
  21. Huang, G.; Wen, G. Spatial and temporal variations of light rain events over China and the mid-high latitudes of the Northern Hemisphere. Chin. Sci. Bull. 2013, 58, 1402–1411. [Google Scholar] [CrossRef] [Green Version]
  22. Qian, Y.; Gong, D.Y.; Fan, J.W.; Leung, L.R.; Bennartz, R.; Chen, D.; Wang, W. Heavy pollution suppresses light rain in China: Observations and modeling. J. Geophys. Res. Atmos. 2009, 114, D00K02. [Google Scholar] [CrossRef]
  23. Zhang, Y.; Liu, C.; You, Q.; Chen, C.; Xie, W.; Ye, Z.; Li, X.; He, Q. Decrease in light precipitation events in Huai River Eco-economic Corridor, a climate transitional zone in eastern China. Atmos. Res. 2019, 226, 240–254. [Google Scholar] [CrossRef]
  24. Deng, Y.; Jiang, W.; He, B.; Chen, Z.; Jia, K. Change in Intensity and Frequency of Extreme Precipitation and its Possible Teleconnection with Large-Scale Climate Index Over the China from 1960 to 2015. J. Geophys. Res. Atmos. 2018, 123, 2068–2081. [Google Scholar] [CrossRef]
  25. Zhang, K.; Yao, Y.; Qian, X.; Wang, J. Various characteristics of precipitation concentration index and its cause analysis in China between 1960 and 2016. Int. J. Clim. 2019, 39, 4648–4658. [Google Scholar] [CrossRef]
  26. Xiao, M.; Zhang, Q.; Singh, V.P. Spatiotemporal variations of extreme precipitation regimes during 1961-2010 and possible teleconnections with climate indices across China. Int. J. Clim. 2017, 37, 468–479. [Google Scholar] [CrossRef]
  27. Xiao, M.; Zhang, Q.; Singh, V.P. Influences of ENSO, NAO, IOD and PDO on seasonal precipitation regimes in the Yangtze River basin, China. Int. J. Clim. 2015, 35, 3556–3567. [Google Scholar] [CrossRef]
  28. Zhang, K.; Dai, S.; Dong, X. Dynamic Variability in Daily Temperature Extremes and Their Relationships with Large-scale Atmospheric Circulation during 1960–2015 in Xinjiang, China. Chin. Geogr. Sci. 2020, 30, 233–248. [Google Scholar] [CrossRef] [Green Version]
  29. Yang, D.; Li, C.; Hu, H.; Lei, Z.; Yang, S.; Kusuda, T.; Koike, T.; Musiake, K. Analysis of water resources variability in the Yellow River of China during the last half century using historical data. Water Resour. Res. 2004, 40, W06502. [Google Scholar] [CrossRef]
  30. Wang, L.; Zhang, J.; Shu, Z.; Wang, Y.; Bao, Z.; Liu, C.; Zhou, X.; Wang, G. Evaluation of the Ability of CMIP6 Global Climate Models to Simulate Precipitation in the Yellow River Basin, China. Front. Earth Sci. 2021, 9, 751974. [Google Scholar] [CrossRef]
  31. Kexin, Z.; Xiaogang, D.; Jiaoting, P.; Zhihua, S.; Yanhong, Z. Analysis of changes in thermal growing season and their relationships with atmospheric teleconnection patterns for the Yellow River basin in China. Phys. Geogr. 2021, 42, 183–198. [Google Scholar] [CrossRef]
  32. Mehr, A.D.; Hrnjica, B.; Bonacci, O.; Haghighi, A.T. Innovative and successive average trend analysis of temperature and precipitation in Osijek, Croatia. Arch. Meteorol. Geophys. Bioclimatol. Ser. B 2021, 145, 875–890. [Google Scholar] [CrossRef]
  33. Villarini, G.; Smith, J.A.; Vecchi, G. Changing Frequency of Heavy Rainfall over the Central United States. J. Clim. 2013, 26, 351–357. [Google Scholar] [CrossRef]
  34. Liu, Y.; Tang, X.; Sun, Z.; Zhang, J.; Wang, G.; Jin, J.; Wang, G. Spatiotemporal precipitation variability and potential drivers during 1961–2015 over the Yellow River Basin, China. Weather 2019, 74, S32–S39. [Google Scholar] [CrossRef] [Green Version]
  35. Zhang, K.-X.; Pan, S.-M.; Zhang, W.; Xu, Y.-H.; Cao, L.-G.; Hao, Y.-P.; Wang, Y. Influence of climate change on reference evapotranspiration and aridity index and their temporal-spatial variations in the Yellow River Basin, China, from 1961 to 2012. Quat. Int. 2015, 380–381, 75–82. [Google Scholar] [CrossRef]
  36. Dore, M.H. Climate change and changes in global precipitation patterns: What do we know? Environ. Int. 2005, 31, 1167–1181. [Google Scholar] [CrossRef]
  37. Liu, Q.; Yang, Z.; Cui, B. Spatial and temporal variability of annual precipitation during 1961–2006 in Yellow River Basin, China. J. Hydrol. 2008, 361, 330–338. [Google Scholar] [CrossRef]
  38. Qian, W.; Fu, J.; Yan, Z. Decrease of light rain events in summer associated with a warming environment in China during 1961–2005. Geophys. Res. Lett. 2007, 34, L11705. [Google Scholar] [CrossRef]
  39. Zongxing, L.; He, Y.; Wang, P.; Theakstone, W.H.; An, W.; Wang, X.; Lu, A.; Zhang, W.; Cao, W. Changes of daily climate extremes in southwestern China during 1961–2008. Glob. Planet. Chang. 2012, 80–81, 255–272. [Google Scholar] [CrossRef]
Figure 1. Spatial distribution of meteorological stations on a digital elevation model in YRB, China.
Sustainability 14 06969 g001
Figure 2. Spatiotemporal variations in the average annual total precipitation and precipitation days over the YRB from 1960 to 2018. (a) Annual average precipitation, (b) annual average precipitation days, (c) inter-annual variation in precipitation amount, and (d) inter-annual variation in precipitation days.
Sustainability 14 06969 g002
Figure 3. Spatiotemporal variations in the mean annual amount of light precipitation and mean number of light precipitation days from 1960 to 2018 in the YRB, (a) light precipitation amounts, (b) light precipitation days, (c) amount of light precipitation as a proportion of total precipitation, (d) number of light precipitation days as a proportion of total precipitation days, (e) trends in annual light precipitation amounts and days, and (f) trends in annual amounts and days of light precipitation as proportion of total precipitation amounts and days.
Sustainability 14 06969 g003
Figure 4. Spatiotemporal variations in G1 (0.1 ≤ P < 2.0 mm/day) light precipitation events from 1960 to 2018 in the YRB, (a) annual G1 light precipitation amounts, (b) annual number of G1 light precipitation days, (c) amount of G1 light precipitation as a proportion of total precipitation, (d) number of G1 light precipitation days as a proportion of total precipitation days, (e) trends in annual G1 light precipitation amounts and days, and (f) trends in annual amounts and days of G1 light precipitation as proportions of the total precipitation amounts and days.
Sustainability 14 06969 g004
Figure 5. Spatiotemporal variations in G2 light precipitation events (2.0 ≤ P < 4.0 mm/day) from 1960 to 2018 in the YRB, (a) annual G2 light precipitation amounts, (b) annual number of G2 light precipitation days, (c) amount of G2 light precipitation amount as a proportion of total precipitation, (d) number of G2 light precipitation days as a proportion of total precipitation days, (e) trends in annual G2 light precipitation amounts and days, and (f) trends in annual amounts and days of G2 light precipitation as proportions of total precipitation amounts and days.
Sustainability 14 06969 g005
Figure 6. Spatiotemporal variations in G3 (4.0 ≤ P < 6.0 mm/day) light precipitation events from 1960 to 2018 in the YRB, (a) annual amounts of G3 light precipitation, (b) annual number of G3 light precipitation days, (c) amount of G3 light precipitation amount as a proportion of total precipitation, (d) number of G3 light precipitation days as a proportion of total precipitation days, (e) trends in annual G3 light precipitation amounts and days, and (f) trends in amounts and days of G3 light precipitation as proportions of total precipitation amounts and days.
Sustainability 14 06969 g006aSustainability 14 06969 g006b
Figure 7. Spatiotemporal variations in G4 (6.0 ≤ P < 8.0 mm/day) light precipitation events from 1960 to 2018 in the YRB, (a) annual amounts of G4 light precipitation, (b) annual number of G4 light precipitation days, (c) amount of G4 light precipitation as a proportion of total precipitation, (d) number of G4 light precipitation days as a proportion of total precipitation days, (e) trends in annual G4 light precipitation amounts and days, and (f) trends in amounts and days of G4 light precipitation as proportions of total precipitation amounts and days.
Sustainability 14 06969 g007
Figure 8. Spatiotemporal variations in G5 (8.0 ≤ P < 10.0 mm/day) light precipitation events from 1960 to 2018 in the YRB, (a) annual amounts of G5 light precipitation, (b) annual number of G5 light precipitation days, (c) amount of G5 light precipitation as a proportion of total precipitation, (d) number of G5 light precipitation days as a proportion of total precipitation days, (e) trends in annual G5 light precipitation amounts and days, and (f) trends in amounts and days of G5 light precipitation as annual proportions of total precipitation amounts and days.
Sustainability 14 06969 g008
Figure 9. Spatial patterns of the light precipitation assessment index over the YRB.
Sustainability 14 06969 g009
Figure 10. Correlations among large-scale atmospheric circulation patterns, elevation, and light precipitation over YRB.
Sustainability 14 06969 g010
Table 1. Mutations in the light precipitation and differences in the before and after abrupt change over YRB.
GradeAbrupt Change
Year
Before
Abrupt Change
After
Abrupt Change
Differences of the
before and after
Abrupt Change
G1198831.830.51.3
G2197842.139.82.4
G3198640.639.31.3
G4197039.137.02.1
G5198734.233.70.5
Publisher’s Note: MDPI stays neutral with regard to jurisdictional claims in published maps and institutional affiliations.

