
Spatial–Temporal Variations of Water Ecosystem Services Value and Its Influencing Factors: A Case in Typical Regions of the Central Loess Plateau


Abstract
:1. Introduction
- (1)
- Combining the environmental economics method and the equivalent factor method, the WESVs of 25 counties (districts) in the study area including groundwater and surface water in 2010, 2015 and 2020 were calculated, and the distribution characteristics were analyzed;
- (2)
- Selecting the representative factors of nature, economy and society, and the applicability of OLS model and GWR model in studying the impact of each indicator on WESV was analyzed;
- (3)
- Using the more applicable GWR model, the spatial heterogeneity and spatial and temporal distribution of the effects of various factors on WESV were shown.
2. Materials and Methods
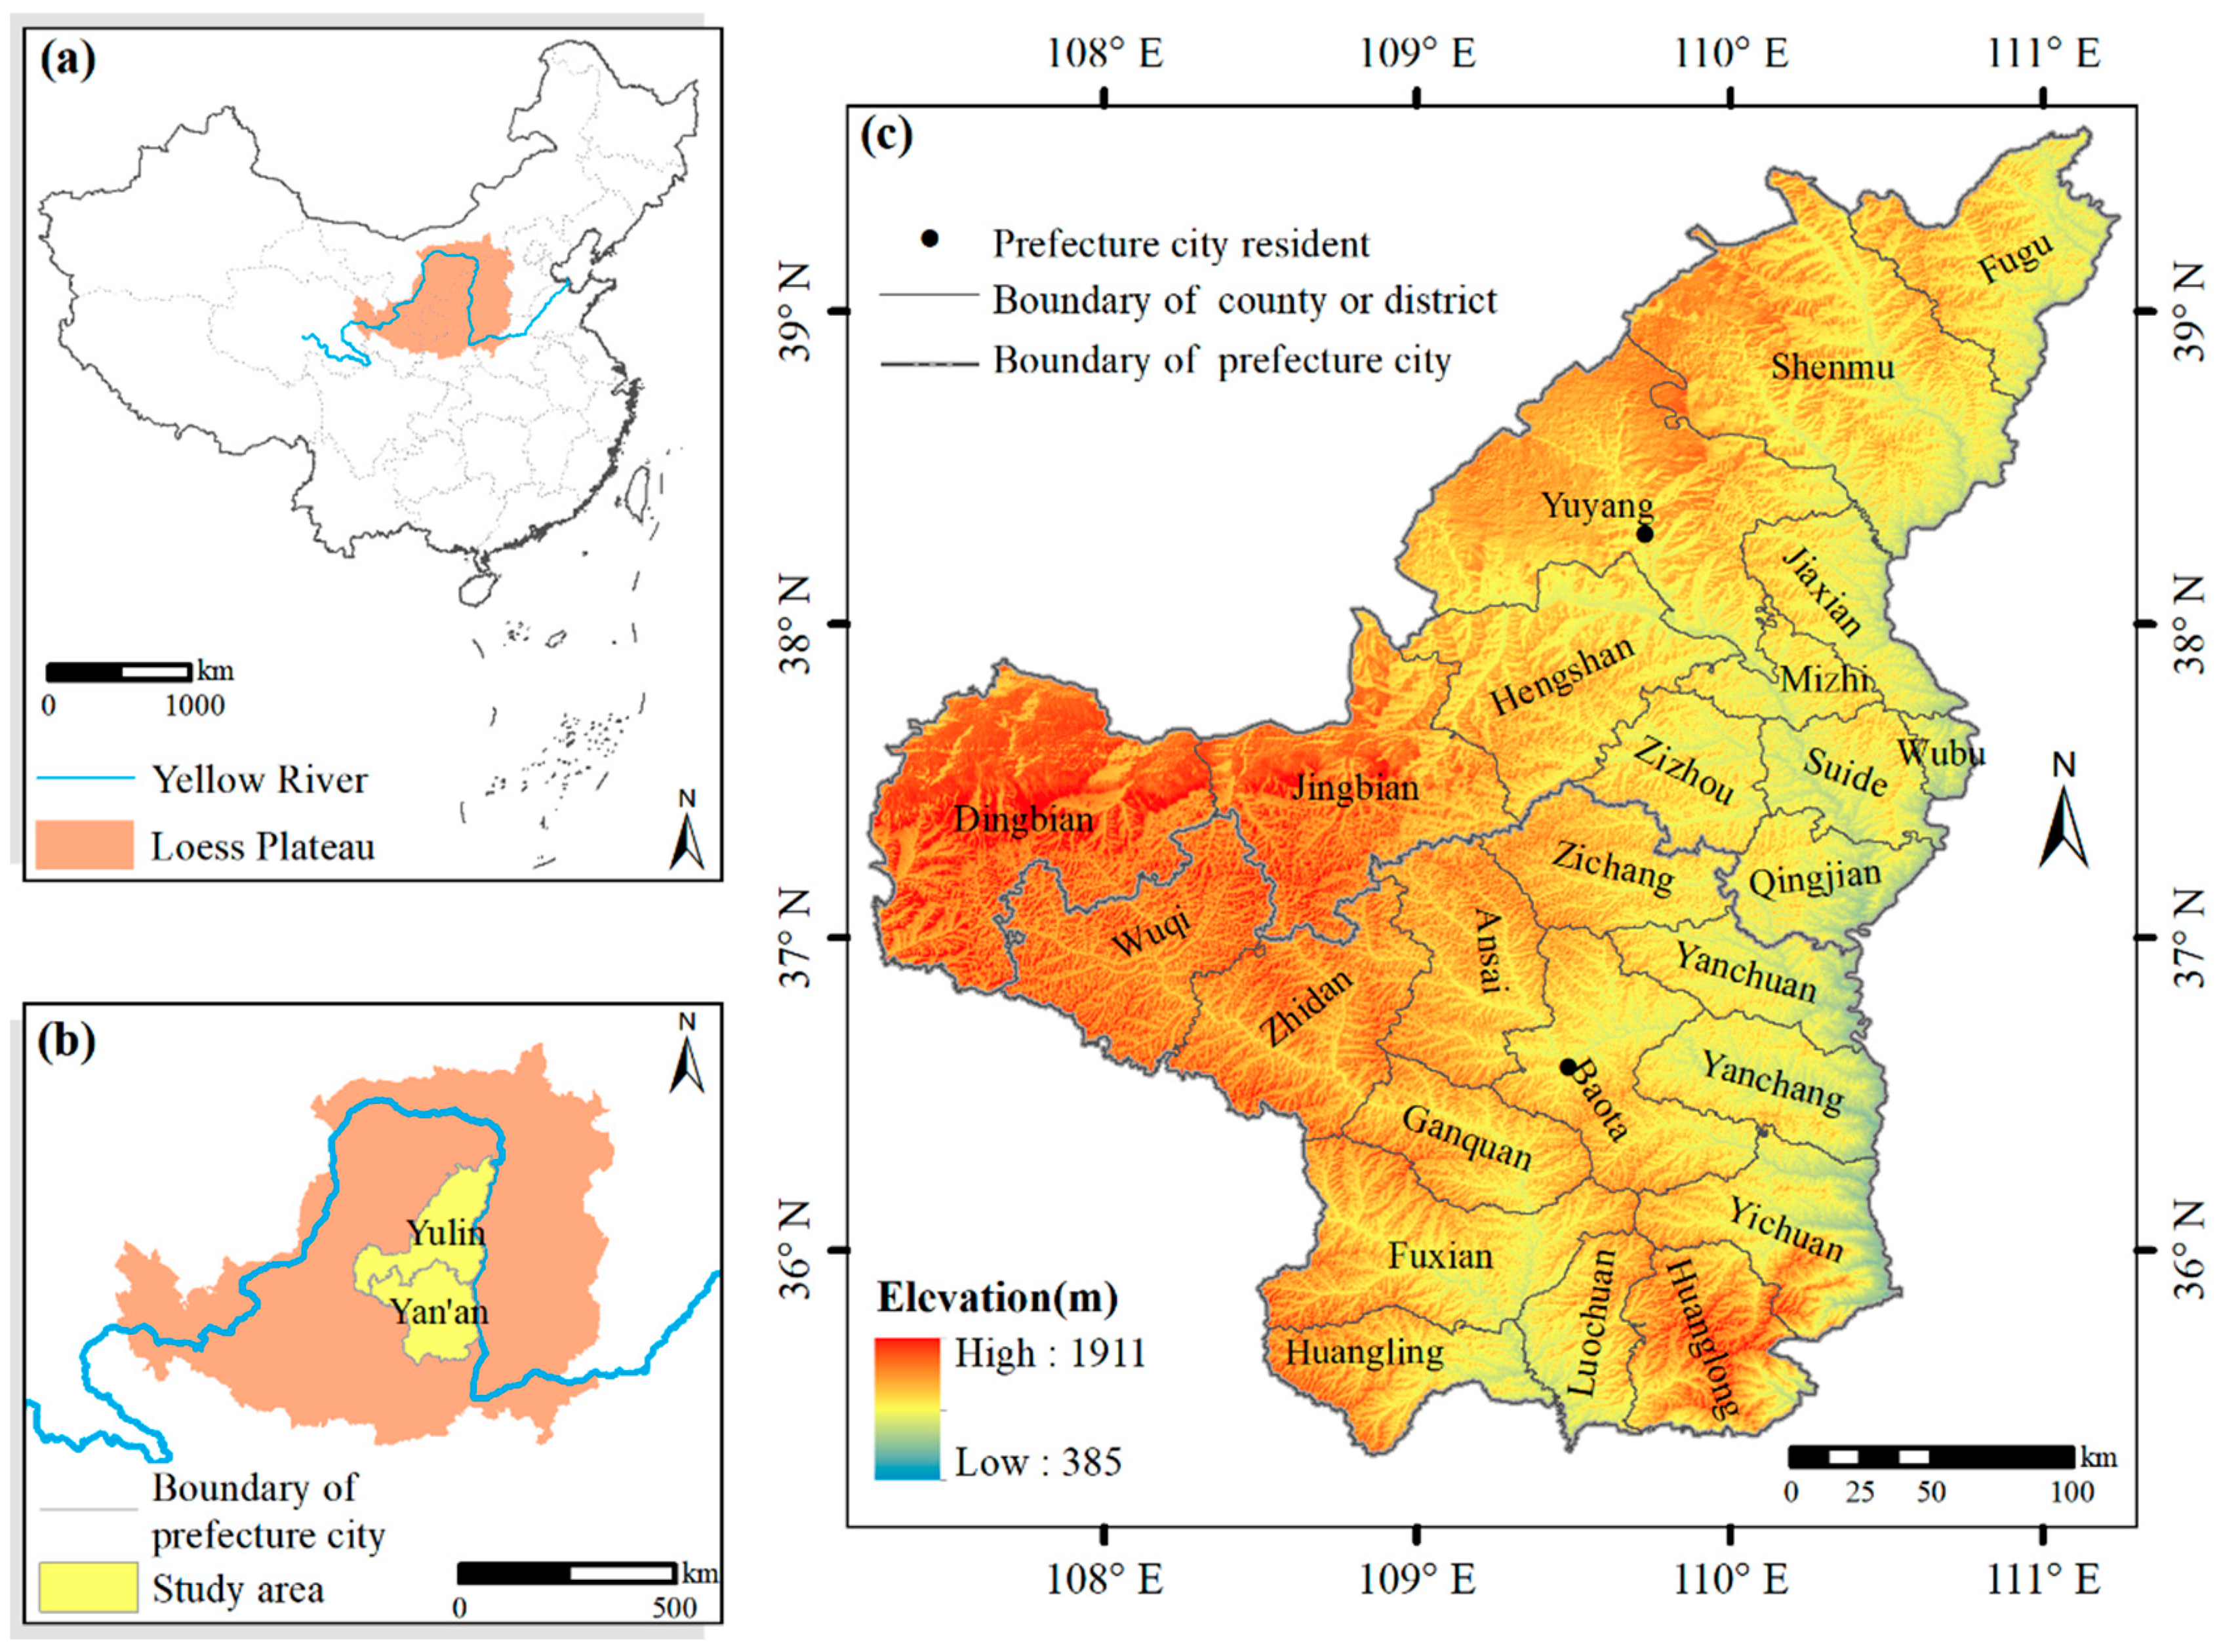
2.1. Study Area
2.2. Data Sources
2.3. Methods
2.3.1. Classification and Calculation Method of WESV
2.3.2. Market Value Method
2.3.3. Equivalent Factor Method
2.3.4. Geographically Weighted Regression
3. Results
3.1. WESVs and Characteristics in 2010–2020
3.1.1. Temporal and Spatial Variation Analysis of WESV
3.1.2. Variation Analysis of WESV Structural Characteristics
3.2. Analysis of Spatial Heterogeneity Characteristics of Each Impact Factor
3.2.1. Identification of Influencing Factors
3.2.2. Effect of the GWR Model
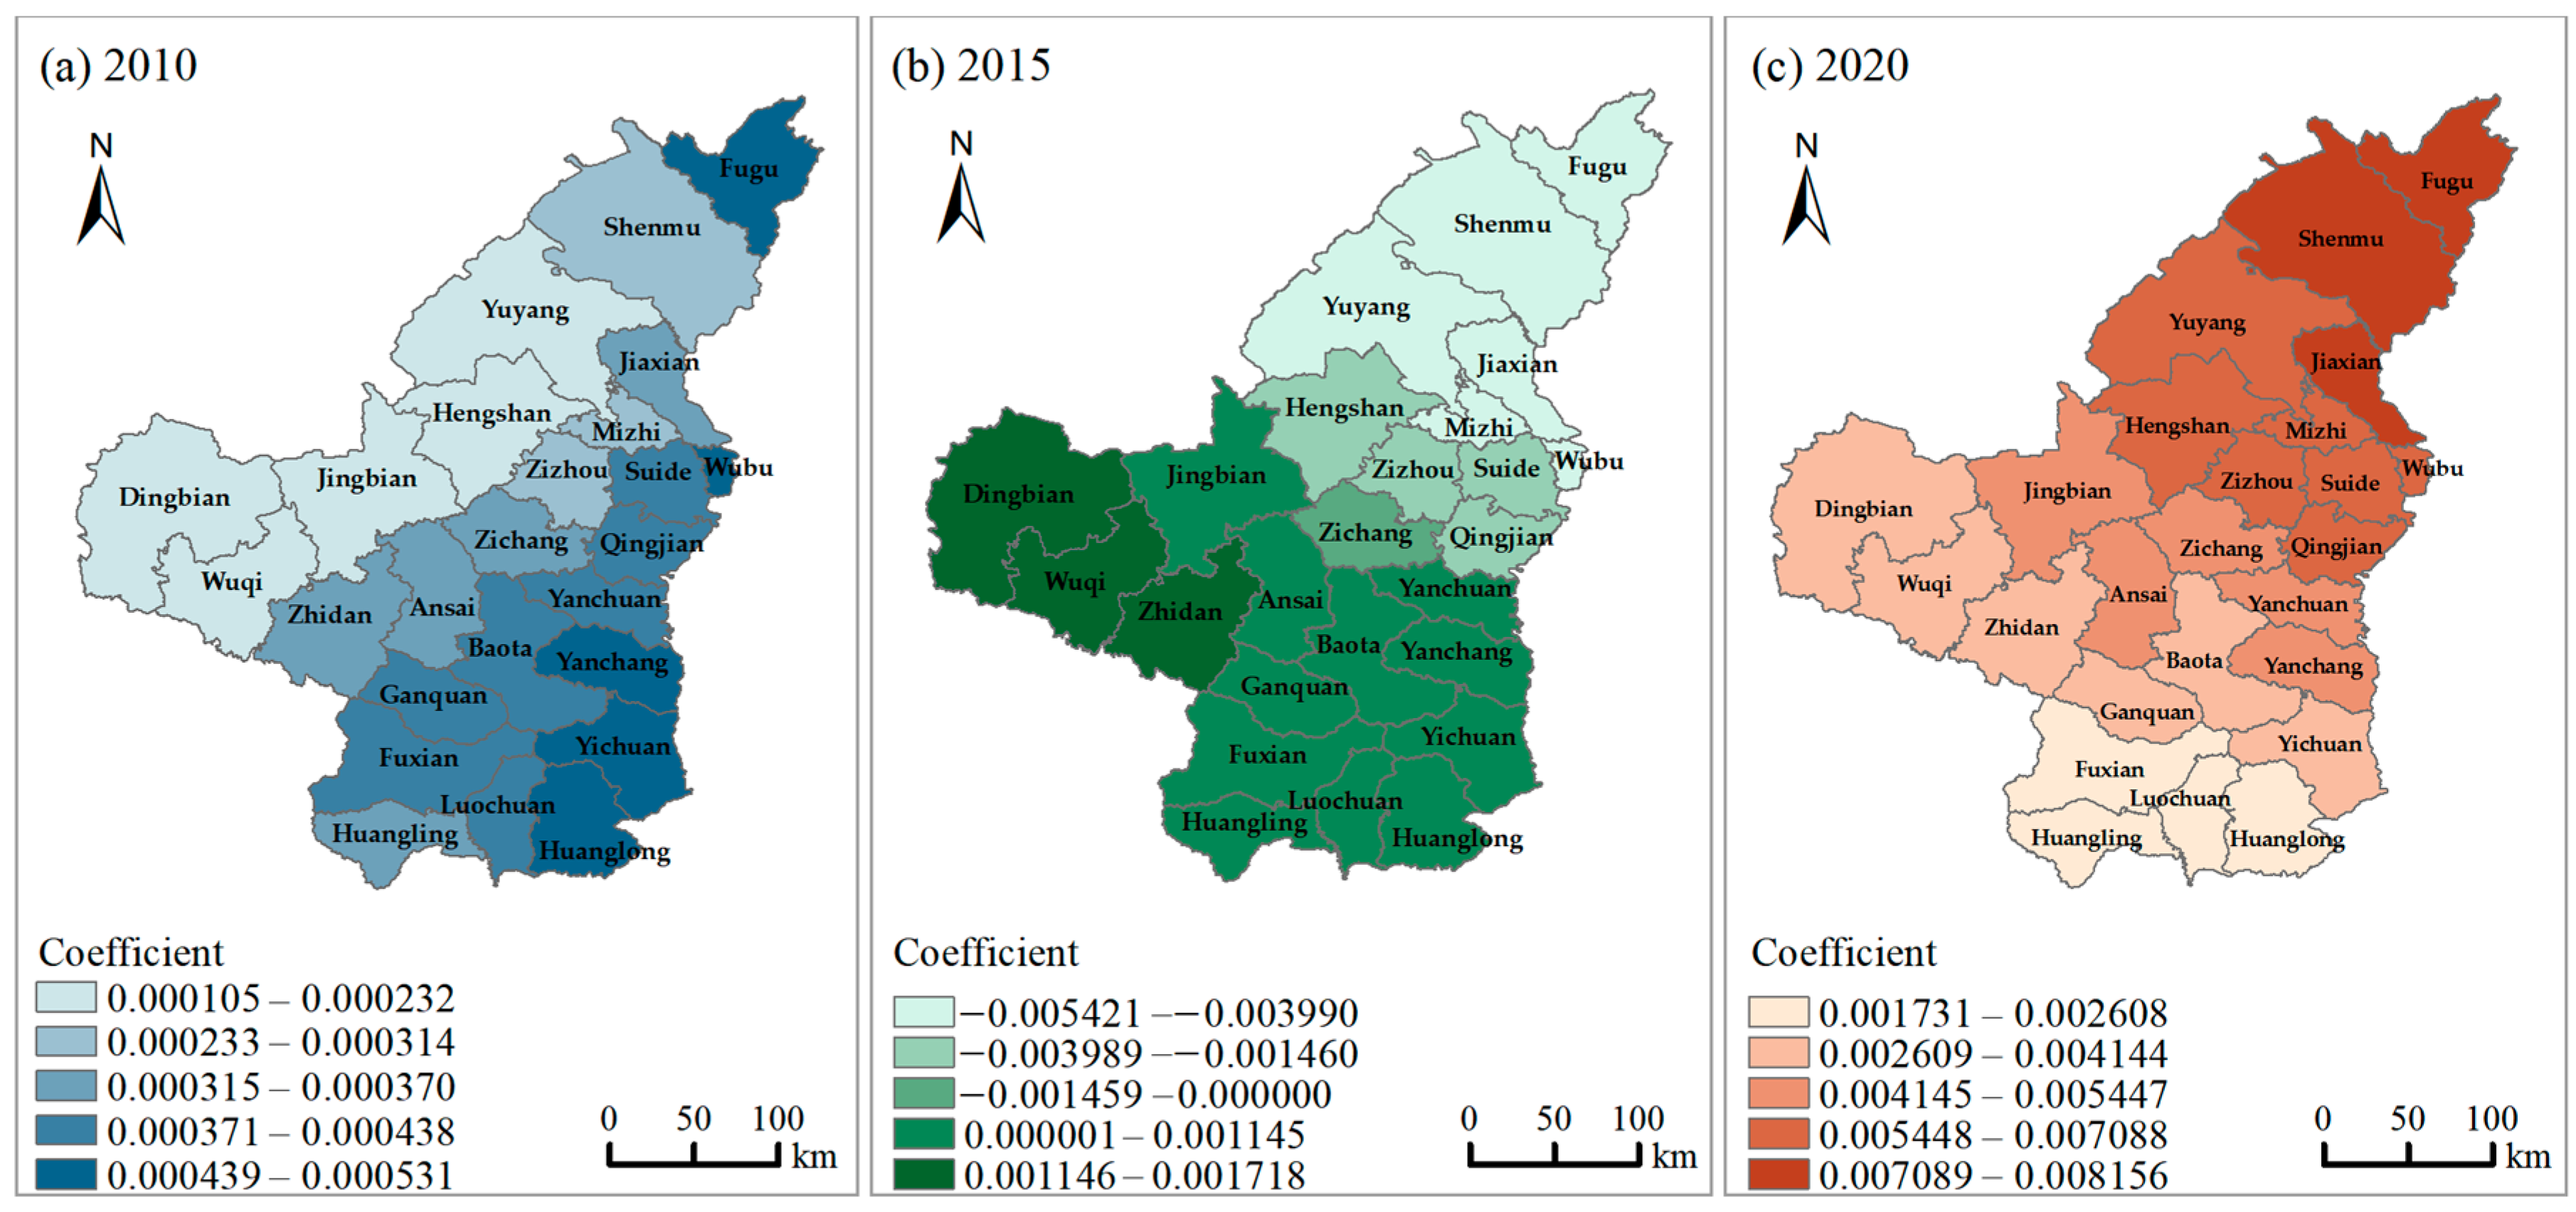
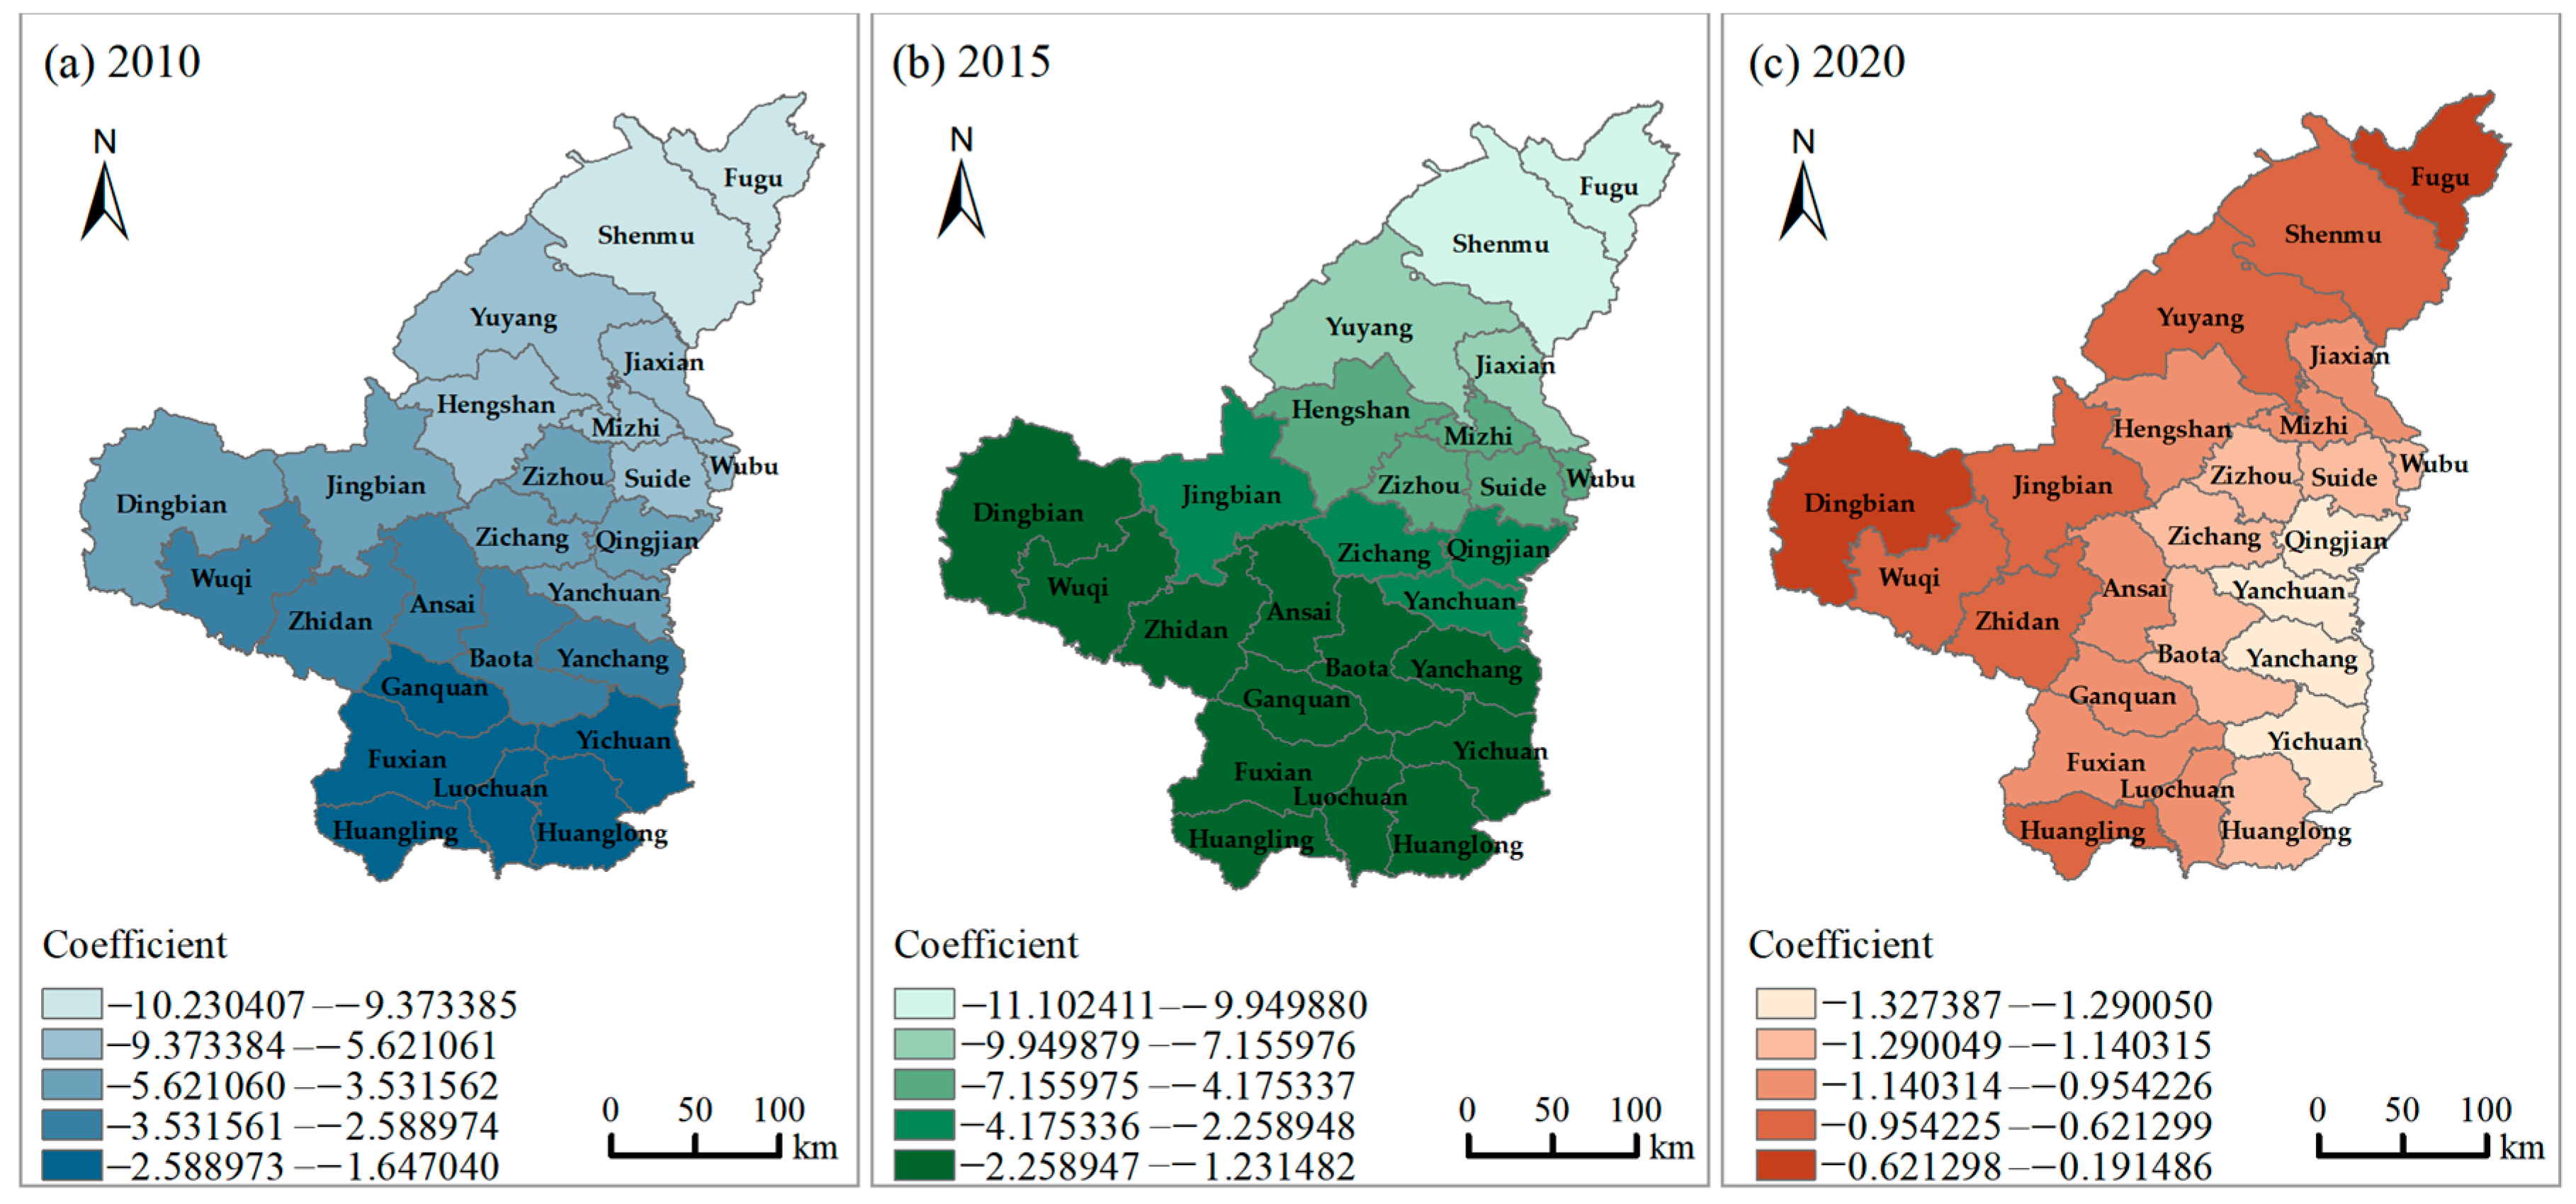
3.2.3. Per Capita GDP
3.2.4. Population Density
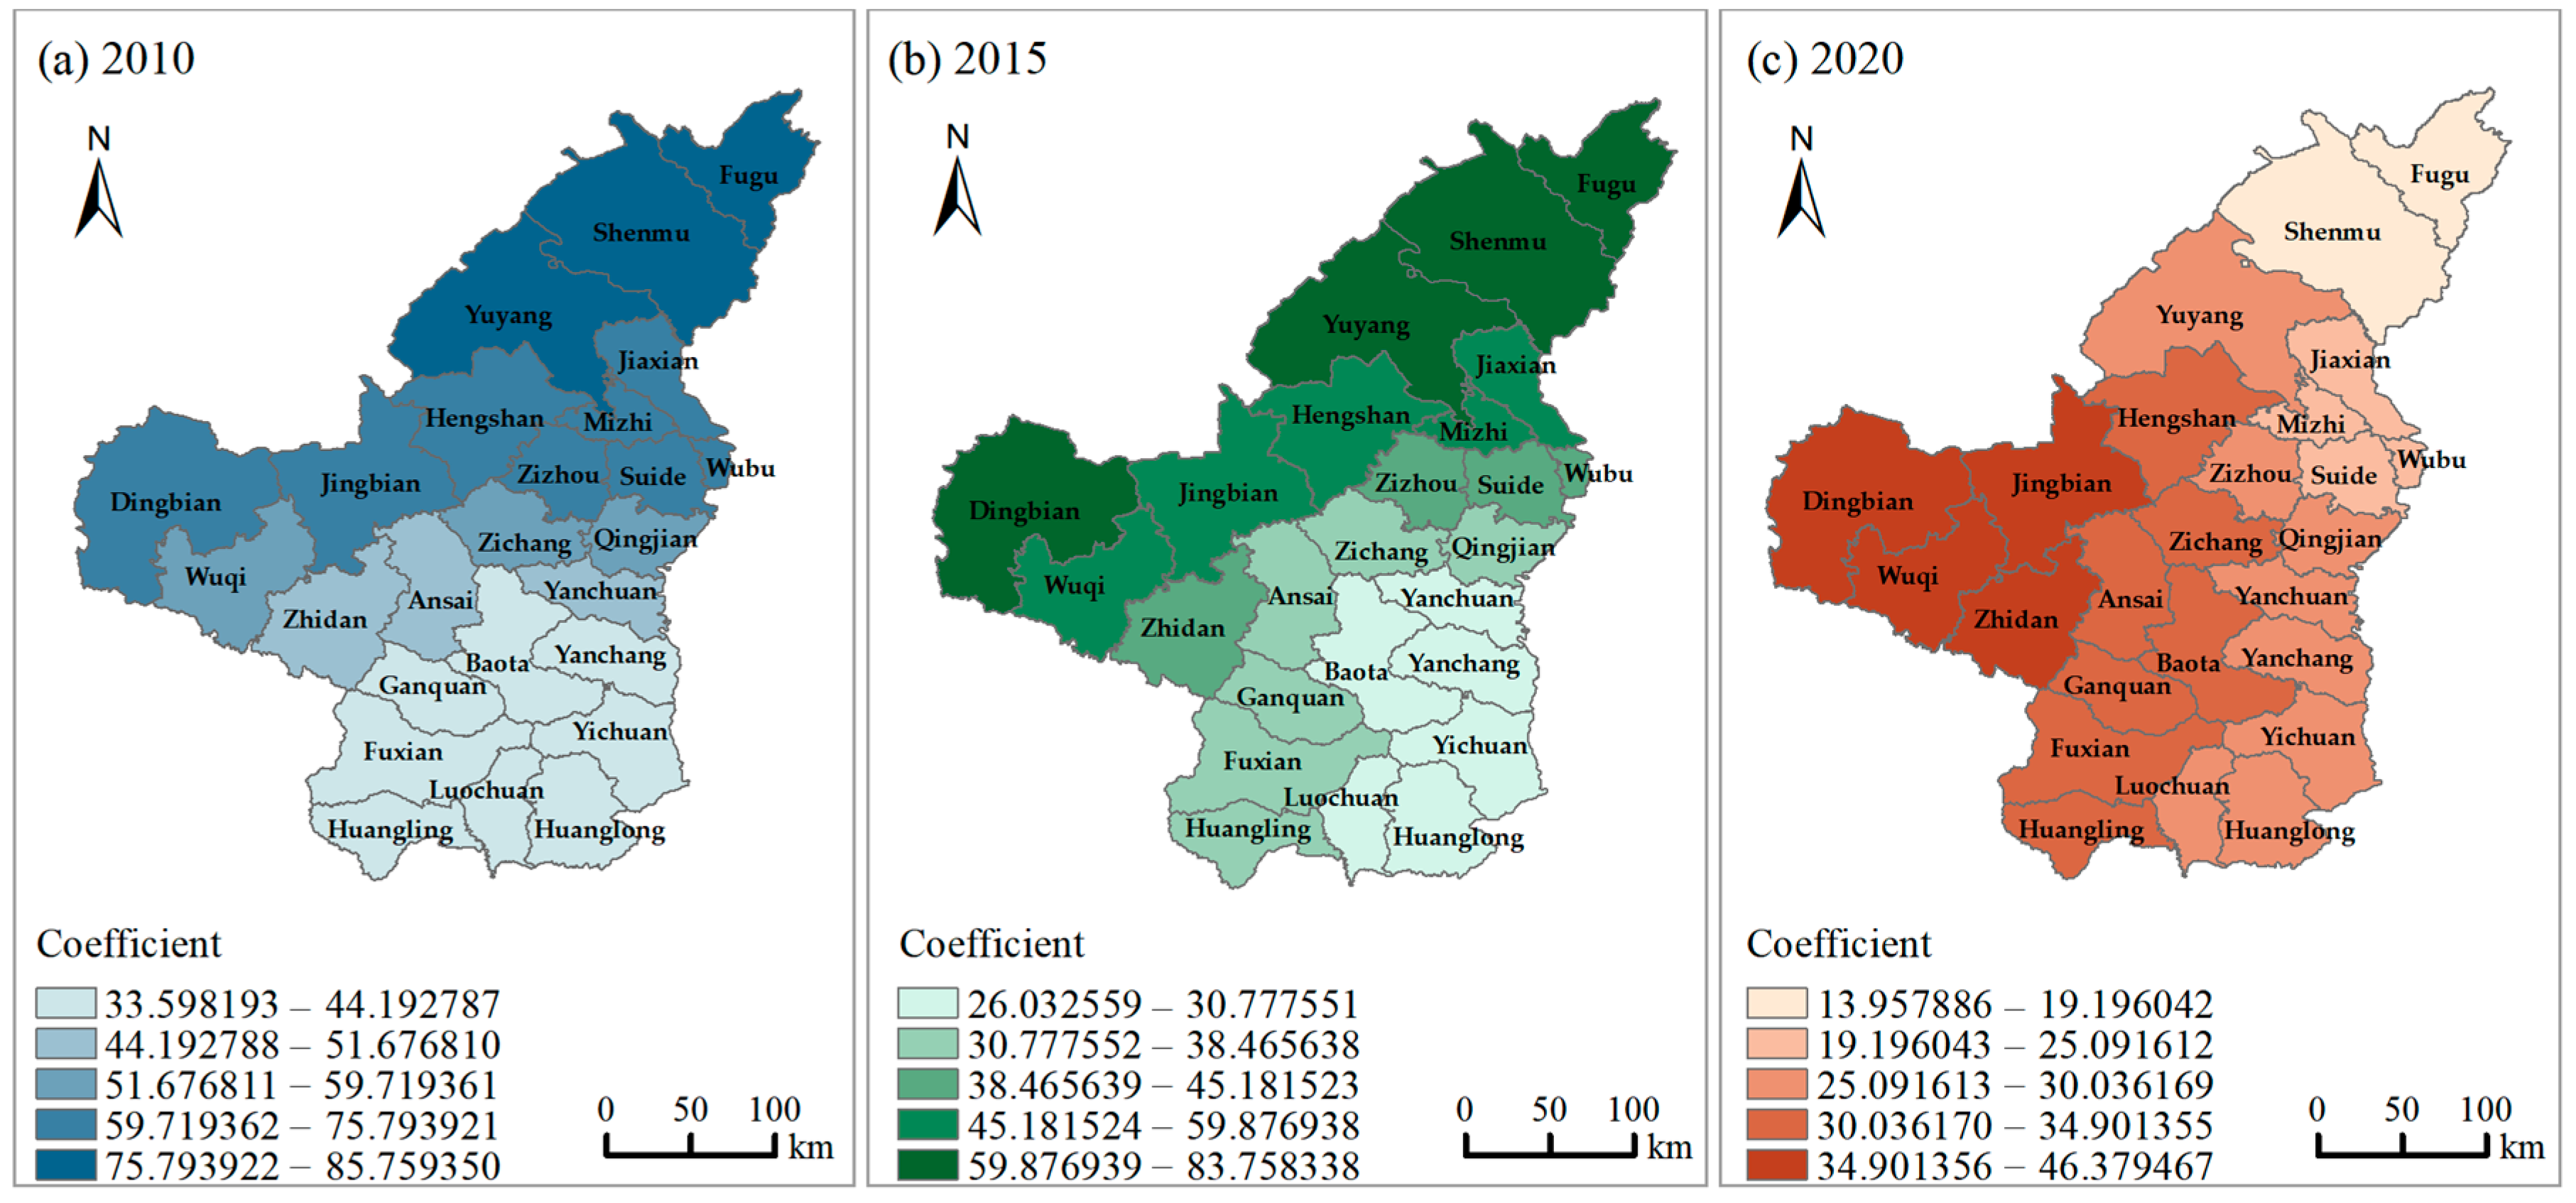
3.2.5. Proportion of Water Areas
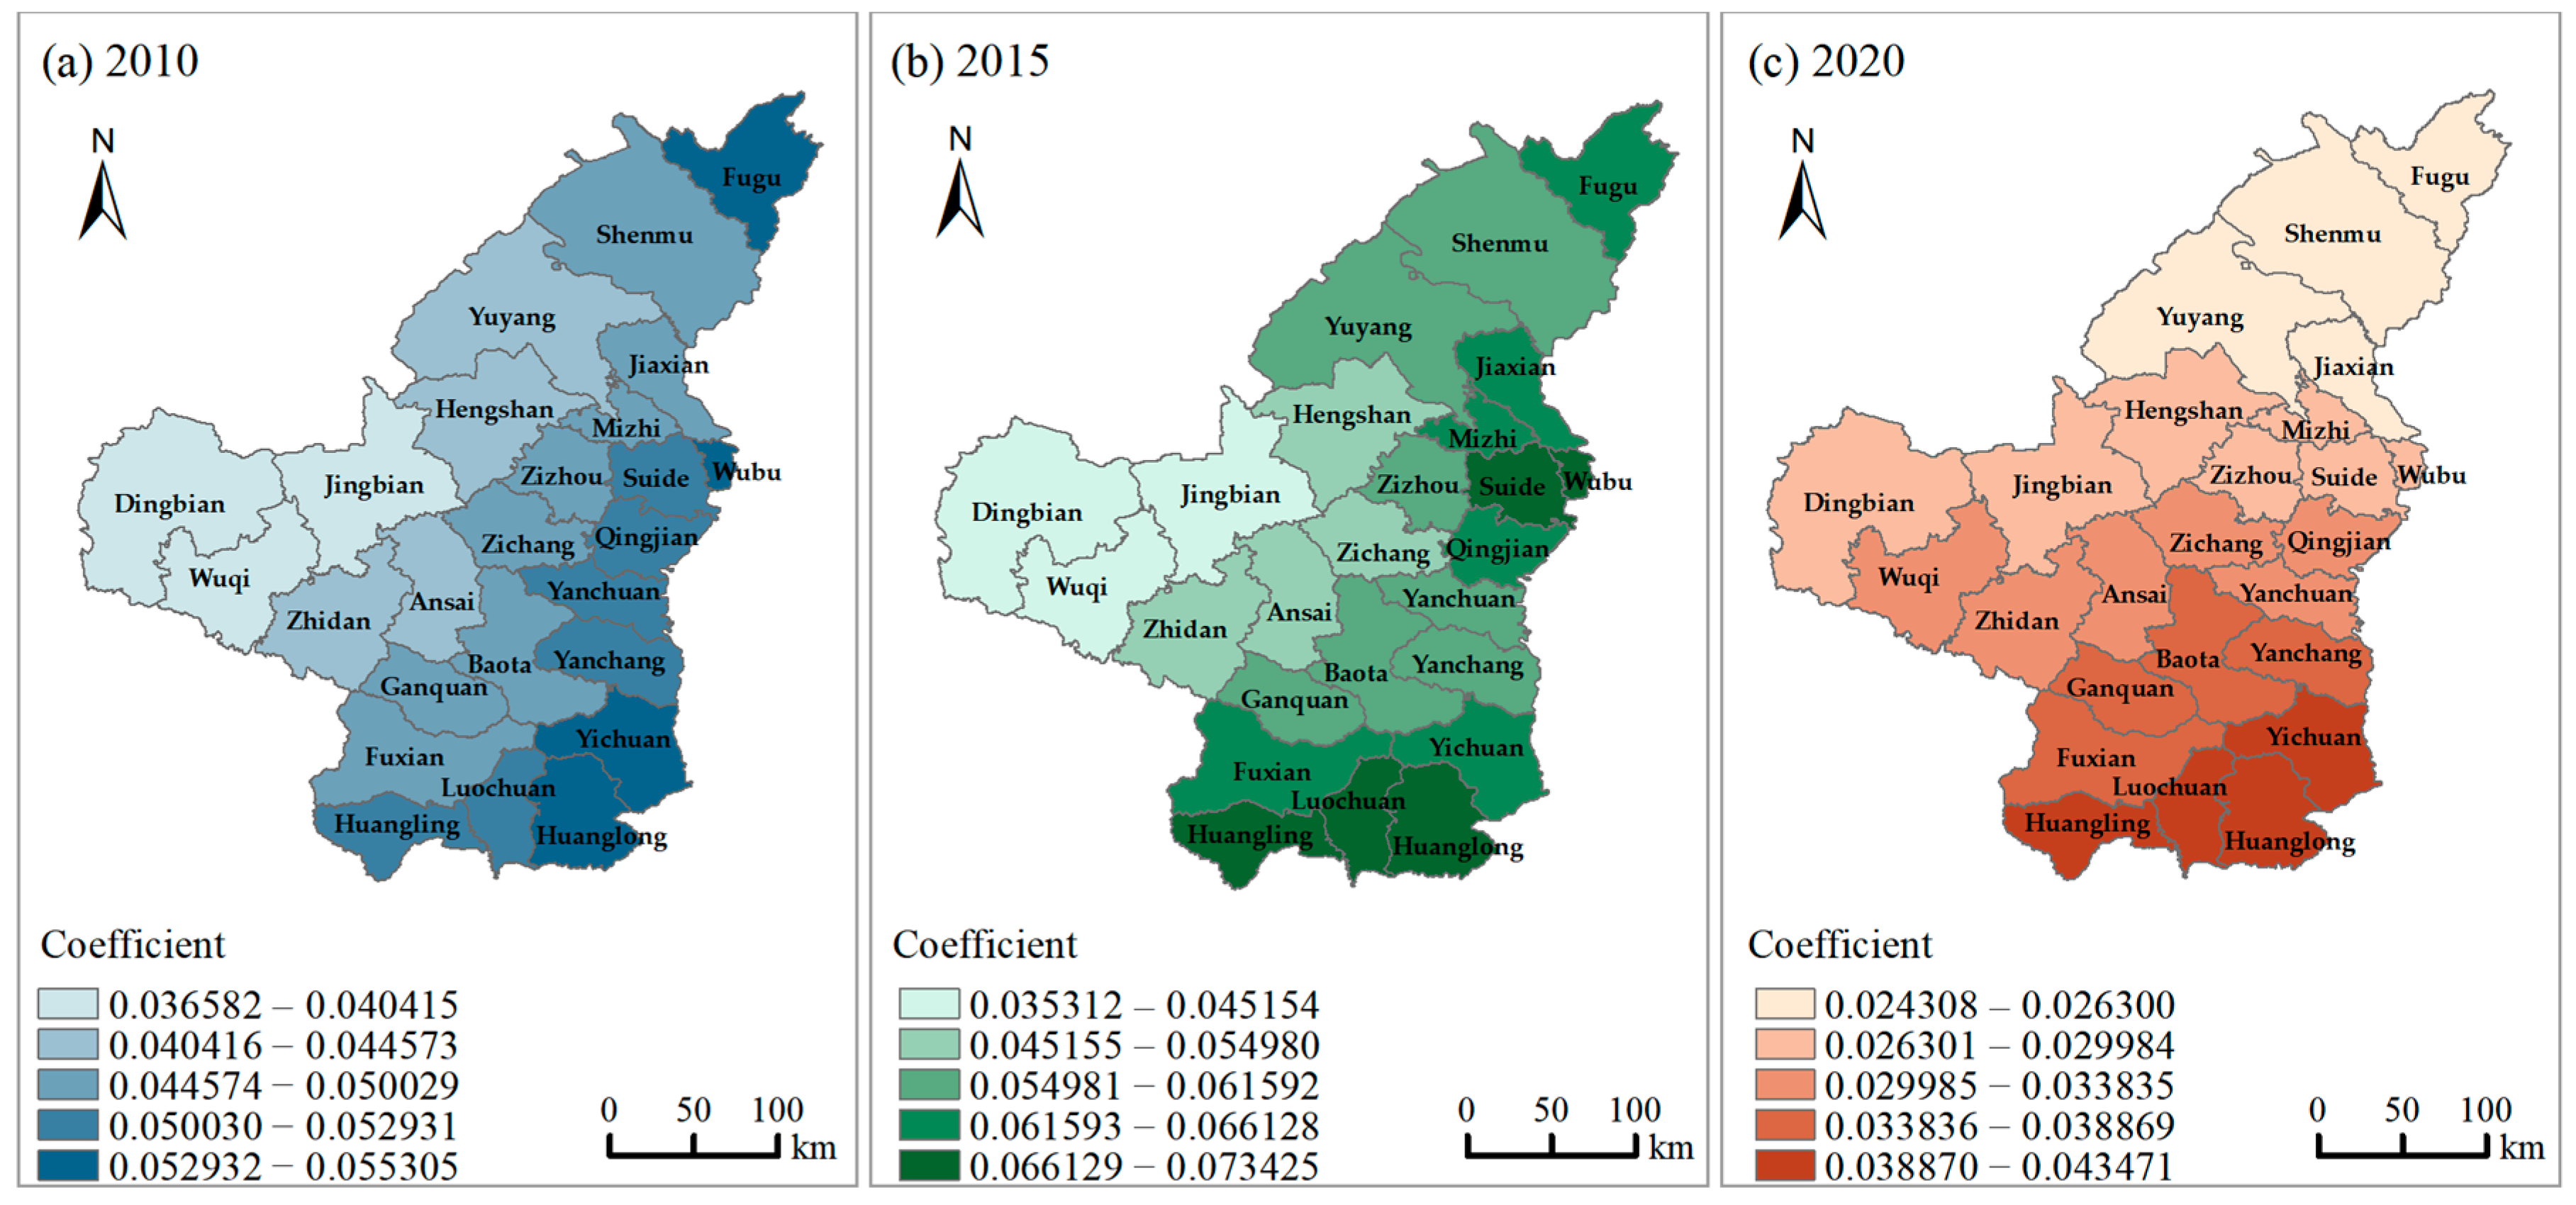
3.2.6. Water Consumption
4. Discussion
4.1. Necessity to Assessing WESV
4.2. The Spatiotemporal Distribution of WESV Response to Different Influencing Factors
4.3. Limitations
5. Conclusions
- (1)
- Considering surface water and groundwater as a whole, a WESV calculation method based on multi-method fusion of multiple data sources such as remote sensing images is proposed.
- (2)
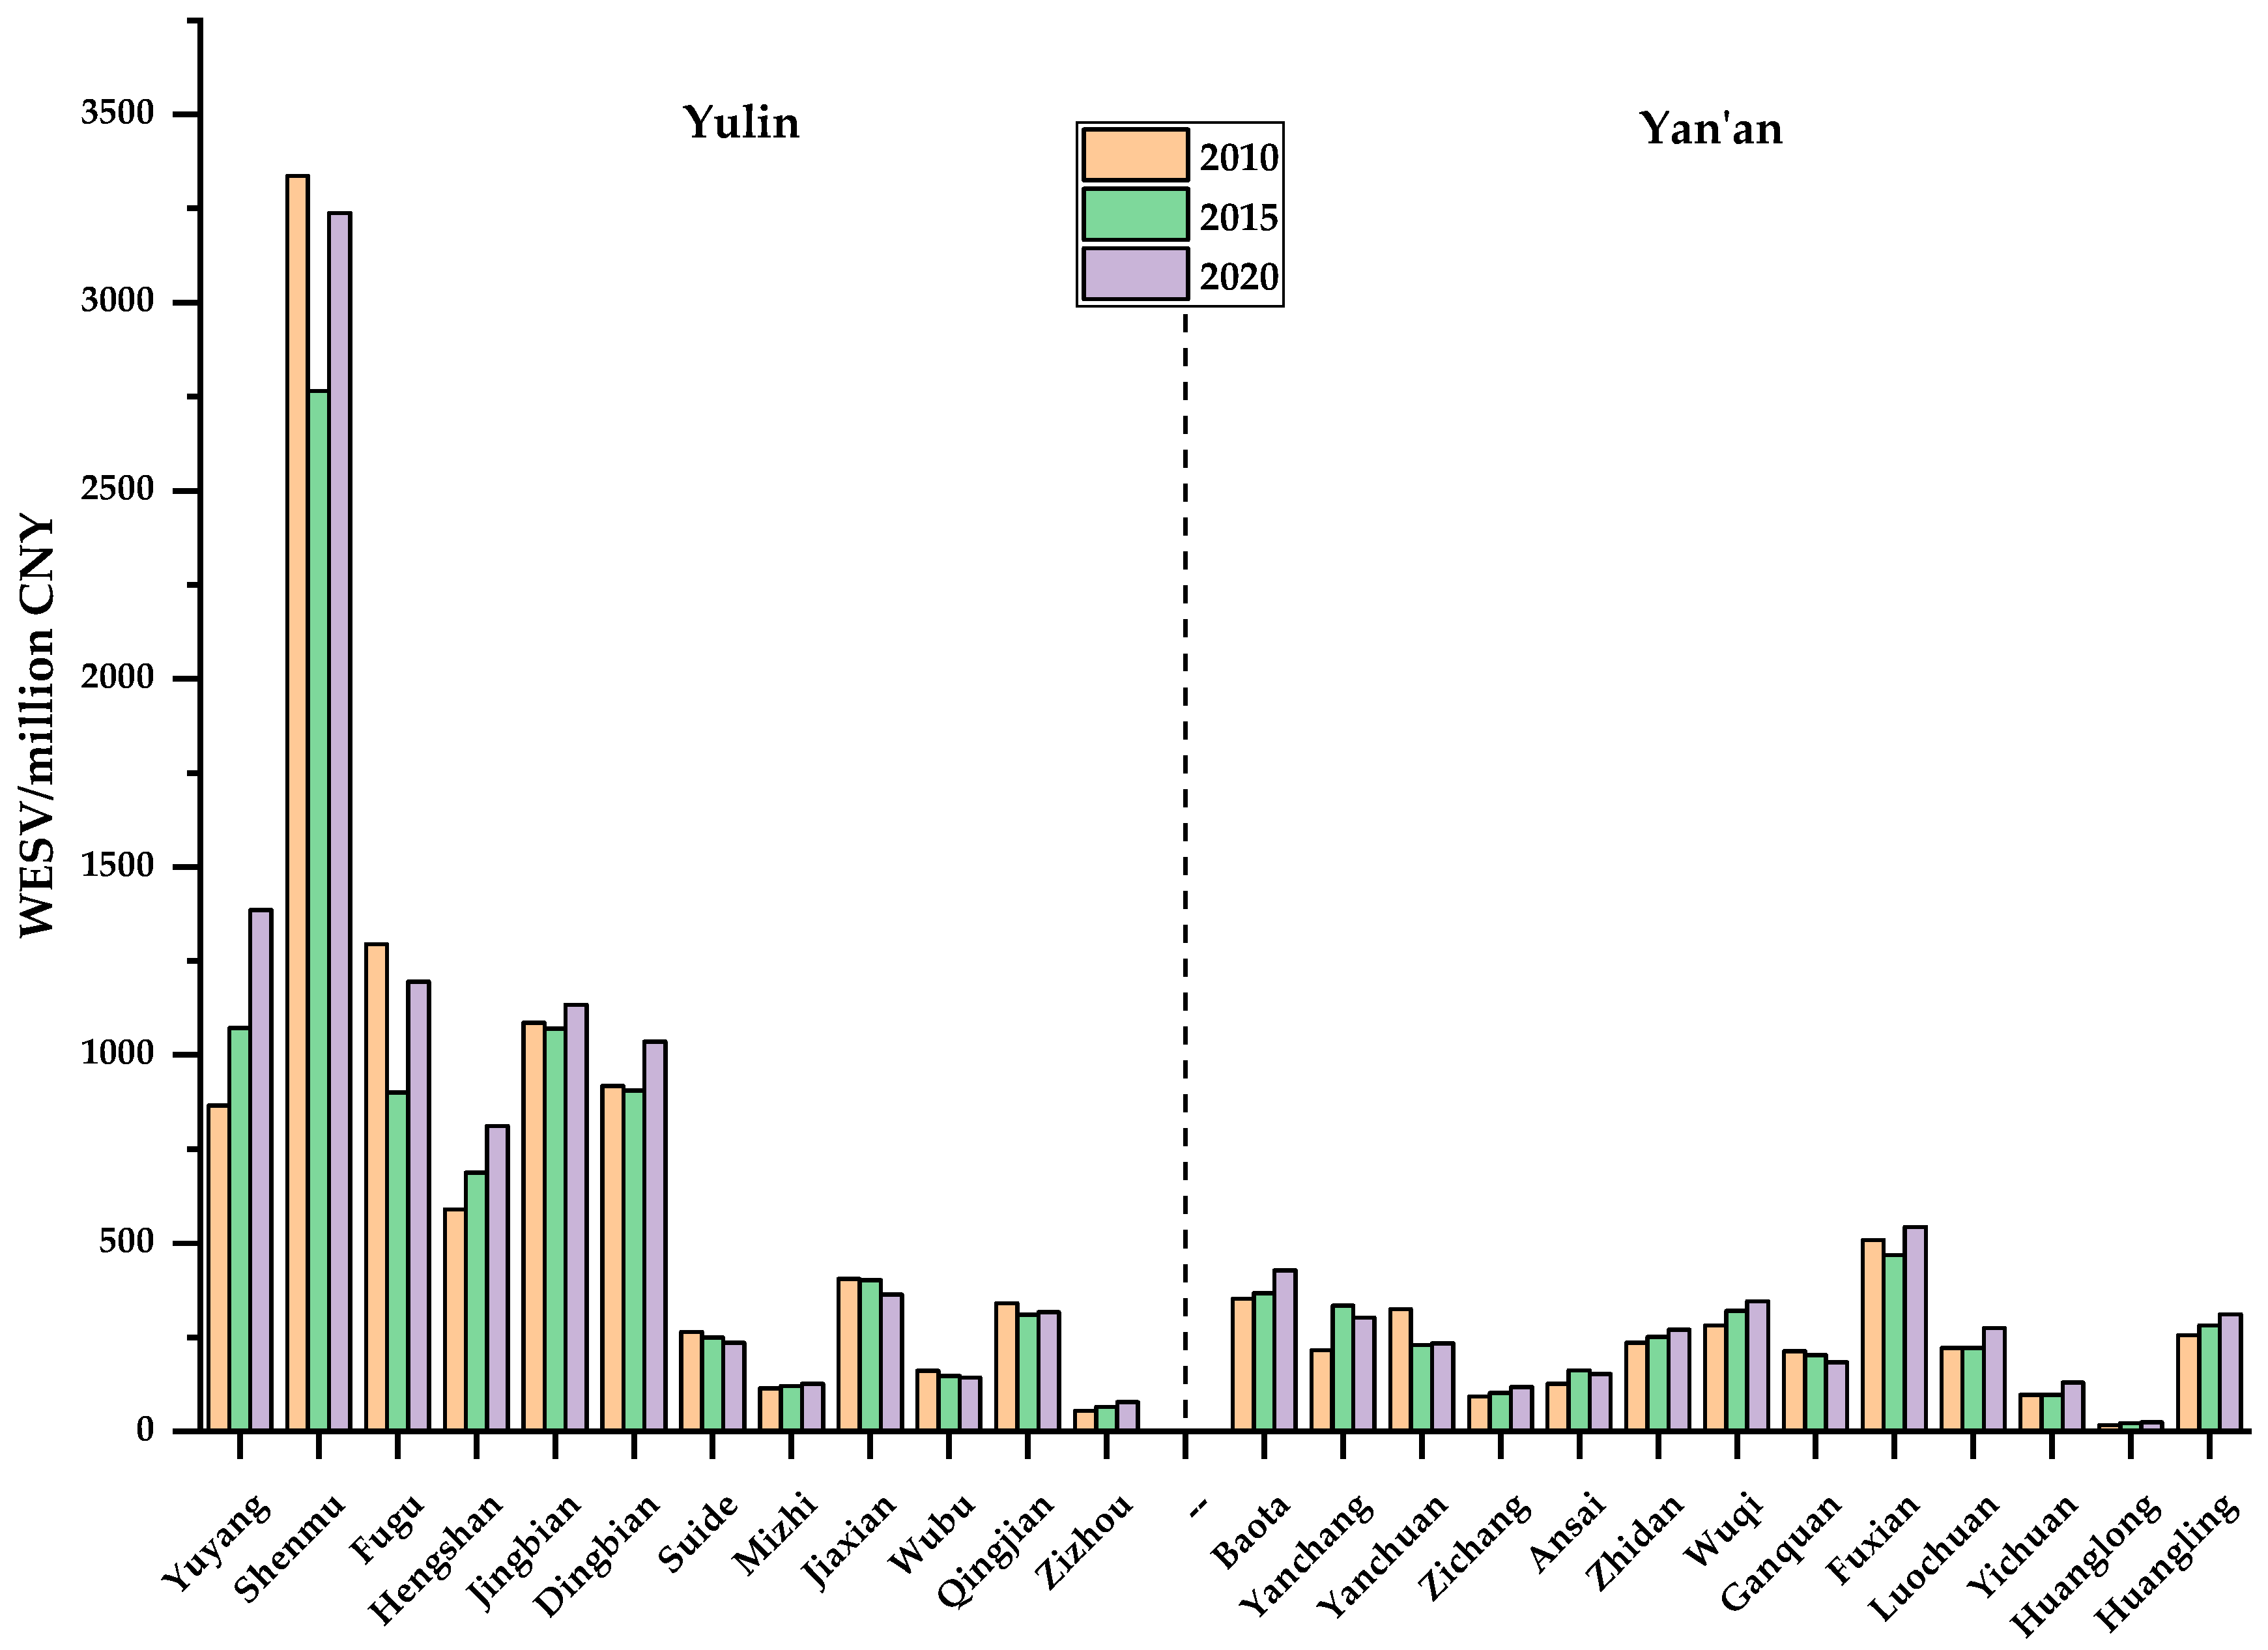
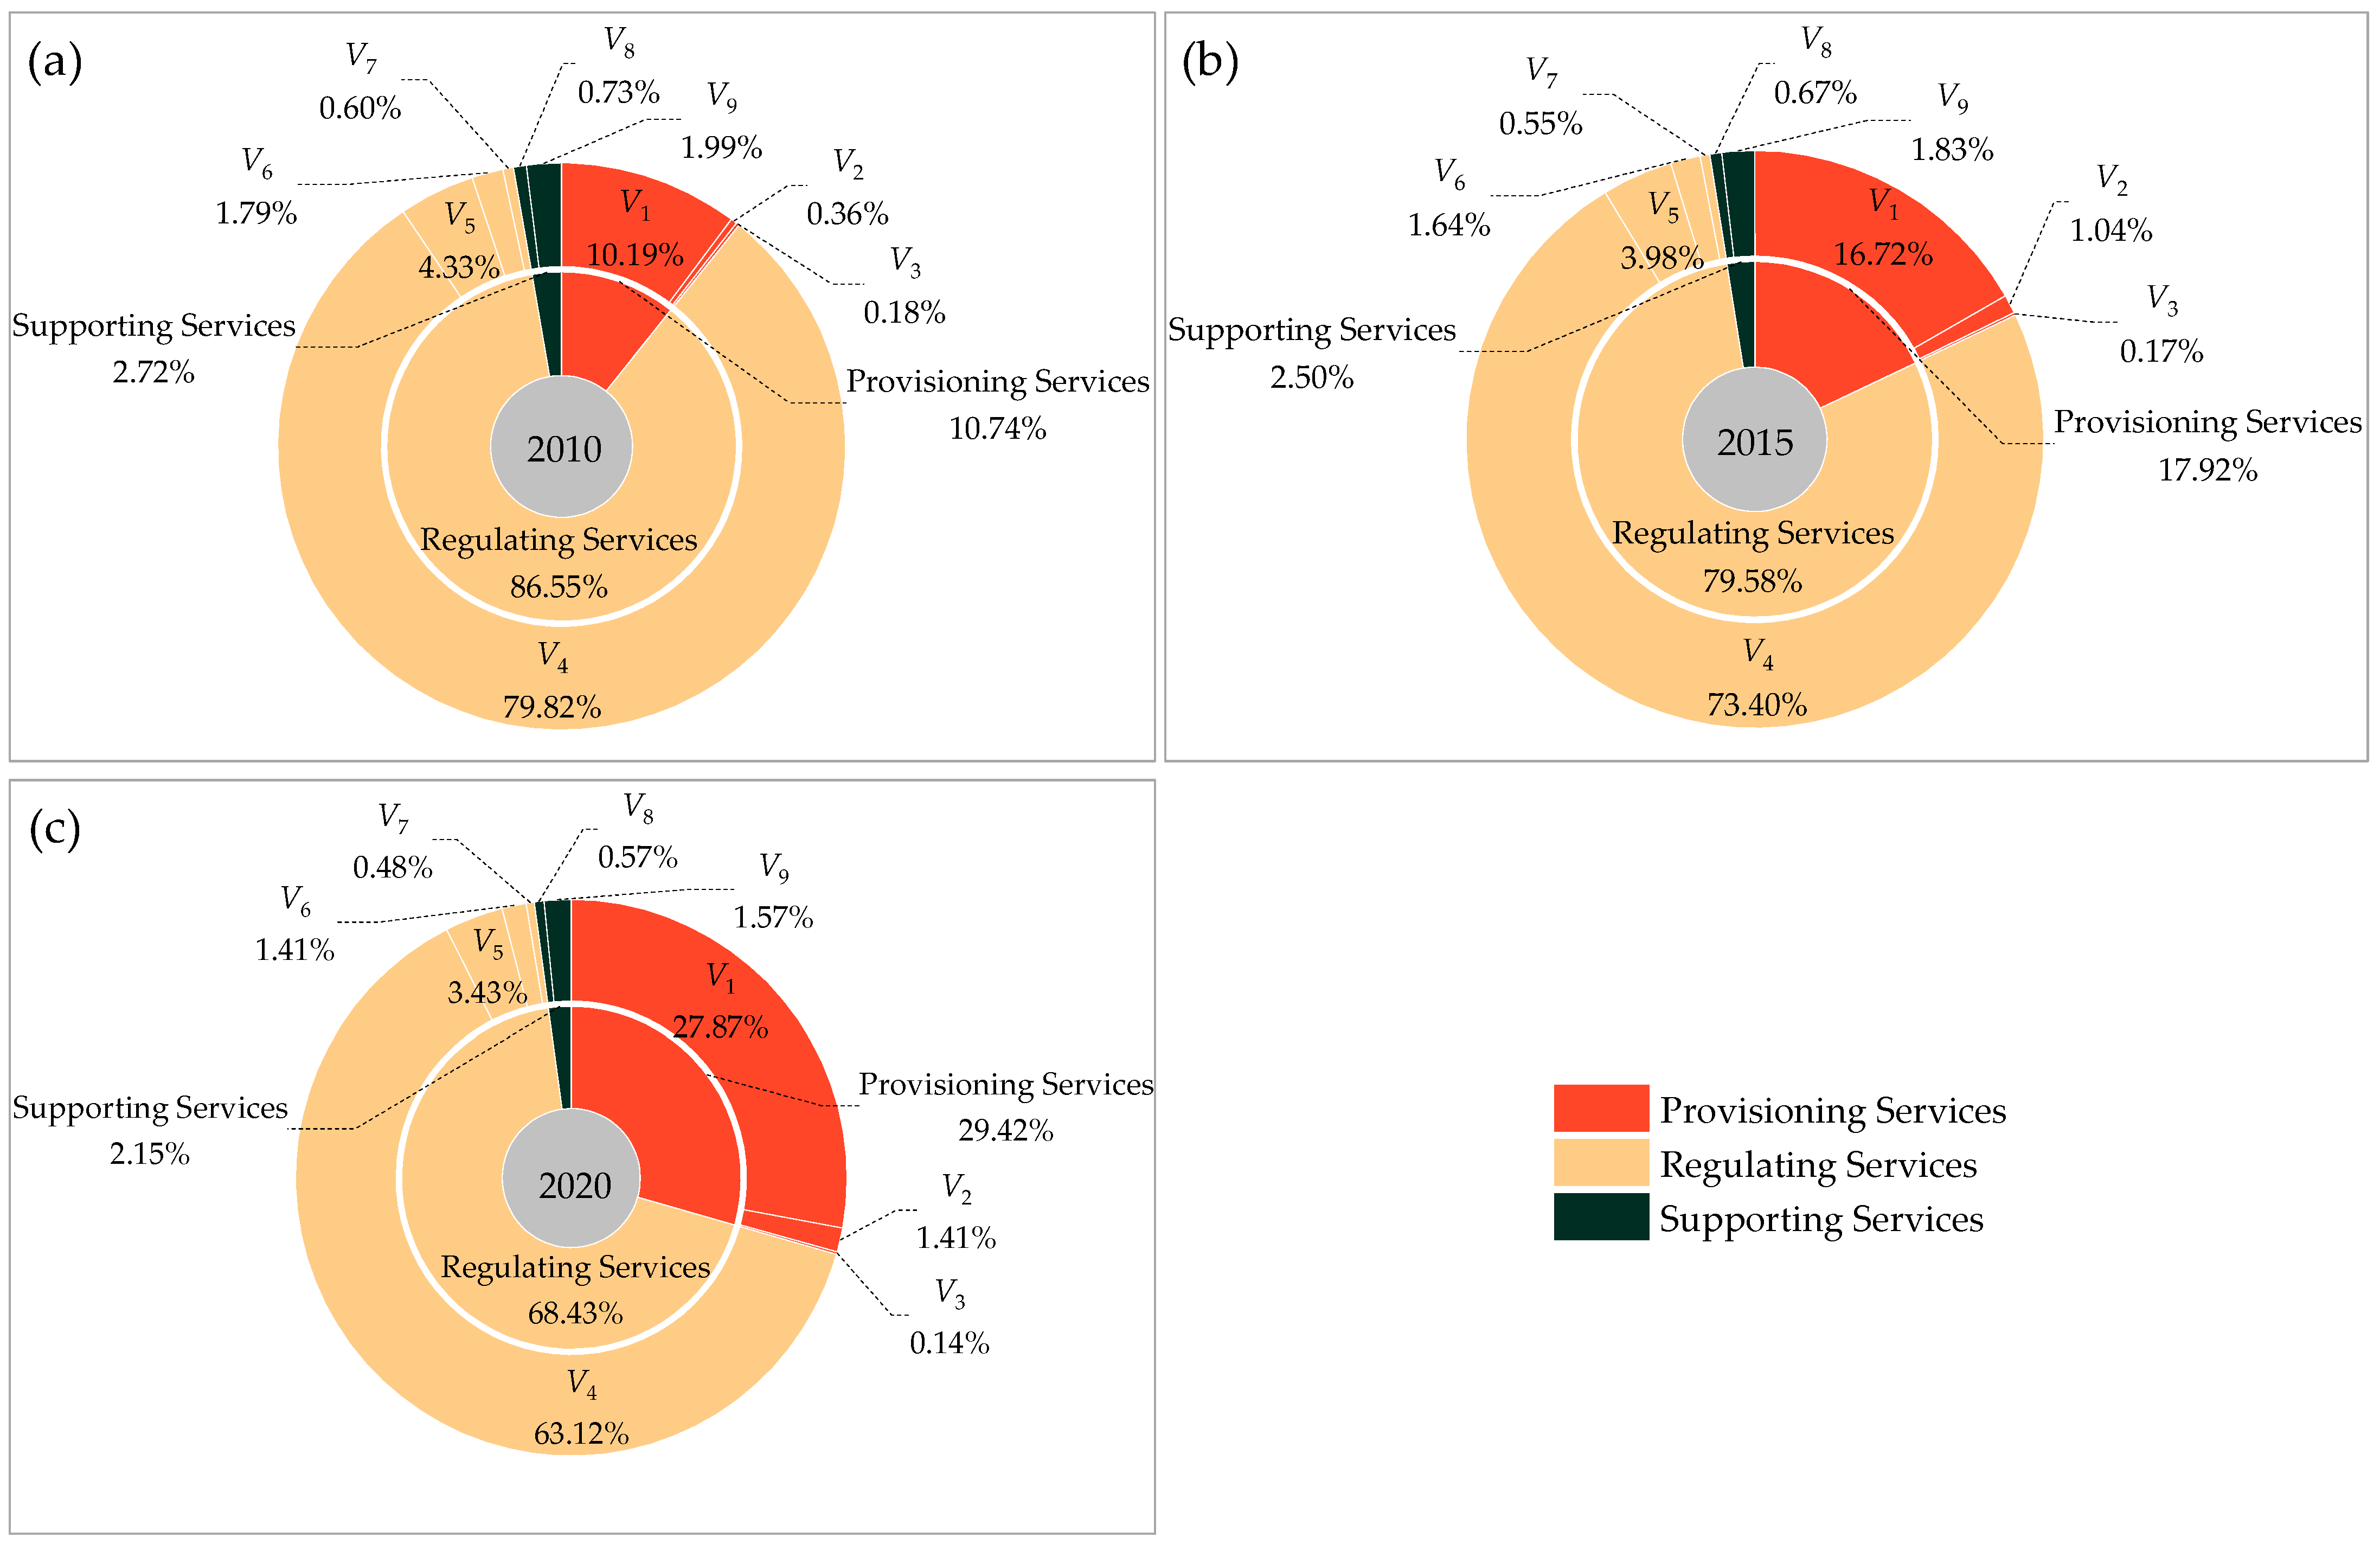
- In total, the WESV in 2020 is 8.16% higher than that in 2010. However, during the study period, the WESV in the typical area of the central Loess Plateau experienced a process of first decreasing and then increasing. The main factor leading to this phenomenon was that the WESV of Yulin City in the north of the study area decreased by 7.84% in 2015 compared with 2010. From the perspective of the WESV composition structure, the proportion of regulating services has decreased by 18.11% in the past 10 years, but its proportion is still the largest; the proportion of provisioning services has increased year by year to 29.42%; the proportion of supporting services has decreased steadily, from 2.72% in 2010 to 2.14% in 2020.
- (3)
- Considering the spatial heterogeneity, the GWR model has better applicability. Among the four influencing factors, the proportion of water area and water consumption showed a positive correlation with WESV throughout the study period. Population density is negatively correlated with WESV. Per capita GDP was positively correlated with WESV in both 2010 and 2020. In 2015, there was a negative correlation between per capita GDP and WESV in the northern and western districts and counties of the study area.
- (4)
- With the passage of time, the spatial distribution pattern of the influence of the four factors on WESV has changed, and the evolution directions are different. The response degree of WESV to per capita GDP has evolved gradually from low in the west and high in the east to low in the southwest and high in the northeast, and the laddering nature is stronger. The water area plays a leading role in the size of WESV, and the center of gravity of the influence of the water area proportion shifts from the north to the west, with a strong decreasing law. The distribution of the influence of water consumption on WESV has experienced three evolutionary stages: small in the west and large in the east, increases in a circular shape from the west to the outside, small in the north and large in the south.
Author Contributions
Funding
Institutional Review Board Statement
Informed Consent Statement
Data Availability Statement
Acknowledgments
Conflicts of Interest
References
- He, Y.; Wang, W.; Chen, Y.; Yan, H. Assessing spatio-temporal patterns and driving force of ecosystem service value in the main urban area of Guangzhou. Sci. Rep. 2021, 11, 3027. [Google Scholar] [CrossRef] [PubMed]
- Ahmad, M.; Akanji, M.A.; Usman, A.R.A.; Al-Farraj, A.S.F.; Tsang, Y.F.; Al-Wabel, M.I. Turning date palm waste into carbon nanodots and nano zerovalent iron composites for excellent removal of methylthioninium chloride from water. Sci. Rep. 2020, 10, 16125. [Google Scholar] [CrossRef] [PubMed]
- Costanza, R.; d’Arge, R.; de Groot, R.; Farber, S.; Grasso, M.; Hannon, B.; Limburg, K.; Naeem, S.; O’Neill, R.V.; Paruelo, J.; et al. The value of the world’s ecosystem services and natural capital. Nature 1997, 387, 253–260. [Google Scholar] [CrossRef]
- Millennium Ecosystem Assessments. Ecosystems and Human Well-Being: A Framework for Assessment; Island Press: Washington, DC, USA, 2003; pp. 50–60. [Google Scholar]
- Xie, G.; Lu, C.; Leng, Y.; Zheng, D.; Li, S. Ecological assets valuation of the Tibetan Plateau. J. Nat. Resour. 2003, 18, 189–196. [Google Scholar]
- Xie, G.; Zhang, C.; Zhang, L.; Chen, W.; Li, S. Improvement of the Evaluation Method for Ecosystem Service Value Based on Per Unit Area. J. Nat. Resour. 2015, 30, 1243–1254. [Google Scholar]
- Xiu, Y.; Wang, N.; Xie, J.; Ke, X. Improvement of the Ecological Protection Compensation Policy for Adjustment of Planting Structure in an Area of Groundwater Overexploitation: A Tripartite Evolutionary Game Study. Pol. J. Environ. Stud. 2022, 31, 1399–1414. [Google Scholar] [CrossRef]
- Talukdar, S.; Singha, P.; Shahfahad; Mahato, S.; Praveen, B.; Rahman, A. Dynamics of ecosystem services (ESs) in response to land use land cover (LU/LC) changes in the lower Gangetic plain of India. Ecol. Indic. 2020, 112, 106121. [Google Scholar] [CrossRef]
- Flotemersch, J.E.; Shattuck, S.M.; Aho, K.B.; Cox, C.E.; Cairns, M.R. Factors influencing social demands of aquatic ecosystems. Ecol. Soc. 2019, 24, 9. [Google Scholar] [CrossRef]
- Liu, Z.T.; Wu, R.; Chen, Y.X.; Fang, C.L.; Wang, S.J. Factors of ecosystem service values in a fast-developing region in China: Insights from the joint impacts of human activities and natural conditions. J. Clean. Prod. 2021, 297, 126588. [Google Scholar] [CrossRef]
- Liu, W.; Zhan, J.Y.; Zhao, F.; Yan, H.M.; Zhang, F.; Wei, X.Q. Impacts of urbanization-induced land-use changes on ecosystem services: A case study of the Pearl River Delta Metropolitan Region, China. Ecol. Indic. 2019, 98, 228–238. [Google Scholar] [CrossRef]
- Wang, J.L.; Zhou, W.Q.; Pickett, S.T.A.; Yu, W.J.; Li, W.F. A multiscale analysis of urbanization effects on ecosystem services supply in an urban megaregion. Sci. Total Environ. 2019, 662, 824–833. [Google Scholar] [CrossRef] [PubMed]
- Zhou, D.Y.; Tian, Y.Y.; Jiang, G.H. Spatio-temporal investigation of the interactive relationship between urbanization and ecosystem services: Case study of the Jingjinji urban agglomeration, China. Ecol. Indic. 2018, 95, 152–164. [Google Scholar] [CrossRef]
- Hu, S.; Chen, L.Q.; Li, L.; Wang, B.Y.; Yuan, L.N.; Cheng, L.; Yu, Z.Q.; Zhang, T. Spatiotemporal Dynamics of Ecosystem Service Value Determined by Land-Use Changes in the Urbanization of Anhui Province, China. Int. J. Environ. Res. Public Health 2019, 16, 5104. [Google Scholar] [CrossRef] [PubMed]
- Mao, Y.Y.; Hou, L.L.; Zhang, Z.D. Spatial-Temporal Evolution and Relationship between Urbanization Level and Ecosystem Service from a Dual-Scale Perspective: A Case Study of the Pearl River Delta Urban Agglomeration. Sustainability 2021, 13, 8537. [Google Scholar] [CrossRef]
- Peng, L.; Wang, X.X. What is the relationship between ecosystem services and urbanization? A case study of the mountainous areas in Southwest China. J. Mt. Sci. 2019, 16, 2867–2881. [Google Scholar] [CrossRef]
- Yang, Y.Q.; Jun, Z.; Sui, X.; He, X. Study of the spatial connection between urbanization and the ecosystem-A case study of Central Yunnan (China). PLoS ONE 2020, 15, e0238192. [Google Scholar] [CrossRef]
- Li, R.; Shi, Y.; Feng, C.C.; Guo, L. The spatial relationship between ecosystem service scarcity value and urbanization from the perspective of heterogeneity in typical arid and semiarid regions of China. Ecol. Indic. 2021, 132, 108299. [Google Scholar] [CrossRef]
- Shi, L.; Halik, U.; Mamat, Z.; Aishan, T.; Abliz, A.; Welp, M. Spatiotemporal investigation of the interactive coercing relationship between urbanization and ecosystem services in arid northwestern China. LDD 2021, 32, 4105–4120. [Google Scholar] [CrossRef]
- Fang, J.H.; Song, H.L.; Zhang, Y.R.; Li, Y.R.; Liu, J. Climate-dependence of ecosystem services in a nature reserve in northern China. PLoS ONE 2018, 13, e0192727. [Google Scholar] [CrossRef]
- Cheng, B.; Li, H.E. Impact of climate change and human activities on economic values produced by ecosystem service functions of rivers in water shortage area of Northwest China. Environ. Sci. Pollut. Res. 2020, 27, 26570–26578. [Google Scholar] [CrossRef]
- Watson, L.; Straatsma, M.W.; Wanders, N.; Verstegen, J.A.; de Jong, S.M.; Karssenberg, D. Global ecosystem service values in climate class transitions. Environ. Res. Lett. 2020, 15, 024008. [Google Scholar] [CrossRef]
- Schild, J.E.; Vermaat, J.E.; van Bodegom, P.M. Differential effects of valuation method and ecosystem type on the monetary valuation of dryland ecosystem services: A quantitative analysis. J. Arid Environ. 2018, 159, 11–21. [Google Scholar] [CrossRef]
- Zhao, Q.J.; Wang, Q.Y. Water Ecosystem Service Quality Evaluation and Value Assessment of Taihu Lake in China. Water 2021, 13, 618. [Google Scholar] [CrossRef]
- Pettinotti, L.; de Ayala, A.; Ojea, E. Benefits From Water Related Ecosystem Services in Africa and Climate Change. Ecol. Econ. 2018, 149, 294–305. [Google Scholar] [CrossRef]
- Li, Z.H.; Xia, J.; Deng, X.Z.; Yan, H.M. Multilevel modelling of impacts of human and natural factors on ecosystem services change in an oasis, Northwest China. Resour. Conserv. Recycl. 2021, 169, 105474. [Google Scholar] [CrossRef]
- Hong, Z.M.; Hao, H.; Li, C.Y.; Du, W.; Wei, L.D.; Wang, H.H. Exploration of potential risks of Hand, Foot, and Mouth Disease in Inner Mongolia Autonomous Region, China Using Geographically Weighted Regression Model. Sci. Rep. 2018, 8, 17707. [Google Scholar] [CrossRef]
- Cardozo, O.D.; García-Palomares, J.C.; Gutiérrez, J. Application of geographically weighted regression to the direct forecasting of transit ridership at station-level. Appl. Geogr. 2012, 34, 548–558. [Google Scholar] [CrossRef]
- Wu, D.C. Spatially and temporally varying relationships between ecological footprint and influencing factors in China’s provinces Using Geographically Weighted Regression (GWR). J. Clean. Prod. 2020, 261, 121089. [Google Scholar] [CrossRef]
- Muratoglu, A. Applications and Response Formulations of Water Footprint Methodology for Conservation of Water Resources. Ref. Module Earth Syst. Environ. Sci. 2021. [Google Scholar] [CrossRef]
- Muratoglu, A. Water Footprint: Concept and Methodology. Ref. Module Earth Syst. Environ. Sci. 2021. [Google Scholar] [CrossRef]
- Shao, Y.J.; Yuan, X.F.; Ma, C.Q.; Ma, R.F.; Ren, Z.X. Quantifying the Spatial Association between Land Use Change and Ecosystem Services Value: A Case Study in Xi’an, China. Sustainability 2020, 12, 4449. [Google Scholar] [CrossRef]
- Dahal, R.P.; Grala, R.K.; Gordon, J.S.; Munn, I.A.; Petrolia, D.R. Geospatial Heterogeneity in Monetary Value of Proximity to Waterfront Ecosystem Services in the Gulf of Mexico. Water 2021, 13, 2401. [Google Scholar] [CrossRef]
- Ren, Y.; Lü, Y.; Fu, B.; Comber, A.; Li, T.; Hu, J. Driving Factors of Land Change in China’s Loess Plateau: Quantification Using Geographically Weighted Regression and Management Implications. Remote Sens. 2020, 12, 453. [Google Scholar] [CrossRef]
- Wang, Y.; Wu, G.; Deng, L.; Tang, Z.; Wang, K.; Sun, W.; Shangguan, Z. Prediction of aboveground grassland biomass on the Loess Plateau, China, using a random forest algorithm. Sci. Rep. 2017, 7, 6940. [Google Scholar] [CrossRef]
- Zhao, G.J.; Mu, X.M.; Wen, Z.M.; Wang, F.; Gao, P. Soil erosion, conservation, and eco-environment changes in the loess plateau of china. LDD Land Degrad. Dev. 2013, 24, 499–510. [Google Scholar] [CrossRef]
- Fu, B.J.; Wang, S.; Liu, Y.; Liu, J.B.; Liang, W.; Miao, C.Y. Hydrogeomorphic Ecosystem Responses to Natural and Anthropogenic Changes in the Loess Plateau of China. Annu. Rev. Earth Planet. Sci. 2017, 45, 223–243. [Google Scholar] [CrossRef]
- Chen, J.; Yang, X.; Yin, S.; Wu, K.; Deng, M.; Wen, X. The vulnerability evolution and simulation of social-ecological systems in a semi-arid area: A case study of Yulin City, China. J. Geogr. Sci. 2018, 28, 152–174. [Google Scholar] [CrossRef]
- Luo, M.; Li, T. Spatial and temporal analysis of landscape ecological quality in Yulin. Environ. Technol. Innov. 2021, 23, 101700. [Google Scholar] [CrossRef]
- Zhang, D.; Jia, Q.; Wang, P.; Zhang, J.; Hou, X.; Li, X.; Li, W. Analysis of spatial variability in factors contributing to vegetation restoration in Yan’an, China. Ecol. Indic. 2020, 113, 106278. [Google Scholar] [CrossRef]
- Han, L.; Zhu, H.; Zhao, Y.; Liu, Z. Analysis of variation in river sediment characteristics and influential factors in Yan’an City, China. Environ. Earth Sci. 2018, 77, 479. [Google Scholar] [CrossRef]
- Hou, K.; Li, X.; Wang, J.J.; Zhang, J. An analysis of the impact on land use and ecological vulnerability of the policy of returning farmland to forest in Yan’an, China. Environ. Sci. Pollut. Res. 2016, 23, 4670–4680. [Google Scholar] [CrossRef] [PubMed]
- Xie, G.; Zhang, C.; Zhen, L.; Zhang, L. Dynamic changes in the value of China’s ecosystem services. Ecosyst. Serv. 2017, 26, 146–154. [Google Scholar] [CrossRef]
- Seidl, C.; Wheeler, S.A.; Zuo, A. High turbidity: Water valuation and accounting in the Murray-Darling Basin. Agric. Water Manag. 2020, 230, 105929. [Google Scholar] [CrossRef]
- Shaanxi Provincial Bureau of Statistics. Shaanxi Statistical Yearbook 2010; China Statistics Press: Beijing, China, 2010.
- Shaanxi Provincial Bureau of Statistics. Shaanxi Statistical Yearbook 2015; China Statistics Press: Beijing, China, 2015.
- Shaanxi Provincial Bureau of Statistics. Shaanxi Statistical Yearbook 2019; China Statistics Press: Beijing, China, 2019.
- Shaanxi Provincial Bureau of Statistics. Shaanxi Statistical Yearbook 2020; China Statistics Press: Beijing, China, 2020.
- Ma, Q.; Li, Y.; Xu, L. Identification of green infrastructure networks based on ecosystem services in a rapidly urbanizing area. J. Clean. Prod. 2021, 300, 126945. [Google Scholar] [CrossRef]
- Price Department of National Development and Reform Commission. Compilation of National Agricultural Product Cost-Benefit Data 2011; China Statistics Press: Beijing, China, 2011.
- Price Department of National Development and Reform Commission. Compilation of National Agricultural Product Cost-Benefit Data 2016; China Statistics Press: Beijing, China, 2016.
- Price Department of National Development and Reform Commission. Compilation of National Agricultural Product Cost-Benefit Data 2020; China Statistics Press: Beijing, China, 2020.
- Tobler, W.R. A Computer Movie Simulating Urban Growth in the Detroit Region. Econ. Geogr. 1970, 46, 234–240. [Google Scholar] [CrossRef]
- Russ, T.C.; Batty, G.D.; Hearnshaw, G.F.; Fenton, C.; Starr, J.M. Geographical variation in dementia: Systematic review with meta-analysis. Int. J. Epidemiol. 2012, 41, 1012–1032. [Google Scholar] [CrossRef] [PubMed]
- Fotheringham, A.S.; Charlton, M.; Brunsdon, C. The geography of parameter space: An investigation of spatial non-stationarity. Int. J. Geogr. Inf. Sci. Syst. 1996, 10, 605–627. [Google Scholar] [CrossRef]
- Pourmohammadi, P.; Strager, M.P.; Dougherty, M.J.; Adjeroh, D.A. Analysis of Land Development Drivers Using Geographically Weighted Ridge Regression. Remote Sens. 2021, 13, 1307. [Google Scholar] [CrossRef]
- Oshan, T.M.; Smith, J.P.; Fotheringham, A.S. Targeting the spatial context of obesity determinants via multiscale geographically weighted regression. Int. J. Health Geogr. 2020, 19, 11. [Google Scholar] [CrossRef]
- Wang, M.; He, G.; Zhang, Z.; Wang, G.; Zhang, Z.; Cao, X.; Wu, Z.; Liu, X. Comparison of Spatial Interpolation and Regression Analysis Models for an Estimation of Monthly Near Surface Air Temperature in China. Remote Sens. 2017, 9, 1278. [Google Scholar] [CrossRef]
- Wu, Z.N.; Di, D.Y.; Lv, C.M.; Guo, X.; Wang, H.L. Defining and evaluating the social value of regional water resources in terms of emergy. Water Policy 2019, 21, 73–90. [Google Scholar] [CrossRef]
- Chen, J.F.; Wang, Q.; Li, Q. A Quantitative Assessment on Ecological Compensation Based on Water Resources Value Accounting: A Case Study of Water Source Area of the Middle Route of South-To-North Water Transfer Project in China. Front. Environ. Sci. 2022, 10, 854150. [Google Scholar] [CrossRef]
- Song, F.; Su, F.; Mi, C.; Sun, D. Analysis of driving forces on wetland ecosystem services value change: A case in Northeast China. Sci. Total Environ. 2021, 751, 141778. [Google Scholar] [CrossRef] [PubMed]
- Dai, X.; Johnson, B.A.; Luo, P.; Yang, K.; Dong, L.; Wang, Q.; Liu, C.; Li, N.; Lu, H.; Ma, L.; et al. Estimation of Urban Ecosystem Services Value: A Case Study of Chengdu, Southwestern China. Remote Sens. 2021, 13, 207. [Google Scholar] [CrossRef]
- Wang, E.; Kang, N. Does life satisfaction matter for pro-environmental behavior? Empirical evidence from China General Social Survey. Qual. Quant. 2019, 53, 449–469. [Google Scholar] [CrossRef]
- Carrasco, L.R.; Nghiem, T.P.L.; Sunderland, T.; Koh, L.P. Economic valuation of ecosystem services fails to capture biodiversity value of tropical forests. Biol. Conserv. 2014, 178, 163–170. [Google Scholar] [CrossRef]
- Kang, N.; Hou, L.; Huang, J.; Liu, H. Ecosystem services valuation in China: A meta-analysis. Sci. Total Environ. 2022, 809, 151122. [Google Scholar] [CrossRef]
- Chen, Y.J.; Yu, Z.R.; Li, X.D.; Li, P.Y. How agricultural multiple ecosystem services respond to socioeconomic factors in Mengyin County, China. Sci. Total Environ. 2018, 630, 1003–1015. [Google Scholar] [CrossRef]
- Jiang, Z.; Sun, X.; Liu, F.; Shan, R.; Zhang, W. Spatio-temporal variation of land use and ecosystem service values and their impact factors in an urbanized agricultural basin since the reform and opening of China. Environ. Monit. Assess. 2019, 191, 739. [Google Scholar] [CrossRef]
- He, Y.H.; Wang, Z.R. Water-land resource carrying capacity in China: Changing trends, main driving forces, and implications. J. Clean. Prod. 2022, 331, 130003. [Google Scholar] [CrossRef]
- Keeler, B.L.; Polasky, S.; Brauman, K.A.; Johnson, K.A.; Finlay, J.C.; O’Neill, A.; Kovacs, K.; Dalzell, B. Linking water quality and well-being for improved assessment and valuation of ecosystem services. Proc. Natl. Acad. Sci. USA 2012, 109, 18619–18624. [Google Scholar] [CrossRef] [PubMed]


| Categories of WESV | Work Mode | Content | Symbol |
|---|---|---|---|
| Provisioning Services Value | Direct supply | Water supply | V1 |
| Indirect supply | Aquatic product | V2 | |
| Material | V3 | ||
| Regulating Services Value | Direct regulation | Hydrological regulation | V4 |
| Water purification | V5 | ||
| Indirect regulation | Climate regulation | V6 | |
| Air regulation | V7 | ||
| Supporting Services Value | Indirect support | Soil conservation | V8 |
| Biodiversity | V9 |
| Provisioning Services | Regulating Services | Supporting SERVICES | |||||
|---|---|---|---|---|---|---|---|
| Material | Hydrological Regulation | Water Purification | Climate Regulation | Air Regulation | Soil Conservation | Biodiversity | |
| Equivalent coefficient (Em) | 0.23 1 | 102.24 1 | 5.55 1 | 2.29 1 | 0.77 1 | 0.93 1 | 2.55 1 |
| 2010 WESV per unit area | 335.15 | 148,979.93 | 8087.23 | 3336.89 | 1122.01 | 1355.16 | 3715.76 |
| 2015 WESV per unit area | 1055.04 | 303.33 | 134,834.65 | 7319.37 | 3020.06 | 1015.48 | 1226.49 |
| 2020 WESV per unit area | 275.92 | 122,650.62 | 6657.97 | 2747.16 | 923.72 | 1115.66 | 3059.07 |
| City | County | 2010 | 2015 | 2020 |
|---|---|---|---|---|
| Yulin | Yuyang | 866.28 | 1071.75 | 1386.48 |
| Shenmu | 3336.85 | 2765.08 | 3237.86 | |
| Fugu | 1294.82 | 900.46 | 1194.77 | |
| Hengshan | 589.99 | 686.95 | 811.72 | |
| Jingbian | 1086.09 | 1070.41 | 1133.69 | |
| Dingbian | 918.33 | 905.37 | 1036.14 | |
| Suide | 264.05 | 249.26 | 235.08 | |
| Mizhi | 114.52 | 119.55 | 125.89 | |
| Jiaxian | 404.83 | 401.90 | 363.29 | |
| Wubu | 161.24 | 147.49 | 143.38 | |
| Qingjian | 340.77 | 309.77 | 317.19 | |
| Zizhou | 54.41 | 64.33 | 77.94 | |
| Subtotal | 9432.18 | 8692.32 | 10,063.43 | |
| Yan’an | Baota | 352.40 | 366.65 | 427.71 |
| Yanchang | 215.76 | 333.62 | 302.61 | |
| Yanchuan | 324.42 | 228.90 | 233.01 | |
| Zichang | 92.63 | 101.52 | 117.77 | |
| Ansai | 126.53 | 161.89 | 152.78 | |
| Zhidan | 234.91 | 251.12 | 270.24 | |
| Wuqi | 281.47 | 319.77 | 345.85 | |
| Ganquan | 213.12 | 202.37 | 183.24 | |
| Fuxian | 507.99 | 468.73 | 542.46 | |
| Luochuan | 221.64 | 221.65 | 274.95 | |
| Yichuan | 96.23 | 96.43 | 129.86 | |
| Huanglong | 15.50 | 21.05 | 24.65 | |
| Huangling | 255.62 | 280.84 | 310.91 | |
| Subtotal | 2938.22 | 3054.54 | 3316.04 | |
| Total | 12,370.42 | 11,746.86 | 13,379.48 | |
| WESVs | Content | 2010 | 2015 | 2020 | |||
|---|---|---|---|---|---|---|---|
| WESVs | Proportion | WESVs | Proportion | WESVs | Proportion | ||
| Provisioning Services | Water supply | 1260.94 | 10.19% | 1963.99 | 16.72% | 3729.11 | 27.87% |
| Aquatic production | 45.08 | 0.36% | 122.14 | 1.04% | 188.06 | 1.41% | |
| Materials | 22.21 | 0.18% | 19.40 | 0.17% | 19.00 | 0.14% | |
| Regulating Services | Hydrological regulation | 9874.52 | 79.83% | 8621.80 | 73.40% | 8444.72 | 63.12% |
| Water Purification | 536.03 | 4.33% | 468.03 | 3.98% | 458.41 | 3.43% | |
| Climate Regulation | 221.17 | 1.79% | 193.11 | 1.64% | 189.15 | 1.41% | |
| Air Regulation | 74.37 | 0.60% | 64.93 | 0.55% | 63.60 | 0.48% | |
| Supporting Services | Soil Conservation | 89.82 | 0.73% | 78.43 | 0.67% | 76.82 | 0.57% |
| Biodiversity | 246.28 | 1.99% | 215.04 | 1.83% | 210.62 | 1.57% | |
| Classification | Influence Factor | Unit | Statistical Test Results |
|---|---|---|---|
| Social and economy | Population | 104 | VIF > 7.5 |
| Population density | person/km2 | VIF < 7.5, significant | |
| Urbanization rate | % | VIF < 7.5, no significant | |
| Per capital GDP | yuan | VIF < 7.5, significant | |
| Gross product of primary industry | yuan | VIF > 7.5 | |
| Water consumption | 104 m3 | VIF < 7.5, significant | |
| Natural environment | Rainfall | mm | VIF > 7.5 |
| NDVI | / | VIF > 7.5 | |
| Forest and grass area | hm2 | VIF > 7.5 | |
| Forest and grass coverage ratio | % | VIF < 7.5, no significant | |
| Proportion of water area | ‰ | VIF < 7.5, significant | |
| Area of soil erosion control | hm2 | VIF < 7.5, no significant |
| 2010 | 2015 | 2020 | ||||
|---|---|---|---|---|---|---|
| OLS | GWR | OLS | GWR | OLS | GWR | |
| R2 | 0.758 | 0.856 | 0.792 | 0.953 | 0.850 | 0.906 |
| Adjusted R2 | 0.709 | 0.789 | 0.751 | 0.915 | 0.820 | 0.865 |
| AICc | 377.181 | 373.591 | 364.539 | 351.095 | 365.338 | 362.201 |
Publisher’s Note: MDPI stays neutral with regard to jurisdictional claims in published maps and institutional affiliations. |
© 2022 by the authors. Licensee MDPI, Basel, Switzerland. This article is an open access article distributed under the terms and conditions of the Creative Commons Attribution (CC BY) license (https://creativecommons.org/licenses/by/4.0/).
Share and Cite
Xiu, Y.; Wang, N.; Peng, F.; Wang, Q. Spatial–Temporal Variations of Water Ecosystem Services Value and Its Influencing Factors: A Case in Typical Regions of the Central Loess Plateau. Sustainability 2022, 14, 7169. https://doi.org/10.3390/su14127169
Xiu Y, Wang N, Peng F, Wang Q. Spatial–Temporal Variations of Water Ecosystem Services Value and Its Influencing Factors: A Case in Typical Regions of the Central Loess Plateau. Sustainability. 2022; 14(12):7169. https://doi.org/10.3390/su14127169
Chicago/Turabian StyleXiu, Yuan, Ni Wang, Fangxu Peng, and Quanxi Wang. 2022. "Spatial–Temporal Variations of Water Ecosystem Services Value and Its Influencing Factors: A Case in Typical Regions of the Central Loess Plateau" Sustainability 14, no. 12: 7169. https://doi.org/10.3390/su14127169
APA StyleXiu, Y., Wang, N., Peng, F., & Wang, Q. (2022). Spatial–Temporal Variations of Water Ecosystem Services Value and Its Influencing Factors: A Case in Typical Regions of the Central Loess Plateau. Sustainability, 14(12), 7169. https://doi.org/10.3390/su14127169