Article

Distribution of Sulfonamide Antibiotics and Resistance Genes and Their Correlation with Water Quality in Urban Rivers (Changchun City, China) in Autumn and Winter

Key Laboratory of Songliao Aquatic Environment Ministry of Education, Jilin Jianzhu University, Changchun 130118, China
*
Author to whom correspondence should be addressed.
Sustainability 2022, 14(12), 7301; https://doi.org/10.3390/su14127301
Submission received: 26 February 2022 / Revised: 20 May 2022 / Accepted: 10 June 2022 / Published: 15 June 2022

Abstract

:
With the extensive use of antibiotics, antibiotics, and antibiotic resistance genes (ARGs), contamination in the water environment is becoming severe in recent years. This study examined the distribution characteristics of sulfonamide antibiotics and resistance genes in the urban section of the Yitong River in autumn and winter. In addition, the correlation between them and water quality parameters was analyzed using Pearson correlation analysis. The surface water from the Yitong River was sampled in September and November for this experiment. The results of 32 samples showed that seven sulfonamides were detected in the surface water and sediments of this reach, and the concentrations were generally at the levels of ng/L and ng/g. The total concentration range was 11–161 ng/L and ND-85.7 ng/g. The concentrations of different antibiotics were similar in autumn and winter, and the concentration of sulfamethoxazole (SMX) was higher than that of other antibiotics. The results of the Risk Quotients (RQs) showed that SMX and sulfadiazine (SDZ) had moderate acute risk to the corresponding sensitive species in river water, sulfapyridine (SPD) and sulfisoxazole (SIZ) had low acute risk, while the rest had no risk. The total bacterial abundance in surface water and sediment was in the range of 104–105 copies/mL and 108–1011 copies/g, respectively. The detection rates of three sulfonamide resistance genes were 100%; the relative abundance was in the range of 10−3–10−1 copies/16S rRNA, and sul1 was the primary resistance gene. The results of correlation analysis showed that there was a significant positive correlation between sulfamethazine (SMZ), sulfathiazole (STZ), and SIZ and water quality indexes such as total nitrogen (TN) and total phosphorus (TP), ammonia nitrogen (NH3-N) and chlorophyll a (Chl-a). The river‘s change of water quality environment could significantly affect the antibiotics’ spatial distribution characteristics and content. The higher the level of nutrients, the higher the concentration of antibiotics. The abundance of sulfa resistance genes was positively correlated with the concentration of sulfa antibiotics. Frequent human activities can increase antibiotic concentration, leading to the production of more resistance genes induced by antibiotics, but the main reason for the formation of resistance genes was not apparent. Therefore, exploring the occurrence and pollution characteristics of antibiotics and ARGs in the environment of the Yitong River Basin in Changchun City and analyzing their sources, transmission, and ecological risks in the environment provided an essential scientific basis for pollution prevention and ecological protection of urban rivers in northern China.

1. Introduction

In recent years, with the extensive use of antibiotics, the water environment antibiotics and resistance genes pollution are increasingly severe, thus, posing a threat to human and aquatic ecological security. Antibiotics are a class of organic substances mainly produced by microorganisms or artificially synthesized and can inhibit or affect the function of microorganisms. Antibiotics are widely used in human medical treatment, animal disease prevention and treatment, animal husbandry, aquaculture, and other fields [1]. However, more than 30% of antibiotics cannot be absorbed by the body and are discharged out of the human body in the form of drug prototypes or metabolites and enter the environment [2]. Studies have shown that antibiotics have been detected in varying degrees in the waters near Hailing Island, South China Sea. Sulfamethoxazole, Salinomycin, and trimethoprim were widely detected in water samples (0.4–36.9 ng/L), and the concentration range of Erythromycin-H2O has been detected in sediments was 0.8–4.8 ng/g. In addition, the concentration range of Erythromycin-H2O detected in Fenneropenaeus penicillatus was 2498–15,090 ng/g [3]. Azithromycin concentrations of 2819 ng/L and 43.2 ng/g were detected in the water and sediment, respectively, of the Leça River in Portugal [4]. Li et al. found that the concentration levels of different antibiotics in different media were different in Baiyang Lake, China: sulfonamides were the main antibiotics in the water body, and their concentration range was 0.86–1563 ng/L. In sediments and aquatic plants, quinolone antibiotics account for the majority, with the concentration range of 65.5–1166 μg/kg and 8.37–6532 μg/kg, respectively [5]. Human health is closely related to the environment. Antibiotic residues have been detected in water, sediments, animals, and plants, which may stimulate the generation and transmission of antibiotic resistance genes in biological communities, and also lead to the transfer of antibiotic resistance genes from environmental bacteria to human or animal bodies, thus posing a harmful threat [6,7,8]. Antibiotic residues cause chemical contamination in the environment and induce the generation of resistance genes. Antibiotic resistance genes, as new pollutants, can be propagated to the offspring through microorganisms and can be horizontally transferred between bacteria [9]. Compared with antibiotics, they are more harmful and identified by the World Health Organization (WHO) as significant environmental problems in the 21st century [10].
The Yitong River is an important tributary of the Songhua River. It has a section of 48.82 km flowing through the urban area and the north and south of Changchun City. The Yitong River receives the discharge of sewage in the city area. Although part of the sewage is treated before being discharged into the river, the sewage treatment plant is not ideal for removing antibiotics; thus, the river will still be polluted. There have been many studies on the contamination of antibiotics and resistance genes in the water environment. However, the contamination of antibiotics and resistance genes in the water environment of urban rivers in northern China is relatively rare, especially in the water environment of the Yitong River. The environment of the Yitong River belongs to the type of continental semi-humid monsoon climate in the northern temperate zone. Therefore, the change of seasons is noticeable. Especially in autumn and winter, it has a low temperature, slight precipitation, and small runoff. Some studies have shown that the concentration of antibiotics in river water is higher in autumn and winter [11,12]. Therefore, using the detection and analysis of sulfonamide antibiotics, resistance genes, and water quality indicators in the water environment of the Yitong River in autumn and winter, the distribution characteristics and correlation were studied. This provided the basis for environmental management and risk assessment of the Yitong River and provided data and reference for pollution control and ecological protection of Northern urban rivers in China.

2. Materials and Methods

2.1. Standard Samples and Reagent Drugs

The standard samples of seven sulfonamides antibiotics in this study were sulfamerazine (SMZ1), SMZ, sulfamethoxazole (SMX), SIZ, STZ, SDZ, and sulfapyridine (SPD). The standard internal substance used was sulfamethoxazole-d4. All standard products were purchased from the Beijing Tanmo Quality Technology Co., Ltd. (Beijing, China). The purity was ≥98%.
The reagents used in the experiment were chromatographically pure, whiles the drugs were analytically pure. Methanol, acetonitrile, and formic acid were purchased from Thermo Fisher Technology Co., Ltd. (Shanghai, China). Ammonia and ethylenediaminetetraacetic acid disodium (EDTA) were purchased from MACKLIN Company (Shanghai, China), whiles the McIlvaine buffer solution was purchased from Shanghai Yuanmu Biological Technology Co., Ltd. (Shanghai, China). The phosphate buffer solution was purchased from Biosharp Biotech Co., Ltd. (Hefei, China). Furthermore, the experimental water was purified water.

2.2. Study Area and Sample Collection

This study selected the 48.82 km section of the Yitong River through the urban area of Changchun City as the research area and eight spots as sampling points. The sampling points include the Xinlicheng Reservoir, South City-round Expressway Bridge, South-third-ring South Barrier Gate, Rubber Dam of Small Slab Bridge, Free Barrier Gate, Xinghua Barrier Gate, Sihua Barrier Gate, and North Lake Bridge. The sampling point was recorded as S1–S8, and its distribution is in Figure 1. The S1 point was located upstream of the study area, with good water quality, few human populations, a large number of surrounding farmlands, and abundant aquatic plants, which is an important water source and flood control barrier of the city. S2, S3–S7, and S8 points were in the upper, middle, and lower reaches, densely populated, surrounded by many buildings, roads, parks, sluices, drainage outlets, and other facilities. The sampling time was in September and November 2020, which is the alternating season of autumn and winter in the north, with a total of 32 experimental samples. Plexiglas water sampler and Peterson mud sampler were used to collect surface water and sediment samples. Three parallel samples were collected at each sampling point, and the collected samples were refrigerated in ice bags away from light and transported to the laboratory for testing.

2.3. Antibiotic Determination

The water samples collected for antibiotic detection were filtered by a 0.45 µm glass fiber filter membrane, whiles those sampled used for resistance genes and microbial community detection were successively filtered by 0.45 µm and 0.22 µm cellulose acetate filter membranes. The cut filter membranes were put into sterile centrifuge tubes and stored in a −80 °C ultra-low temperature refrigerator for subsequent determination of resistance genes and microbial communities. The water samples used for water quality index detection were stored in a 4 °C refrigerator, and the determination was completed within 24 h. Sediment samples used for antibiotic detection were sieved through 100 mesh after freeze-drying to determine antibiotics. For sediment samples used to detect resistance genes and microbial communities, a sufficient amount of fresh and heavy sediment samples in sterile centrifuge tubes was measured and stored in a −80 °C ultra-low temperature refrigerators for subsequent determination of resistance genes and microbial communities.
The pretreatment of antibiotic detection was carried out by HPLC-MS (3200 Q TRAP LC/MS/MS system, SCIEX) and ESI (point spray ionization source) [13]. With liquid phase conditions, the chromatographic column was InfinityLab Poroshell 120 EC-C18 (2.1 × 100 mm, 2.7-Micron, Agilent, Santa Clara, CA, USA). The flow velocity was 0.4 mL/min. Column temperature: 40 °C; the mobile phase A was 0.2% formic acid water, and the mobile phase B was 40% methanol and acetonitrile. The conditions of mass spectrum in positive ion mode: Curtain Gas (CUR): 35 Psi; Collision Gas (CAD): Medium; ion spray voltage (IS): 5500 V; temperature (TEM): 550 °C; atomized gas (Ion Source Gas1 (GS1)): 55 Psi; Ions Source Gas2 (GS2): 60 Psi.
The concentration of antibiotics was determined by the standard internal method. The standard curves (10–50 μg/L) of each antibiotic showed an excellent linear relationship (R2 > 0.99), which met the requirements of analysis. The recoveries of antibiotics in surface water and sediment were 77.66–98.90% and 75.47–95.30%, respectively. The detection limits were 0.01~0.31 ng/L and 0.01~0.15 ng/g (S/N = 3), and the quantitative limits were 0.03~0.72 ng/L and 0.03~0.45 ng/g (S/N = 10).

2.4. Determination of Antibiotic Resistance Genes

2.4.1. DNA Extraction

Before DNA extraction, water samples and sediment samples were pretreated, respectively. The water samples used for resistance gene detection were filtered through 0.45 μm and 0.22 μm cellulose acetate filters successively, and these filters were cut into pieces and put into sterile centrifuge tubes. For sediment samples of resistance genes, a certain amount of sediment samples was taken and put into sterile tubes. The pretreated water and sediment samples were kept in a −80 °C ultra-low temperature refrigerator for storage. The reagent kit (cat: M5635–02) produced by Omega Company was selected and operated strictly according to the kit’s instructions.

2.4.2. PCR Amplification Experiment

The corresponding resistance gene (sul1, sul2, sul3) and the internal control gene (16S rRNA) of sulfa antibiotics were detected by PCR. The primers used in this study were prepared by Shanghai Personalbio Gene Technology Co., Ltd. (Shanghai, China). The primers sequence, target gene fragment size, and annealing temperature are shown in Table 1.

2.4.3. qPCR Quantitative Experiment

The PCR reaction solution configured according to the reaction system was placed on a Real-time PCR instrument for performing the PCR reaction. The reaction procedure was as follows; predenaturation at 95 °C for 5min; denaturation at 95 °C for 15 s; elongation at 60 °C for 30 s. Then, the cycle from denaturation to elongation was repeated 40 times. All samples were set up with three parallel samples. The ARG standard curve showed a good linear relationship with the correlation coefficient R > 0.996 and the amplification efficiency between 80.80–94.60%, which could calculate each gene‘s copy number and meet the experimental requirements.

2.5. Determination of Water Quality Parameter

The surface water quality parameters such as pH, water temperature (WT), dissolved oxygen (DO), water transparency (SD), chemical oxygen demand (CODCr), TN, NH3-N, TP, and Chl-a were determined according to the “Standard Method of Water and Wastewater Monitoring (Fourth Edition)” issued by the Ministry of environmental protection of the people’s Republic of China [16]. The related detection methods are listed in Table 2.

2.6. Ecological Risk Assessment of Antibiotics

The Risk Quotients method proposed by Hernand et al. was used to evaluate the risk of antibiotics [17]. According to the EU standards, the specific calculation formula is as follows [18]:
RQs = MEC/PNEC
In the formula: MEC is the measured environmental concentration (ng/L), considering the worst risk situation, the maximum concentration as the risk evaluation value is selected; PNEC is the predicted no-effect concentration (ng/L).
PNEC = NOEC/AF = EC50/AF
NOEC is the no observed effect concentration of the most sensitive species (mg/L); EC50 is the concentration for 50% of maximal effect (mg/L); AF is the assessment factor.

2.7. Data Analysis Method

Statistical analysis of all the data was carried out using MS Excel, SPSS, and other software. In addition, the Pearson method was used for correlation analysis, and drawing charts were carried out by origin 2018.

3. Results and Discussion

3.1. Distribution Characteristics of Antibiotics in the Water Environment

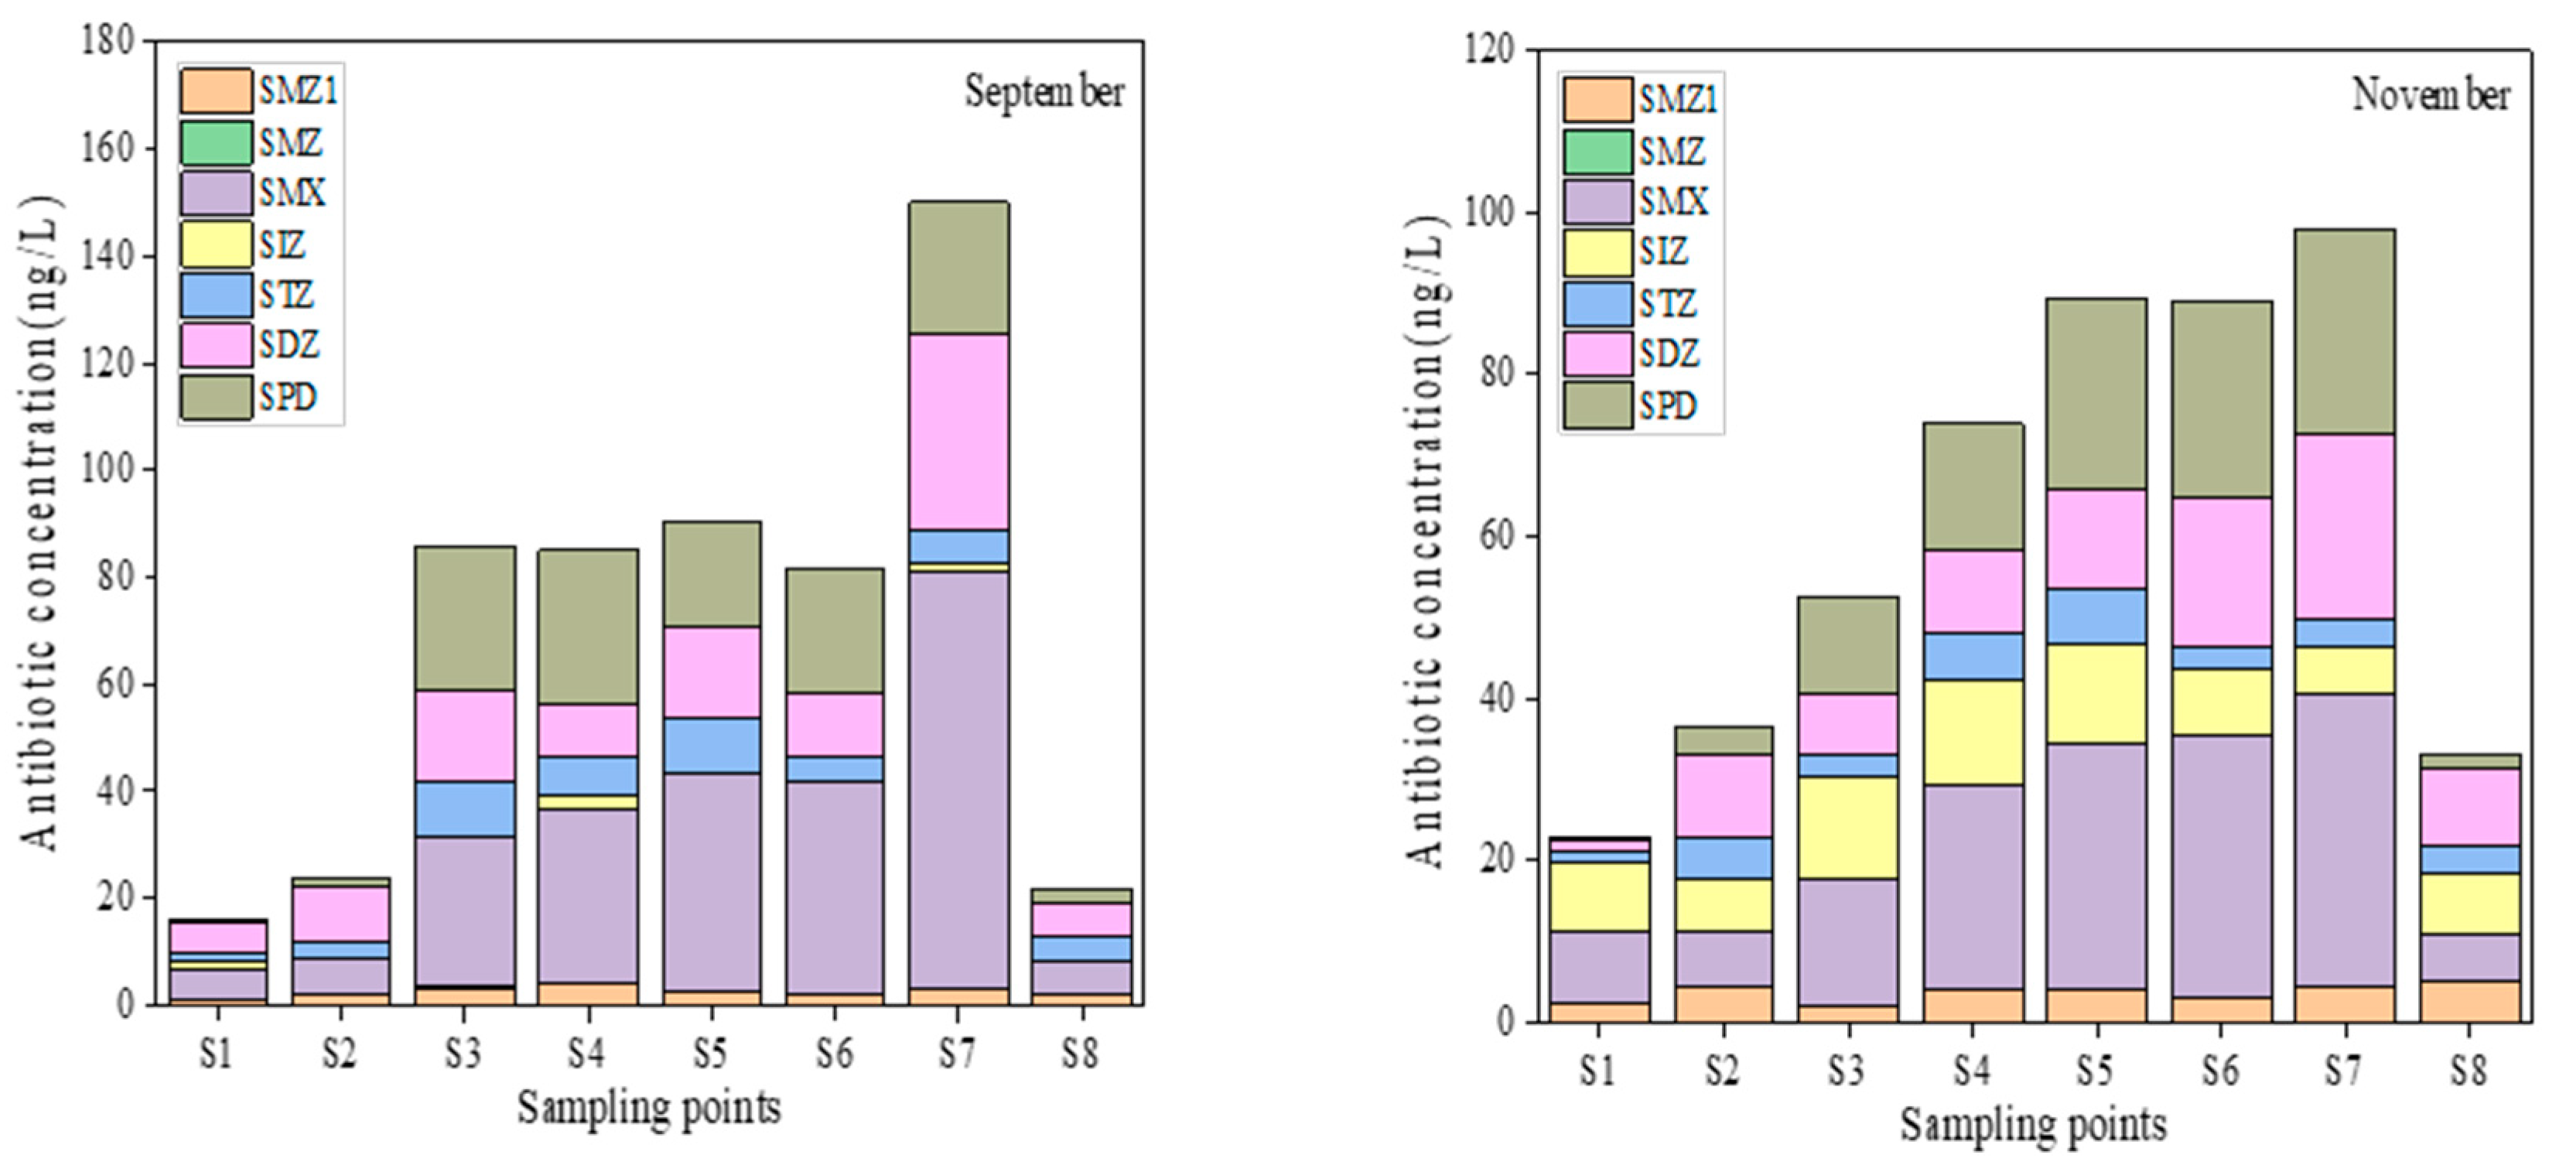
3.1.1. Distribution of Antibiotics in Surface Water

The concentration range and detection rate of antibiotics in surface water are shown in Table 3. In September, the total concentration range was 14.45–160.60 ng/L, the average concentration was 69.26 ng/L, and the detection rate ranged from 13% to 100%. The concentration of SMX was the highest; the range of concentration was 5.50–77.76 ng/L, the average concentration was 29.67 ng/L, and the detection rate was 100%. The detection rates of SMZ (13%) and SIZ (38%) were low, and the detection rates of other species were 100%. In November, the total concentration range of the detection was 11.08–109.34 ng/L, the average concentration was 61.84 ng/L, and the detection rate ranged from 0% to 100%. Among them, the concentration of SMX was the highest, SMZ was not detected, and the detection rate of other species was 100%. Overall, all seven sulfonamide antibiotics were detected, the concentration range was ND-77.76 ng/L, and the total concentration was similar in autumn and winter. SMX was the primary antibiotic species, consistent with previous studies [19]. Due to its unique occurrence characteristics, SMX in water samples produced resistance among microorganisms and persisted in the ecosystem [20]. This section’s SMX concentration in surface water was higher [21]. The low detection rate of SIZ in September and the high rate in November may be due to a source of such antibiotics in the vicinity of the river, which should be taken seriously.
The spatial distribution of antibiotic concentration in the surface water is shown in Figure 2. The total concentration of the S7 site was the highest in September, which was 149.98 ng/L. The concentrations of the S3–S6 sites were high, the range was 81.35–90.30 ng/L, and the rest were low, ranging from 16.06 to 23.64 ng/L. In November, the total concentration of the S7 site was the highest (97.94 ng/L), S4–S6 site concentrations were high, and the range was 73.81–89.37 ng/L; the rest were low, ranging from 22.87 to 52.42 ng/L. Generally speaking, the total concentrations of S1, S2, and S8 points were low; meanwhile, the total concentration of S3–S7 points was high, which may be related to the surrounding environment of the river section. The surrounding of the S3–S7 point was densely populated and had a sewage outlet. While S1 was the outlet of Xinlicheng Reservoir, S2 and S8 were located around parks with a good environment. SMX, SDZ, and SPD concentrations were high, which were the main antibiotics in the reach, indicating that the three antibiotics were primarily used in the surrounding environment. However, the concentration of SIZ at each site was significantly high in November, meaning there was a potential source of this antibiotic around the area.

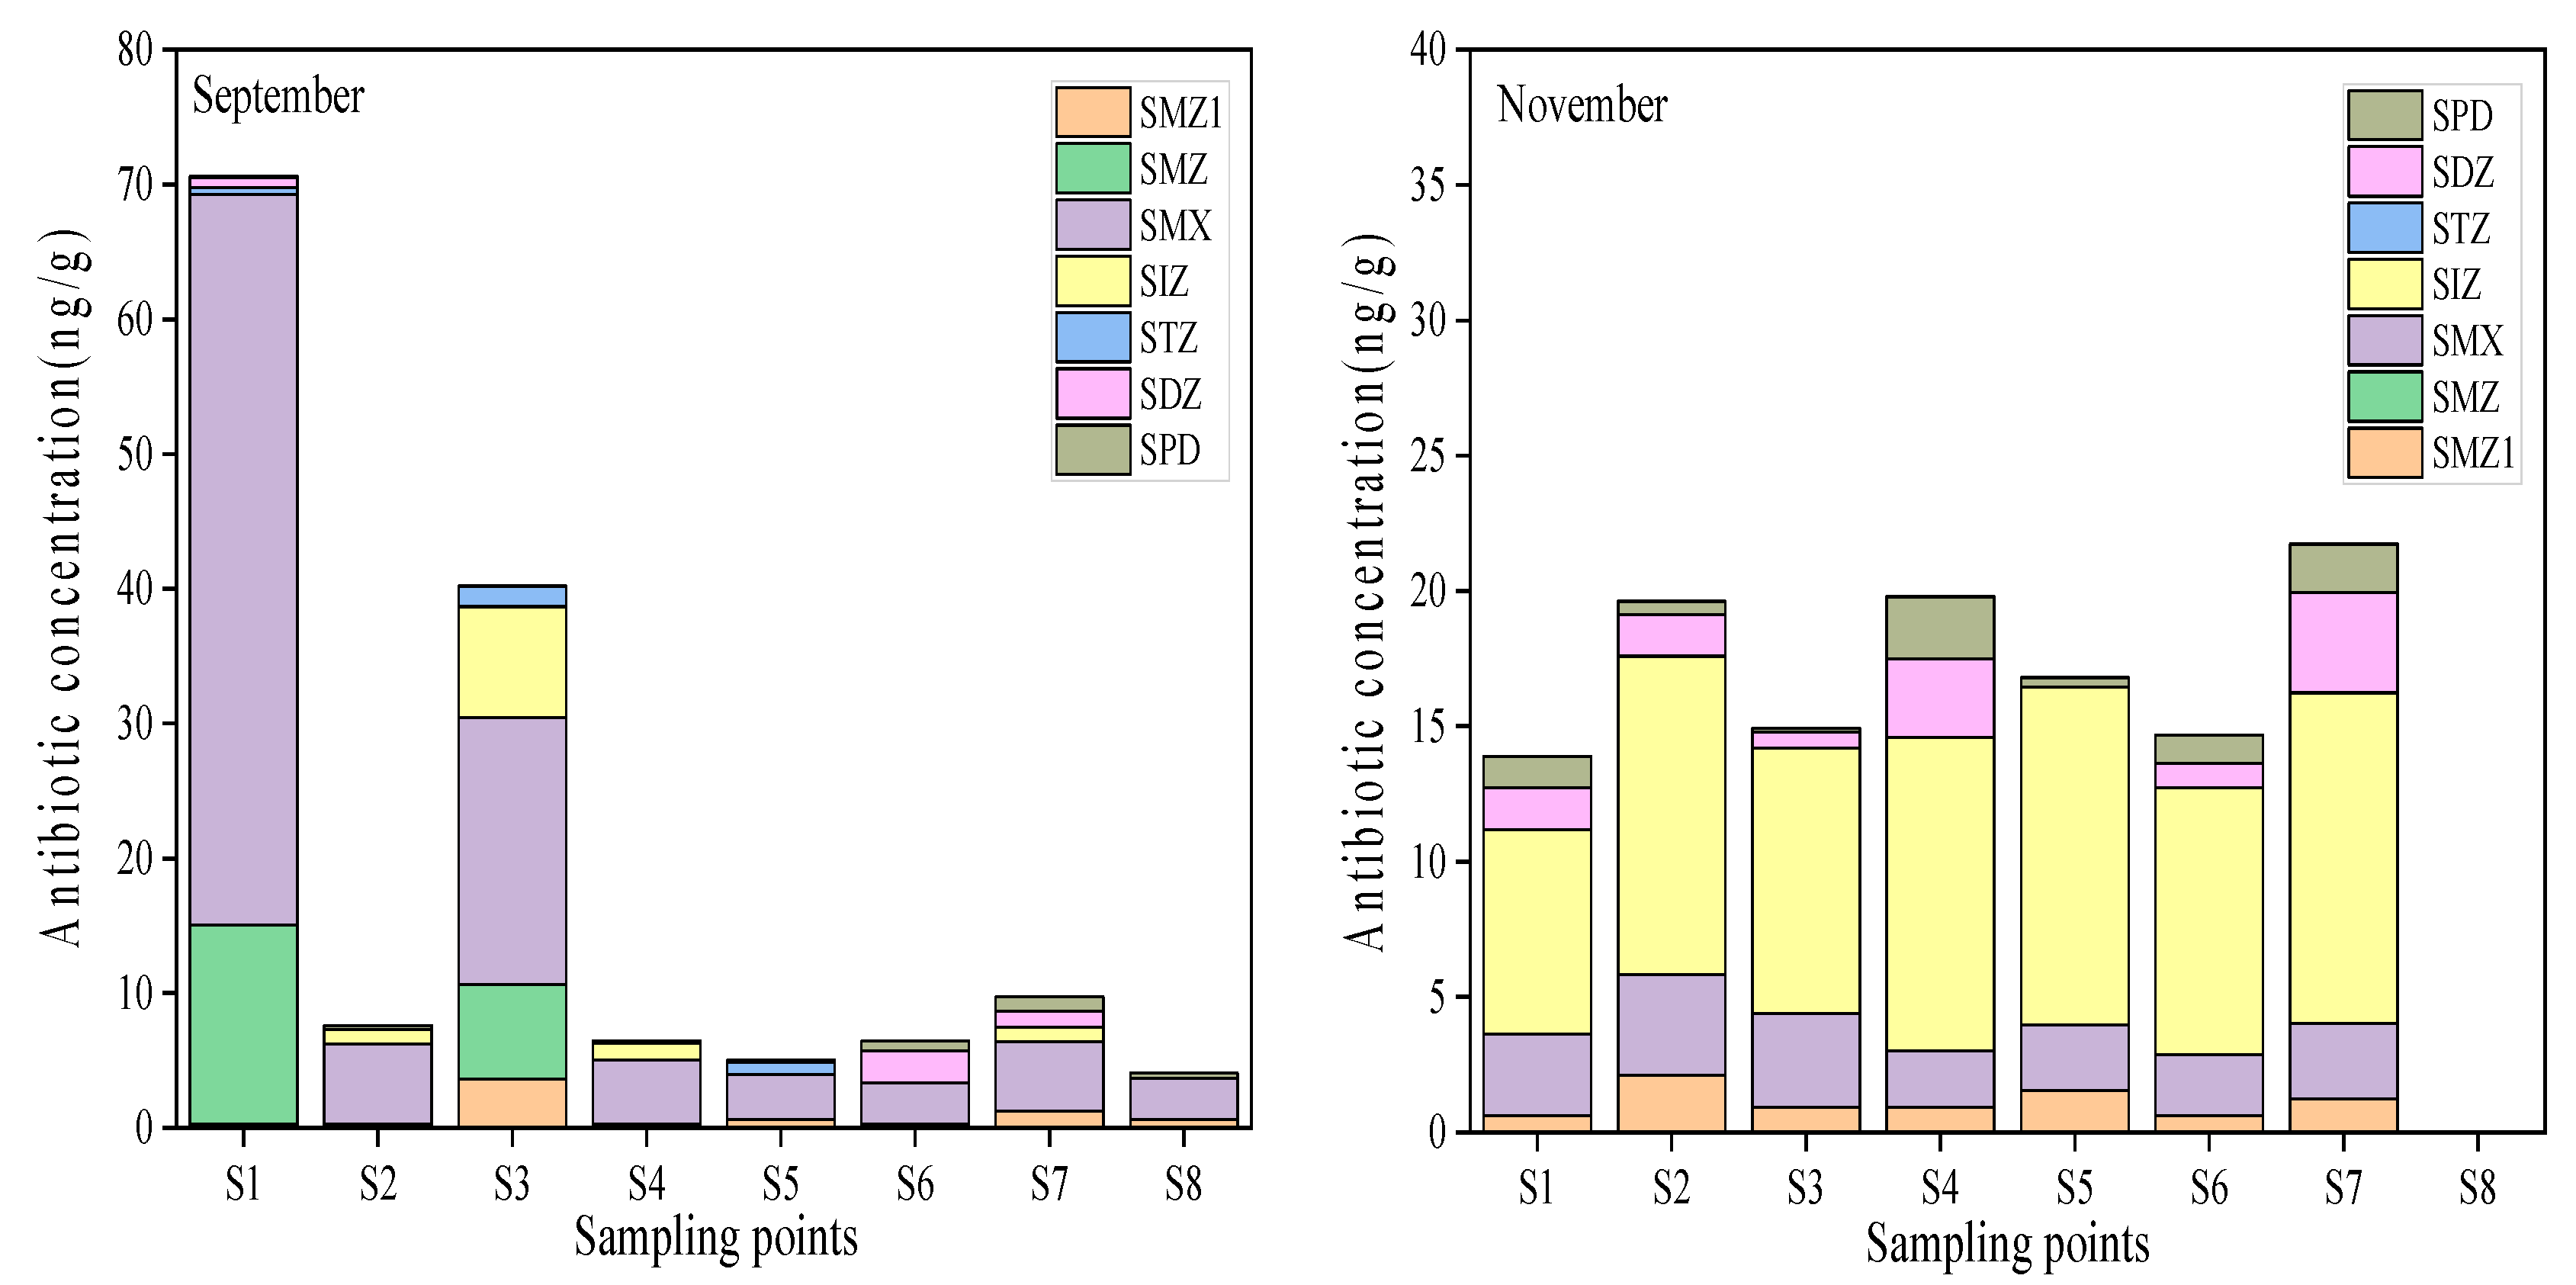
3.1.2. Distribution of Antibiotics in Surface Sediments

The concentration range and detection rate of antibiotics in surface sediments are shown in Table 4. In September, the total concentration ranged from 3.36 to 85.68 ng/g, the average concentration was 18.78 ng/g, and the detection rate ranged from 25% to 100%. SMX was the main component in surface sediment, the same as the main antibiotics in surface water. The concentration ranged from 3.01 to 54.20 ng/g, the average concentration was 12.4 1 ng/g, and the detection rate was 100%. Except for SMZ1 and SPD, the detection rates of other species were lower. The total concentration range of November was ND-24.31 ng/g, the average concentration was 15.17 ng/g, and the detection rate ranged from 0% to 88%, among which the concentration of SIZ was the highest; meanwhile, SMZ and STZ were not detected. Overall, all the seven sulfonamide antibiotics were detected, the concentration range was ND-54.20 ng/g, and the total concentration in autumn and winter was similar. Same as surface water, SMX was the primary type of antibiotic. The concentrations of SMX and SDZ detected in the Yitong River were higher than those in other rivers in northern China.
The spatial distribution of antibiotic concentrations in surface sediments is shown in Figure 3. In September, the total concentration of the S1 site was the highest; thus, at 70.60 ng/g, the S3 site was a higher concentration, 40.21 ng/g. The rest of the site concentration was low, and the range was 4.06–9.70 ng/g. In November, the concentration of each point was low; the range was ND-21.73 ng/g. Generally speaking, SMX was the main antibiotic in September, and SIZ was dominant in November, respectively. Different levels of antibiotic pollution reflected the characteristics of antibiotic use and discharge in the surrounding area of the urban river. The results in Figure 3 show that the antibiotic concentration of most points was low, which indicated that the antibiotic pollution in the surface sediment of this section was relatively light. However, the potential sources of various antibiotics still need to be paid attention to.

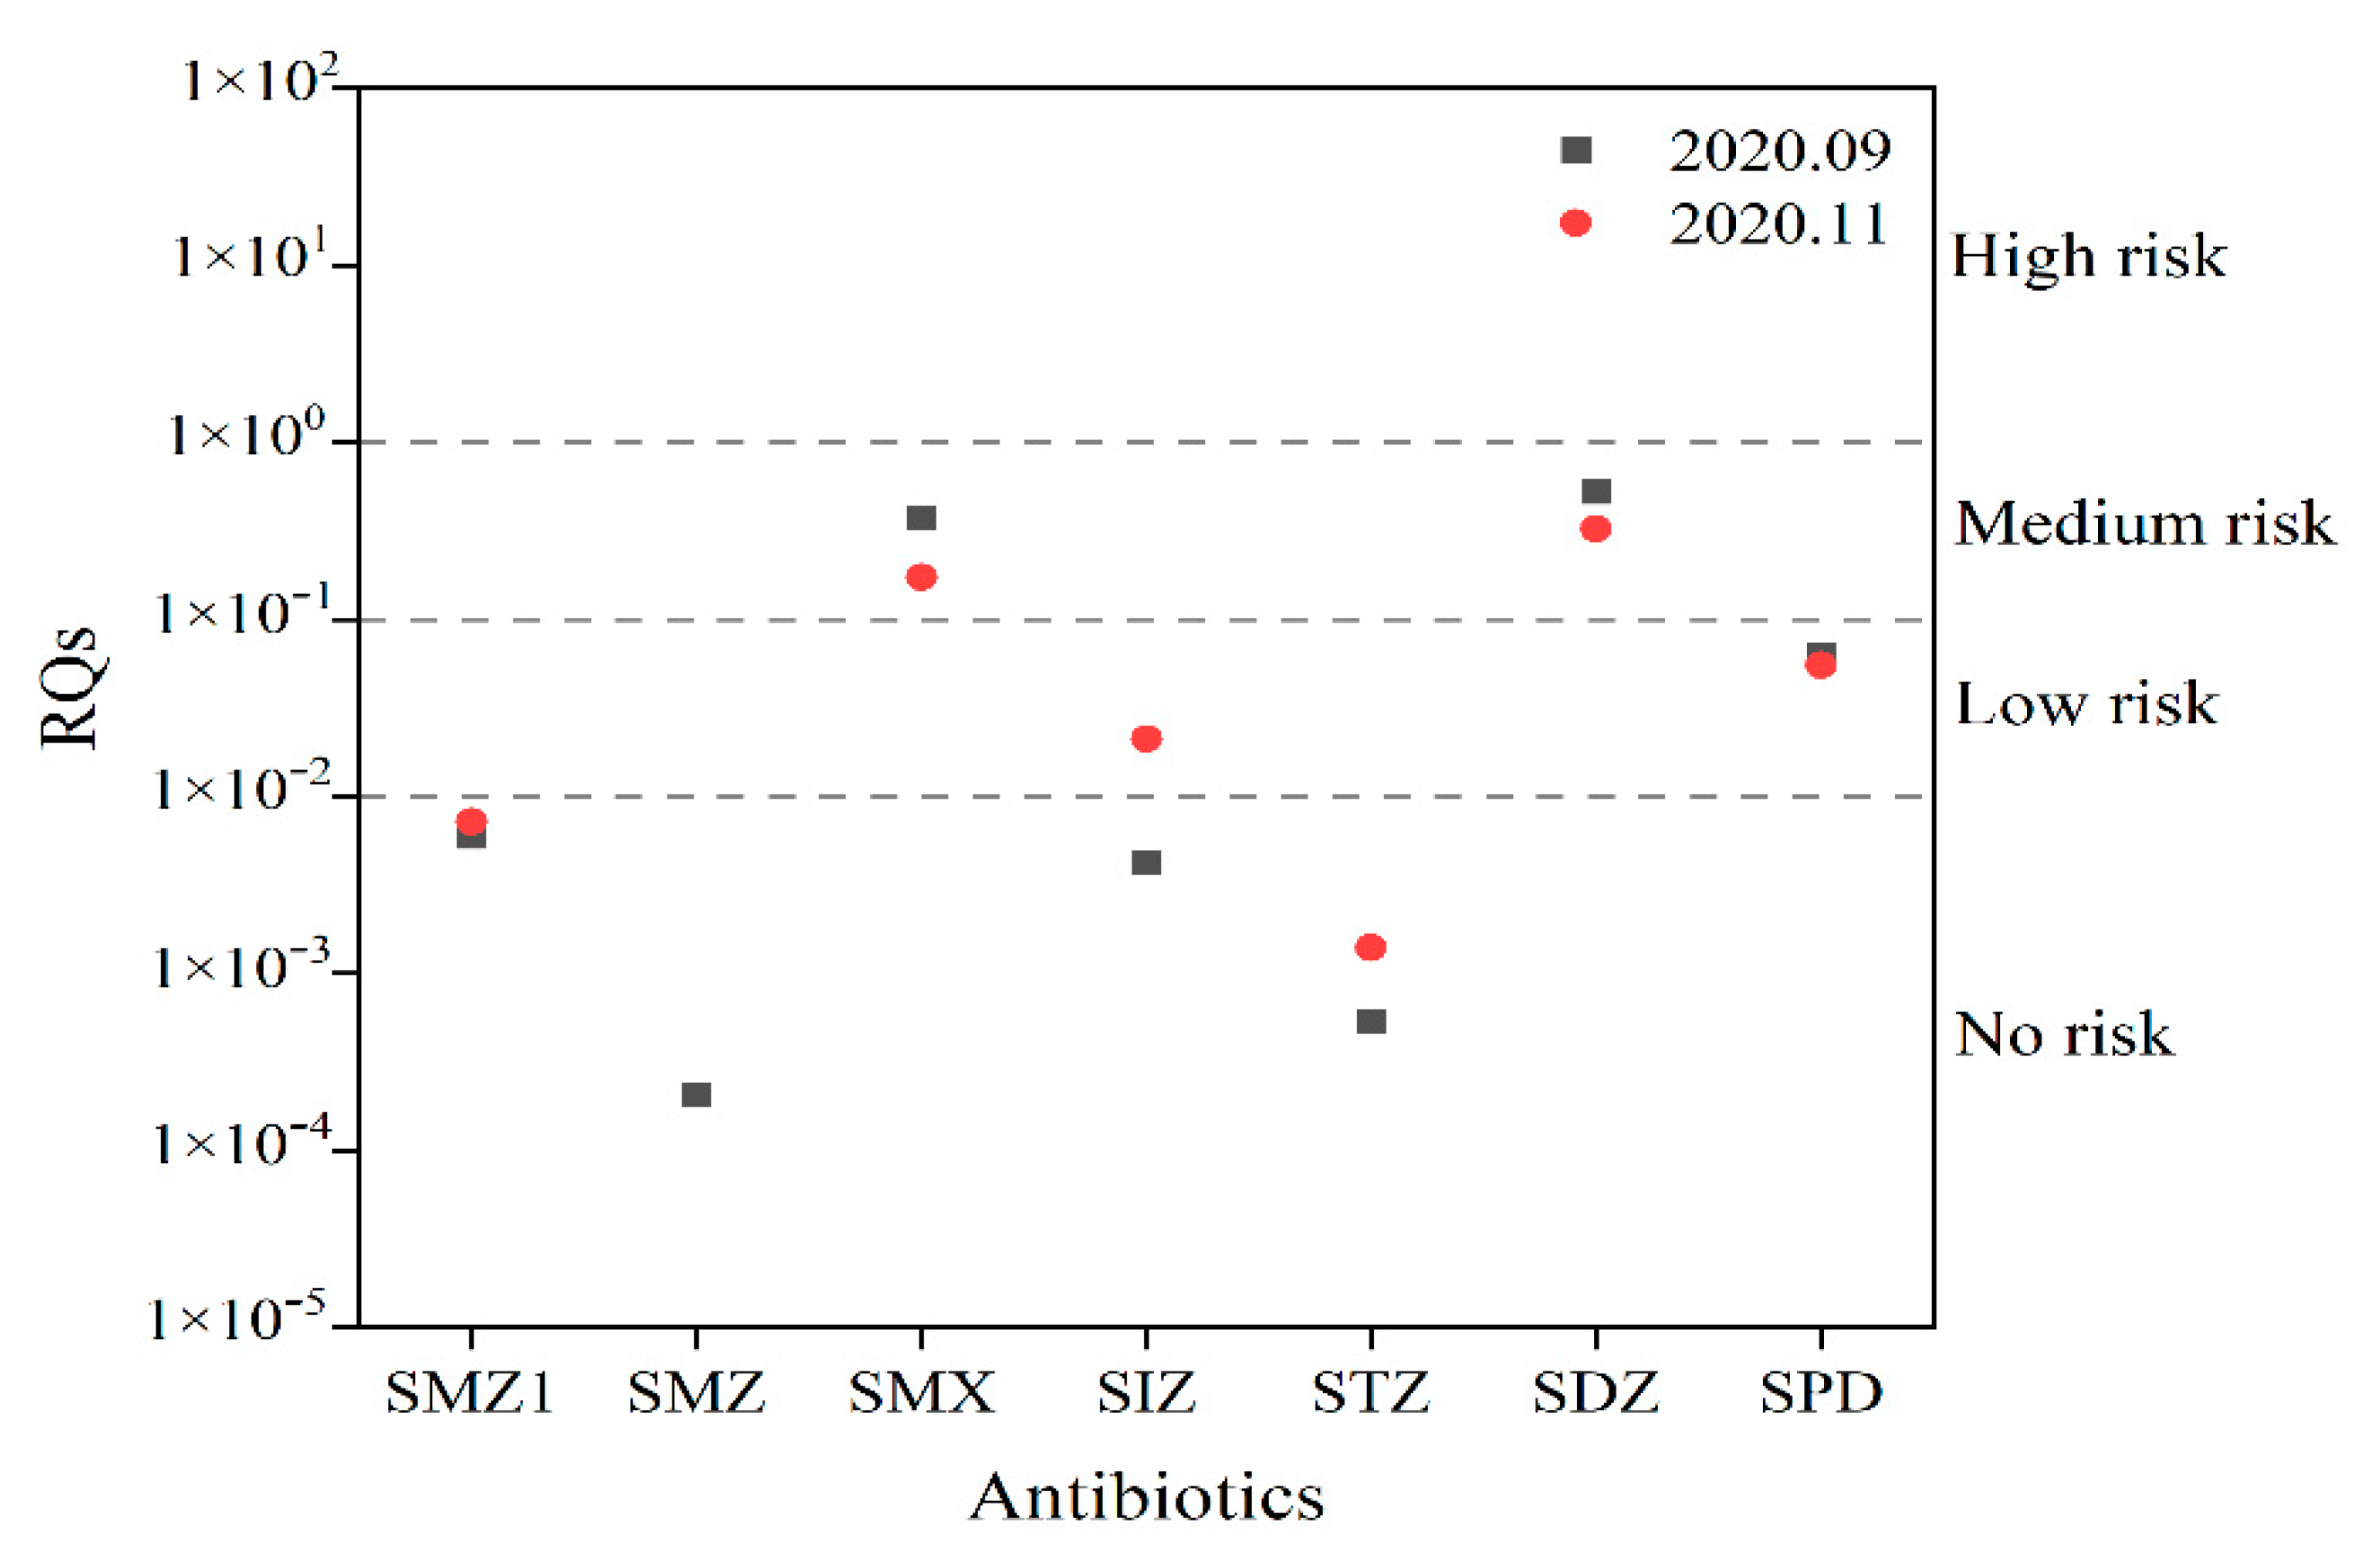
3.1.3. Ecological Risk Assessment

Acute toxicity data were used in this study, where AF was 1000 [22]. The value of PNEC was obtained using the EC50 toxicity data obtained in the literature; details are shown in Table 5 [23]. In addition, according to the RQs classification method proposed by Hernando et al., the risk assessment was divided into four levels: no risk (<0.01), low risk (0.01–0.1), and medium risk (0.1–1), and high risk (>1).
Figure 4 shows the RQs of the target antibiotics in surface water in autumn and winter. The results showed that SMX and SDZ showed moderate acute risk to the sensitive species in river water in September, SPD showed low acute risk, and others showed no risk. In November, SMX and SDZ showed moderate acute risk, SIZ and SPD showed low acute risk, and others showed no risk. Generally, there was a specific problem of antibiotic pollution in the water environment of the target river, but it had not reached the high risk. Therefore, the control and management should be strengthened to reduce the ecological risk.

3.2. Distribution Characteristics of Resistance Genes in the Water Environment

Three sulfonamide resistance genes and 16S rRNA internal control genes in water environment samples were detected in the autumn and winter. The relative quantitative analysis of target gene abundance distribution was used to avoid the difference caused by DNA extraction efficiency and environmental microbial background value [24]. The sampling points were S3, S5, and S7, and the sample names were NW9, ZW9, SW9, NW11, ZW11, and SW11.

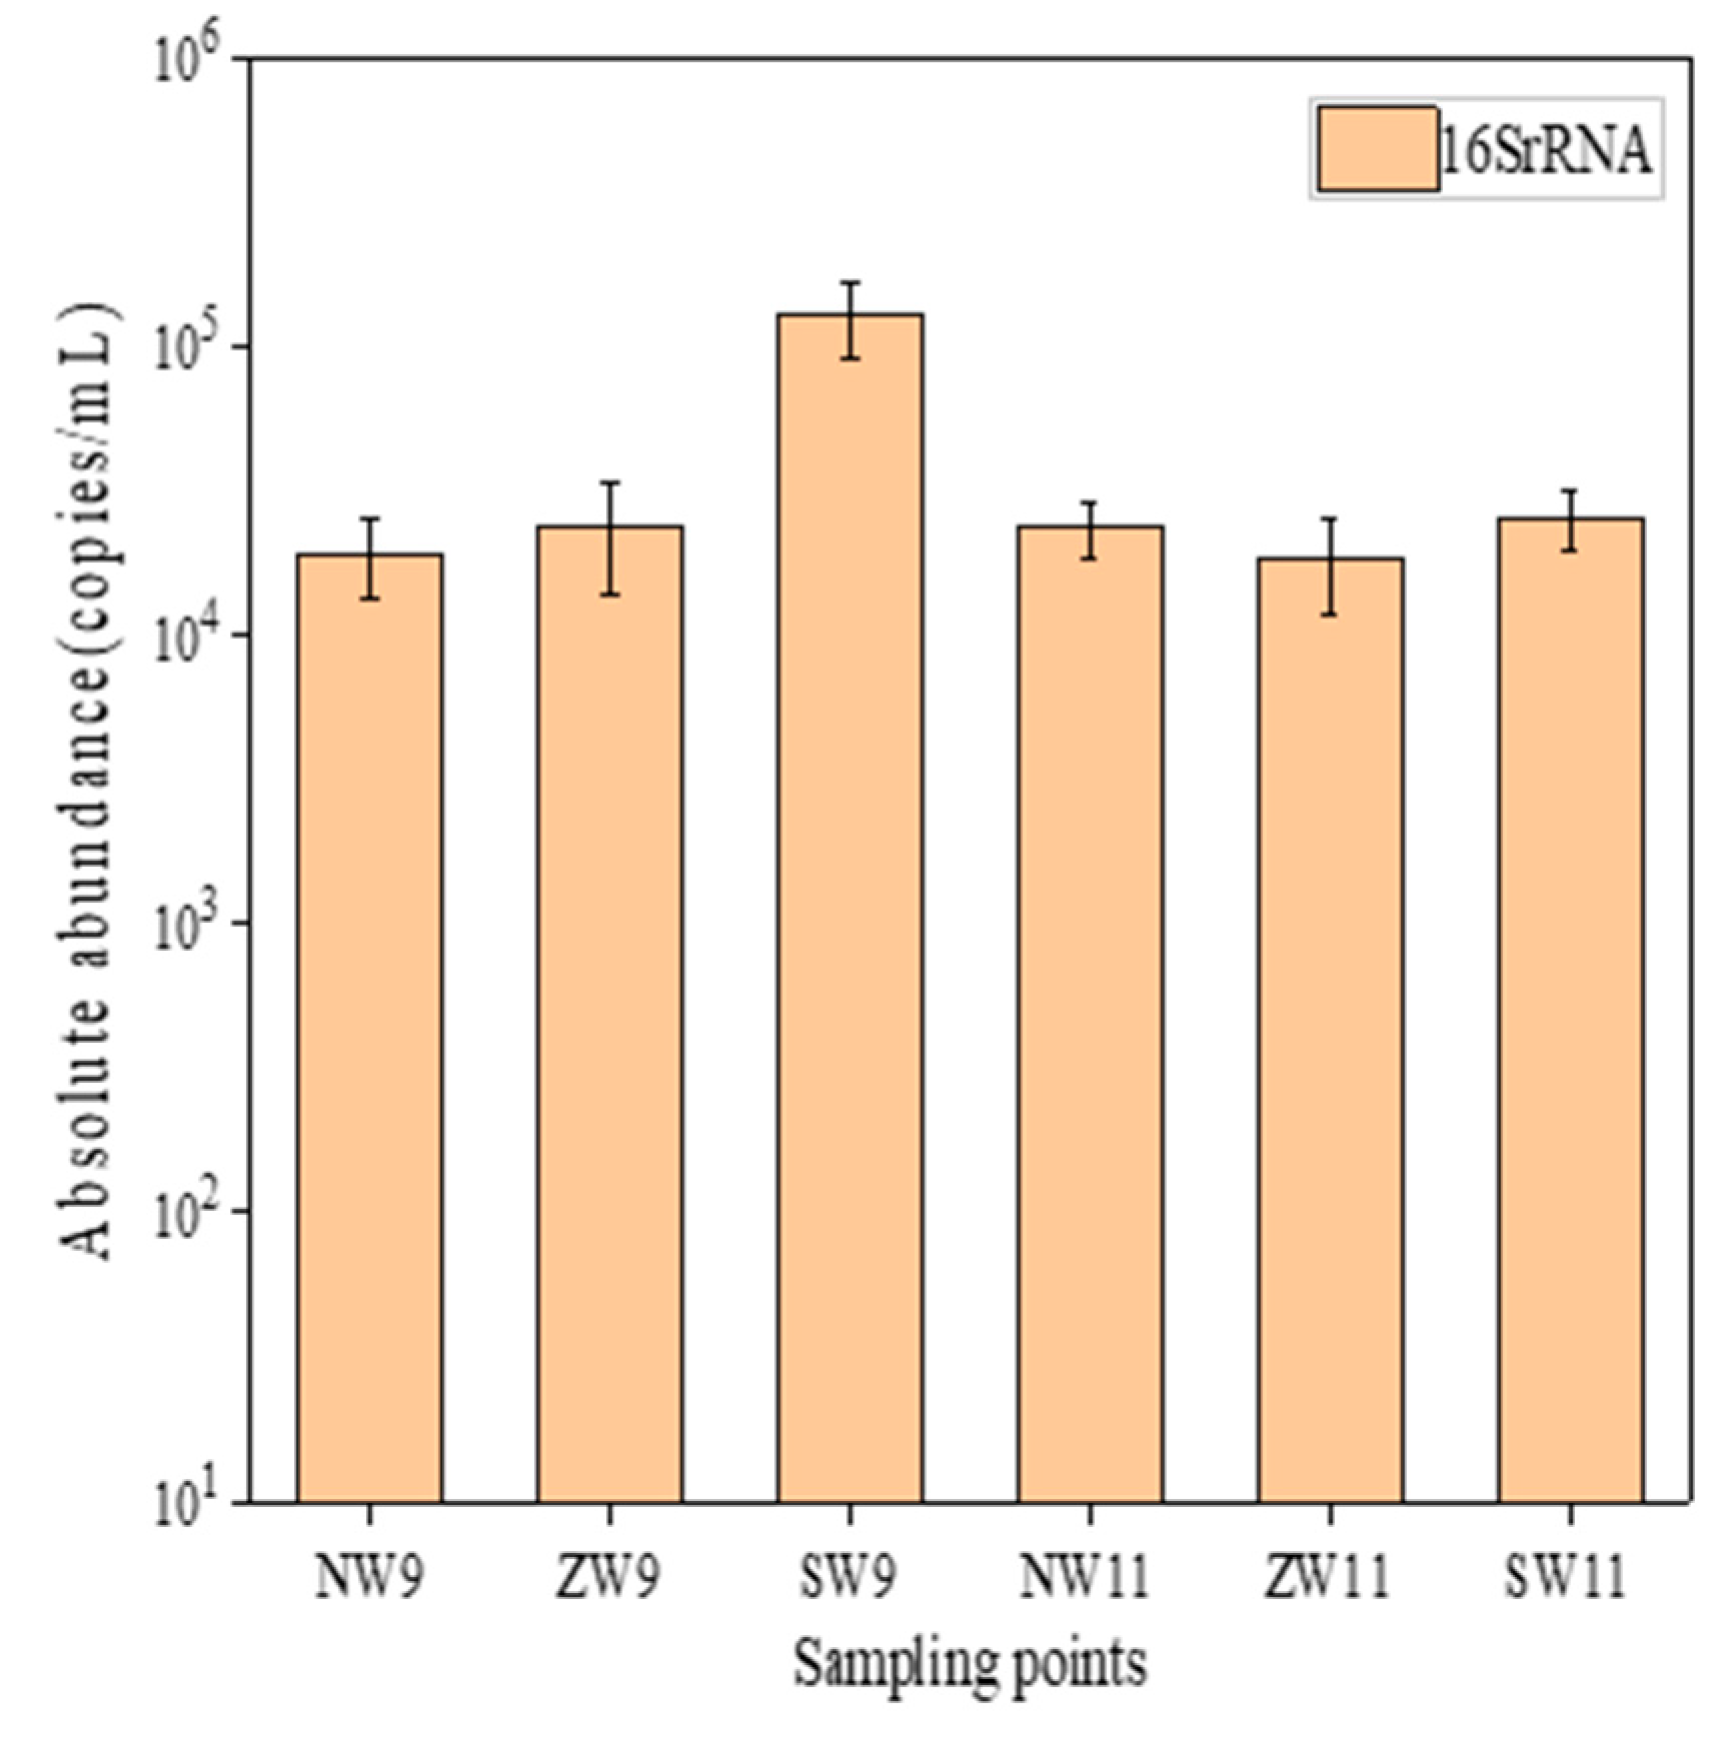
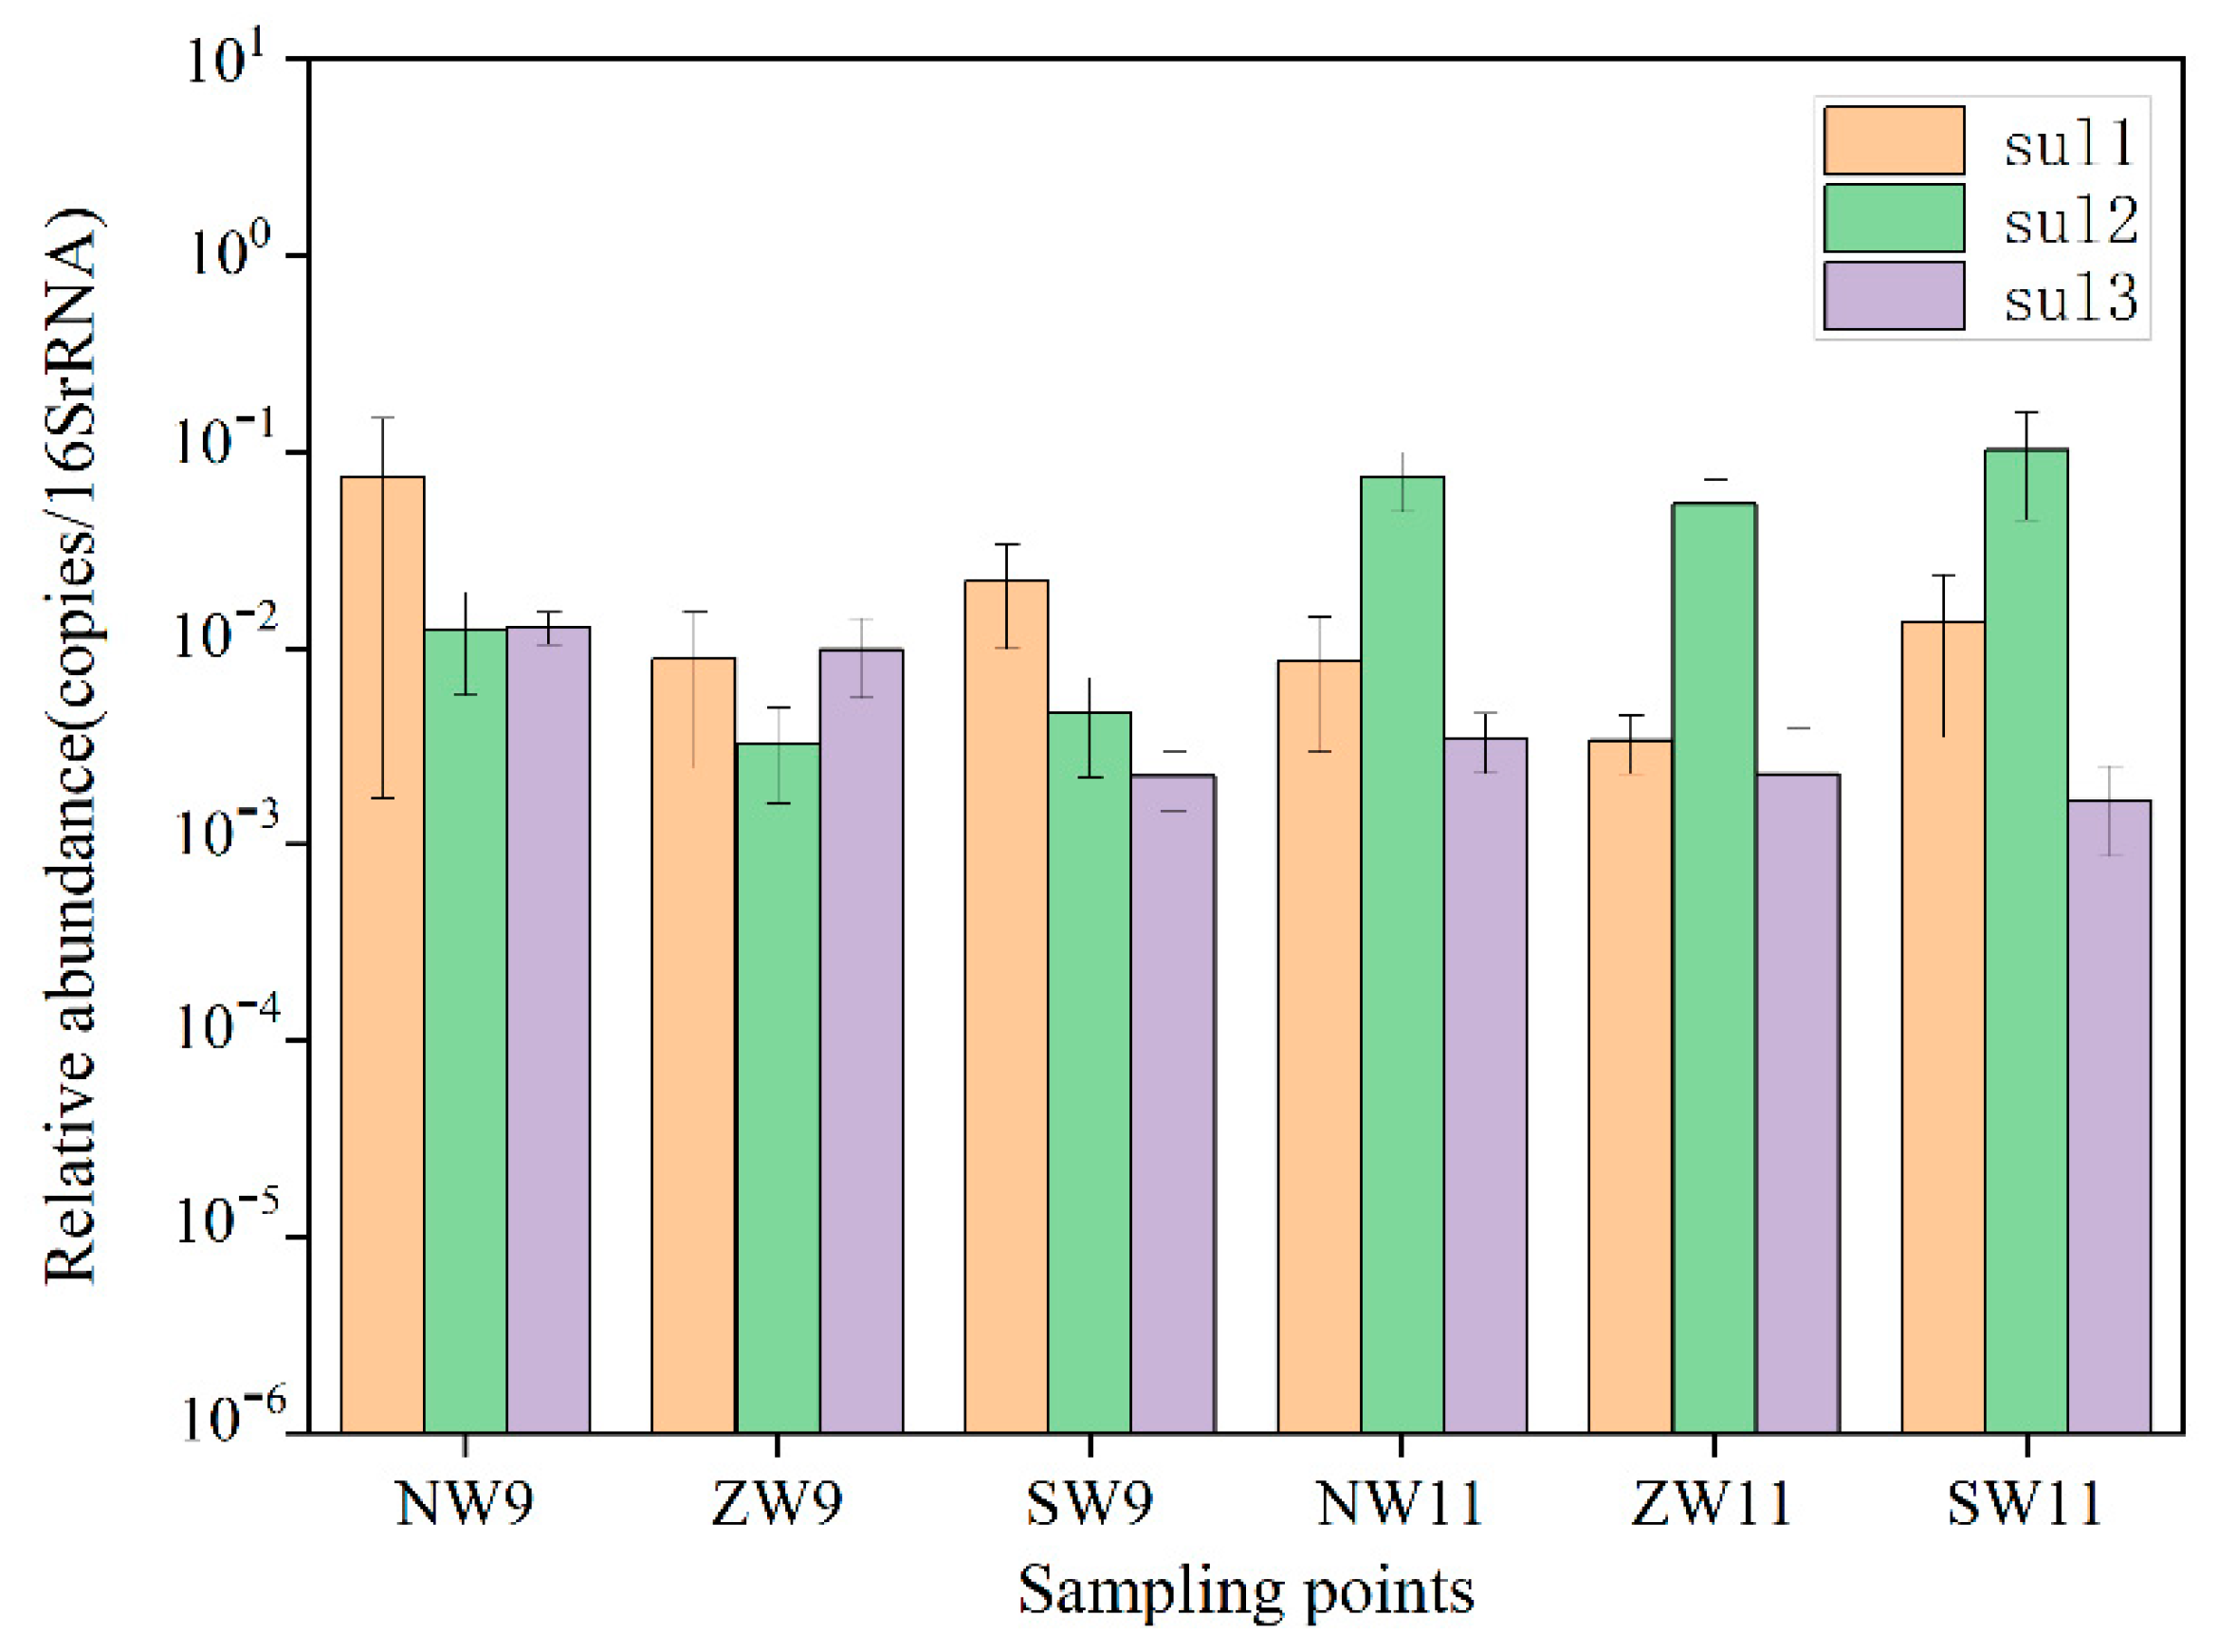
3.2.1. Distribution of Resistance Genes in Surface Water

The absolute abundance of 16S rRNA in the surface water is shown in Figure 5. The absolute abundance range was 1.92 × 10⁴–1.29 × 10⁵ copies/mL in September and 1.87 × 10⁴–2.57 × 10⁴ copies/mL in November. In general, the total bacterial abundance was similar in autumn and winter, in the range of 105–106. The relative abundance of that three sulfonamide resistance genes is shown in Figure 6. The detection rate was 100% in autumn and winter, and the total relative abundance range was 1.43 × 10⁻²–9.98 × 10⁻² copies/16S rRNA in September and 5.91 × 10⁻²–1.19 × 10⁻¹ copies/16S rRNA in November. Overall, sul1 was the main resistance gene in September, and sul2 was the main resistance gene in November. The total relative abundance was similar in the 10−2–10−1 order of magnitude. In terms of temporal distribution, the relative abundance of resistance genes was November (2.63 × 10⁻¹ copies/16S rRNA) > September (1.50 × 10⁻¹ copies/16S rRNA). Again, in terms of spatial distribution, the relative abundance of sites ranged from 10−3–10−2 orders of magnitude in September to 10−3–10−1 orders of magnitude in November. Overall, the relative abundance of each site in autumn and winter was sul2 (2.51 × 10⁻¹ copies/16S rRNA) > sul1 (1.31 × 10⁻¹ copies/16S rRNA) > sul3 (3.23 × 10⁻² copies/16S rRNA). The high detection rate and high abundance level of ARGs indicated that the widespread use of the corresponding types of antibiotics around the river and other human activities and pollution source distribution had caused some environmental risks in the region [25]. Many people live around these three sites and drainage ports, hospitals, and other construction facilities. Therefore, they received sewage treatment plants, hospitals, and domestic sewage discharge, resulting in strong ARGs pollution.

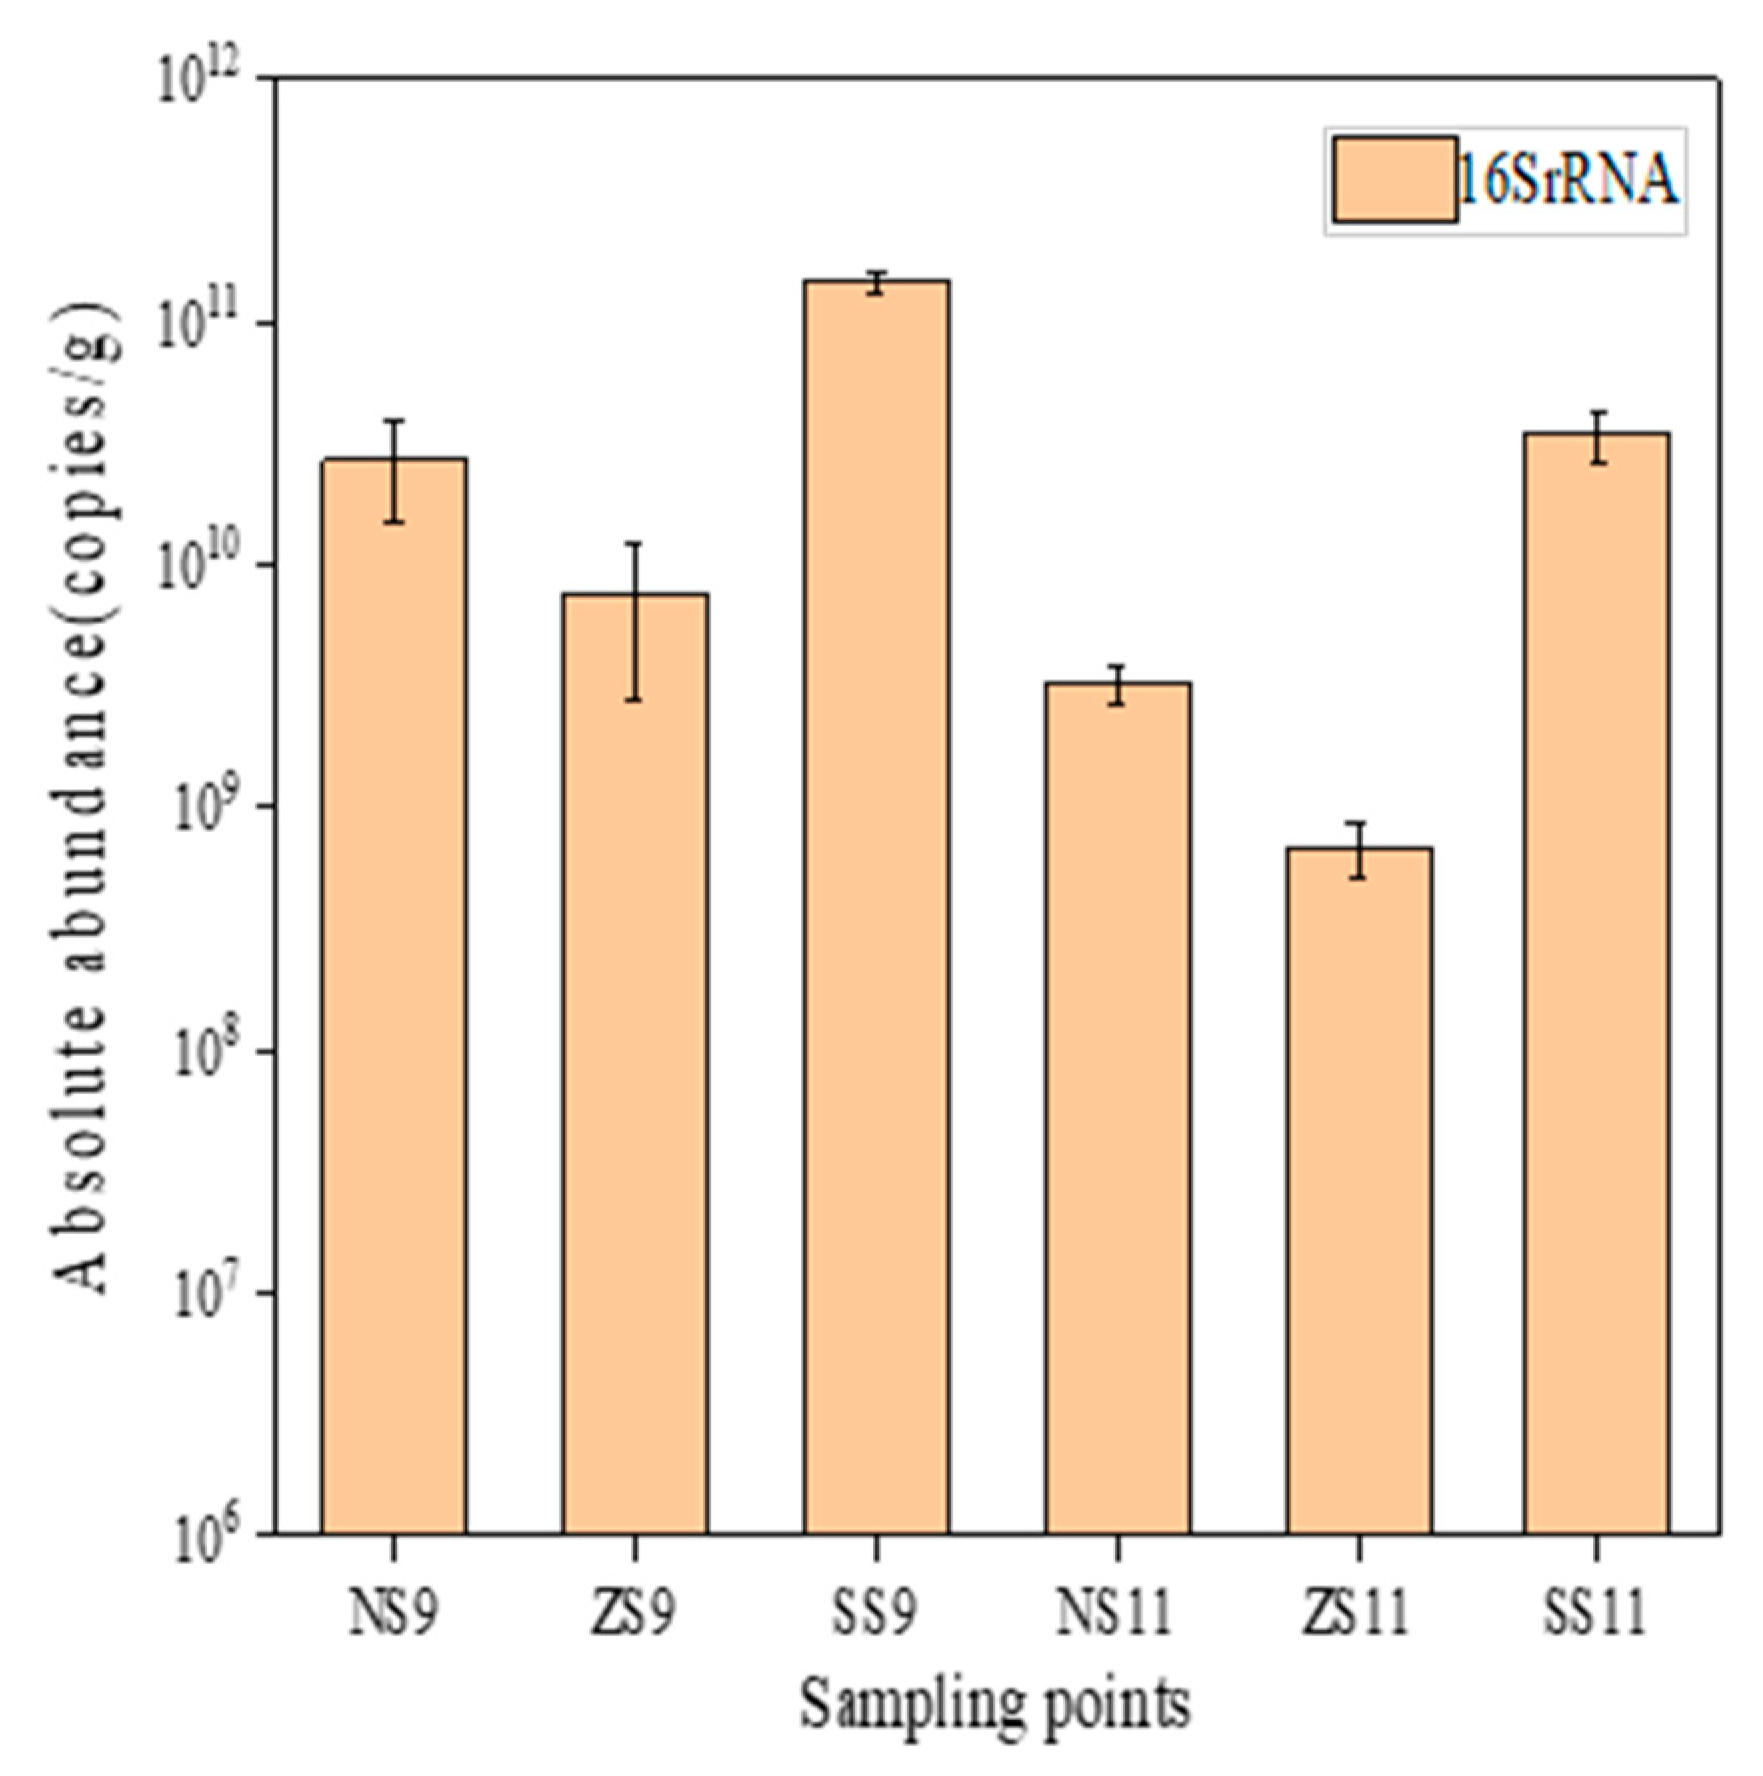
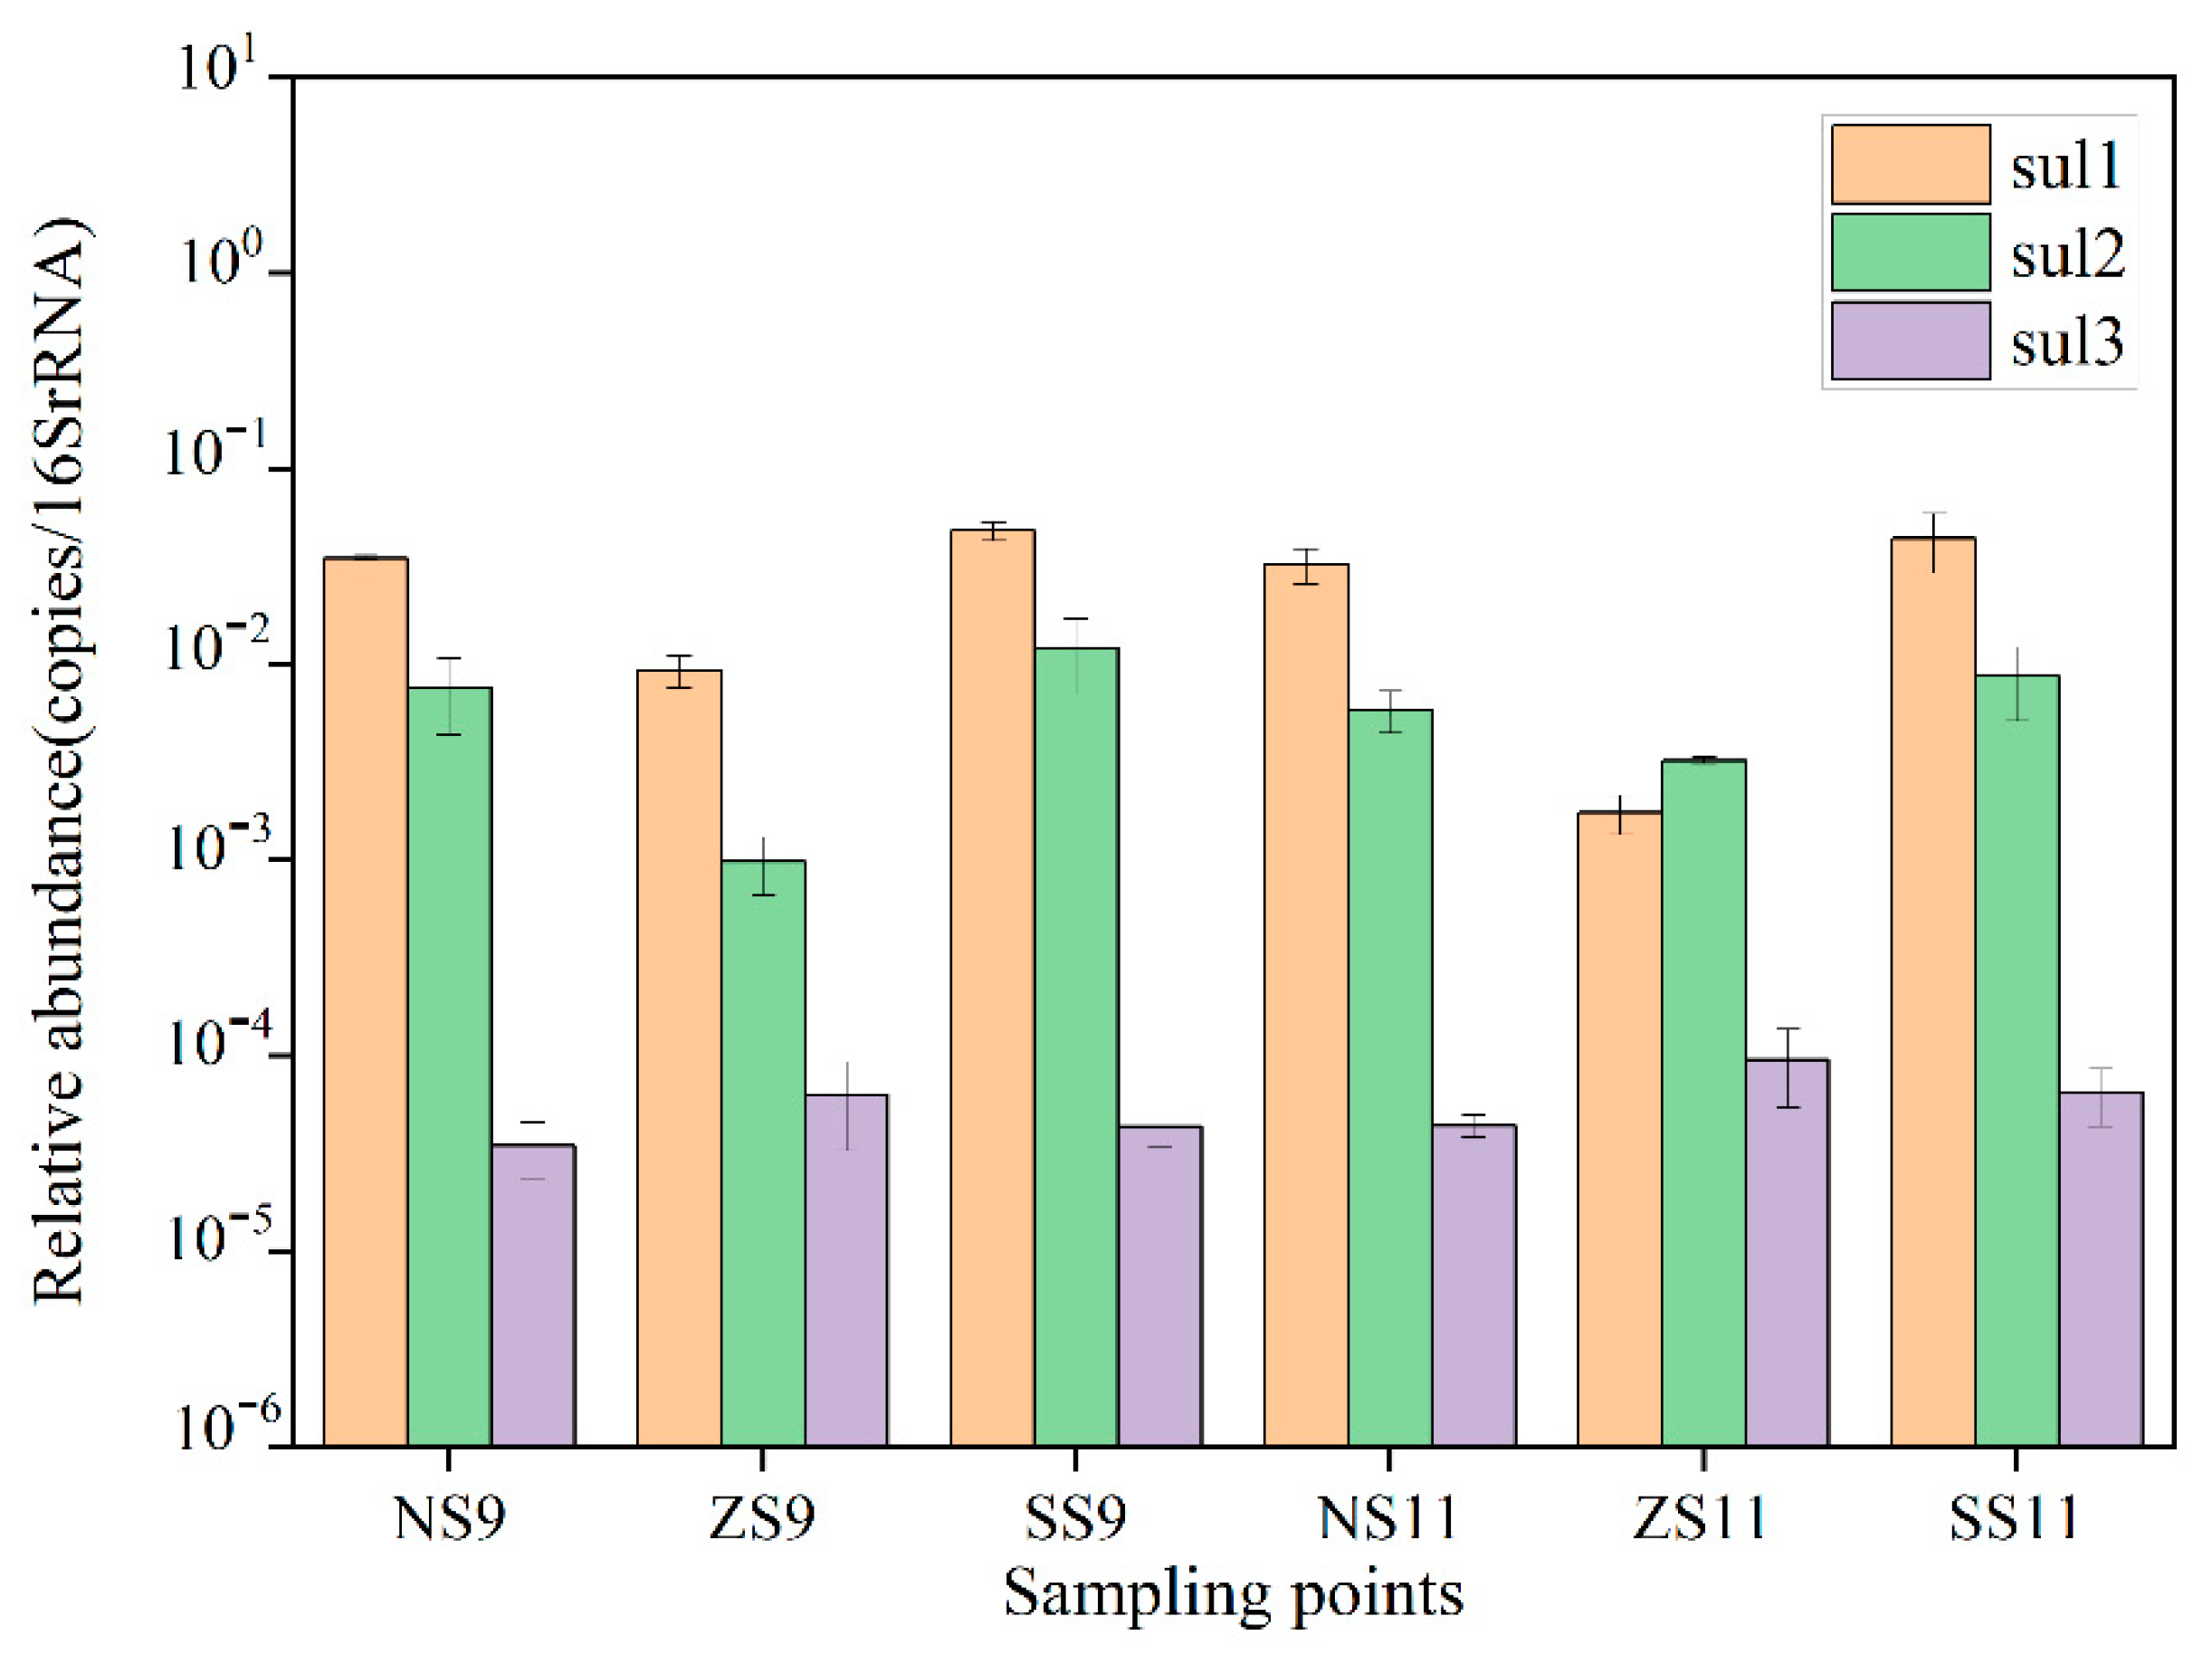
3.2.2. Distribution of Resistance Genes in Surface Sediments

The absolute abundance of 16S rRNA in surface sediments is shown in Figure 7. The absolute abundance range of 16S rRNA was 7.45 × 10⁹–1.45 × 10¹¹ copies/g in September and 6.83 × 10⁸–3.48 × 10¹⁰ copies/g in November. The difference in bacterial abundance between autumn and winter was large, in the range of 108–1011. The relative abundance of that three sulfonamide resistance genes is shown in Figure 8. The detection rate was 100% in autumn and winter, and the total relative abundance range was 1.03 × 10⁻²–6.02 × 10⁻² copies/16S rRNA in September and 5.00 × 10⁻³–5.27 × 10⁻² copies/16S rRNA in November. In general, sul1 was the main resistance gene in autumn and winter, and the relative abundance was similar in the range of 10−3–10−2. Based on temporal distribution, the relative abundance of resistance genes in September (1.13 × 10⁻¹ copies/16S rRNA) > November (9.59 × 10⁻² copies/16S rRNA). In autumn and winter, sul1 was the main resistance gene, and the relative abundance was in the range of 10−2–10−1. In the spatial distribution, the relative abundance of each point in autumn and winter was in the range of 10–5–10−2 orders of magnitude. Overall, the relative abundance of each site was sul1 (1.70 × 10⁻¹ copies/16S rRNA) > sul2 (3.84 × 10⁻² copies/16S rRNA) > sul3 (3.44 × 10⁻⁴ copies/16S rRNA). The high detection rate and high abundance level of ARGs indicated that the resistance gene pollution in the target river was relatively serious. A similar thread was detected in the survey results of resistance genes in surface sediments of many lakes and rivers in the Haihe River Basin and the middle and lower reaches of the Yangtze River. Therefore, indicating that the surface sediments of many lakes and rivers in China have become an important reservoir of resistance genes [26,27].

3.3. Correlation Analysis between Antibiotic and Resistance Gene

As the antibiotics and resistance genes reservoir, the water environment plays an essential role in their storage and transmission. Studies have found a correlation between antibiotics and resistance genes [28]. The Pearson correlation analysis was used to analyze the correlation between antibiotic concentration and the abundance of the corresponding resistance genes, as shown in Table 6 and Table 7. In surface water, sul1 was significantly negatively correlated with sul2 and positively correlated with sul3, while sul2 was significantly positively correlated with sul3. sul1 and sul3 were significantly positively correlated with SMZ and STZ, sul2 was significantly positively correlated with SIZ and was weakly correlated with other antibiotics. This, thus, indicated that SMZ, STZ, and SIZ promoted the formation of sul1, sul3, and sul2, respectively. SMZ was significantly positively correlated with STZ, and SMZ1 was significantly positively correlated with SPD, which indicated that they had homology with each other. SIZ was significantly negatively correlated with SMZ, STZ, and SPD, while the other antibiotics showed a weak correlation. In the surface sediments, sul1 and sul2 showed a significant positive correlation, which indicated that sul1 and sul2 had some homology.
Meanwhile, sul1 was weakly correlated with all the antibiotics tested, indicating other main influencing factors, such as environmental factors or pollutants, of resistance gene generation apart from corresponding antibiotics in the water environment. sul3 was significantly negatively correlated with SMZ, SMX, and SMZ1, indicating that these antibiotics inhibited the production of sul3. On the other hand, SDZ was significantly positively correlated with SPD and significantly negatively correlated with most antibiotics. In addition, there was a significant correlation between most of the antibiotics, which indicated that they influenced each other immensely. Therefore, it could provide some reference for controlling and managing environmental pollution of sulfonamide antibiotics in urban rivers.

3.4. Correlation between Antibiotic Resistance Genes and Water Quality Parameter

The distribution of antibiotic resistance genes in the water environment is affected by antibiotics and is related to the water quality parameter [29]. Table 8 shows the test data of the water quality parameter of the Yitong River. Furthermore, the correlation analysis results between water quality parameters and antibiotic concentration, and resistance gene abundance are shown in Table 9 and Table 10.
The results of the Pearson correlation analysis showed that the sulfonamide antibiotics and ARGs correlated with the water quality index (correlation was−1.000 **~1.000 **). Table 9 shows that pH had a weak correlation with antibiotics; WT, DO, SD, and CODCr strongly correlated with some antibiotics. TN was significantly positively correlated with SMX, STZ, and SDZ and significantly negatively correlated with SIZ. NH3-N was significantly positively correlated with SMX and SDZ. TP was significantly positively correlated with SMX and SDZ. Chl-a was significantly positively correlated with SMX, STZ, and SDZ and significantly negatively correlated with SIZ. Therefore, it was concluded that the nutrient greatly affected the antibiotics in the water environment. Yang Shangle et al. found that sulfonamides, macrolides, and fluoroquinolones were positively correlated with ammonia nitrogen and total phosphorus in the Songhua River Basin [30]. Antibiotics usually go through transformation processes such as adsorption, hydrolysis, photolysis, and biodegradation in the water environment. Therefore, water quality indicators such as pH, WT, DO, and CODCr in the water environment may substantially impact the degradation of antibiotics. However, there are few studies in this field, so it is necessary to strengthen the investigation and research in this field. In addition, it highlights the need for an in-depth analysis of the distribution and transformation of antibiotics in the environment. Table 10 shows that sul1 was not associated with all the water quality parameters; sul2 was significantly positively correlated with pH and CODCr, and significantly negatively correlated with WT and TN. sul3 was significantly negatively correlated with pH and CODCr. In addition, the correlation between water quality parameters and resistance genes was weak, which indicated that water quality parameters had little effect on resistance genes in the water environment of this section of the Yitong River. Therefore, less related research on the variation and migration of ARGs abundance. Consequently, it is necessary to strengthen the related investigation and study of ARGs, which has important significance for the study of sulfa antibiotics and ARGs in rivers.

4. Conclusions

In the urban area of Changchun, the Yitong River has been widely polluted by antibiotics. Seven kinds of sulfonamide antibiotics were detected in surface water and sediment; the concentration was generally at the level of ng/L and ng/g. The total concentration range was 11.08–160.60 ng/L and ND-85.68 ng/g, among which SMX was the primary antibiotic. In autumn and winter, the total concentration of antibiotics was similar, and the pollution was more severe in the dense area of human activity. RQs showed that SMX and SDZ in surface water showed a moderate acute risk to sensitive species in river water in autumn and winter, while SPD and SIZ showed low acute risk and others showed no risk. Generally, there were some problems of antibiotic pollution in the water environment of the target river section. Still, the high risks were not reached, so the control and management should be strengthened to reduce the ecological risks. In autumn and winter, the total bacterial abundance in surface water and sediment was in the range of 105–106 and 108–1011, respectively. The detection rate of all three sulfonamide resistance genes was 100%, the relative abundance was in the order of 10–3–10−1, and sul1 was the primary resistance gene. The results were similar to other watersheds in China, which indicates that the water environment of many watersheds in China has become an essential reservoir for resistance genes.
The correlation analysis results showed a positive, negative, and no correlation among the three resistance genes. Most antibiotics had a weak correlation with resistance genes, indicating other main influencing factors, such as environmental factors or pollutants, of resistance gene generation apart from corresponding antibiotics in the water environment. On the other hand, most antibiotics showed a significant positive correlation, which stated that they were homologous and provided some reference for controlling and managing antibiotic pollution in urban rivers. In addition, nutrients have a more significant impact on antibiotics, while other water quality indicators have a more negligible effect on antibiotics and resistance genes.

Author Contributions

Conceptualization, K.Z. and H.L.; methodology, H.L.; software, C.L.; validation, Q.W.; formal analysis, C.L.; investigation, C.L. and Q.W.; resources, K.Z.; data curation, K.Z.; writing—original draft preparation, K.Z.; writing—review and editing, H.L.; visualization, H.L.; supervision, H.L.; project administration, K.Z.; funding acquisition, K.Z. All authors have read and agreed to the published version of the manuscript.

Funding

This work was supported by the Key R&D Program of the Department of Science and Technology of Jilin Province (NO. 20210203035SF).

Institutional Review Board Statement

Not applicable.

Informed Consent Statement

Not applicable.

Data Availability Statement

Not applicable.

Conflicts of Interest

The authors declare no conflict of interest.

References

  1. Xiong, W.G.; Sun, Y.X.; Zhang, T.; Ding, X.Y.; Li, Y.F.; Wang, M.Z.; Zeng, Z.L. Antibiotics, Antibiotic Resistance Genes, and Bacterial Community Composition in Fresh Water Aquaculture Environment in China. Environ. Microbiol. 2015, 70, 425–432. [Google Scholar] [CrossRef] [PubMed]
  2. Wang, Q.; Duan, Y.J.; Wang, S.P.; Wang, L.T.; Hou, Z.L.; Cui, Y.X.; Hou, J.; Das, R.; Mao, D.Q.; Luo, Y. Occurrence and distribution of clinical and veterinary antibiotics in the faeces of a Chinese population. J. Hazard. Mater. 2020, 383, 121129. [Google Scholar] [CrossRef] [PubMed]
  3. Chen, H.; Liu, S.; Xu, X.R.; Liu, S.S.; Zhou, G.J.; Sun, K.F.; Zhao, J.L.; Ying, G.G. Antibiotics in typical marine aquaculture farms surrounding Hailing Island, South China: Occurrence, bioaccumulation and human dietary exposure. Mar. Pollut. Bull. 2015, 90, 181–187. [Google Scholar] [CrossRef] [PubMed]
  4. Fernandes, M.J.; Paíga, P.; Silva, A.; Llaguno, C.P.; Carvalho, M.; Vazquez, F.M.; Delerue-Matos, C. Antibiotics and antidepressants occurrence in surface waters and sediments collected in the north of Portugal. Chemosphere 2020, 239, 124729. [Google Scholar] [CrossRef]
  5. Li, W.H.; Shi, Y.L.; Gao, L.H.; Liu, J.M.; Cai, Y.Q. Occurrence of antibiotics in water, sediments, aquatic plants, and animals from Baiyangdian Lake in North China. Chemosphere 2012, 89, 1307–1315. [Google Scholar] [CrossRef]
  6. Liang, X.M.; Chen, B.W.; Nie, X.P.; Shi, Z.; Huang, X.P.; Li, X.D. The distribution and partitioning of common antibiotics in water and sediment of the Pearl River Estuary, South China. Chemosphere 2013, 92, 1410–1416. [Google Scholar] [CrossRef]
  7. Liu, X.H.; Zhang, G.D.; Liu, Y.; Lu, S.Y.; Qin, P.; Guo, X.C.; Bi, B.; Wang, L.; Xi, B.D.; Wu, F.C.; et al. Occurrence and fate of antibiotics and antibiotic resistance genes in typical urban water of Beijing, China. Environ. Pollut. 2019, 246, 163–173. [Google Scholar] [CrossRef]
  8. Luo, Y.; Xu, L.; Rysz, M.; Wang, Y.Q.; Zhang, H.; Alvarez, P.J.J. Occurrence and Transport of Tetracycline, Sulfonamide, Quinolone, and Macrolide Antibiotics in the Haihe River Basin, China. Environ. Sci. Technol. 2011, 45, 1827–1833. [Google Scholar] [CrossRef]
  9. Luo, Y.; Mao, D.Q.; Rysz, M.; Zhou, Q.X.; Zhang, H.J.; Xu, L.; Alvarez, P.J.J. Trends in Antibiotic Resistance Genes Occurrence in the Haihe River, China. Environ. Sci. Technol. 2010, 44, 7220–7225. [Google Scholar] [CrossRef]
  10. Rodriguez-Mozaz, S.; Chamorro, S.; Marti, E.; Huerta, B.; Gros, M.; Sanchez-Melsio, A.; Borrego, C.M.; Barcelo, D.; Balcazar, J.L. Occurrence of antibiotics and antibiotic resistance genes in hospital and urban wastewaters and their impact on the receiving river. Water Res. 2015, 69, 234–242. [Google Scholar] [CrossRef]
  11. Yang, J.F.; Ying, G.G.; Zhao, J.L.; Tao, R.; Su, H.C.; Liu, Y.S. Spatial and seasonal distribution of selected antibiotics in surface waters of the Pearl Rivers, China. J. Environ. Sci. Health B 2011, 46, 272–280. [Google Scholar] [CrossRef] [PubMed]
  12. Younesa, H.A.; Mahmoud, H.M.; Abdelrahman, M.M.; Nassar, H.F. Seasonal occurrence, removal efficiency and associated ecological risk assessment of three antibiotics in a municipal wastewater treatment plant in Egypt. Environ. Nanotechnol. Monit. Manag. 2019, 12, 100239. [Google Scholar] [CrossRef]
  13. Wang, N.; Guo, X.Y.; Xu, J.; Kong, X.J.; Gao, S.X.; Shan, Z.J. Pollution characteristics and environmental risk assessment of typical veterinary antibiotics in livestock farms in Southeastern China. J. Environ. Sci. Health B 2014, 49, 468–479. [Google Scholar] [CrossRef] [PubMed]
  14. Zou, S.C.; Zhu, C.J.; He, Z.M.; Luan, T.G.; Xu, W.H.; Zhang, G. Preliminary study on the contamination of antibiotic resistance genes in the water of the Beijiang River. Asian J. Ecotox. 2009, 4, 655–660. [Google Scholar]
  15. Fang, P.; Dai, H.F.; Zhuang, X.; Xie, H.Q.; Luo, W.K.; Ren, M.Z.; Zheng, J. Study on the distribution of antibiotic resistance genes in typical drinking water sources in the lower reaches of Dongjiang River. Asian J. Ecotox. 2019, 28, 548–554. [Google Scholar]
  16. Ministry of Environmental Protection of the People’s Republic of China. Method of Water and Wastewater Monitoring, 4th ed.; China Environmental Science Press: Beijing, China, 2002; pp. 222–231. (In Chinese)
  17. Kovalakova, P.; Cizmas, L.; McDonald, T.J.; Marsalek, B.; Feng, M.B.; Sharma, V.K. Occurrence and toxicity of antibiotics in the aquatic environment: A review. Chemosphere 2020, 251, 126351. [Google Scholar] [CrossRef]
  18. Garnier-Laplace, J.; Copplestone, D.; Gilbin, R.; Alonzo, F.; Ciffroy, P.; Gilek, M.; Agüero, A.; Björk, M.; Oughton, D.H.; Jaworska, A.; et al. Issues and practices in the use of effects data from FREDERICA in the ERICA Integrated Approach. J. Environ. Radioact. 2008, 99, 1474–1483. [Google Scholar] [CrossRef]
  19. Liu, X.; Wang, Z.; Zhang, L.; Fan, W.Y.; Yang, C.; Li, E.H.; Du, Y.; Wang, X.L. Inconsistent seasonal variation of antibiotics between surface water and groundwater in the Jianghan Plain: Risks and linkage to land uses. J. Environ. Sci. 2021, 109, 102–113. [Google Scholar] [CrossRef]
  20. Prasannamedha, G.; Kumar, P.S. A review on contamination and removal of sulfamethoxazole from aqueous solution using cleaner techniques: Present and future perspective. J. Clean. Prod. 2020, 250, 119553. [Google Scholar] [CrossRef]
  21. Chen, Y.; Xie, Q.M.; Wan, J.Q.; Yang, S.; Wang, Y.; Fan, H.M. Occurrence and risk assessment of antibiotics in multifunctional reservoirs in Dongguan, China. Environ. Sci. Pollut. Res. 2020, 27, 13565–13574. [Google Scholar] [CrossRef]
  22. Park, S.; Choi, K. Hazard assessment of commonly used agricultural antibiotics on aquatic ecosystems. Ecotoxicology 2008, 17, 526–538. [Google Scholar] [CrossRef] [PubMed]
  23. Białk-Bielinska, A.; Stolte, S.; Arning, J.; Uebers, U.; Böschen, A.; Stepnowski, P.; Matzke, M. Ecotoxicity evaluation of selected sulfonamides. Chemosphere 2011, 85, 928–933. [Google Scholar] [CrossRef] [PubMed]
  24. Yang, Y.Y.; Cao, X.H.; Lin, H.; Wang, J. Antibiotics and Antibiotic Resistance Genes in Sediment of Honghu Lake and East Dongting Lake, China. Microb. Ecol. 2016, 72, 791–801. [Google Scholar] [CrossRef] [PubMed]
  25. Yang, Y.Y.; Xu, C.; Cao, X.H.; Lin, H.; Wang, J. Antibiotic resistance genes in surface water of eutrophic urban lakes are related to heavy metals, antibiotics, lake morphology and anthropic impact. Ecotoxicology 2017, 26, 831–840. [Google Scholar] [CrossRef]
  26. Dang, B.J.; Mao, D.Q.; Xu, Y.; Luo, Y. Conjugative multi-resistant plasmids in Haihe River and their impacts on the abundance and spatial distribution of antibiotic resistance genes. Water Res. 2017, 111, 81–91. [Google Scholar] [CrossRef]
  27. Yang, Y.Y.; Liu, W.Z.; Xu, C.; Wei, B.Q.; Wang, J. Antibiotic resistance genes in lakes from middle and lower reaches of the Yangtze River, China: Effect of land use and sediment characteristics. Chemosphere 2017, 178, 19–25. [Google Scholar] [CrossRef]
  28. Guo, X.P.; Yang, Y.; Lu, D.P.; Niu, Z.S.; Feng, J.N.; Chen, Y.R.; Tou, F.Y.; Garner, E.; Xu, J.; Liu, M.; et al. Biofilms as a sink for antibiotic resistance genes (ARGs) in the Yangtze Estuary. Water Res. 2018, 129, 277–286. [Google Scholar] [CrossRef]
  29. Li, A.L.; Chen, L.J.; Zhang, Y.; Tao, Y.L.; Xie, H.; Li, S.; Sun, W.L.; Pan, J.G.; He, Z.D.; Mai, C.A.; et al. Occurrence and distribution of antibiotic resistance genes in the sediments of drinking water sources, urban rivers, and coastal areas in Zhuhai, China. Environ. Sci. Pollut. Res. 2018, 25, 26209–26217. [Google Scholar] [CrossRef]
  30. Yang, S.L.; Wang, X.M.; Wang, W.H.; Hu, X.Y.; Gao, L.W.; Sun, X.B. Distribution and Ecological Risk Assessment of Antibiotics in the Songhua River Basin of the Harbin Section and Ashe River. Environ. Sci. 2021, 42, 136–146. (In Chinese) [Google Scholar]
Figure 1. Distribution of sampling points in the Yitong River.
Sustainability 14 07301 g001
Figure 2. The concentration of antibiotics in surface water of the Yitong River.
Sustainability 14 07301 g002
Figure 3. The concentration of antibiotics in surface sediments of the Yitong River.
Sustainability 14 07301 g003
Figure 4. Target antibiotics RQs in surface water.
Sustainability 14 07301 g004
Figure 5. Absolute abundance of 16S rRNA in surface water.
Sustainability 14 07301 g005
Figure 6. Relative abundance of resistance genes in surface water.
Sustainability 14 07301 g006
Figure 7. Absolute 16S rRNA abundance in surface sediments.
Sustainability 14 07301 g007
Figure 8. Relative abundance of resistance genes in surface sediments.
Sustainability 14 07301 g008
Table 1. PCR primers and reaction conditions of a target gene.
ARGsPrimerPrimer Sequence (5′ to 3′) [14,15]Primer LengthAnnealing Temperature
16S rRNA16s-FATGGCTGTCGTCAGCT33760 °C
16s-RACGGGCGGTGTGTAC
sul1sul1-FCGCACCGGAAACATCGCTGCAC16365 °C
sul1-RTGAAGTTCCGCCGCAAGGCTCG
sul2sul2-FTCCGGTGGAGGCCGGTATCTGG19157.5 °C
sul2-RCGGGAATGCCATCTGCCTTGAG
sul3sul3-FTCCGTTCAGCGAATTGGTGCAG14361 °C
sul3-RTTCGTTCACGCCTTACACCAGC
Table 2. Water quality indicator detection methods.
Water Quality IndexDetection Method
pHPortable pH meter
WTThermometer
DOPortable DO instrument
SDSeidel disk method
CODCrRapid determination of COD
TNPotassium persulfate oxidation ultraviolet spectrophotometry
NH3-NNessler reagent spectrophotometry
TPMolybdenum antimony resistance spectrophotometry
Chl-aUltrasonic extraction
Table 3. Antibiotic concentrations in surface water of the Yitong River.
AntibioticsRange (ng/L)Mean (ng/L)Freq (%)
September (n = 8, ng/L)SMZ11.10–4.032.50100%
SMZND–0.360.0513%
SMX5.50–77.7629.67100%
SIZND–2.640.7338%
STZ1.38–10.325.89100%
SDZ5.78–36.7314.50100%
SPD0.69–28.7615.92100%
November (n = 8, ng/L)SMZ11.91–4.883.54100%
SMZND–NDND0%
SMX5.98–36.3120.28100%
SIZND–13.169.27100%
STZ1.49–6.783.90100%
SDZ1.36–22.8011.61100%
SPD0.34–25.4113.24100%
Note: ND means not detected.
Table 4. The concentration of antibiotics in surface sediments of the Yitong River.
AntibioticsRange (ng/g)Mean (ng/g)Freq (%)
September (n = 8, ng/g)SMZ10.31–3.620.92100%
SMZND–14.732.7225%
SMX3.01–54.2012.41100%
SIZND–8.231.4650%
STZND–1.490.3738%
SDZND–2.380.5438%
SPD0.04–1.030.36100%
November (n = 8, ng/g)SMZ1ND–2.121.0088%
SMZND–ND0.000%
SMXND–3.702.4688%
SIZND–12.489.4188%
STZND–ND0.000%
SDZND–3.711.3975%
SPDND–2.300.9188%
Note: ND means not detected.
Table 5. Toxicological data of antibiotics for sensitive species.
AntibioticsSpeciesToxic TypeEvaluation FactorsEC50 (mg/L)PNEC (ng/L)
SMZ1Lemna minoracute10000.68680
SMZLemna minoracute10001.741740
SMXLemna minoracute10000.21210
SIZLemna minoracute10000.62620
STZLemna minoracute10004.894890
SDZLemna minoracute10000.0770
SPDLemna minoracute10000.46460
Table 6. Correlation between antibiotics and resistance genes in surface water.
Sul1Sul2Sul3SMZ1SMZSMXSIZSTZSDZSPD
sul11
sul2−0.4011
sul30.711−0.6051
SMZ10.0370.333−0.351
SMZ0.972 **−0.3470.770.0251
SMX−0.046−0.501−0.2370.196−0.2411
SIZ−0.5650.703−0.6390.037−0.451−0.5211
STZ0.523−0.827 *0.836 *−0.0970.5680.122−0.6881
SDZ0.133−0.365−0.2060.338−0.080.949 **−0.5880.0551
SPD0.497−0.2170.1510.7990.4340.427−0.520.3970.5781
Note: * indicates significant correlation at the level of 0.05, and ** indicates significant correlation at the level of 0.01.
Table 7. Correlation between antibiotics and resistance genes in surface sediments.
Sul1Sul2Sul3SMZ1SMZSMXSIZSTZSDZSPD
sul11
sul20.917 *1
sul3−0.587−0.581
SMZ10.1780.242−0.4061
SMZ0.1710.136−0.4470.955 **1
SMX0.2520.225−0.5370.939 **0.990 **1
SIZ−0.057−0.0150.1850.2580.083−0.0181
STZ−0.128−0.259−0.1610.6550.823 *0.811−0.31
SDZ0.6140.5240.243−0.231−0.309−0.3130.306−0.4691
SPD0.5620.5820.29−0.26−0.385−0.370.177−0.5350.947 **1
Note: * indicates significant correlation at the level of 0.05, and ** indicates significant correlation at the level of 0.01.
Table 8. Water quality parameter data.
IndexMinMaxMean
SeptemberpH7.2398.4047.765
WT (°C)11.919.215.6
DO (mg/L)6.2012.609.86
SD (m)0.151.020.48
CODCr (mg/L)8.2848.9124.46
TN (mg/L)1.526.713.52
NH3-N (mg/L)0.603.581.04
TP (mg/L)0.120.780.31
Chl-a (mg/L)0.184.422.20
NovemberpH7.7919.1168.125
WT (°C)0.04.01.8
DO (mg/L)4.4113.169.38
SD (m)0.100.750.34
CODCr (mg/L)24.8374.5046.18
TN (mg/L)0.472.320.94
NH3-N (mg/L)0.090.330.15
TP (mg/L)0.150.510.27
Chl-a (mg/L)0.090.570.35
Table 9. Correlation between water quality parameter and antibiotic concentration.
SMZ1SMZSMXSIZSTZSDZSPD
pH0.106 −0.256 −0.071 0.448 −0.349 −0.343 −0.041
WT (°C)−0.323 0.301 0.335 −0.862 **0.541 *0.222 0.288
DO (mg/L)0.477 0.300 0.382 0.067 0.433 0.364 0.590 *
SD (m)0.285 0.066 0.554 *−0.228 0.778 **0.465 0.551 *
CODCr (mg/L)0.418 −0.188 0.391 0.596 *0.010 0.420 0.430
TN (mg/L)−0.061 0.313 0.717 **−0.679 **0.622 *0.659 **0.481
NH3-N (mg/L)−0.103 0.049 0.697 **−0.464 0.239 0.729 **0.236
TP (mg/L)0.045 0.045 0.707 **−0.076 0.169 0.788 **0.394
Chl-a (mg/L)−0.165 −0.003 0.765 **−0.579 *0.532 *0.588 *0.478
Note: * indicates significant correlation at the level of 0.05, and ** indicates significant correlation at the level of 0.01.
Table 10. Correlation between water quality parameter and resistance genes abundance.
Sul1Sul2Sul3
pH−0.524 0.827 *−0.920 **
WT (℃)0.551 −0.950 **0.734
DO (mg/L)0.394 −0.021 −0.176
SD (m)−0.262 −0.553 0.250
CODCr (mg/L)−0.684 0.869 *−0.870 *
TN (mg/L)0.430 −0.850 *0.403
NH3-N (mg/L)0.145 −0.594 −0.123
TP (mg/L)−0.026 −0.129 −0.361
Chl-a (mg/L)−0.015 −0.784 0.228
Note: * indicates significant correlation at the level of 0.05, and ** indicates significant correlation at the level of 0.01.
Publisher’s Note: MDPI stays neutral with regard to jurisdictional claims in published maps and institutional affiliations.

