Article

Coupling Coordination between Marine S&T Innovation and the High-Quality Development of the Marine Economy: A Case Study of China’s Coastal Provinces

1
School of Economics, Ocean University of China, 238 Songling Rd., Qingdao 266100, China
2
Institute of Marine Development, Ocean University of China, 238 Songling Rd., Qingdao 266100, China
*
Author to whom correspondence should be addressed.
Sustainability 2022, 14(12), 7373; https://doi.org/10.3390/su14127373
Submission received: 21 April 2022 / Revised: 21 May 2022 / Accepted: 13 June 2022 / Published: 16 June 2022

Abstract

:
Promoting coupling coordination between marine scientific and technological (S&T) innovation and the high-quality development of the marine economy is an important measure to realizing sustainable marine development. Based on the complex adaptive systems theory, sustainable development theory and regional coordinated development theory, this study analyzed the coupling coordination and its influencing factors between marine S&T innovation and the high-quality development of the marine economy with China’s coastal provinces as study areas. The result showed that: (1) The coupling coordination fluctuated upward, changing from on the verge of dissonance to well-coordinated. (2) There was an agglomeration of high-level coupling coordination in central and eastern coastal provinces while the polarization between high-level and low-level coupling coordination was significant. (3) The improvement of coupling coordination mainly depended on the consumption expansion demand, multidimensional spatial integrated development, and industrial improvement demand. Regional heterogeneity of influencing factors existed in southern and northern coastal regions. (4) To improve coupling coordination, we should establish a demand-oriented mechanism for coordinated development between marine S&T innovation and the marine economy, and strengthen the multi-dimensional spatial planning and the guidance and guarantee functions of coastal governments, in particular to introduce and implement policies that suit local conditions. This research may supplement and improve the theoretical discussion and practical experience concerning sustainable marine development.

1. Introduction

The marine environment is a basic component of the global ecology, and it is also an important resource for promoting sustainable development [1]. The sustainable development of the global economy is reliant on incremental marine resources [2]. According to the assessment data of the World Wildlife Fund (WWF) in 2015, the economic value of the marine assets exceeded USD 24 trillion, and more than 500 million people relied on marine and coastal resources to meet their living needs [3,4]. However, frequent marine ecological and environmental events as well as the development gaps between regions and industries have presented multiple challenges for sustainable marine development [5]. In China, economic marine activities have rapidly expanded since the 21st century. The gross marine production (GMP) reached CYN 8 trillion in 2020, but the marine industry remains dominated by traditional industries such as mariculture and the primary processing of aquatic products; this extensive resource development has led to the destruction of marine life, and the uncoordinated development of the regional marine economy has been significant [6]. Therefore, both for China and the world, it is urgent to implement a scientific policy system to achieve sustainable marine development [7]. It is also against this background that Chinese officials have enacted initiatives to promote the high-quality development of the marine economy in a new era [8].
The consensus among theoretical viewpoints has been that scientific and technological (S&T) innovation is a significant engine for economic development [9,10]. Marine S&T innovation is generally regarded as a series of basic research, the development of new technologies, new processes and the application of new services for the purpose of promoting marine development [11]. Promoting marine S&T innovation for the sustainable development of the marine ecology and resources was included in the United Nations 2030 Agenda for Sustainable Development (2030 Agenda) as the 14th goal [12]. The Decade of Ocean Science for Sustainable Development (2021–2030) emphasized expanding investment in marine scientific knowledge and technology [13]. The Ministry of Natural Resources in China also suggested that S&T innovation should play a leading role in the high-quality development of the marine economy [14]. In theory, S&T innovation has optimized the marine industrial structure, improving economic efficiency and providing solutions for ecological and development disparities [15,16,17].
However, the steady development of marine S&T innovation also depends on a sustainable economic environment that provides support and guarantees for capital, manpower, and material supplies [18]. From a practical point of view, there is still a decoupling phenomenon between marine S&T innovation and the sustainable development of the marine economy in many regions. The lack of positive interaction has brought challenges to the realization of the sustainable marine development. Therefore, accelerating the research on the coordinated relationship between marine S&T innovation and the sustainable development of the marine economy has become an urgent topic of common concern to academia and policy makers.
The complex adaptive system theory reveals the interactive relationship between socio-economic subsystems [19,20]. The regional coordinated development theory [21,22,23] and sustainable development theory [24,25] provide direct theoretical support for the establishment of the analysis framework on the coordinated relationship between marine S&T innovation and the high-quality development of the marine economy. Based on the above-mentioned theory and coupling coordination in physics [26], we then constructed a scientific index to evaluate the level of marine S&T innovation and the high-quality development of the marine economy in 11 coastal Chinese provinces from 2006 to 2018, using the coupling coordination model (CCM), spatial analysis methods and panel data model to analyze the spatiotemporal characteristics and influencing factors of coupling coordination and provide strategic suggestions for sustainable marine development.

2. Literature Review

2.1. Research on Marine S&T Innovation

The research on marine S&T innovation has been focused on the following two aspects: the influencing factors and the evaluation of marine S&T innovation [27,28]. Existing studies have suggested that environmental policies have far-reaching impacts on the direction of marine S&T innovation [29,30,31], and the marine economic development and industrial structure have a significant positive impact on the innovative efficiency [32,33]. Sufficient capital investment, an informed political direction [31,34], and a productive, open culture [35,36] are important prerequisites. Institutions that support innovation have a unique role in marine S&T innovation [37]. The entropy weight method (EWM) [38] and the fuzzy comprehensive evaluation (FCE) method [39] have often been implemented for building an evaluation index to analyze the evolution of marine S&T innovations. In addition, similar studies have also used the global Malmquist–Luenberger (GML) index [40], the stochastic frontier analysis (SFA) [41], and data envelopment analysis (DEA) [42].

2.2. Research on the Sustainable Development of the Marine Economy

The specific objectives of sustainable marine development, as stipulated by the 2030 Agenda, include seven aspects concerning marine environmental governance, ecological restoration, orderly development of resources, scientific and regional cooperation, and illegal activity governance. Its implementation includes requirements for S&T innovation and optimized market access [43]. Therefore, the sustainable development of the marine economy can be extended with S&T innovation and regional coordination as a guide, ecological and environment protections as a “bottom line”, international cooperation as the means, and the maintenance of rights and interests as the goal. The high-quality development of the marine economy in China has been largely influenced by the 2030 Agenda [44], which is regarded as an upgraded sustainable development version in line with China’s reality [45,46,47]. The essential feature of high-quality development is the transformation from quantity accumulation to quality accumulation [48], and the realization of the dynamic balance among the economy, the society, resources, and the environment [49]. The high-quality development of the marine economy is committed to realizing the decoupling of growth, resource consumption, and environmental pollution, and to improving the utilization efficiency of marine resources [50,51]. It is usually marked by total factor productivity (TFP) (Total factor productivity (TFP) is developed on the basis of single factor productivity theory. TFP can fully reflect the overall conversion efficiency of system input and output, and objectively reflect the comprehensive macroeconomic benefits of an economic system, which can bring the factors such as invention, technology, organization and management innovation into the scope of quantitative research. It is an appropriate index to measure the quality of economic development) [52] or green total factor productivity (GTFP) [53], and it emphasized the realization and transformation of marine ecological value [54,55,56] and considered scientific spatial planning as a significant guarantee [57,58,59]. As a composite concept integrating comprehensive strength, the industrial structure, social welfare, and the ecological environment [60], the high-quality development level of the marine economy has two measurement paradigms: linear or nonlinear [61]. The linear methods have constructed corresponding indices to measure the comprehensive level [62,63]. The nonlinear methods have relied on data envelopment analysis (DEA) to evaluate the efficiency [64].

2.3. Research on Relationship between Marine S&T Innovation and Marine Economy

The impact of marine S&T innovation has included four perspectives. Firstly, from the perspective of supply improvement, Petty (1672) indicated that the Dutch government’s focus on the S&T innovation of the shipbuilding industry improved its marine freight capacity and played a key role in establishing a global trade network and modern financial system with the East India Company [65]. Jackley et al. (2016) suggested that the development of clam garden aquaculture technology improved the survival rate of clams, which ensured the production and survival of local residents on the central coast of British Columbia [66]. Secondly, from the perspective of cost reduction, Scheidel (2009) suggested that although medieval Rome had failed to implement innovative shipbuilding technology, marginal innovations in navigation speed, loading speed, and crew/cargo ratio reduced the transaction cost of the Mediterranean trade, thus accelerating the formation of the Mediterranean trade network [67]. Thirdly, from the perspective of system building and arrangement, Smith (1776) and Marx (1859) both suggested that the innovation of the steam engine established Great Britain as a leader in establishing industrial advantages, accelerated the establishment of its cross-ocean industrial division system, and catalyzed the transformation from a feudal economy to a capitalist economy [68,69]. Bulmer-Thomas (2006) suggested that marine S&T innovation enabled European travel to Latin American countries and accelerated the establishment of a modern labor system [70]. Fourth, from the perspective of marine environment improvements, Nordhaus (2007) described the interaction between the marine economic system, marine environmental system and the carbon cycle system and suggested that technology could mitigate the impact of economic activities on the marine environment [71]. Holdren (2008) emphasized that technological progress improved productivity and reduced marine resource consumption and environmental impact [72].
The sustainable development of the marine economy and its impact on S&T innovation has three perspectives. Firstly, from the perspective of increasing demand, the sustainable development has increased income levels of marine economic subjects, increased their demand for new products and high-quality services, and promoted technological innovation activities in related fields [73]. Secondly, from the perspective of supply guarantee, the sustainable development of the marine economy has gathered talent, knowledge, and capital, which effectively improved the investment capacity of marine S&T innovation [74]. Thirdly, from the perspective of the innovation environment, S&T innovation is the dynamic response to a country’s resource endowment and economic environment [75], and the sustainable development of the marine economy could improve the directions of marine S&T innovation [76].
In terms of metrological research, Liu et al. (2021) used the threshold regression model (TRM) to explain the role of marine S&T innovation in improving the high-quality development of the marine economy and found that there was a nonlinear relationship between them [77]. Liu et al. (2019) and Zhang et al. (2019) used a multiple regression model to show that marine S&T innovation was the main factor affecting the quality of the marine economy [78,79]. The vector autoregressive model (VAR) [80], the vector error correction model (VECM) [81], the coupling coordination model (CCM) [49], and the gray correlation method [82] have typically been used to analyze the long-term, mutually beneficial relationship between marine S&T innovation and the marine economy.

2.4. Deficiency in Existing Research and Contributions of This Paper

2.4.1. Deficiency of Existing Research

Firstly, research on the sustainable development of the marine economy has not been fully discussed based on China’s version of high-quality development. China’s high-quality development of the marine economy has involved the orderly development of marine resources and ecological protection, as well as establishing requirements for the innovation of the marine industry, the coordination of regional marine development, the openness of the marine economy, and the protection of social groups’ rights and interests. Therefore, building a richer index system under the concept of high-quality development to measure the level of sustainable development of the marine economy and taking China’s coastal areas as a case study could provide a more nuanced theoretical discussion on sustainable development and enrich the understanding of the sustainable development of the marine economy.
Secondly, the existing research has fully discussed the impact of marine S&T innovation on the sustainable development of the marine economy [65,66,67,68,69,70,71,72]. However, the theoretical and empirical research on the interaction and coordination mechanisms between the sustainable development of the marine economy and marine S&T innovation are insufficient. Strengthening the theoretical discussion and providing a case study of marine S&T innovation could highlight the coordinated role of innovation and economy to achieve sustainable marine development. In addition, the research on the evolution characteristics and influencing factors under spatiotemporal perspectives could further the comprehension of the realization mechanism of coupling coordination.

2.4.2. Contributions of This Paper

Firstly, establishing an evaluation index system under the perspective of high-quality development and introducing new directions such as industrial innovation, coordinated development, global involvement as well as economic growth and ecological protection could supplement traditional approaches for the sustainable development of the marine economy.
Secondly, we employed a coupling coordination model to analyze the relationship between marine S&T innovation and the high-quality development of marine economy and identify the spatial characteristics in China’s coastal provinces in order to further understand the theoretical association between S&T innovation and the economy under the guidance of complex adaptive system theory, regional coordinated development theory and sustainable development theory, and to provide scientifically sound strategies for sustainable marine development.
Thirdly, we constructed the factor set affecting the coupling coordination degree based on the complex system theory, and with full consideration of the possible regional heterogeneity, to analyze the driving, coordination, conduction and supportability factors of coupling coordination in order to make up for the lack of previous analysis of the factors affecting the coupling coordination of marine S&T innovation and the marine economy.

3. Indicators, Data and Methods
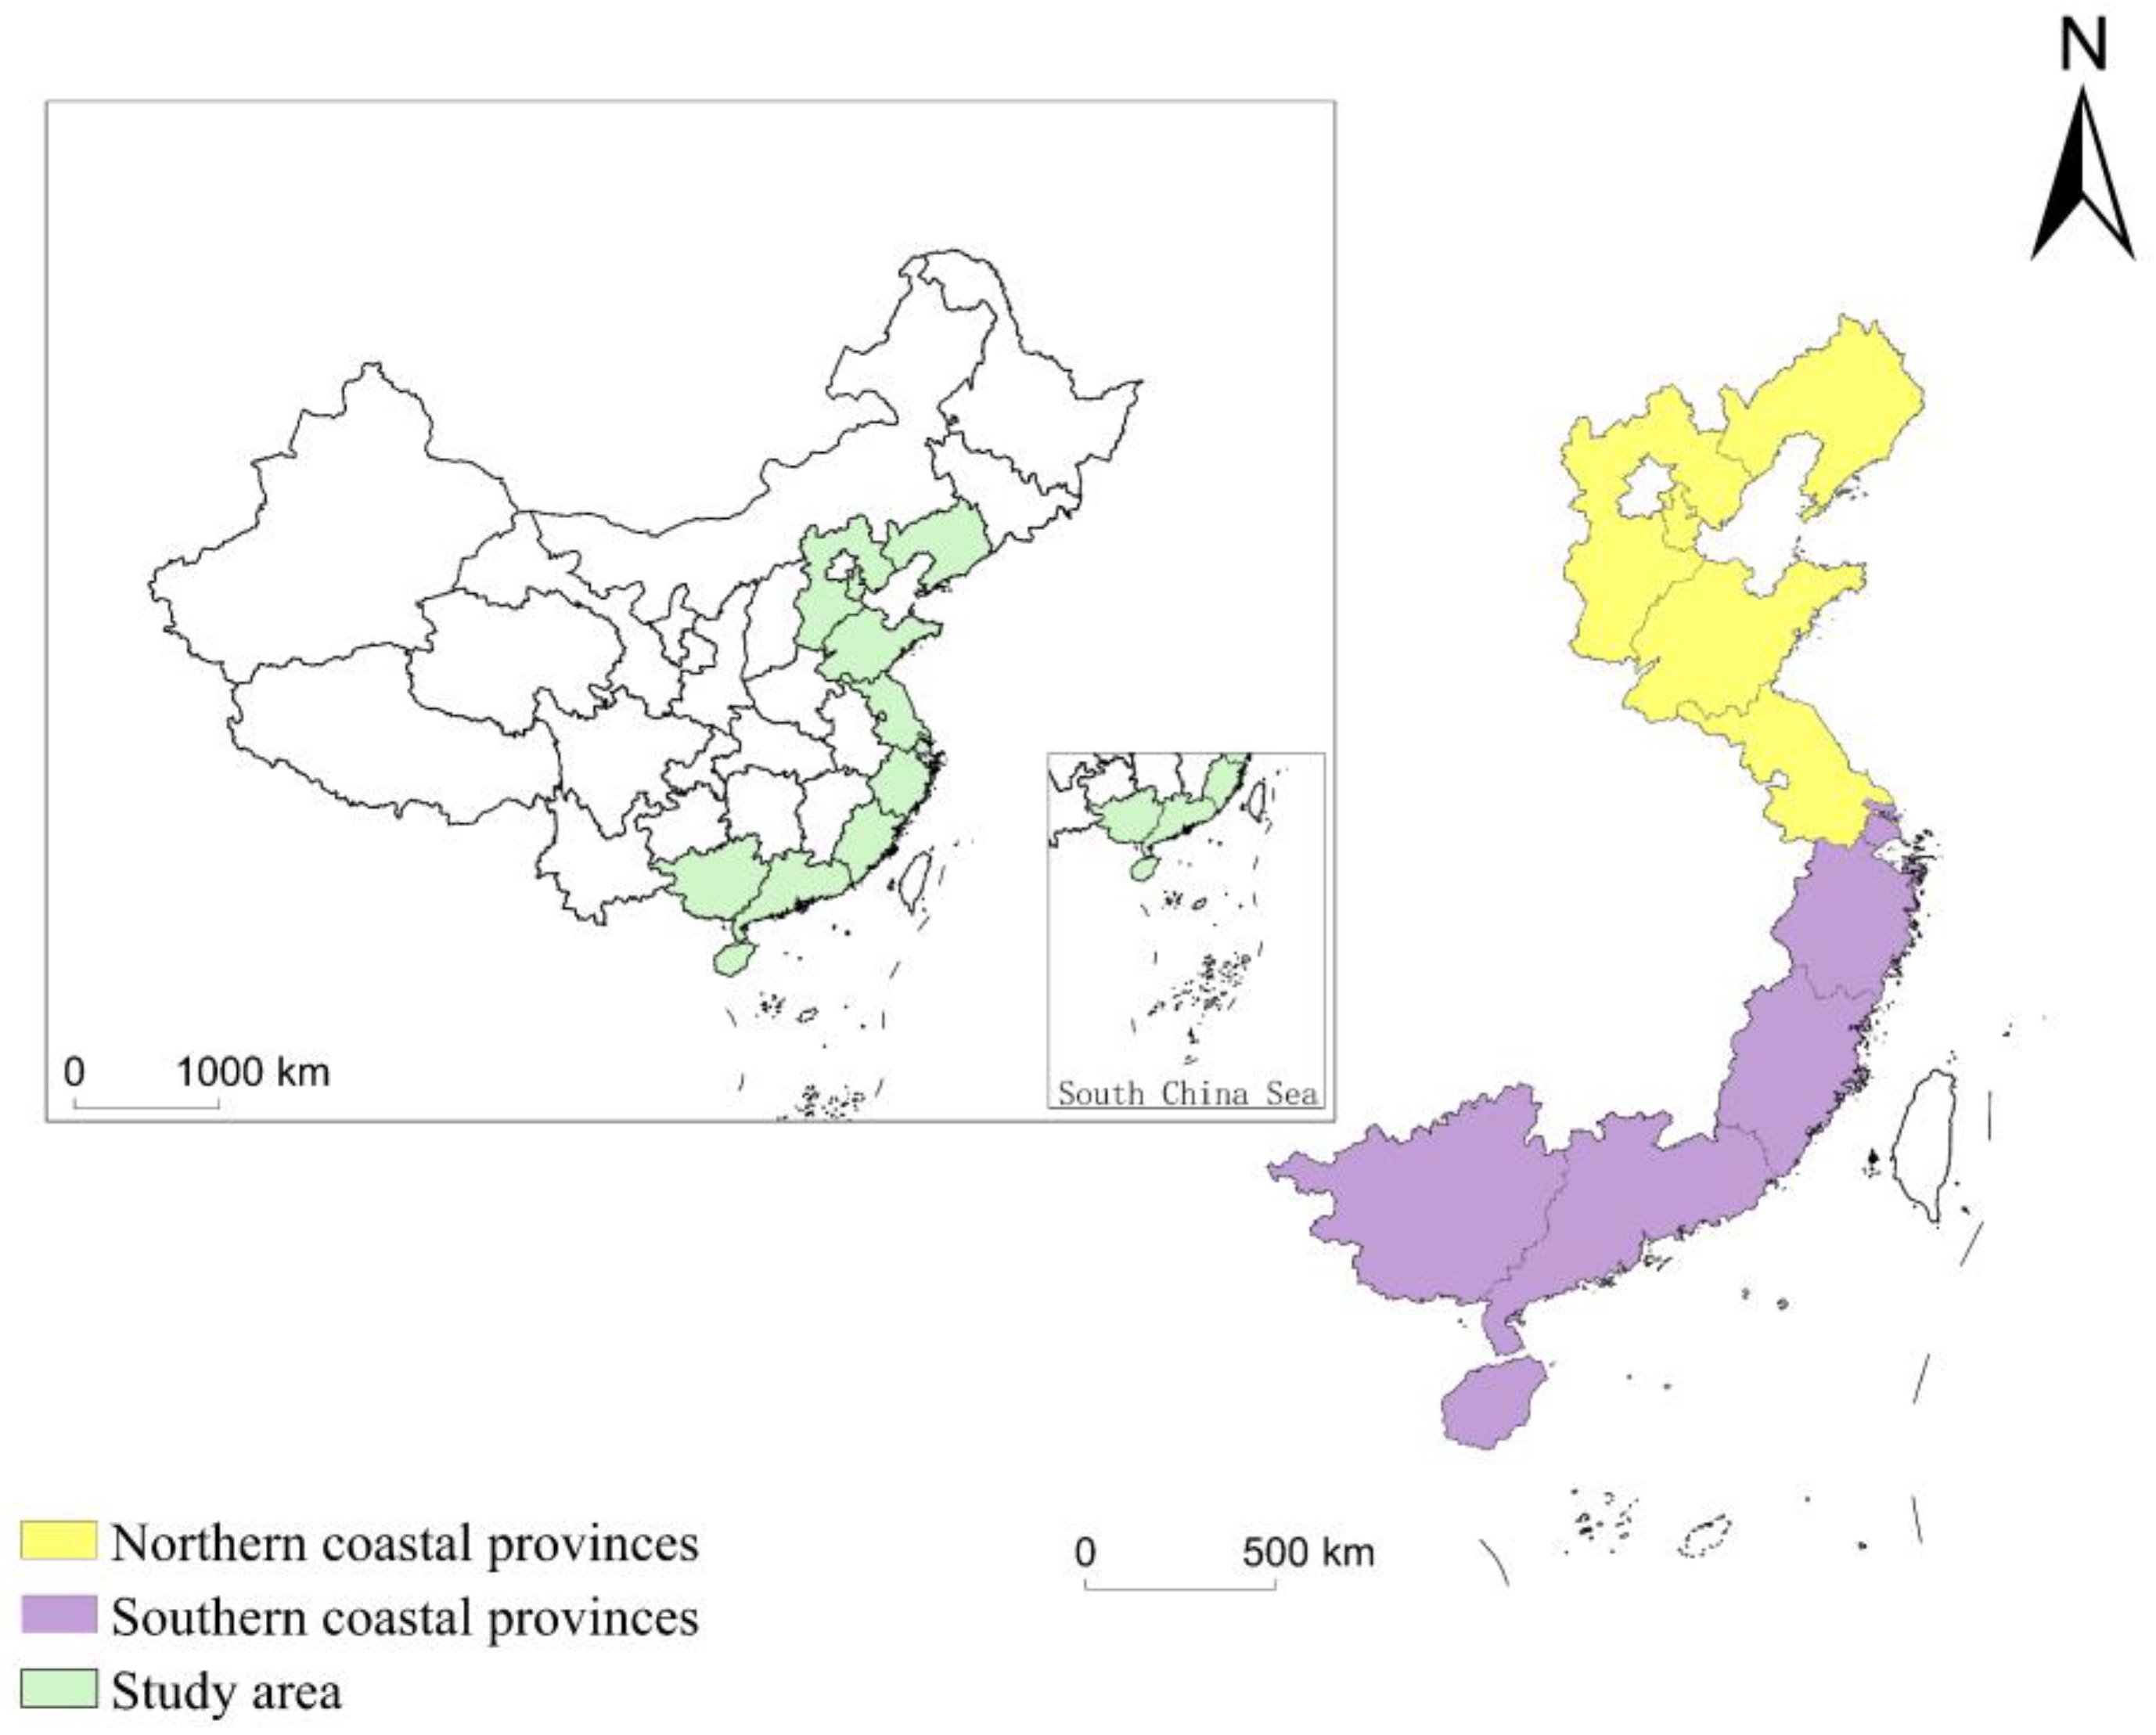
3.1. Study Area

The study area of this paper was 11 coastal provinces in China (as shown in Figure 1). From north to south, they included Liaoning, Hebei, Tianjin, Shandong, Jiangsu, Shanghai, Zhejiang, Fujian, Guangdong, Guangxi, and Hainan. The sea areas of the provinces were 150,200 km2, 7200 km2, 200 km2, 169,000 km2, 37,500 km2, 9000 km2, 260,000 km2, 136,000 km2, 419,000 km2, 129,300 km2, and 2,000,000 km2, respectively. In this paper, the authors used the Yangtze River as the boundary to divide China’s coastal areas into northern and southern coastal areas. The northern coastal areas consisted of the Bohai Sea and the Yellow Sea, including Liaoning, Tianjin, Hebei, Shandong, and Jiangsu. The southern coastal areas consisted of the East China Sea and the South China Sea, including Shanghai, Zhejiang, Fujian, Guangdong, Guangxi, and Hainan.

3.2. Construction of Indicator System and Data Sources

3.2.1. Evaluation Index of Marine S&T Innovation

Marine S&T innovation is affected by four factors: input units, system structure, functional output, and external environment [83]. Referring to the existing literature [42,84,85,86,87], we established an evaluation index (Table 1) based on the principles of specificity, objectivity, comprehensiveness, and data availability, and the evaluation indicators of marine S&T innovation have typically been divided into three categories: input indicators, output indicators, and environment indicators. Among them, the input level was measured by the capital and labor input levels, and the output level was measured by the number of patents, topics, papers, and works. The marine S&T innovation environment was measured by three aspects: the strength of government–research collaboration, the level of platform agglomeration, and the quality of human resources. In addition, the weight of each index was determined by the EWM, which was introduced in Section 3.3.

3.2.2. Evaluation Index of the High-Quality Development of the Marine Economy

The high-quality development system of the marine economy is also a composite of multidimensional factors [88]. Di et al. (2019) indicated that the key point for evaluation was the space–time coordination [62]. Li et al. (2020) established an evaluation index based on the marine comprehensive strength, industrial structure, social welfare, and ecological environment [60]. Lu (2019) [89], Wang (2021) [90], and Ding (2020) [61] evaluated the high-quality development of the marine economy according to the “new development concepts (The new development concept is a new guiding ideology put forward by Chinese officials to promote social and economic development, emphasizing innovative development, coordinated development, green development, open development and shared development)”. Based on previous research, we constructed an evaluation index (Table 2) that considered five dimensions: innovation, coordination, green/sustainability, openness, and sharing of marine economic development, all of which included 47 indicators. The weights of all indicators were determined by EWM.
Specifically, the innovation degree was measured by the level of marine economy efficiency and the level of marine development capability, which referred to the efficiency and vitality of the marine economy. The coordination degree was measured by the coordination level of the economic output, spatial development and resource utilization, which referred to the harmony level between marine industries and the order degree between land and sea development. The green degree was measured by the level of pollution, energy consumption, ecological governance and resource abundance, which referred to the adaptability of marine economic activities to the marine resources and environment. The openness degree was measured by the level of capital openness, trade openness, port openness and cultural openness, which referred to the level of participation in regional and international marine economic cooperation. The sharing degree was measured by the level of income security, consumption security, employment security, education security and health security, which referred to the ability of marine social subjects to share the achievements of marine economic development.

3.2.3. Data Sources

The data in related fields of China’s marine economy and marine S&T innovation have only been systematically recorded since 2006, and the latest data were published in 2018. The research interval of this paper was 2006–2018. The data were mainly from the China marine statistical yearbooks (2007–2019) (https://data.cnki.net/, accessed on 8 March 2022), China statistical yearbooks (2007–2019) (http://www.stats.gov.cn/, accessed on 8 March 2022), China statistical yearbooks on environment (2007–2019) (https://data.cnki.net/, accessed on 8 March 2022), and the yearbooks of China transportation and communications (2007–2019) (https://data.cnki.net/, accessed on 8 March 2022). A portion of the data were sourced from provincial statistical yearbooks and statistical bulletins. Missing data were replaced by interpolation. Considering that some indicators were composed of multiple data or through specific calculation formulas, the calculation methods of all composite indicators are reported in Appendix A.

3.3. Methods

3.3.1. Entropy Weight Method (EWM)

The entropy weight method (EWM) is a common method in evaluation research [91,92] and has been broadly applied in the evaluation of marine economies and S&T innovation [93,94]. In this study, the EWM was used to comprehensively evaluate the level of marine S&T innovation and the high-quality development of the marine economy in China’s coastal provinces. The specific operation steps were as follows:
First, to eliminate the impact of evaluation indices with different dimensions, the data of each index were standardized. The standardization formula is as follows:
x i j = X i j X m i n X m i n X m a x   ( if   x i j   is   a   positive   indicator )
x i j = X m a x X i j X m i n X m a x   ( if   x i j   is   a   negative   indicator )
where X i j is the original data, i = 1 ,   2 ,   3   m , j = 1 ,     n , m is the numerical value of evaluation objects, n is the numerical value of evaluation indicators, X m a x   and X m i n is the maximum and minimum numerical values, respectively, and x i j is the processed data within [ 0 , 1 ] .
Secondly, after calculating the weight according to the EWM and the occurrence probability of the index j of the evaluation object i , we then calculated the information entropy of index j . The calculation formula is as follows:
p i j = x i j i = 1 m x i j
e j = 1 ln m i = 1 m p i j ln p i j
Finally, calculating the weight of index j :
w j = 1 e j j = 1 n ( 1 e j )

3.3.2. Coupling Coordination Model (CCM)

Coupling measures the overall and internal interaction between two or more systems [95]. The coupling coordination model (CCM) has been widely used in the research fields of economic development, ecological environment, S&T innovation, social governance, and their associated relationships [96,97,98]. The authors introduced the CCM to explore the interaction between marine S&T innovation and the high-quality development of the marine economy.
To calculate the coupling coordination degree, the coupling degree must be measured first. The calculation formula for the coupling degree is as follows:
U = [ μ 1 · μ 2 / ( μ 1 + μ 2 2 ) 2 ] k
where μ 1 is the development level of marine S&T innovation, μ 2 is the high-quality development level of the marine economy, k is the adjustment coefficient, considering that marine S&T innovation and the high-quality development of the marine economy play their own unique roles as subsystems of the composite and combined with previous relevant research [77,99], so the value was set to 0.5 in this paper; U ( 0 , 1 ) is the coupling degree, and the larger the U , the stronger the interaction between marine S&T innovation and the high-quality development of the marine economy.
Based on the coupling degree, the coupling coordination degree was further calculated. The calculation formula is as follows:
D = U · T
T = α μ 1 + β μ 2
where T is the comprehensive coordination index; α and β are the contribution degrees of each subsystem, and this study assumed that the marine S&T innovation subsystem and the development subsystem of the marine economy had the same degree of importance, so it adopted α = β = 0.5 as coefficient values [99]; and D ( 0 , 1 ) is the coupling coordination degree. Based on the existing research [61], the uniform distribution function method was used to divide the interval and level of coupling coordination degree, and the classifications of coupling coordination levels was shown in Table 3. Taking 0.2, 0.4, 0.5, 0.6, and 0.8 as the dividing points, six conditions were determined: severe dissonance, moderate dissonance, on the verge of dissonance, primary coordination, good coordination, and high-quality coordination, where 0–0.4 indicated low-level coupling coordination; 0.4–0.6, medium-level coupling coordination; and 0.6–1.0, high-level coupling coordination.
In addition, based on the coupling coordination degree, the author calculates the relative development degree of marine S&T innovation and the high-quality development of the marine economy. The calculation formula is as follows:
E = μ 1 / μ 2
E represents the relative development degree of marine S&T innovation and the high-quality development of the marine economy. If E < 1 , it indicated that marine S&T innovation lagged behind and restricted the high-quality development of the marine economy. If E > 1 , it indicated that marine S&T innovation was ahead of the high-quality development of the marine economy.

3.3.3. Gaussian Kernel Density (GKD)

Gaussian kernel density (GKD) is a nonparametric estimation method to describe the distribution of random variables [100]. It is commonly used to analyze regional spatial disequilibrium in the field of social science research [101]. In this paper, it was used to examine the spatial non-equilibrium dynamic evolution characteristics of the coupling coordination between marine S&T innovation and the high-quality development of the marine economy by analyzing the waveform, position, and kurtosis of the GKD curve [102]. The calculation formula is as follows:
f ( x ) = 1 n h i = 1 n k [ ( x X i ) h ]
where X i represents the observations, k ( ) represents the function form of Gaussian kernel function, n is the numerical value of sample observations, h is the bandwidth, and the larger the numerical value of h , the smoother the kernel density function, but the fitting deviation also increases.

3.3.4. Standard Deviational Ellipse (SDE)

The standard deviational ellipse (SDE) was first proposed by Lefever in 1926 [103], and it analyzes the spatial distribution characteristics of geographical elements [104]. This paper used the SDE model to measure the change of position and difference characteristics of the spatial distribution of coupling coordination. The center of gravity reflected the relative spatial position of the degree of coupling coordination [105]. The short axis is the distribution range of coupling coordination degree, the long axis reveals the distribution direction of coupling coordination degree; the larger the ratio of the minor-axis standard distance to the major-axis standard distance, the closer the shape of the spatial distribution to the circle, and the less obvious the directionality [106]. The calculation formula is as follows:
Average center coordinates:
G ( X , Y ) = ( i = 1 n ω i . x i i = 1 n ω i , i = 1 n ω i . y i i = 1 n ω i )
Azimuth:
tan θ = ( i = 1 n ω i 2 x ˜ i 2 i = 1 n ω i 2 y ˜ i 2 ) + ( i = 1 n ω i 2 x ˜ i 2 i = 1 n ω i 2 y ˜ i 2 ) 2 + 4 i = 1 n ω i 2 x ˜ i 2 y ˜ i 2 2 i = 1 n ω i 2 x ˜ i y ˜ i
Standard distance of major axis and minor axis:
σ x = 2 i = 1 n ( ω i x ˜ i cos θ ω i y ˜ i sin θ ) 2 i = 1 n ω i 2 σ y = 2 i = 1 n ( ω i x ˜ i sin θ ω i y ˜ i cos θ ) 2 i = 1 n ω i 2
where G ( X , Y ) represents the center of gravity coordinate, ( x i , y i ) represents the spatial location, ω i represents the weight, ( x ˜ i , y ˜ i ) represent the coordinate deviation from each area to the average center, and σ x and σ y represent the standard distance of the major axis and minor axis, respectively. The major axis represents the dispersion degree of geographical elements in the main direction, the minor axis represents the dispersion degree of geographical elements in the secondary direction, the azimuth represents the main trend direction of development, and the range of the SDE reflects the balance of spatial development.

4. Results

4.1. Temporal Evolution Characteristics of Coupling Coordination

In Figure 2, the mean value of the coupling coordination degree of marine S&T innovation and the high-quality development of the marine economy in 11 coastal provinces and cities continued to increase from 2006 to 2018. The coupling coordination degree rose from 0.405 to 0.651, with a growth rate of 60.549%. The degree of coupling coordination could be traced from the verge of dissonance to good coordination, indicating that these two systems evolved toward a benign resonance coupling and a new ordered state.
The evolution of coupling coordination degree was divided into three stages. The first stage was on the verge of dissonance in 2006–2010. During this period, the development mode of the marine economy was relatively extensive, relying on investment and trade expansion. Endogenous drivers of marine economic development were not well considered. The capital and talent recruited by marine economic development had not been introduced into the marine S&T innovation system.
The second stage was the primary coordination stage in 2011–2016. In 2011, the outline of the 12th Five Year Plan for national economic and social development clearly promoted marine economic development. The State Council and relevant departments provided clear guidance on improving the transformation efficiency of marine S&T innovations and strengthening its capacity by formulating and implementing a series of development plans such as the national 12th Five Year Plan for marine S&T development and the 12th Five Year Plan for national marine economic development, which laid a solid foundation for improving the coordinated development of marine S&T innovation and the marine economy.
The third stage was the good coordination stage in 2017–2018. China accelerated the construction of a high-quality development pattern of the marine economy with S&T innovation as the core driving force to promote the major strategic deployment of building a marine power after the 19th National Congress of the Communist Party of China. During this period, China emphasized promoting marine S&T innovation, cultivating emerging marine industries, and promoting the transformation of the marine economy to a quality–benefit type and thus accelerated the improvement of the coupling coordination degree between marine S&T innovation and the high-quality development of the marine economy from primary coordination to good coordination.

4.2. Spatial Evolution Characteristics of Coupling Coordination

In Figure 2 and Figure 3, the coupling coordination degree among the 11 coastal provinces fluctuated between 0.185 and 0.849, and the coupling coordination degrees in Guangdong, Shandong, Shanghai, and Jiangsu were higher than the average level, while Fujian, Hebei, Guangxi, and Hainan were lower than the average.
In 2006, the spatial differentiation was quite significant. The coupling coordination in Guangdong, Shandong, and Shanghai was at the primary level; Tianjin, Jiangsu, and Zhejiang were on the verge of dissonance. Liaoning, Hebei, Fujian, and Guangxi were moderately dissonant, and Hainan was seriously dissonant. The coupling coordination of Shandong, Jiangsu, Shanghai, and Zhejiang showed medium-level coupling coordination agglomeration while Liaoning and Hebei showed low-level agglomeration. The four provinces in the Pearl River Delta region had a significant gap among their degrees of coupling coordination.
By 2010, the degree of coupling coordination in the coastal provinces and cities had been improved. Shandong, Shanghai, and Guangdong developed from primary to medium coordination, and Jiangsu improved from the verge of dissonance to primary coordination. Liaoning and Fujian developed from moderate dissonance to the verge of dissonance, and Hainan improved from severe dissonance to moderate dissonance. Shandong, Shanghai, and Guangdong formed three high-level coupling coordination core areas in the northern, eastern, and southern marine economic circles, respectively. Zhejiang, Jiangsu, and Fujian had a medium-level coupling coordination agglomeration pattern.
By 2014, the spatial gradient gap of coupling coordination had further widened. Zhejiang had developed from primary to good coordination. Liaoning and Fujian improved from the verge of dissonance to primary coordination. Hebei improved from moderate dissonance to the verge of dissonance while the other provinces remained the same. Shandong, Jiangsu, and Shanghai showed a high-level coupling coordination agglomeration while Hebei, Tianjin, and Liaoning had a medium-level agglomeration. The spatial differentiation of Guangdong, Fujian, Guangxi, and Hainan was still significant.
By 2018, the overall coupling coordination level in coastal provinces had reached medium or high levels. Shandong, Jiangsu, Shanghai, Zhejiang, Fujian, and Guangdong showed a high-level coupling coordination agglomeration pattern while provinces near the southwest and northwest edges such as Hebei, Guangxi, and Hainan widened the gap with the above-mentioned regions.
As shown in Figure 4, the relative development degree between marine S&T innovation and the high-quality development of the marine economy showed an upward trend from 2006 to 2018, indicating that marine S&T innovation had enhanced its driving effect on the development of the marine economy. In 2006, except for Shandong Province, the marine S&T innovation in the other coastal provinces and cities lagged behind in the high-quality development of the marine economy, indicating that it was insufficient and could not meet demands. Affected by the international financial crisis of 2008–2010, the relative development degree in most provinces and cities showed a downward trend. After 2014, the relative development degree in Shandong, Shanghai, Guangdong, Liaoning, Jiangsu and Tianjin exceeded 0.7, and the driving effect of S&T innovation on the high-quality development of the marine economy was significantly enhanced. However, the relative development degree of Hainan and Guangxi was still less than 0.5, and their marine S&T innovations were significantly hindered and would restrict the development of their marine economies.

4.3. Spatial Disequilibrium Characteristics of Coupling Coordination

As shown in Figure 5, the center of gravity of coupling coordination was located in the central and eastern coastal areas from 2006 to 2018. The spatial pattern was affected by the northeast–southwest distribution pattern. The high degree of coupling coordination was concentrated in the central and eastern coastal areas such as Guangdong, Zhejiang, Shanghai, Jiangsu, and Shandong while the low degrees of coupling coordination were in Guangxi, Hainan, and Hebei. Therefore, a spatial pattern that was strong in the middle and weak in the periphery was formed.
The center of gravity consistently moved westward in the east–west direction. However, it first moved 26.767 km to the northeast in 2006–2010, then it moved 5.567 km and 45.027 km to the southwest in 2010–2014 and 2014–2018, respectively. The distribution of the center of gravity changed from north to south, indicating that the improvements in the southern coastal area were greater than in the northern coastal area.
The azimuth of the SDE increased from 10.580° to 12.460°, which indicated that the spatial pattern further evolved to northeast–southwest and the pulling effect of the southern coastal area on the improvement of the overall coupling coordination degree was gradually strengthened.
The standard distance of the minor axis increased from 388.091 km in 2006 to 397.186 km in 2014, and then decreased to 397.095 km in 2018, while the standard distance of the major axis continued to increase from 1076.026 km to 1150.913 km. The spatial distribution of coupling coordination showed a diffusion trend, both in the east–west and north–south directions, and the spatial distribution of coupling coordination in coastal areas eventually reached equilibrium. The ratio of coupling coordination between the minor-axis and major-axis standard distances generally showed an upward trend, indicating that the directionality of the spatial distribution of coupling coordination degree becomes less and less significant. The spatial disequilibrium of coupling coordination in coastal areas had been narrowed, but the polarization was still significant.
As shown in Figure 6, the GKD curve showed a single peak in 2006 and then a double peak in 2010, 2014, and 2018. The values of the two peaks were both large in 2010 and 2014, but in 2018, one was high, and the other was low. This indicated that the polarization degree of coupling coordination in coastal areas was low in 2006 while the polarization between medium-level and high-level coupling coordination areas intensified in 2010 and 2014, then it evolved into a strong imbalance between high-level and low-level areas in 2018. The rightward shift of the GKD curve indicated that the level of coupling coordination was improving. Regarding the changing peak values, the peaks with larger values increased rapidly, reflecting that the original provinces and cities with higher levels of coupling coordination could improve more rapidly by 2010. By 2014, the values of the peaks both showed a downward trend, indicating that with the development of medium-level areas, the spatial distribution in the coastal area was more balanced. By 2018, the peak values shifted from two large values to one high and one low, which showed that while the medium level evolved into high-level coupling coordination, the provinces and cities with low-level coupling coordination developed slowly. The increase in the rightward shift of the peak tail indicated that the polarization between high-level and low-level coupling coordination areas was still significant.

4.4. Empirical Analysis on Influencing Factors of Coupling Coordination

4.4.1. Influence Mechanism

The coupling coordination between marine S&T innovation and the high-quality development of the marine economy is a complex interaction process [107]. Based on the theory of complex adaptive systems and other relevant research [108], we discussed the driving factors, coordination factors, conduction factors, and security factors.
From the perspective of driving factors, the major premise of marine S&T innovation and the development of the marine economy concerns satisfying the needs of marine social subjects [109], which means that meeting social needs is an important driving force for marine economic upgrading and S&T innovation. Productive consumption demand and consumptive consumption demand are the basic components of social demand, so the demands of industrial advancements and the expansion of consumption were selected as the driving factors.
From the perspective of coordination factors, the essence of coordination is the effective allocation of resources. The open environment provides a guarantee for the free flow of elements as well as the transfer and transformation of development achievements [62] The market is a key mechanism for regulating the utilization and allocation of resources [110]. So, the environmental openness level and the marketization level were selected as the coordination factors.
From the perspective of conduction factors, the achievements of S&T innovation need to be converted into economic values using marketing operations [111]. The construction of an information platform reduces the interaction difficulties caused by information asymmetry, which enhances the coordination of the direction of marine S&T innovation and the high-quality development of the marine economy [112]. So, the technology transfer and information interaction abilities were selected as the conduction factors.
From the perspective of supportability factors, sustainable investment guarantees have built a good development environment both for marine S&T innovation and the development of the marine economy, and it has laid a solid foundation for the deepening of the coupling coordination between marine S&T innovation and the development of the marine economy [113]. Since the ocean is not an absolutely independent geographical space, a considerable number of marine industries are actually carried out on land, and some ocean activities are inseparable from aerospace S&T and resources. Therefore, the coordinated development level of land, marine and air is an important support for the coupling of marine S&T and the marine economy [114]. So, the government support level and the multidimensional spatial integration level were selected as the supportability factors.
We used these factors as shown in Table 4 to analyze their influence on the coupling coordination of marine S&T innovation and the high-quality development of the marine economy in China’s coastal areas from 2006 to 2018.

4.4.2. Regression Model

(1)
Model setting
To test the relevant factors affecting the coupling coordination between marine S&T innovation and the development of the marine economy, the authors selected the panel data model for regression analysis and built the model as follows:
   E i t = β 0 + β 1 · l n I U D i t + β 2 · l n C E D i t + β 3 · l n E O L i t + β 4 · l n M K L i t + β 5 · l n T T A i t + β 6 · l n I I A i t + β 7 · l n G S L i t + β 8 · l n M I L i t + ε i t
where E i t indicates the coupling coordination degree in each costal area. β 1 , β 2 , β 3 , β 4 ,   β 5 ,   β 6 ,   β 7 , and β 8 represent the influence coefficients, and ε i t represents the error term.
(2)
Model test
As shown in Table 5, there was no unit root in the established model, and there was a significant cointegration relationship between variables. The Variance Inflation Factor (VIF) test showed that there was no multicollinearity problems (maximum VIF < 10).

4.4.3. Full Sample Estimation and Analysis

(1)
Regression form selection and endogeneity solution
As shown in Table 6, the model had heteroscedasticity and cross-section correlation problems, but there was no time series autocorrelation problem. The model had a strong individual effect, and the Fixed Effect Regression (FE) and Random Effect Regression (RE) were better than the Mixed Effect Regression (POLS). The results based on the improved Hausman test showed that the RE was strongly rejected. In order to better deal with heteroscedasticity- and cross-section-related problems, the Panel-Corrected Standard Error (LSDV) method was used to estimate the two-way FE model. Model (3) was the RE model with time control, Model (1) was the two-way FE model, and Model (2) was the two-way FE model estimated by the LSDV method.
In addition, considering that there might be endogenous problems in industrial improvement demand, consumption expansion demand and multi-dimensional spatial integration, it chose the three variables as endogenous variables, and took their lag terms as instrumental variables. The Hausman test considering endogenous factors still showed that the FE method should be suitable. Therefore, a two-way FE model with the Two-Stage Least Squares (TSLS) method was established for regression. The regression results are shown in Table 6, and the instrumental variables were effective according to the F value and Sargan test.
(2)
Regression results
From the perspective of driving factors, both the industrial improvements and consumption expansion demands passed the significance test of 1%. In recent years, China’s coastal areas have implemented a series of policies to accelerate the cultivation of emerging marine industries, which promoted the marine industrial structure and the demand for advanced technology. With the continuous improvement of marine economic development, coastal residents stimulated the consumption expansion potential as their incomes increased, which stimulated the improvements of products and services, and it has promoted sustainable marine S&T innovation.
From the perspective of coordination factors, neither environmental openness nor marketization passed the significance test. On the one hand, the open development environment and a benign market system ensures the free flow and supply of factors and products that provide labor, financial, material, and other resources for marine S&T and marine economic development. On the other hand, it may also strengthen the cross-regional resource allocation [115], which would have an adverse impact on the coupling coordination relationship between local S&T innovation and the development of the marine economy. The opposite effect made the influence coefficient not significant.
From the perspective of conduction factors, both technology transfer and information interaction abilities passed the significance test of 5%. China attached importance to the construction of marine S&T innovation markets and enriched various technology trading platforms, which became key links to realize the promotion of both marine S&T innovation and the development of the marine economy. The construction of online information sharing promoted the communication among participants in the marine development sector and provided an important foundation for the coupling coordination relationship between the two systems.
From the perspective of supportability factors, both government support and multidimensional spatial integration levels passed the significance test. The financial gap was a negative indicator to measure the government’s financial support. The expanding fiscal gap indicated that the government’s resource supply and allocation was weakened, which directly affected the development status and coordination level of marine S&T innovation and the high-quality development of the marine economy. The development of multidimensional spatial integration was conducive to the efficient allocation of economic and S&T resources. The overall plan for the coordinated development of multidimensional space has led to the integration of marine S&T innovation and the development of the marine economy.

4.4.4. Subregional Estimation and Analysis

(1)
Regression form selection and model test
Using the Yangtze River as the boundary, the authors classified the study area into southern coastal provinces and northern coastal provinces. The dummy variable was Hi. If H = 1, it represented the northern coastal province; if H = 0, it represented the southern coastal province. The Models (1) and (2) in Table 7 provide the regression results of retaining only the interaction variables. This result reported the regression coefficients of the influencing factors of coupling coordination in the southern and northern coastal provinces without considering the intercepting variables. Model (3) was a complete model with independent, dummy, and interactive variables, and the coefficients of the interactive variables in Model (3) reported the difference and significance of similar influencing factors in southern and northern coastal provinces.
(2)
Regression results
From the perspective of driving factors, industrial improvement and consumption expansion demand both had significant positive impacts on southern coastal provinces under a significance level of 1% while the impact of consumption expansion demand in northern coastal provinces was not significant. Traditional marine industries accounted for a large proportion of northern coastal provinces and needed to resolve the bottleneck through S&T innovation. The marine industrial structure in the south was better, and the long tradition of living on the sea prompted policies oriented by consumption expansion and improvements earlier in southern coastal provinces, which drove the S&T innovation for the improvements of consumer goods and services.
From the perspective of coordination factors, the environmental openness level in both southern and northern coastal provinces passed the significance level of 1% while the marketization was not significant. Port transportation, cross-sea trade, coastal tourism, and other open development activities demanded a large number of S&T and economic resources, which allowed the coastal provinces to become important platforms for the integration of the marine economic system and S&T innovation. As previously analyzed, the market not only enhanced the local resource allocation capacity but also promoted the coordinated allocation of cross-regional resources. The regression coefficient of the marketization level was not significant, which was attributed to the offset between local resource allocation and cross-regional resource allocation.
From the perspective of conduction factors, the technology transfer ability had a significant positive impact on both southern coastal provinces under the significance level of 1%, but the coefficient was small. With an increased spatial spillover capacity of S&T innovation in coastal areas, the allocation of innovation resources was no longer limited to local provinces. Its role in promoting the coupling coordination could not be overlooked. The information interaction capacity of the southern coastal provinces did not pass the significant test, and the coefficient was negative. Internet access could also strengthen the cross-regional resource allocation. It could assist Guangxi, Hainan, and other coastal province with less advanced marine S&T innovations to increase their dependence on technologically advanced provinces, thus restricting the improvement of coupling coordination between local innovation and the local marine economy [116].
From the perspective of supportability factors, multi-dimensional spatial integration in both southern and northern coastal provinces passed the significance level of 1%. Multi-dimensional spatial integrated development strengthened the interaction and transformation of multiple resources in different spaces, thus ensuring the coupling coordination of marine S&T innovation and the high-quality development of the marine economy. The financial gap rate of southern provinces passed the significance test while the northern provinces did not, and their coefficients were both negative. Recently, China’s financial gap rate has continued to rise, and the south has been more significant than the north, which may weaken the role of the government in coordinating the allocation and investment guarantees of the marine economy and marine S&T resources.

5. Discussion

From the early thought of balanced [117,118] or unbalanced development [119] to the attention to spatial structure [120] and regional sustainable development [121], the theory of regional coordinated development has developed from simply paying attention to the imbalance of the regional economy to fully paying attention to the coordinated development of multi-dimensional subsystems of social and economic systems such as society, economy, science and technology and environment. The transformation has been closely related to the evolution of complex system theory and sustainable development theory. As for this paper, it analyzed the coupling coordination between S&T innovation and economy in the local area and considered that the coupling coordination degree differs among regions, aiming to provide strategic suggestions for reducing the degree of spatially unbalanced development of coupling coordination in coastal areas. Considerable progress has been made in relevant research [17,122] and has revealed the driving effect of S&T innovation on sustainable development, and the guarantee and guidance function of sustainable development on S&T innovation [123,124]. This study further verified the results of existing studies, which was reflected in three aspects.
First, the existing theoretical and empirical research has shown that there is a significant coupling relationship between S&T innovation and sustainable development [125]. This paper extended this view to marine concerns and tested the relationship between marine S&T innovation and the high-quality development of marine economies, and the result showed that the coupling relationship between the two systems was significant, but the level of coupling coordination was not high. In particular, the marine S&T innovation in many provinces lagged behind the development of the marine economy for a long time [42,126].
Secondly, existing studies have shown that there could be large regional differences affecting both marine S&T innovation and the marine economy in China’s coastal areas [16,101]. This study showed that the coupling coordination also had significant spatial heterogeneity, and the polarization between high-level and low-level provinces is still expanding. This may be closely related to the inherent development differences between regions. Provinces with advanced technologies and economic advantages have a strong siphoning effect on less advanced areas, which leads to dependences between the two and stagnation in their overall coupling coordination.
Thirdly, existing studies have shown that the coordinated relationship between S&T innovation and development was affected by multiple factors [127]. The authors found that factors affecting the coupling coordination between marine S&T innovation and the high-quality development of the marine economy were complex and had strong regional heterogeneity, which was due to the differences in development histories, status, and the conditions of marine resources and the environment [128]. This suggested that policies should be adapted to local conditions and implemented by categories.
Due to the lag and incompleteness of relevant statistical data, the research conclusions reached in this paper were insufficient. Therefore, further exploration should be considered from the following aspects.
First, refine the spatial scale. The theory of regional economic geography attaches importance to the division of spatial scale, and the characteristics of spatial evolution draw different conclusions due to the selection of a spatial scale. This paper focused on revealing the coupling coordination relationship between marine S&T innovation and the high-quality development of the marine economy as well as their influencing factors at the provincial level, but the analysis of more microspatial scales such as prefecture-level cities and counties should be examined. How the coupling coordination relationship between systems is affected by spatial interaction needs to be discussed on a more detailed spatial scale.
Secondly, analyze the interaction mechanism of influencing factors. The marine S&T innovation and the development of the marine economy were not only in the overall framework of the national marine development system, but also have their own unique operational mechanisms. The existence of these interaction mechanisms between the influencing factors and how they interact may or may not be beneficial in the coordinated development of the two systems. The spatiotemporal evolution characteristics of influencing factors and their interaction mechanisms should be expanded in future research.

6. Conclusions, Implications and Recommendations

6.1. Conclusions

Based on the evaluation index of marine S&T innovation and the high-quality development of the marine economy, the spatiotemporal evolution mechanism of coupling coordination and its influencing factors in 11 coastal provinces in China were analyzed by using the methods of EWM, CCM, GKD, SDE and a two-way FE model with Two-Stage Least Squares (TSLS). The main conclusions were as follows:
(1)
The coupling coordination between marine S&T innovation and the development of the marine economy in coastal areas developed well overall and shifted from being on the verge of imbalance to good coordination. It experienced three stages: the period of approaching imbalance from 2006 to 2010, the primary coordination period from 2011 to 2016, and the good coordination period from 2017 to 2018. Its improvement was inseparable from macro-policy orientations and regional developmental foundations.
(2)
The central and eastern coastal areas such as Guangdong, Fujian, Zhejiang, Shanghai, Jiangsu, and Shandong showed a centralized and continuous high-level coupling coordination while the coastal areas that were geographically close to the southwest and northwest fringes widened the gap with the above-mentioned areas. The high-level, medium-level, and low-level coupling coordination areas were evenly distributed on the north and south sides, and it showed a diffusion trend both in the north–south and east–west axes, suggesting that the spatial distribution of coupling coordination was becoming more balanced, but the polarization between high-level provinces and low-level provinces remained.
(3)
Industrial improvement demand, consumption expansion demand, and the multi-dimensional spatial integration level were the key factors that improved coupling coordination. The impacts of marketization and environmental openness were not significant, but the expansion of the fiscal gap had a significant negative impact on coupling coordination. The influencing factors between northern and southern coastal provinces were different. The improvement of coupling coordination in the southern coastal area mainly depended on the promotion of consumption expansion demand while the northern coastal area depended on multidimensional spatial integrated development and industrial improvement demand. The impact of consumption expansion demand and government support on the northern coastal areas was not significant, but the opposite was true in the southern areas. The marketization level had no significant impact in the north or the south. Technology transfer was the common promoting factor, and the information interaction level had little impact on the coupling coordination in the south.

6.2. Implications

Theoretically speaking, promoting the sustainable development of the marine economy is an extension of sustainable marine development. Based on the theory of sustainable development and the existing practice of sustainable development represented by the United Nations, this study integrated China’s experience so as to construct an evaluation system for the high-quality development of the marine economy, which deepens the theory of sustainable development. The coordinated development of socioeconomic systems and subsystems is one of theoretical dimensions of the complex adaptive system, regional coordinated development and sustainable development theories. The existing research has focused on the one-way relationship between marine S&T innovation and marine economies, and few scholars have considered their coupling coordination characteristics. Exploring the coordinated relationship between the two can serve to supplement the relative theories.
In practice, as a large marine country, China has focused on the sustainable development of its marine economy by integrating the high-quality development concept with the present situations of sustainable development and has provided a good reference for other countries and regions to build their own framework. By analyzing the coupling coordination between marine S&T innovation and the development of the marine economy in China’s coastal areas, this study has provided context for the influences including the factors of driving, coordination, conduction, and supportability and discussed the differences between northern and southern coastal regions. We found that the differences in coupling coordination degree between regions is not only closely related to the development level and development history of the region itself, but also may be affected by the interaction between regions, such as the improvement of cross-regional resource allocation due to the openness and high level marketization, as well as the resulting polarization effect. These findings have certain practical significance for regions at different development stages to realize their framework for sustainable marine development.

6.3. Recommendations

The coupling coordination between marine S&T innovation and the development of the marine economy is a multidimensional evolution that depends on the interaction between marine innovation and the development of marine economies as well as the influence of the external environment. To deepen the coupling coordination between marine S&T innovation and the development of marine economies, we should consider the following:
First, accurately grasp the complex contradiction of the relationship between marine S&T innovation and the development of a marine economy. Specifically, the development of marine-based economies must first consider the needs and livelihoods of the surrounding community and focus on cultivating strategic industrial clusters, vigorously promoting the adaptability and improvement of the local economic structure and accelerating green and sustainable marine development industries.
Secondly, strengthen the top-level mechanism for marine S&T innovation to drive the development of a marine economy. Specifically, we should strengthen the multidimensional development and integration of land, marine, air, and network concerns, improve the national and regional marine innovation system, strengthen the dominant position of marine enterprises in S&T innovation, encourage international innovation and cooperation, constantly promote the innovative development guided by high-tech industries, promote the optimization and improvement of marine industries, and break through the bottleneck of marine economic development with S&T innovation to form new competitive advantages.
Finally, improve the market service system and implement government guarantees. Specifically, we should improve the mechanisms of intellectual property creation, intellectual property protection, and intellectual property market application, strengthen policy supply in terms of capital supply and talent cultivation, meet the requirements of new national infrastructure and construction, accelerate the construction of new marine infrastructure system and information interaction systems supported by informatization, digitization, and artificial intelligence, and give full play to the regulation and guarantee functions of the government in promoting the coordinated development of marine S&T innovation and the marine economy, especially improving the important role of the government in guiding the allocation of resources to make up for the polarization effect under the market mechanism.

Author Contributions

Conceptualization, S.L. and J.W.; Data Curation, J.W.; Formal Analysis, S.L. and J.W.; Funding acquisition, S.L.; Investigation, S.L. and J.W.; Methodology, S.L. and J.W.; Project Administration, S.L. and J.W.; Resources, S.L. and J.W.; Software, J.W.; Validation, J.W.; Visualization, J.W.; Writing—original draft, S.L. and J.W.; Writing—review & editing, S.L. and J.W. All authors have read and agreed to the published version of the manuscript.

Funding

This research was funded by Key Research Program of National Social Science Fund of China, grant number 18VSJ067.

Institutional Review Board Statement

Not applicable.

Informed Consent Statement

Not applicable.

Data Availability Statement

Not applicable.

Acknowledgments

The authors would like to acknowledge the support of Xu Yujie (doctoral candidate) and Zhang Ping (doctoral candidate) from Ocean University of China, and Liu Chunyu (doctoral candidate) from Shanghai Jiao Tong University.

Conflicts of Interest

The authors declare no conflict of interest.

Appendix A. Index Calculation Method

(1)
Marine economic efficiency
The marine economic efficiency is measured by the super-efficient SBM Model (The super-efficient SBM model can decompose the decision-making unit with efficiency value of 1 calculated by SBM model, realize the comparison of effective decision-making units, and improve the practical applicability of the model). The labor input is the number of marine-related employees; the capital investment is calculated by using the Perpetual Inventory Method based on 2005 and converted by the proportion of Gross Mean Product (GMP) in coastal GDP [129]. The energy input is the electricity consumption of coastal areas. The expected output is the GMP in coastal provinces, and the unexpected output is the proportion of class IV and inferior class IV seawater.
(2)
Marine productivity level
The marine productivity level is obtained by the weighted sum of marine fishing volume, aquaculture volume per unit of aquaculture area, crude oil production per unit of oil well, natural gas production per unit of gas well, salt production per unit of salt field, ship repair and construction volume, port turnover and port freight volume after standardization. The formula is expressed as C = y i w i , where y i is the normalized value, w i is the weight which is determined by EWM.
(3)
Coordination degree of economic structure
Using the Coupling Coordination Model (CCM) to measure the coordinated development level of marine primary, secondary and tertiary industries in coastal provinces, the calculation method refers to Formulas (6)–(8). The contribution coefficients of the primary, secondary and tertiary industries are, respectively, 10%, 40%, and 50%.
(4)
Coordination degree of supply and demand
Taking the total volume of retail sales of the social consumer goods as the total demand and the GDP of coastal areas as the total supply, it is calculated through CCM. The contribution coefficients are both 50%.
(5)
Coordination degree of industry structure
Using the CCM to measure the coordinated development level of marine industry and marine related industries in coastal provinces. The contribution coefficients are both 50%.
(6)
Coordination degree of urban-rural development
Using the CCM to measure the coordinated development level of the income of urban residents and the income of rural residents in coastal provinces. The contribution coefficients are both 50%.
(7)
Coordination degree of land and marine development
Using the CCM to measure the coordinated development level of land GDP and marine GDP in coastal provinces. The contribution coefficients are both 50%.
(8)
Coordination degree of fund utilization
Using the CCM to measure the coordinated development level of deposit balance and loan balance of financial institutions in coastal provinces. The contribution coefficients are both 50%.
(9)
Ecological space openness:
The ecological space openness is obtained by the weighted sum of the length of the coastline and the area of the sea area under jurisdiction after standardization. The formula is expressed as C = y i w i , where y i   is the normalized value and w i is the weight, which is determined by the EWM.
(10)
Port location quotient and Port radiant energy
The formulas for port location quotient ( Q ) and port radiant energy ( O ) are as follows [130]:
Q = ( L T P / W T P ) / ( L I E / W I E )
O = L T P W T P × ( L I E / W I E )
where L T P is the cargo throughput of a port, W T P   is the cargo throughput of total ports in China’s coastal areas, L I E is the total trade volume of a port, and W I E is the total trade volume of China’s coastal areas.
(11)
Marine industrial structure upgrading index
Referring to Xu Min (2015) [131]:
U P = i = 1 3 q 1 × 1   +   q 2 × 2   +   q 3 × 3
U P is the industrial structure upgrading index, q i is the proportion of the output value of the   i , i = 1 ,   2 ,   3 .
(12)
Marketization index
Adopt the Marketization Index of coastal provinces published by Wang Xiaolu and Fan Gang [132].
(13)
Fiscal gap rate
F G R = General   public   budget   expenditure General   public   budget   revenue General   public   budget   expenditure
(14)
Multi-dimensional spatial integration level
Using the CCM to measure the integration highway density, port density, flight route density, railway density in coastal areas. The contribution coefficients are both 25%.

References

  1. Duarte, C.M.; Agusti, S.; Barbier, E.; Britten, G.L.; Castilla, J.C.; Gattuso, J.P.; Worm, B. Rebuilding marine life. Nature 2020, 580, 39–51. [Google Scholar] [CrossRef] [PubMed]
  2. Bax, N.; Novaglio, C.; Maxwell, K.H.; Meyers, K.; McCann, J.; Jennings, S.; Carter, C.G. Ocean resource use: Building the coastal blue economy. Rev. Fish Biol. Fish. 2022, 32, 189–207. [Google Scholar] [CrossRef] [PubMed]
  3. Mallin, F.; Barbesgaard, M. Awash with contradiction: Capital, ocean space and the logics of the Blue Economy Paradigm. Geoforum 2020, 113, 121–132. [Google Scholar] [CrossRef]
  4. Hossain, M.S.; Gain, A.K.; Rogers, K.G. Sustainable coastal social-ecological systems: How do we define “coastal”? Int. J. Sustain. Dev. World Ecol. 2020, 27, 577–582. [Google Scholar] [CrossRef]
  5. Grorud-Colvert, K.; Sullivan-Stack, J.; Roberts, C.; Constant, V.; Horta e Costa, B.; Pike, E.P.; Lubchenco, J. The MPA Guide: A framework to achieve global goals for the ocean. Science 2021, 373, eabf0861. [Google Scholar] [CrossRef]
  6. Yin, K.D.; Li, X.M.; Guan, H.J.; Jin, X. Annual Report on the Development of China’s Marine Economy (2019–2020); Social Sciences Literature Press: Beijing, China, 2002. (In Chinese) [Google Scholar]
  7. Jiang, Q.; Feng, C.; Ding, J.; Bartley, E.; Lin, Y.; Fei, J.; Christakos, G. The decade long achievements of China’s marine ecological civilization construction (2006–2016). J. Environ. Manag. 2020, 272, 111077. [Google Scholar] [CrossRef]
  8. Wang, S.; Lu, B.; Yin, K. Financial development, productivity, and high-quality development of the marine economy. Mar. Policy 2021, 130, 104553. [Google Scholar] [CrossRef]
  9. Romer, P.M. Endogenous technological change. J. Polit. Econ. 1990, 98, 71–102. [Google Scholar] [CrossRef] [Green Version]
  10. Schumpeter, J.A. Theoretical problems of economic growth. J. Econ. Hist. 1947, 7 (Suppl. S1), 1–9. [Google Scholar] [CrossRef]
  11. Ji, J.Y.; Tang, R.M.; Sun, X.W. Marine Scientific and Technological Innovation, Marine Industrial Structure Upgrade and Marine Total Factor Productivity: Empirical Research Based on Threshold Effect of 11 Coastal Provinces in China. Sci. Technol. Manag. Res. 2021, 41, 73–80. (In Chinese) [Google Scholar]
  12. Virto, L.R. A preliminary assessment of the indicators for Sustainable Development Goal (SDG) 14 “Conserve and sustainably use the oceans, seas and marine resources for sustainable development”. Mar. Policy 2018, 98, 47–57. [Google Scholar] [CrossRef]
  13. Kocak, D.M.; Hotaling, L. Introduction to The United Nations Decade of Ocean Science for Sustainable Development (2021–2030) and the Seabed 2030 Initiative. Mar. Technol. Soc. J. 2021, 55, 1–147. [Google Scholar] [CrossRef]
  14. Ministry of Natural Resources, ICBC. Implementation Opinions on promoting high-quality development of marine economy. Natl. Land Resour. Inf. 2018, 17, 16–19. (In Chinese) [Google Scholar]
  15. Wei, X.; Hu, Q.; Shen, W.; Ma, J. Influence of the evolution of marine industry structure on the green total factor productivity of marine economy. Water 2021, 13, 1108. [Google Scholar] [CrossRef]
  16. Ren, W.; Ji, J.; Chen, L.; Zhang, Y. Evaluation of China’s marine economic efficiency under environmental constraints—An empirical analysis of China’s eleven coastal regions. J. Clean. Prod. 2018, 184, 806–814. [Google Scholar] [CrossRef]
  17. Xie, W.; Yan, T.; Xia, S.; Chen, F. Innovation or introduction? The impact of technological progress sources on industrial green transformation of resource-based cities in China. Front. Energy Res. 2020, 8, 598141. [Google Scholar] [CrossRef]
  18. Geroski, P.A.; Walters, C.F. Innovative activity over the business cycle. Econ. J. 1995, 105, 916–928. [Google Scholar] [CrossRef]
  19. Holland, J.H. Hidden Order: How Adaptation Builds Complexity; Addison Wesley Longman Publishing Co., Inc.: Boston, MA, USA, 1996. [Google Scholar]
  20. Huan, Y.; Liang, T.; Li, H.; Zhang, C. A systematic method for assessing progress of achieving sustainable development goals: A case study of 15 countries. Sci. Total Environ. 2021, 752, 141875. [Google Scholar] [CrossRef] [PubMed]
  21. Yuan, Y.; Jin, M.; Ren, J.; Hu, M.; Ren, P. The dynamic coordinated development of a regional environment-tourism-economy system: A case study from western Hunan province, China. Sustainability 2014, 6, 5231–5251. [Google Scholar] [CrossRef] [Green Version]
  22. Deng, X.; Liang, L.; Wu, F.; Wang, Z.; He, S. A review of the balance of regional development in China from the perspective of development geography. J. Geogr. Sci. 2022, 32, 3–22. [Google Scholar] [CrossRef]
  23. Liu, A.G.; Zhang, Y.; Zhang, Y.K. Theoretical research on regional coordinated development from the perspective of expansion of new economic geography: Summary and Prospect. Inq. Econ. Issues 2014, 11, 184–190. (In Chinese) [Google Scholar]
  24. Cash, D.W.; Clark, W.C.; Alcock, F.; Dickson, N.M.; Eckley, N.; Guston, D.H. Science and technology for sustainable development special feature: Knowledge systems for sustainable development. Proc. Natl. Acad. Sci. USA 2003, 100, 8086–8091. [Google Scholar] [CrossRef] [Green Version]
  25. Tian, J.; Ming, Q. Spatial connection between mountainous scenic spot and town in mountain tourism destination and coupling mechanism: A cases study from Lijiang, Yunnan. Econ. Geogr. 2021, 41, 212–220. (In Chinese) [Google Scholar]
  26. Wang, C.; Yang, Q.; Wu, S. Coordinated development relationship between port cluster and its hinterland economic system based on improved coupling coordination degree model: Empirical study from China’s port integration. Sustainability 2022, 14, 4963. [Google Scholar] [CrossRef]
  27. He, S.; Zhai, R.; Pan, Y. Modeling analysis of the relationship between the exploitation and utilization of marine resources and the sustainable development of the marine economy. J. Coast. Res. 2018, 83, 964–969. [Google Scholar] [CrossRef]
  28. Liu, W.; Ye, B.; Liu, Y. Marine finance and marine science–tech innovation: An industrial panel data-based analysis. J. Coast. Res. 2020, 106, 276–280. [Google Scholar] [CrossRef]
  29. Makkonen, T.; Inkinen, T. Sectoral and technological systems of environmental innovation: The case of marine scrubber systems. J. Clean Prod. 2018, 200, 110–121. [Google Scholar] [CrossRef]
  30. Ma, H.D.; Li, L.X. Could environmental regulation promote the technological innovation of China’s emerging marine enterprises? Based on the moderating effect of government grants. Environ. Res. 2021, 202, 111682. [Google Scholar] [CrossRef]
  31. Zhang, Y.; Wang, S. Influence of marine industrial agglomeration and environmental regulation on marine innovation efficiency—From an innovation value chain perspective. Mar. Policy 2021, 134, 104807. [Google Scholar] [CrossRef]
  32. Xia, K.; Guo, J.K.; Han, Z.L.; Dong, M.R.; Xu, Y. Analysis of the scientific and technological innovation efficiency and regional differences of the land–sea coordination in China’s coastal areas. Ocean. Coast. Manag. 2019, 172, 157–165. [Google Scholar] [CrossRef]
  33. Li, G.; Zhou, Y.; Liu, F.; Tian, A. Regional difference and convergence analysis of marine science and technology innovation efficiency in China. Ocean Coast. Manag. 2021, 205, 105581. [Google Scholar] [CrossRef]
  34. Andersson, J.; Vico, E.P.; Hammar, L.; Sandén, B.A. The critical role of informed political direction for advancing technology: The case of Swedish marine energy. Energy Policy 2017, 101, 52–64. [Google Scholar] [CrossRef]
  35. Al-Belushi, K.I.; Stead, S.M.; Gray, T.; Burgess, J.G. Measurement of open innovation in the marine biotechnology sector in Oman. Mar. Policy 2018, 98, 164–173. [Google Scholar] [CrossRef]
  36. Zhang, X.; Sun, D.; Zhang, X.; Yang, H. Regional ecological efficiency and future sustainable development of marine ranch in China: An empirical research using DEA and system dynamics. Aquaculture 2021, 534, 736339. [Google Scholar] [CrossRef]
  37. Doloreux, D.; Melançon, Y. Innovation-support organizations in the marine science and technology industry: The case of Quebec’s coastal region in Canada. Mar. Policy 2009, 33, 90–100. [Google Scholar] [CrossRef]
  38. Yu, H.; Xing, L. Analysis of the spatiotemporal differences in the quality of marine economic growth in China. J. Coast. Res. 2021, 37, 589–600. [Google Scholar] [CrossRef]
  39. Li, T.; Han, D.; Ding, Y.; Zhang, L. The operation evaluation of China’s marine industry technology innovation system. J. Coast. Res. 2018, 83, 807–813. [Google Scholar] [CrossRef]
  40. Ren, W. Research on dynamic comprehensive evaluation of allocation efficiency of green science and technology resources in China’s marine industry. Mar. Policy 2021, 131, 104637. [Google Scholar] [CrossRef]
  41. Dai, B.; Jin, G. Analysis on temporal and spatial evolution of marine science and technology total factor productivity and its influencing factors in Chinese coastal areas. Geogr. Res. 2015, 2, 328–340. [Google Scholar]
  42. Zhong, S.; Wang, H.; Wen, H.; Li, J. The total factor productivity index of science and technology innovations in the coastal regions of China between 2006 and 2016. Environ. Sci. Pollut. Res. 2021, 28, 40555–40567. [Google Scholar] [CrossRef] [PubMed]
  43. Gissi, E.; Maes, F.; Kyriazi, Z.; Ruiz-Frau, A.; Santos, C.F.; Neumann, B.; Unger, S. Contributions of marine area-based management tools to the UN sustainable development goals. J. Clean. Prod. 2022, 330, 129910. [Google Scholar] [CrossRef]
  44. Zhu, X.; Jia, Y. The blue partnership in the context of global ocean governance. Pac. J. 2019, 27, 50–59. (In Chinese) [Google Scholar]
  45. Ye, F.; Quan, Y.; He, Y.; Lin, X. The impact of government preferences and environmental regulations on green development of China’s marine economy. Environ. Impact Assess. Rev. 2021, 87, 106522. [Google Scholar] [CrossRef]
  46. Shao, Q. Nonlinear effects of marine economic growth and technological innovation on marine pollution: Panel threshold analysis for China’s 11 coastal regions. Mar. Policy 2020, 121, 104110. [Google Scholar] [CrossRef]
  47. Mangone, G.J. Marine Policy for America; Taylor & Francis: London, UK, 1988. [Google Scholar]
  48. Han, Z.L.; Li, B.; Chen, M.B.; Li, D.H. Conversation by writing on high-quality development of marine economy. J. Ocean Univ. China (Soc. Sci.) 2019, 05, 13–21. (In Chinese) [Google Scholar]
  49. Bess, R. Maintaining a balance between resource utilisation and protection of the marine environment in New Zealand. Mar. Policy 2010, 34, 690–698. [Google Scholar] [CrossRef]
  50. Kildow, J.T.; McIlgorm, A. The importance of estimating the contribution of the oceans to national economies. Mar. Policy 2010, 34, 367–374. [Google Scholar] [CrossRef]
  51. Morrissey, K.; O’Donoghue, C. The role of the marine sector in the Irish national economy: An input–output analysis. Mar. Policy 2013, 37, 230–238. [Google Scholar] [CrossRef] [Green Version]
  52. Ren, W. What forces drive the rapid development of mariculture in China: Factor-driven or total factor productivity-driven? Aquac. Res. 2021, 52, 3966–3977. [Google Scholar] [CrossRef]
  53. Ding, L.L.; Zhu, L.; He, G.S. Measurement and influencing factors of green total factor productivity of marine economy in China. Forum Sci. Technol. China 2015, 2, 72–78. [Google Scholar]
  54. Cisneros-Montemayor, A.M.; Moreno-Báez, M.; Reygondeau, G.; Cheung, W.W.; Crosman, K.M.; González-Espinosa, P.C.; Ota, Y. Enabling conditions for an equitable and sustainable blue economy. Nature 2021, 591, 396–401. [Google Scholar] [CrossRef]
  55. Colgan, C.S. The ocean economy of the United States: Measurement, distribution, & trends. Ocean Coast. Manag. 2013, 71, 334–343. [Google Scholar]
  56. Rogers, S.I.; Greenaway, B. A UK perspective on the development of marine ecosystem indicators. Mar. Pollut. Bull. 2005, 50, 9–19. [Google Scholar] [CrossRef]
  57. Douvere, F.; Maes, F.; Vanhulle, A.; Schrijvers, J. The role of marine spatial planning in sea use management: The Belgian case. Mar. Policy 2007, 31, 182–191. [Google Scholar] [CrossRef]
  58. Craig, R.K. Fostering adaptive marine aquaculture through procedural innovation in marine spatial planning. Mar. Policy 2019, 110, 103555. [Google Scholar] [CrossRef] [Green Version]
  59. Gustavsson, M.; Morrissey, K. A typology of different perspectives on the spatial economic impacts of marine spatial planning. J. Environ. Policy Plan. 2019, 21, 841–853. [Google Scholar] [CrossRef]
  60. Li, B.; Tian, C.; Shi, Z.; Han, Z. Evolution and differentiation of high-quality development of marine economy: A case study from China. Complexity 2020, 2020, 5624961. [Google Scholar] [CrossRef]
  61. Ding, L.L. Research on the connotation and evaluation system of high-quality development of marine economy. J. Ocean Univ. China (Soc. Sci.) 2020, 3, 12–20. (In Chinese) [Google Scholar]
  62. Di, Q.B.; Yu, Z.; Xu, L.X. Spatial-temporal coordination mode of marine economic development under the background of high quality growth: Based on the empirical study of prefecture-level cities in Circum-Bohai Sea. Sci. Geogr. Sin. 2019, 39, 1621–1630. (In Chinese) [Google Scholar]
  63. Liu, B.; Long, R.Y.; Zhu, C.G.; Sun, X.X.; Pan, K.Y. Comprehensive measurement of the index system for marine economy high-quality development in Jiangsu province. Econ. Geogr. 2020, 40, 104–113. (In Chinese) [Google Scholar]
  64. Guo, J.; Yuan, X.; Song, W. Driving forces on the development of China’s marine economy: Efficiency and spatial perspective. Ocean Coast. Manag. 2022, 224, 106192. [Google Scholar] [CrossRef]
  65. Petty, W. Essays on Mankind and Political Arithmetic; Cassell: London, UK, 1888. [Google Scholar]
  66. Jackley, J.; Gardner, L.; Djunaedi, A.F.; Salomon, A.K. Ancient clam gardens, traditional management portfolios, and the resilience of coupled human-ocean systems. Ecol. Soc. 2016, 21, 20. [Google Scholar] [CrossRef]
  67. Scheidel, W. A comparative perspective on the determinants of the scale and productivity of maritime trade in the Roman Mediterranean. Princet./Stanf. Work. Pap. Class. Pap. 2009, 040902. [Google Scholar] [CrossRef] [Green Version]
  68. Smith, A. The Wealth of Nations: An Inquiry into the Nature and Causes of the Wealth of Nations; Harriman House Limited: Hampshire, UK, 2010. [Google Scholar]
  69. Marx, K. Selected Writings; Oxford University Press: New York, NY, USA, 2000. [Google Scholar]
  70. Bulmer-Thomas, V.; Coatsworth, J.; Cortes-Conde, R. The Cambridge Economic History of Latin America: Volume 1, The Colonial Era and the Short Nineteenth Century (Vol. 1); Cambridge University Press: Cambridge, UK, 2006. [Google Scholar]
  71. Nordhaus, W.D. The Challenge of Global Warming: Economic Models and Environmental Policy (Vol. 4); Yale University: New Haven, CT, USA, 2007. [Google Scholar]
  72. Holdren, J.P. Science and technology for sustainable well-being. Science 2008, 319, 424–434. [Google Scholar] [CrossRef] [Green Version]
  73. Zhao, R.Y.; Xu, J.M.; Liu, Y.C. Research on the marketization of regional innovation and its mechanism. Soc. Sci. Front. 2021, 07, 252–257. (In Chinese) [Google Scholar]
  74. Glaeser, E.L.; Resseger, M.G. The complementarity between cities and skills. J. Reg. Sci. 2010, 50, 221–244. [Google Scholar] [CrossRef] [Green Version]
  75. Hayami, Y.; Ruttan, V.W. Agricultural productivity differences among countries. Am. Econ. Rev. 1970, 60, 895–911. [Google Scholar]
  76. Acemoglu, D. Why do new technologies complement skills? Directed technical change and wage inequality. Q. J. Econ. 1998, 113, 1055–1089. [Google Scholar] [CrossRef] [Green Version]
  77. Liu, P.; Zhu, B.; Yang, M. Has marine technology innovation promoted the high-quality development of the marine economy?—Evidence from coastal regions in China. Ocean Coast. Manag. 2021, 209, 105695. [Google Scholar] [CrossRef]
  78. Liu, B.; Xu, M.; Wang, J.; Wang, Z.; Zhao, L. Evaluation of China’s marine economic growth quality based on set pair analysis. Mar. Policy 2021, 126, 104405. [Google Scholar] [CrossRef]
  79. Zhang, D.; Fan, W.; Chen, J. Technological innovation, regional heterogeneity and marine economic development—Analysis of empirical data based on China’s coastal provinces and cities. J. Syst. Sci. Inf. 2019, 7, 437–451. (In Chinese) [Google Scholar] [CrossRef]
  80. Yu, D.; Zou, Z. Empirical research on the interaction between marine scientific and technological innovation and marine economic development. J. Coast. Res. 2020, 108, 7–11. [Google Scholar] [CrossRef]
  81. Shao, Q.; Chen, L.; Zhong, R.; Weng, H. Marine economic growth, technological innovation, and industrial upgrading: A vector error correction model for China. Ocean Coast. Manag. 2021, 200, 105481. [Google Scholar] [CrossRef]
  82. Xu, S.; Yue, Q.; Lu, B. Grey correlation analysis on the synergistic development between innovation-driven strategy and marine industrial agglomeration: Based on China’s coastal provinces. Grey Syst. 2020, 12, 269–289. [Google Scholar] [CrossRef]
  83. Liu, S.G.; Ding, L.J. International experience and reference in the construction of marine innovation system. Ocean Dev. Manag. 2012, 29, 63–66. (In Chinese) [Google Scholar]
  84. Wang, Z.Y.; Liu, F.C. Analysis of consistency of marine science and technology innovation ability and marine economy development. Sci. Sci. Manag. S. T. 2011, 32, 42–47. (In Chinese) [Google Scholar]
  85. Sun, C.Z.; Guo, K.M.; Zou, W. The coordination and response between regional marine economy and marine science and technology in China. Resour. Sci. 2017, 39, 2017–2029. (In Chinese) [Google Scholar]
  86. Xie, Z.Y. Difference of marine science and technology innovation level of costal provinces in China and its influence on development of marine economy. Sci. Manag. Res. 2014, 32, 76–79. (In Chinese) [Google Scholar]
  87. Wang, J.Y.; Li, H. Research on the spatiotemporal evolution of the synergy state of China’s marine ecological civilization and marine science and technology innovation system. Sci. Manag. Res. 2021, 41, 212–222. (In Chinese) [Google Scholar]
  88. Di, Q.B.; Gao, G.Y.; Yu, Z. The evaluation and influencing factors of high-quality development of marine economy in China. Sci. Geogr. Sin. 2022, 42, 650–661. (In Chinese) [Google Scholar]
  89. Lu, Y.Y.; Yuan, F.; Li, X.Y. Construction and application of evaluation index system for high-quality development of China’s marine economy: From the perspective of the five development concepts. Enterp. Econ. 2019, 38, 122–130. (In Chinese) [Google Scholar]
  90. Wang, Y.Y. Construction of index system of high-quality development of marine economy and comprehensive evaluation. Stat. Decis. 2021, 37, 169–173. (In Chinese) [Google Scholar]
  91. Zameer, H.; Yasmeen, H.; Wang, R.; Tao, J.; Malik, M.N. An empirical investigation of the coordinated development of natural resources, financial development and ecological efficiency in China. Resour. Policy 2020, 65, 101580. [Google Scholar] [CrossRef]
  92. Liu, K.; Lin, B. Research on influencing factors of environmental pollution in China: A spatial econometric analysis. J. Clean. Prod. 2019, 206, 356–364. [Google Scholar] [CrossRef]
  93. Jie, X.M.; Wang, H.; Wang, Y.S.; Xiang, C.S.; Li, Y.L.; Wang, W.T.; Sun, Q. Measurement and spatial characteristics of China’s marine S&T innovation capability: Empirical analysis based on 36 sea-related cities. Sci. Technol. Manag. Res. 2020, 40, 65–71. (In Chinese) [Google Scholar]
  94. Liu, R.; Pu, L.; Zhu, M.; Huang, S.; Jiang, Y. Coastal resource-environmental carrying capacity assessment: A comprehensive and trade-off analysis of the case study in Jiangsu coastal zone, eastern China. Ocean Coast. Manag. 2020, 186, 105092. [Google Scholar] [CrossRef]
  95. Dong, S.; Zheng, J.; Li, Y.; Li, Z.; Li, F.; Jin, L.; Bilgaev, A. Quantitative analysis of the coupling coordination degree between urbanization and eco-environment in Mongolia. Chin. Geogr. Sci. 2019, 29, 861–871. [Google Scholar] [CrossRef] [Green Version]
  96. Li, Y.; Li, Y.; Zhou, Y.; Shi, Y.; Zhu, X. Investigation of a coupling model of coordination between urbanization and the environment. J. Environ. Manag. 2012, 98, 127–133. [Google Scholar] [CrossRef]
  97. Zhou, D.; Xu, J.; Lin, Z. Conflict or coordination? Assessing land use multi-functionalization using production-living-ecology analysis. Sci. Total Environ. 2017, 577, 136–147. [Google Scholar] [CrossRef]
  98. Yang, R.; Miao, X.; Wong, C.W.; Wang, T.; Du, M. Assessment on the interaction between technology innovation and eco-environmental systems in China. Environ. Sci. Pollut. Res. 2021, 28, 63127–63149. [Google Scholar] [CrossRef]
  99. Wang, Y.; Deng, Q.; Zhang, Y. Research on the coupling and coordinated development of marine technological innovation and marine ecological economic development. J. Coast. Res. 2020, 99, 419–427. [Google Scholar] [CrossRef]
  100. Rosenblatt, M. On some nonparametric estimates of a density function. Ann. Math. Stat. 1956, 27, 832–837. [Google Scholar] [CrossRef]
  101. Shi, C.; Zeng, X.; Yu, Q.; Shen, J.; Li, A. Dynamic evaluation and spatiotemporal evolution of China’s industrial water use efficiency considering undesirable output. Environ. Sci. Pollut. Res. 2021, 28, 20839–20853. [Google Scholar] [CrossRef] [PubMed]
  102. Liu, X.; Sun, T. Dynamic driving and counterfactual decomposition of the influencing factors of household energy consumption among provinces in China. J. Clean. Prod. 2019, 230, 1229–1240. [Google Scholar] [CrossRef]
  103. Lefever, D.W. Measuring geographic concentration by means of the standard deviational ellipse. Am. J. Sociol. 1926, 32, 88–94. [Google Scholar] [CrossRef]
  104. Zhang, X.; Guo, S.; Guan, Y.; Cai, D.; Zhang, C.; Fraedrich, K.; Tian, Z. Urbanization and spillover effect for three megaregions in China: Evidence from DMSP/OLS nighttime lights. Remote Sens. 2018, 10, 1888. [Google Scholar] [CrossRef] [Green Version]
  105. Li, Y.; Wu, W.; Wang, Y. Global poverty dynamics and resilience building for sustainable poverty reduction. J. Geogr. Sci. 2021, 31, 1159–1170. [Google Scholar] [CrossRef]
  106. Shi, L.; Wang, Y.; Liu, Y.; Li, Y. The poverty evolution of typical countries along the Belt and Road and implications from China’s poverty reduction experiences. J. Geogr. Sci. 2022, 32, 458–476. [Google Scholar] [CrossRef]
  107. Li, L.; Zeng, W.P. Research on spatial heterogeneity of coupling coordination between scientific and technological innovation and economic development in China. East China Econ. Manag. 2019, 10, 12–19. (In Chinese) [Google Scholar]
  108. Flood, R.L.; Carson, E. Dealing with Complexity: An Introduction to the Theory and Application of Systems Science; Springer Science & Business Media: Berlin/Heidelberg, Germany, 1993. [Google Scholar]
  109. Zhou, Q.; Gao, R.; Yuen, K.F. Marine fuel refining technology improvement trade-offs: A game theoretic approach. Mar. Policy 2021, 132, 104677. [Google Scholar] [CrossRef]
  110. Teece, D.J.; Pisano, G.; Shuen, A. Dynamic capabilities and strategic management. Strateg. Manag. J. 1997, 7, 509–533. [Google Scholar] [CrossRef]
  111. Yao, Y.L. Technological and scientific policy analysis with the relationship between innovation rate and economic growth. Manag. World 2009, 12, 170–171. (In Chinese) [Google Scholar]
  112. Fang, Q.; Sheng, Y. Study on the relationship between modernized economic system construction and transfer and transformation of scientific and technological achievements. In Proceedings of the International Conference on Management Science and Engineering Management, Ontario, ON, Canada, 5–8 August 2019; Springer: Cham, Switzerland, 2019; pp. 61–74. [Google Scholar]
  113. Research Group of Economic Research Institute of National Development and Reform Commission. Research on promoting high-quality economic development. Macroeconomics 2019, 2, 5–17+91. (In Chinese) [Google Scholar]
  114. Ma, Y.W. Strategic thinking on the overall development of land economy, marine economy and aerospace economy. Public Financ. Res. 2011, 10, 2–6. (In Chinese) [Google Scholar]
  115. Myrdal, G. Economic Theory and Under-Developed Regions; Harper & Brothers: New York, NY, USA, 1957. [Google Scholar]
  116. Sun, W.J.; Yan, W.Q. Research on the Influence of China’s Communication Infrastructure on Urban-Rural Income Gap: Based on the Perspective of Spatial Spillover. Econ. Issues China 2021, 6, 33–46. (In Chinese) [Google Scholar]
  117. Leibenstein, H. Economic Backwardness and Economic Growth: Studies in the Theory of Economic Development; Wiley: New York, NY, USA, 1957. [Google Scholar]
  118. Nurkse, R. Some international aspects of the problem of economic development. Am. Econ. Rev. 1952, 42, 571–583. [Google Scholar]
  119. Hirschman, A.O. The Strategy of Economic Development; Yale University Press: New Haven, CT, USA, 1958. [Google Scholar]
  120. Friedmann, J. Regional Development Policy: A Case Study of Venezuela; MIT Press: Cambridge, MA, USA, 1966. [Google Scholar]
  121. Meadows, D.H.; Meadows, D.L.; Randers, J. The Limits to Growth: A Report for the Club of Rome’s Project on the Predicament of Mankind; Universe Books: New York, NY, USA, 1972. [Google Scholar]
  122. Yu, S.; Zhang, S.; Yuizono, T. Exploring the influences of innovation climate and resource endowments through two types of university–Industry collaborative activities on regional sustainable development. Sustainability 2021, 13, 7559. [Google Scholar] [CrossRef]
  123. Lin, X.; Zheng, L.; Li, W. Measurement of the contributions of science and technology to the marine fisheries industry in the coastal regions of China. Mar. Policy 2019, 108, 103647. [Google Scholar] [CrossRef]
  124. Wang, A.M. The interactive mechanism between marine s&t and marine economy. China Soft Sci. 2016, 8, 40–49. (In Chinese) [Google Scholar]
  125. Wang, W.; Zhou, L.; Chen, W.; Wu, C. Research on the coordination characteristics and interaction between the innovation-driven development and green development of the Yangtze River Economic Belt in China. Environ. Sci. Pollut. Res. 2022, 29, 22952–22969. [Google Scholar] [CrossRef]
  126. Ren, W.; Wang, Q.; Ji, J. Research on China’s marine economic growth pattern: An empirical analysis of China’s eleven coastal regions. Mar. Policy 2018, 87, 158–166. [Google Scholar] [CrossRef]
  127. Liang, L.; Wang, Z.B.; Luo, D.; Wei, Y.; Sun, J. Synergy effects and it’s influencing factors of China’s high technological innovation and regional economy. PLoS ONE 2020, 15, e0231335. [Google Scholar] [CrossRef] [PubMed]
  128. Gai, M.; He, Y.N.; Ke, L.N. Research on the development quality of China’s marine economy. J. Nat. Resour. 2022, 37, 942–965. (In Chinese) [Google Scholar] [CrossRef]
  129. Zhang, J.; Wu, G.Y.; Zhang, J.P. The estimation of China’s provincial capital stock: 1952–2000. Econ. Res. J. 2004, 10, 35–44. [Google Scholar]
  130. McCalla, R.J. Specialization and economic impact of the ports of Montreal, Quebec, Saint John, and Halifax. Marit. Policy Manag. 1979, 6, 285–292. [Google Scholar] [CrossRef]
  131. Xu, M.; Jiang, Y. Can the China’s industrial structure upgrading narrow the gap between urban and rural consumption? J. Quant. Tech. Econ. 2015, 32, 3–21. (In Chinese) [Google Scholar]
  132. Wang, X.L.; Fan, G.; Hu, L.P. China’s Provincial Marketization Index Report (2006–2019); Social Sciences Literature Press: Beijing, China. (In Chinese)
Figure 1. Study area.
Sustainability 14 07373 g001
Figure 2. Temporal evolution of coupling coordination.
Sustainability 14 07373 g002
Figure 3. Spatial evolution of coupling coordination.
Sustainability 14 07373 g003
Figure 4. Evolution of relative development degree.
Sustainability 14 07373 g004
Figure 5. Standard Deviational Ellipse.
Sustainability 14 07373 g005
Figure 6. Gaussian kernel density of coupling coordination.
Sustainability 14 07373 g006
Table 1. Evaluation index system of marine S&T innovation.
Target LayerRule LayerElement LayerIndex Layer (Character)
Marine S&T innovation indexLevel of marine S&T innovation inputLevel of capital inputFund income of marine scientific research institutions (CYN 10,000) (+)
Level of personnel inputNumber of employees in marine scientific research institutions (+)
Level of marine S&T innovation outputLevel of patent outputTotal number of invention patents owned by marine scientific research institutions (+)
Level of research topic outputNumber of scientific and technological topics of marine scientific research institutions (+)
Level of papers outputNumber of scientific papers published by marine scientific research institutions (+)
Level of works outputNumber of scientific and technological works published by marine scientific research institutions (+)
Quality of marine S&T innovation environmentLevel of government-research collaborationGovernment investment in construction of marine scientific research institutions (CYN 10,000) (+)
Level of platform agglomeration efficiencyNumber of marine scientific research institutions (+)
Level of human capitalNumber of people with college education or above per 100,000 people (+)
Table 2. Evaluation index of the development of a marine economy.
Target LayerRule LayerElement LayerIndex Layer (Character)
The high-quality development index of the marine economyInnovation degree of the marine economyLevel of economic development EfficiencyMarine economic efficiency (+)
Marine productivity level (+)
Level of marine development capabilityNumber of port berth (+)
Length of wharf (+)
Proportion of sea for determining rights (%) (+)
Coordination degree of the marine economyCoordination level of economic outputCoordination degree of economic structure (+)
Coordination degree of supply and demand (+)
Coordination degree of industry structure (+)
Coordination level of spatial developmentCoordination degree of urban-rural development (+)
Coordination degree of land and marine development (+)
Coordination level of resource utilizationCoordination degree of fund utilization (+)
Gross marine production (GMP) per unit of marine jurisdiction (+)
Proportion of marine employees (%) (+)
Green degree of the marine economyLevel of pollutionWastewater discharge per unit of GMP (−)
Output of industrial solid waste per unit of GMP (−)
Industrial SO2 emission per unit of GMP (−)
Industrial smoke emission per unit of GMP (−)
Level of energy consumptionElectricity consumption per unit of GMP (−)
Water consumption per unit of GMP (−)
Level of ecological governanceComprehensive utilization of industrial solid waste (+)
Daily treatment capacity of wastewater facilities (+)
Investment in ecological protect per unit of GMP (+)
Observation station (+)
Level of resource abundanceMarine protected areas (+)
Total water resources (+)
Total wetland area (+)
Openness degree of the marine economyLevel of capital opennessForeign direct investment (+)
Outward foreign direct investment (+)
Level of trade opennessExport volume (+)
Import volume (+)
Level of port opennessPort location quotient (+)
Port radiant energy (+)
Level of cultural opennessFive-star hotels (+)
Beds in five-star hotels (+)
Occupancy rate of beds in five-star hotels (+)
Foreign students in China (+)
Sharing degree of the marine economyLevel of income securityDisposable income of urban residents (+)
Disposable income of rural residents (+)
Level of consumption securityConsumption expenditure of urban residents (+)
Consumption expenditure of rural residents (+)
Level of employment securityNatural unemployment rate (−)
Level of education securityNumber of marine education degree programs (+)
Number of students in marine education degree programs (+)
Number of teachers in marine education degree programs (+)
Level of health securityNumber of medical and health institutions (+)
Number of beds in medical and health institutions (+)
Number of staffs in medical and health institutions (+)
Table 3. Classifications of coupling coordination levels.
Value RangeStatusType
0–0.2Severe dissonanceLow-level
0.2–0.4Moderate dissonance
0.4–0.5On the verge of dissonanceMedium-level
0.5–0.6Primary coordination
0.6–0.8Good coordinationHigh-level
0.8–1.0High-quality coordination
Table 4. Influencing factors of coupling coordination.
Influencing FactorsSpecific FactorsIndex Measurement (Expected Impact)
Driving factors Industrial   improvement   demand   ( I U D )Marine industrial structure upgrading index (+)
Consumption   expansion   demand   ( C E D )Proportion of total retail sales of social consumer goods in GMP (%) (+)
Coordination factors Environmental   openness   level   ( E O L )Average investment amount of foreign-invested enterprises (+)
Marketization   level   ( M K L )Marketization index (+)
Conduction factors Technology   transfer   ability   ( T T A )Technology market turnover per unit of GDP (%) (+)
Information   interaction   ability   ( I I A )Number of Internet Broadband Access Ports (+)
Supportability factors Government   support   level   ( G S L )Rate of fiscal gap (%) (−)
Multi - dimensional   spatial   integration   level   of   land ,   marine   and   air   ( M I L ) Multi-dimensional Integration Index of Land, Marine and Air (+)
Table 5. The results of model test.
Unit Root TestVIF TestKao Test
VariableAdjusted t *VIFStatistical IndicatorsT
l n I U D −3.7076 ***1.45Modified Dickey–Fuller−4.3459 ***
l n C E D −3.7579 ***1.28Dickey–Fuller−5.1695 ***
l n E O L −2.0742 **8.3Augmented Dickey–Fuller−4.7396 ***
l n M K L −3.4908 ***2.72Unadjusted modified Dickey–Fuller−5.7450 ***
l n T T A −6.2793 ***6.73Unadjusted Dickey–Fuller−5.5716 ***
l n I I A −4.6649 ***3.25
l n G S L −2.0793 **3.03
l n M I L −51.3903 ***2.44
***, **, and * represent the significance levels of 1%, 5%, and 10%, respectively.
Table 6. Results of regression and relative tests.
Indepvars(1) FE(2) FE (LSDV)(3) RE(4) RE-2SLS(5) FE-2SLS
l n I U D 0.123 ***
(2.77)
0.123 *
(2.1)
0.088 **
(2.12)
0.134 **
(2.36)
0.214 ***
(2.9)
l n C E D 0.159 *
(1.83)
0.159 ***
(3.59)
0.162 **
(1.88)
0.335 ***
(2.82)
0.362 ***
(2.65)
l n E O L 0.095 **
(2.11)
0.095 ***
(4.49)
0.086 **
(2.34)
0.039
(1.04)
0.01
(0.18)
l n M K L 0.054
(0.42)
0.054
(0.49)
−0.002
(−0.02)
0.037
(0.32)
0.08
(0.6)
l n T T A 0.028 *
(1.68)
0.028 *
(1.7)
0.043 ***
(2.81)
0.049 ***
(3.1)
0.044 **
(2.37)
l n I I A 0.157 ***
(3.99)
0.157 ***
(4.34)
0.098 ***
(2.91)
0.082 **
(2.47)
0.092 **
(2.1)
l n G S L −0.222 **
(−2.23)
−0.222 **
(−2.96)
−0.137 *
(−1.68)
−0.212 **
(−2.48)
−0.273 **
(−2.35)
l n M I L 0.047
(1.56)
0.047
(1.44)
0.068 **
(2.41)
0.262 ***
(4.43)
0.31 ***
(3.11)
C−3.248 ***
(−3.91)
−3.248 ***
(−5.56)
−2.749 ***
(−5.2)
−1.704 ***
(−3.1)
−1.311
(−1.22)
R 2 0.8720.8720.8670.8540.887
F-stat38.18 ***381.74 ***---
Wald   χ 2 --818.5 ***736.43 ***14328.12 ***
YearYESYESYESYESYES
provinceYESYESNONOYES
Obs143143143132132
Model selection test
LM--57.62 ***--
Autocorrelation 2.602----
Heteroscedasticity 600.06 ***----
Cross-sectional dependency0.846 > 0.198(p = 0.1)----
Individual effect-1008.59 ***---
Hausman--13.58--
Hausman (with heteroscedasticity and cross-sectional dependency)--229.96 ***489.35 ***-
Endogenous and instrumental variable test
Wu-Hausman18.180 ***
Weak InstrumentsL1.IDU:F = 36.43 > 10 ***
L1.CED:F = 28.05 > 10 ***
L1.GLS:F = 22.18 > 10 ***
Sargan statistic χ 2 = 4.4140
p = 0.1262
***, **, and * represent the significance levels of 1%, 5%, and 10%, respectively.
Table 7. Results of regression and relative tests.
Indepvars(1) South (H = 0)
FE-2SLS
(2) North (H = 1)
FE-2SLS
Interactive
Variable
(3) Gap between North–South
FE-2SLS
l n I U D 0.363 ***
(5.15)
0.101 ***
(2.72)
H i # l n I U D −0.262 ***
(−3.28)
l n C E D 0.819 ***
(6.23)
0.101
(0.42)
H i # l n C E D −0.718 ***
(−2.66)
l n E O L 0.117 ***
(2.71)
0.073 ***
(2.74)
H i # l n E O L −0.044
(−0.87)
l n M K L 0.069
(0.59)
−0.027
(−0.33)
H i # l n M K L −0.096
(−0.68)
l n T T A 0.056 **
(2.08)
0.047 ***
(2.72)
H i # l n T T A −0.009
(−0.27)
l n I I A −0.014
(−0.62)
0.085 ***
(2.69)
H i # l n I I A 0.098 ***
(2.58)
l n G S L −0.432 ***
(−5.37)
−0.121
(−2.3)
H i # l n G S L 0.311 ***
(3.23)
l n M I L 0.435 ***
(6.57)
0.172 ***
(3.36)
H i # l n M I L −0.263 ***
(−3.14)
H i -- H i 0.372 *
(1.95)
Cons−2.793 ***
(−5.49)
−2.793 ***
(−5.49)
Cons−2.793 ***
(−5.49)
R 2 0.9480.948 R 2 0.948
F-stat132.61132.61F-stat123.55
YearYESYESYESYES
provinceYESYESYESYES
Obs132132132132
Endogenous test
Wu-Hausman43.641 ***
Weak InstrumentsL1.IDU:F = 44.85 > 10 ***
L1.CED:F = 21.26 > 10 ***
L1.GLS:F = 29.33 > 10 ***
Sargan statistic χ 2 = 0.281
p = 0.5963
***, **, and * represent the significance levels of 1%, 5%, and 10%, respectively.
Publisher’s Note: MDPI stays neutral with regard to jurisdictional claims in published maps and institutional affiliations.

