Article

Optimization of Seismic Base Isolation System Using Adaptive Harmony Search Algorithm

1
Department of Civil Engineering, İstanbul University-Cerrahpaşa, Istanbul 34320, Turkey
2
Department of Civil and Environmental Engineering, Temple University, Philadelphia, PA 19122, USA
3
College of IT Convergence, Gachon University, Seongnam 13120, Korea
*
Authors to whom correspondence should be addressed.
Sustainability 2022, 14(12), 7456; https://doi.org/10.3390/su14127456
Submission received: 4 May 2022 / Revised: 31 May 2022 / Accepted: 16 June 2022 / Published: 18 June 2022

Abstract

:
In this study, a seismic isolator placed on the base of a structure was optimized under various earthquake records using an adaptive harmony search algorithm (AHS). As known, the base-isolation systems with very low stiffness provide a rigid response of superstructure, so it was assumed that the structure is rigid and the base-isolated structure can be considered as a single-degree of freedom structure. By using this assumption, an optimization method that is independent of structural properties but specific to the chosen earthquake excitation set is proposed. By taking three different damping ratio limits and isolator displacement limits, the isolator period and damping ratio were optimized so that the acceleration of the structure was minimized for nine cases. In the critical seismic analysis performed with optimum isolator parameters, the results obtained for different damping ratios and isolator periods were compared. From the results, it is determined that isolators with low damping ratios require more ductility, and as the damping ratio increases, further restriction of the movement of the isolator increases the control efficiency. Thus, it is revealed that increasing the ductility of the isolator is effective in reducing the total acceleration in the structure.

1. Introduction

Seismic isolation is the process of isolation intervention between the superstructure and substructure to minimize the superstructure deformation subject to ground motion. Public buildings such as schools, hospitals, community centers, libraries, courts, information centers, and government buildings are very important for seismic safety, and various seismic isolators have been developed and applied for protecting them from earthquakes. Considering earthquake waves, it is known that horizontal waves have more destructive effects than vertical ones. The aim of using the base isolators is to separate the vibration of the substructure from that of the superstructure, to ensure that the superstructure behaves independently from ground vibrations.
Seismic isolation systems consist of rubber-based, sliding, rubber–sliding mixed, and spring-type systems [1]. In sliding and rubber–sliding mixed systems, the coefficient of friction comes into play. The selection for the seismic isolation type is decided based on the importance of the building and the seismicity of the region. When seismic isolation is applied to a structure, the design is based on dynamic analysis. On the other hand, excessive ductility of the isolator in the face of an unexpected earthquake with great intensity puts the safety of the design at risk [2,3]. To verify the safety of the isolation system, it has been proposed to use random earthquake excitations. The high ductile isolator prevents its movement under the lower levels of the earthquakes, thus preventing the transmission of earthquake forces to the structure [2,4]. For both types of earthquakes, the aim should be to determine the optimum parameters for the isolators, to design a structure. The correct selection of the isolator period, which affects the stiffness, is of great importance for a structural design that is suitable for both lower-intensity and higher-intensity earthquakes. A completely rigid or ductile isolator system design can cause a situation that can negatively affect control efficiency. Although the ductile behavior of the isolators is desired in the control, the mobility of the isolators should be determined by considering the fragility of the structure. Material properties have been shown as one of the parameters affecting the ductility of isolators. The flexibility of the elastomeric material used in the design of the isolator will directly affect the ductility of the isolator, and therefore the control effect. To examine the control performance of bonded fiber-reinforced elastomeric isolators (UFREIs) made of recycled rubber, Habieb et al. investigated its effect on isolator performance by conducting experimental studies on the vulcanization process, which affects the rubber stiffness and durability of the isolator [5]. In their research, Wang et al. evaluated the prediction of fatigue life of vulcanized natural rubber with various tests under proportionate and disproportionate loading conditions [6]. It is also known that, apart from the isolator bearing and the elastomeric material, the isolator bearing also affects energy dissipation. Markou and Manolis proposed a series of mechanical models for the shear behavior of high-damping rubber bearings under compression [7]. Özkaya et al. improved energy dissipation by developing a ball rubber bearing (BRB), which they filled with balls by creating a hole in the isolator bearing [8]. The elastomeric material property of the isolator, design of the isolator bed suitable for energy dissipation, the fatigue life of the elastomeric material, etc., were also studied. These properties significantly affect the obtained efficiency and control process of the isolator. In addition, increasing the damping ratio of the isolator is another way of influencing seismic control by achieving stiffness. Keeping this increase at a certain level is essential to obtaining the optimum design. Operations to increase the damping ratio of the isolator will also increase the angular frequency of the isolator as well as its stiffness. Therefore, it is necessary to optimize the period and damping ratio of the isolator for seismic isolator system design.
Optimization is a frequently used method in the design of structures with a seismic base isolator including stiffness, damping ratio, characteristic strength, and friction properties. There are many studies in which isolator parameters are optimized [9,10,11,12,13,14,15]. Metaheuristic algorithms are an optimization method that has made a success for itself with algorithms derived from the regular order in nature and living life, which has applications in various seismic control studies in recent years. When studies on seismic base isolation are examined, it is seen that metaheuristic algorithms are used in the optimization of the base isolator design. The properties of triple friction pendulum isolation systems have been optimized by a genetic algorithm (GA) [16,17,18]. Dang et al. proposed a two-stage optimization method for parameter and layout optimization of the lead–rubber isolator system [19]. Aceto et al. optimized a hybrid isolation system to protect server racks [20]. Tsipianitis and Tsompanakis optimized the parameters of the base isolation system with liquid storage tanks, using the swarm intelligence (SI) algorithm and its derivatives [21]. Çerçevik et al. investigated a seismically isolated shear frame with crow search algorithm (CSA), whale optimization (WOA), and gray wolf optimization (GWO) [22]. Etedali et al. proposed a cuckoo search-based optimization (CSO) design to reduce the displacement and superstructure acceleration for base-isolated structures [23]. Nigdeli et al. conducted an optimization process to minimize acceleration with a harmony search algorithm (HS) in seismic isolator systems [24]. The recent studies on this subject prove that metaheuristics are effective tools to optimize base isolation systems. Different from these studies, in a simplified optimization methodology, the main structure is considered to be a rigid one, to provide optimum base isolation system parameters found according to earthquake excitation and parameter limitations of base isolation systems. Since the main idea of base-isolated structures is to obtain a long natural period of the system, displacement and damping limitations play more important roles in the design rather than the behavior of the main structure.
The harmony search (HS) algorithm is one of the metaheuristic algorithms developed by Geem et al. [25]. HS algorithm includes design factors similar to those of other metaheuristic algorithms. These factors include expressions specific to nature or living behavior from which the algorithm is derived. During the optimization process, design factors are chosen based on an estimate within a defined range. However, it is possible to adjust these factors. By modifying the HS algorithm, the adaptive HS algorithm (AHS) has been developed. The main design algorithm factors that can be adapted are fret width (FW) and harmony memory consideration ratio (HMCR). By adopting these factors, the algorithm becomes more efficient [26,27,28].
In this study, the properties of a seismic base isolator at the bottom of a superstructure were optimized for the acceleration of the structure under 22 earthquake records including FEMA far-fault records [29]. The study aimed to present an optimum system with displacement and damping limits, which is independent of the structural properties but specific to a region with applied earthquake records. The stiffness of the structure does not affect the optimum values since the flexibility of the structure is ignored due to small effects resulting from a rigid structure, compared with a highly flexible base isolation system. Seismic data were applied to the structure via MATLAB Simulink [30]. In the optimization, AHS was used, and optimum algorithm parameters were obtained by giving an initial value to FW and HMCR. Critical earthquake analyses were performed by optimizing for nine cases at three different damping ratios and the displacement limits defined for the isolator.

2. Optimization of Seismic Isolator System

A seismically isolated structure consists of three parts. These are the superstructure, the base isolation system, and the substructure. When designing seismic isolators, the isolator mass is considered and used as a superstructure mass. In the application of a vertically rigid and horizontally flexible isolator, the superstructure and the isolators can be designed as two moving masses together. In constructing the equations of motion, it is possible to treat a multistory structure as a single-degree-of-freedom system (SDOF), which acts as a single-story structure with an isolator system. In this case, the total mass parameter ( m t o t a l ) to be used in the equations of motion is defined in Equation (1). Here, m b is the isolator story mass, and m s t r u c t u r e is the mass of the superstructure without an isolator system.
m t o t a l = m b + m s t r u c t u r e
The period (Tb), stiffness ( k b ) and damping coefficient ( ζ b ) of the isolator system are calculated over the total mass as in Equations (2)–(4). In the equations, k b is the stiffness of the isolator, c b is the damping coefficient, w b is its natural angular frequency, and ζ b is the damping ratio.
T b = 2 π w b
k b = m t o t a l × w b 2
c b = 2 × ζ b × m t o t a l × w b
The equation of motion of the system with one degree of freedom is calculated with Equation (5). X represents the response of the structure’s underground acceleration ( X ¨ g ).
m t o t a l X ¨ + c b X ˙ + k b X = m t o t a l X ¨ g
In the consideration of the base-isolated structure model that is used in the optimization, a single degree of freedom model is considered to find optimum values that are not specific to superstructure properties that act as rigid due to high stiffness with respect to base isolator stiffness. The specific optimization involves the character of the chosen earthquake record data set together with a selected range for design variables and displacement limitations for the base isolators. The optimization aims to find the optimum period and damping coefficient of the isolator system. These two properties of the base isolator system are taken as design variables. The objective function (f(x)) is to reduce the maximum acceleration under several earthquake excitations, as given in Equation (6), and the displacement of the isolation system is limited as a design constraint (g(x)) given in Equation (7).
f ( x ) = max ( | X ¨ | )  
g ( x ) = max ( | X | )
In a metaheuristic-based optimization process, the design constants are defined. In this methodology, earthquake record data and design variable ranges are constants. Then, an initial solution matrix is generated. This initial solution matrix contains several numbers of candidate values of design variables that are selected within the defined ranges. According to these values, dynamic analyses are performed for all excitations to calculate the optimization objective and design constraint. All candidate variables and results are stored, and finally, the number of sets is equal to a population number. Then, these results are updated according to the specific rules of an algorithm.
HS algorithm is a metaheuristic algorithm developed by Geem et al. [25]. In the use of optimization, the process begins with the random harmony generation process after the definition of the problem, design factors, and limit values. Harmony vectors created by repeating operations up to the harmony memory size (HMS) within the limit values are stored. Equation (8) shows the equation for creating a harmony vector.
X n e w = X m i n + r a n d   ( X m a x X m i n )       i f   H M C R r a n d
There is another way to create a harmony vector. For this, the fret width (FW) parameter is used. The process of creating a harmony vector with the fret width parameter is given in Equation (9).
X n e w = X n + r a n d   F W   ( X m a x X m i n )       i f   H M C R > r a n d
The harmony memory consideration ratio (HMCR) decides which of the two equations used to create the harmony vector will be chosen. Accordingly, new vectors are created using Equation (9) if a randomly selected number between 0 and 1 is less than the HMCR value, and Equation (8) if it is greater than or equal to the value of HMCR.
Each vector created operates in a process where the good one is selected by comparing it in terms of the objective function values with the old harmony vector values, and the bad one is updated with the new one. When these operations are completed by using the amount of iteration, the optimum solution is obtained. Additionally, design constraint is also considered, and the violated results are accepted as the worst solution in comparison. In the case of violation of both results, the objective function is considered in the comparison made to decide the better one.
The HMCR and FW parameters are adapted to create AHS. First, these two parameters are given the initial value and gradually decreased; then, the optimum design factors are determined by the objective function within these decreasing values. Equations (10) and (11) show the HMCR and FW production process equations.
H M C R = H M C R i n ( 1 + t m t   )  
F W = F W i n ( 1 t m t   )
In the above equations, the maximum number of iterations is shown as mt, and the number of iterations as t. H M C R and F W starting values are expressed as H M C R i n and F W i n , respectively.

3. Numerical Examples

In this study, seismic analysis of a single-degree-of-freedom (SDOF) system with seismic isolation system was investigated. The structural model with the base isolation system was performed using the data of the FEMA earthquake records. Then, the structure displacement and total acceleration values in the critical earthquake record were obtained. Table 1 shows the list of FEMA records applied to the structure as a simulation.
In the AHS algorithm optimization, the initial values of HMCR and FW were taken as 0.5 and 0.05, respectively. All parameters used in optimization are given in Table 2.
A model was created by placing the seismic base isolator on the base of a single degree of freedom (SDOF). As the system without an isolation system, a 10-story structural model with a weight of 360 tons for each floor, a stiffness of 650 MN/m, and a damping coefficient of 6.2 MNs/m was used in the comparison of results [31]. Figure 1 shows the SDOF construction model with isolators.
Under earthquake excitations, the building model with isolators was optimized to minimize the building acceleration. The period and damping ratio values of the isolator were optimized for 30%, 40%, and 50% damping ratio and displacement limit values of 30 cm, 40 cm, and 50 cm. The optimum isolator parameters obtained from the optimization are shown in Table 3.
The maximum structural displacement was observed in the DUZCE/BOL090 earthquake record for the 10-story structure without an isolation system. The displacement and total acceleration values obtained from that critical earthquake record for the optimum isolator parameters are given in Table 4. For the uncontrolled structure, the responses were taken for the top story.
The displacement and total acceleration graphs obtained from the critical earthquake analysis for a maximum 30% damping ratio are shown in Figure 2, Figure 3 and Figure 4 for 30, 40, and 50 cm displacement limits, respectively. The same plots for the maximum 40% damping ratio are Figure 5, Figure 6 and Figure 7 for 30, 40, and 50 cm displacement limits, respectively. The maximum 50% damping ratio plots are given in Figure 8, Figure 9 and Figure 10 for the displacement limits of 30, 40, and 50 cm.

4. Discussion

In this study, we addressed the optimization of the period and damping ratio of an isolator placed on the base of a single-degree-of-freedom (SDOF) structure to reduce the acceleration with an AHS algorithm. For this purpose, different damping ratios and displacement limit values were defined for the isolator system. The effect of the seismic isolation system on the movement of the structure exposed to earthquake excitation was investigated. Several analyses were carried out for the created ten-story building model that behaves like a single-degree-of-freedom structure. There was one critical earthquake in the FEMA earthquake records similar to DUZCE/BOL090, which was excited to the model via MATLAB Simulink. The percentages of decrease in the displacement and total acceleration values of the isolated structure under DUZCE/BOL090 are shown in Table 5.
As shown in Table 5, bringing the isolator displacement limit from 30 cm to 40 cm for the 30% damping ratio limit caused a performance loss. If the displacement limit was reduced to 50 cm, the optimum value of the total acceleration reduction value obtained for all cases was 95%. Although the increasing displacement effect was not as efficient as the total acceleration, there was an increase of approximately 2.5%.
In the analysis with a 40% damping ratio limit, increasing the displacement limit led to an initial increase, followed by a decrease in the displacement, while the total acceleration always decreased. For 40% and 50% damping ratio limits, this increase-and-decrease performance was observed in total acceleration and displacement move in the same course. Therefore, based on Table 5, maximum displacement reduction performance was detected at a 50% damping ratio and 30 cm displacement limit, while maximum total acceleration reduction rate was observed at a 30% damping ratio and 50 cm displacement limit.
It can be stated that the increase in the damping ratio limit for the 30 cm limit value regularly increased by approximately 6% in the displacement reduction effect. In this case, it was determined that, when the damping ratio increased for the 40 cm limit, the performance increase slowed down and began to decrease at the 50% limit damping ratio. For the 50 cm displacement limit, this decreasing performance became regular.
The critical earthquake record of the isolator structure for all displacement and damping limit values was the CHICHI/CHY101-N earthquake with record number 38. Structure displacement values with and without isolators obtained from all FEMA records are shown in Figure 11, Figure 12 and Figure 13 for 30%, 40%, and 50% damping ratio limits, respectively.
When Figure 11, Figure 12 and Figure 13 are examined, it is revealed that the displacement peak value of the structure without an isolator was in the 6th earthquake record, and the displacement peak value of the structure with an isolator is in the 38th earthquake record. Thus, it is deduced that adding an isolator system to the structure can change the critical earthquake into which the structure is forced. In nine analyses, the same earthquake registration number was the critical earthquake, but excitations were different in maximum acceleration and displacement results. This proved the importance of the design aspect in base isolators, because the isolation system may have sufficient displacement capacity for a ground motion, while it fails in another. The total acceleration values of the structure with and without an isolator system obtained from all FEMA records are given in Figure 14, Figure 15 and Figure 16.
When Figure 14, Figure 15 and Figure 16 are examined, it can be seen that the total acceleration for FEMA records was almost zero at all damping ratios and displacement limits. The critical earthquake records, which were maximum for displacement in the structure with and without isolators, were also maximum for the total acceleration.

5. Conclusions

The results obtained by the optimization of the isolators are summarized as follows:
-
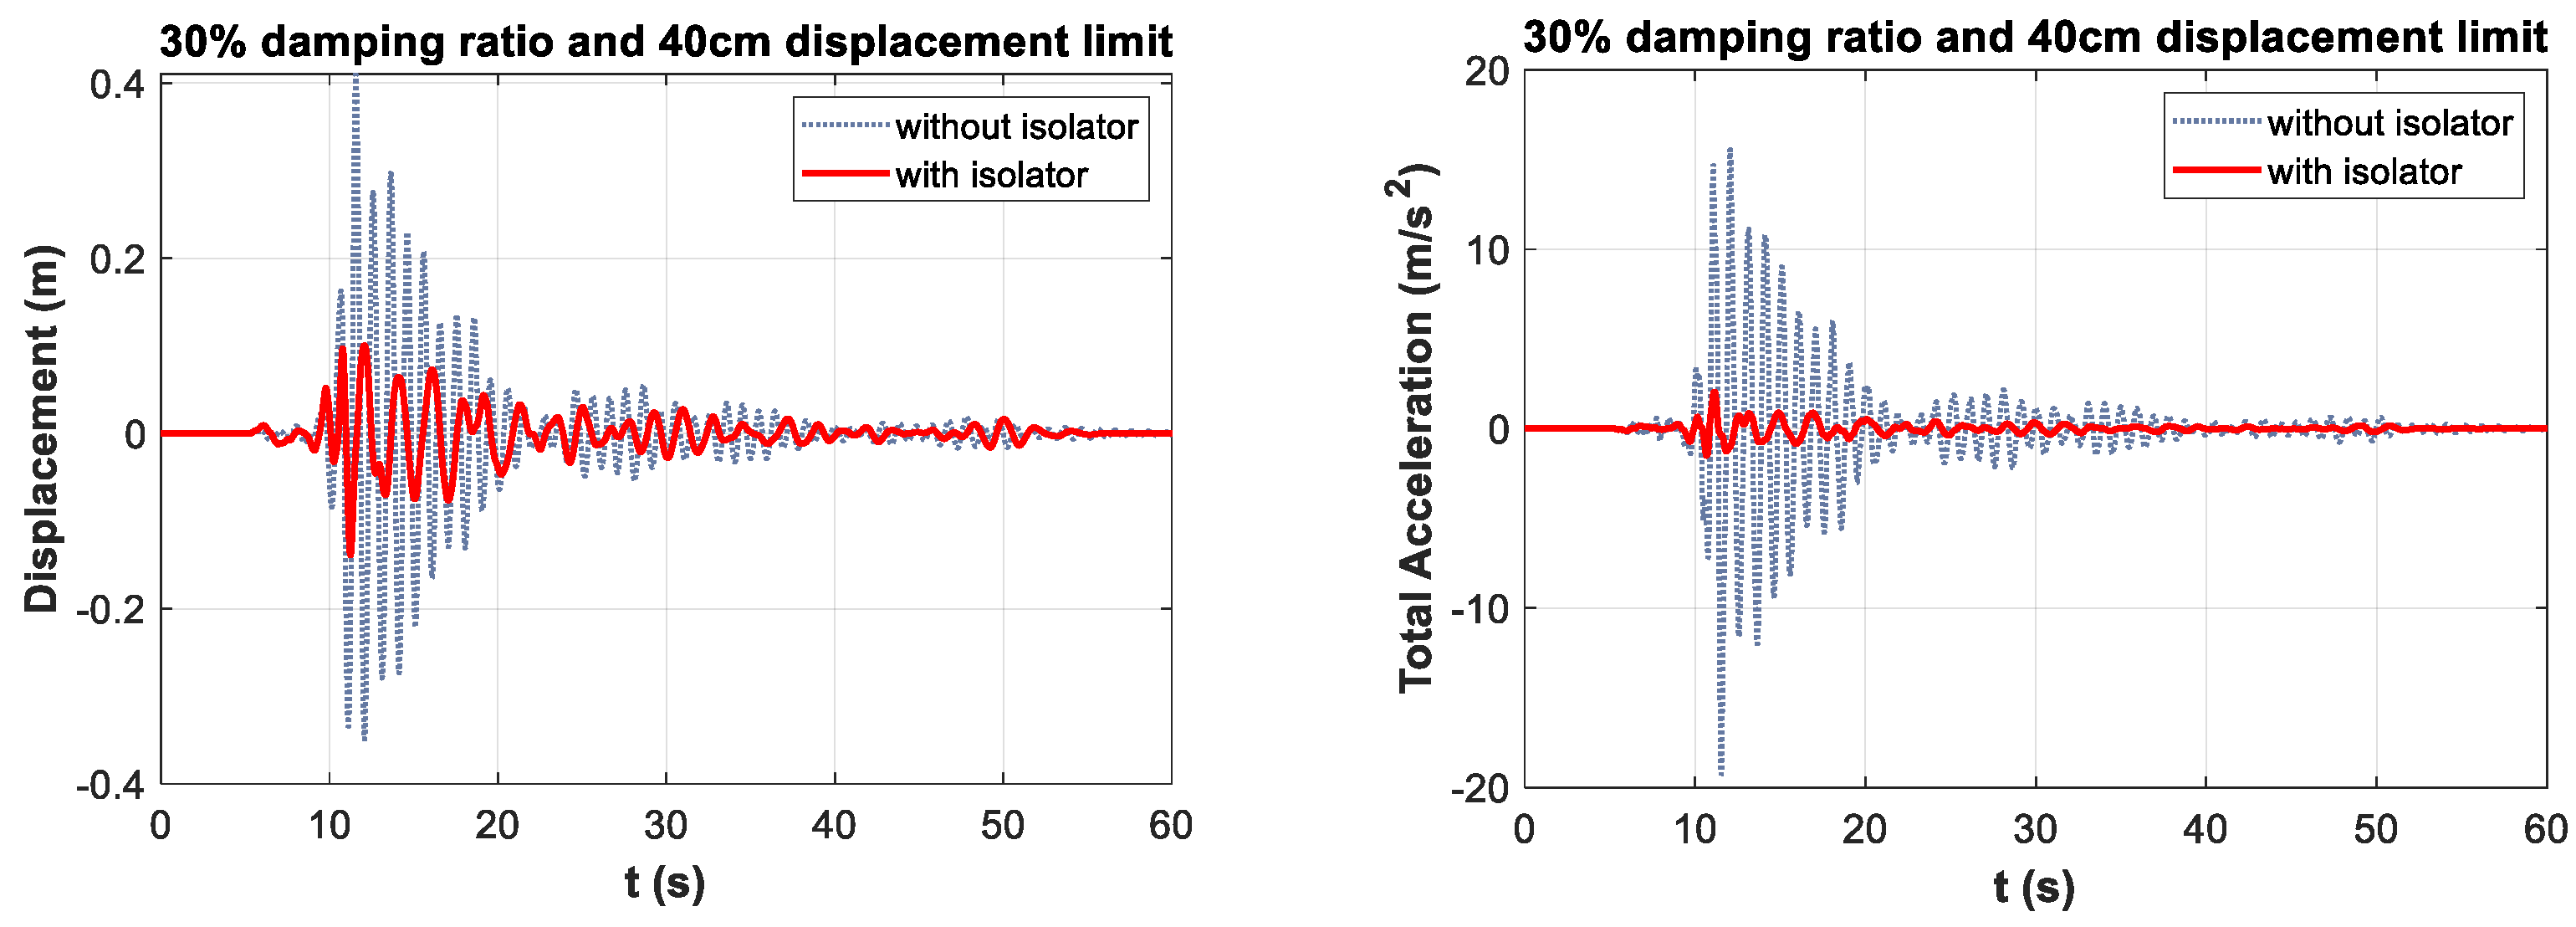
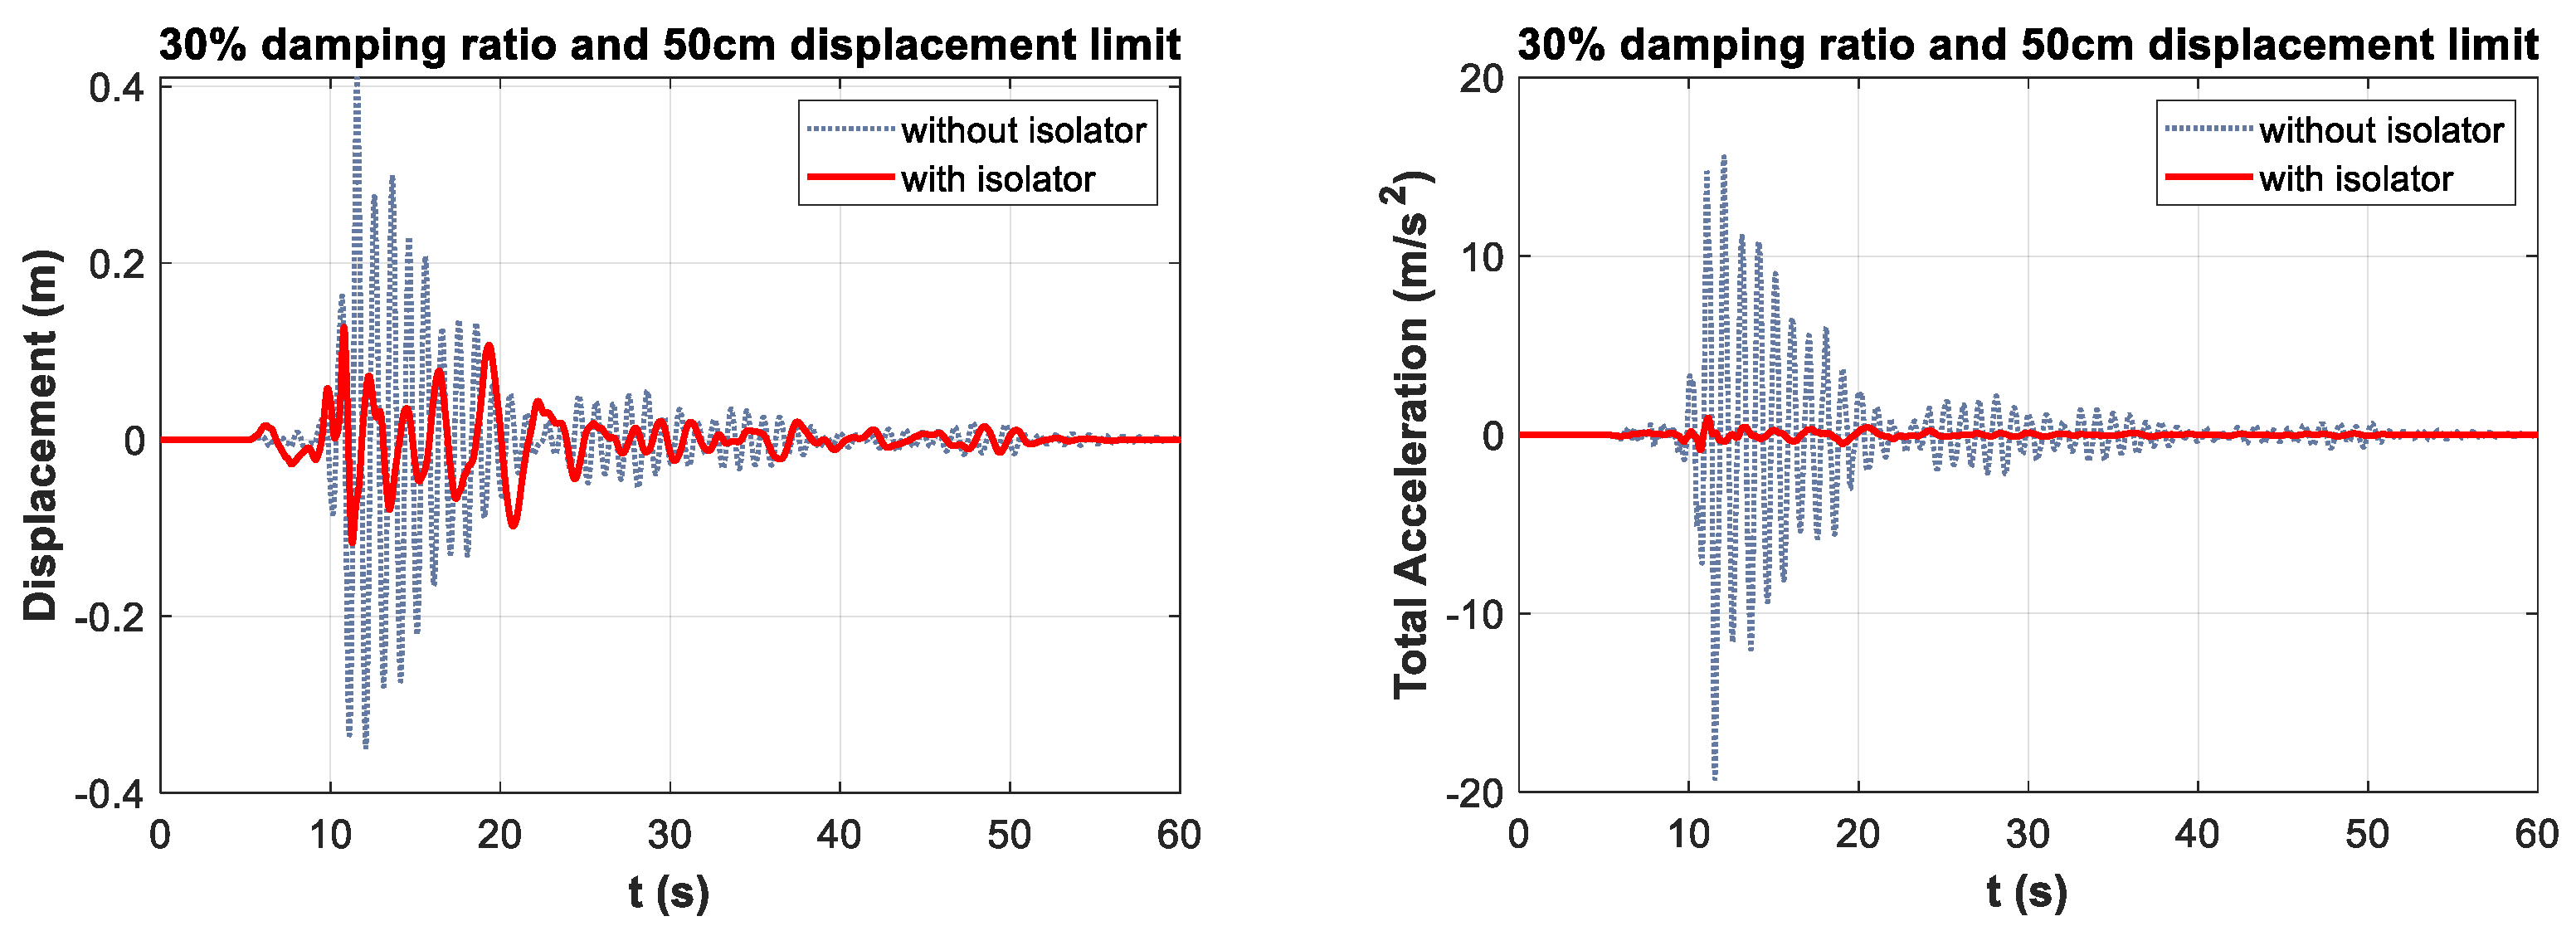
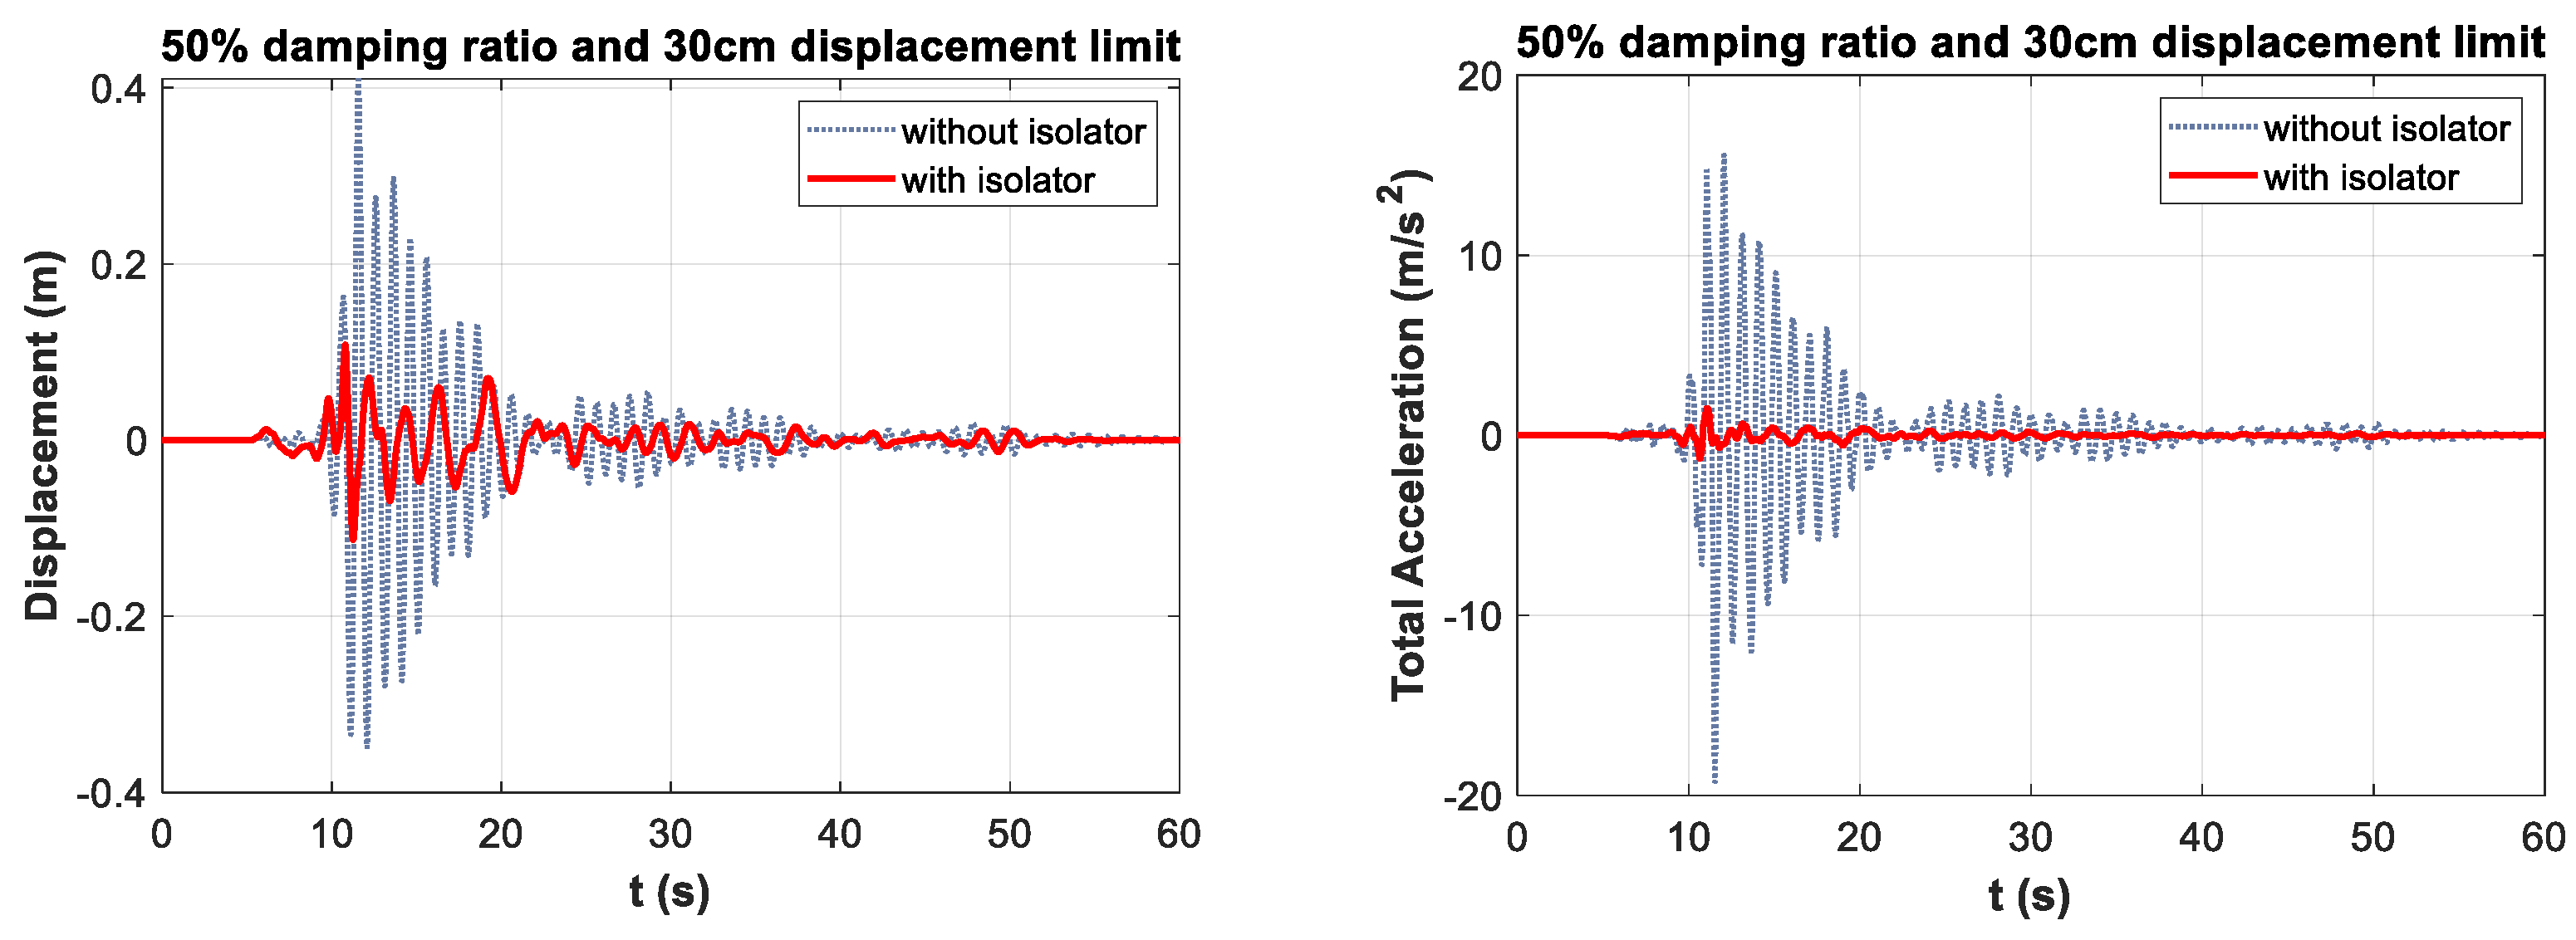
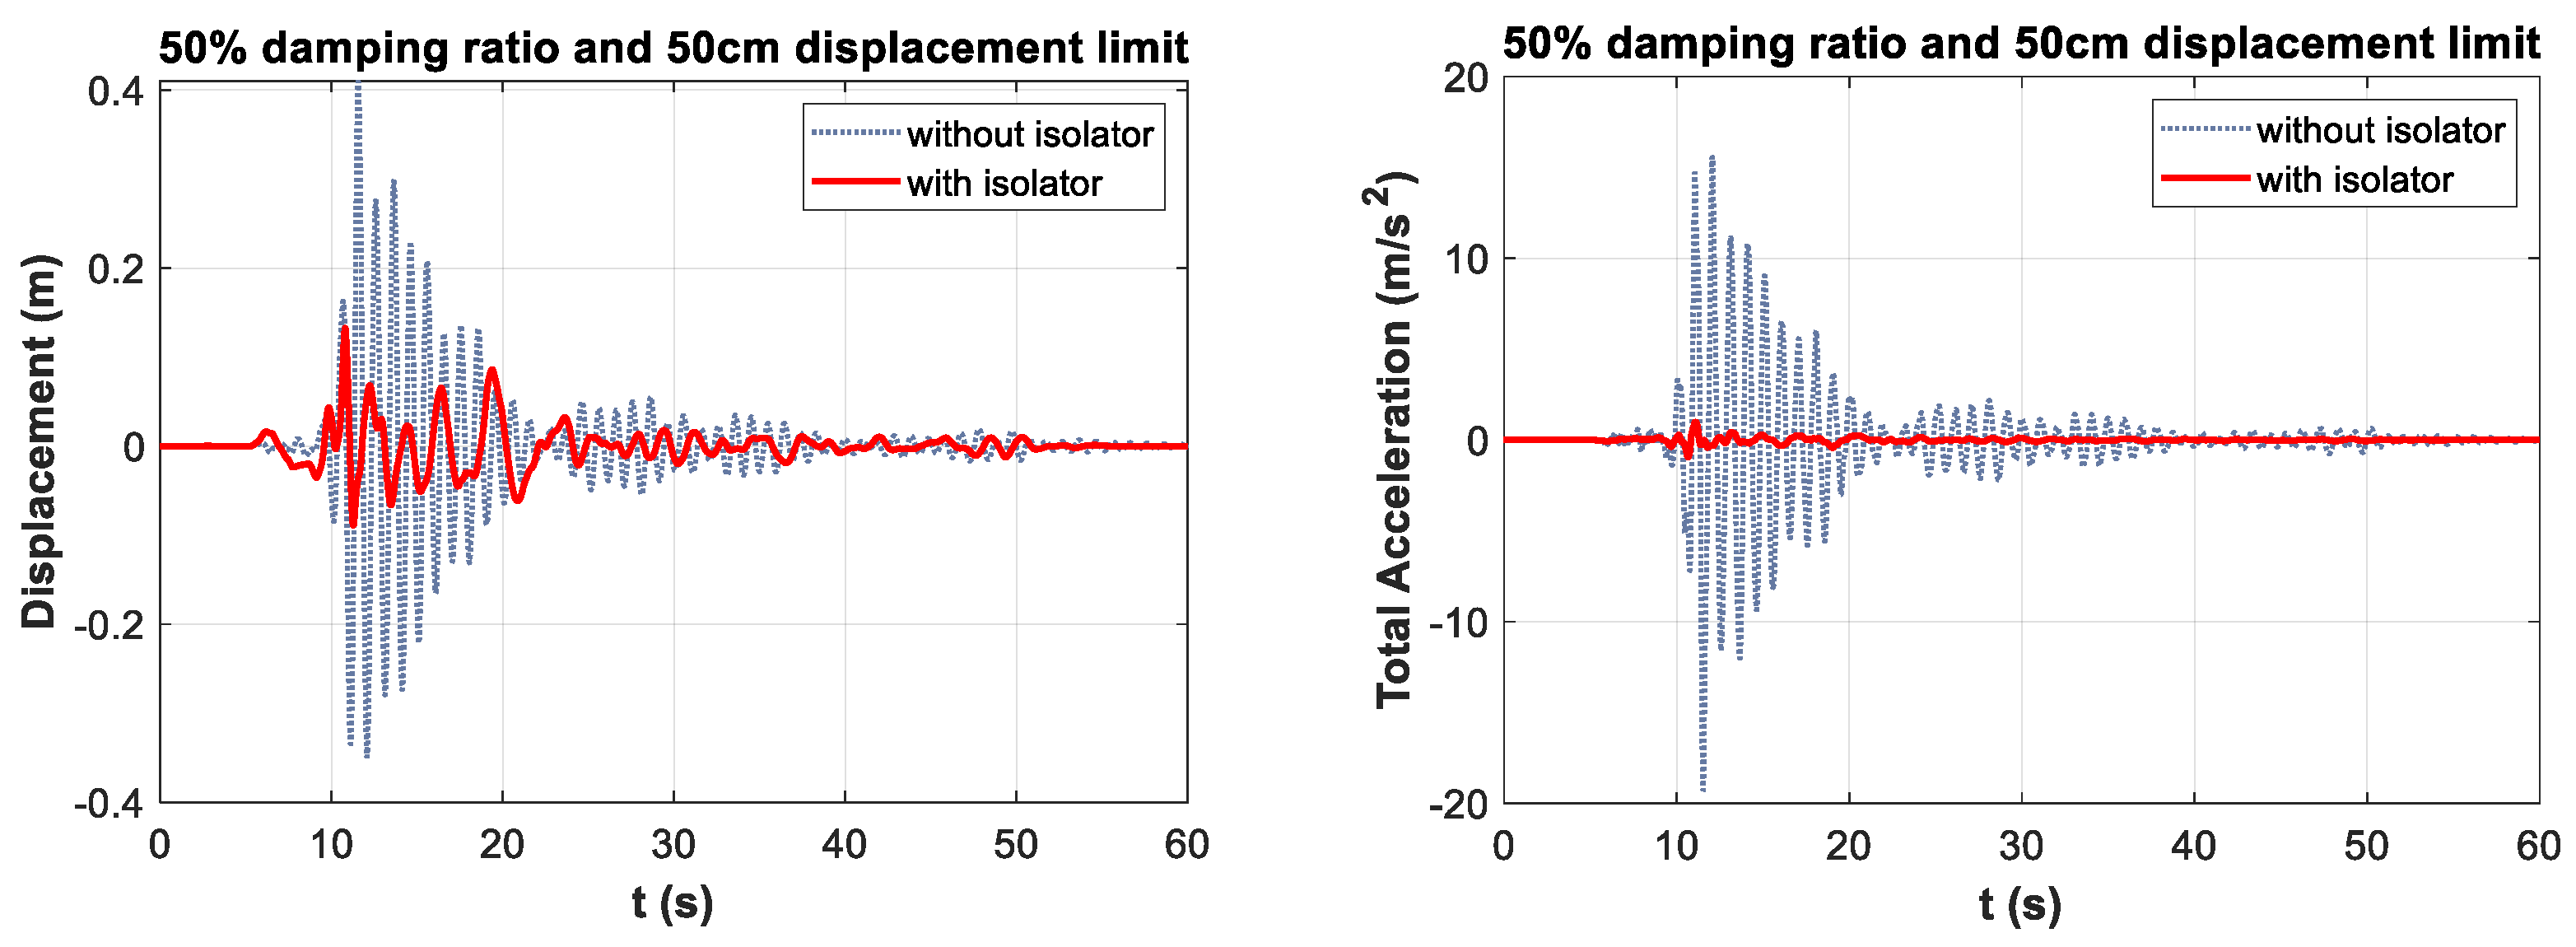
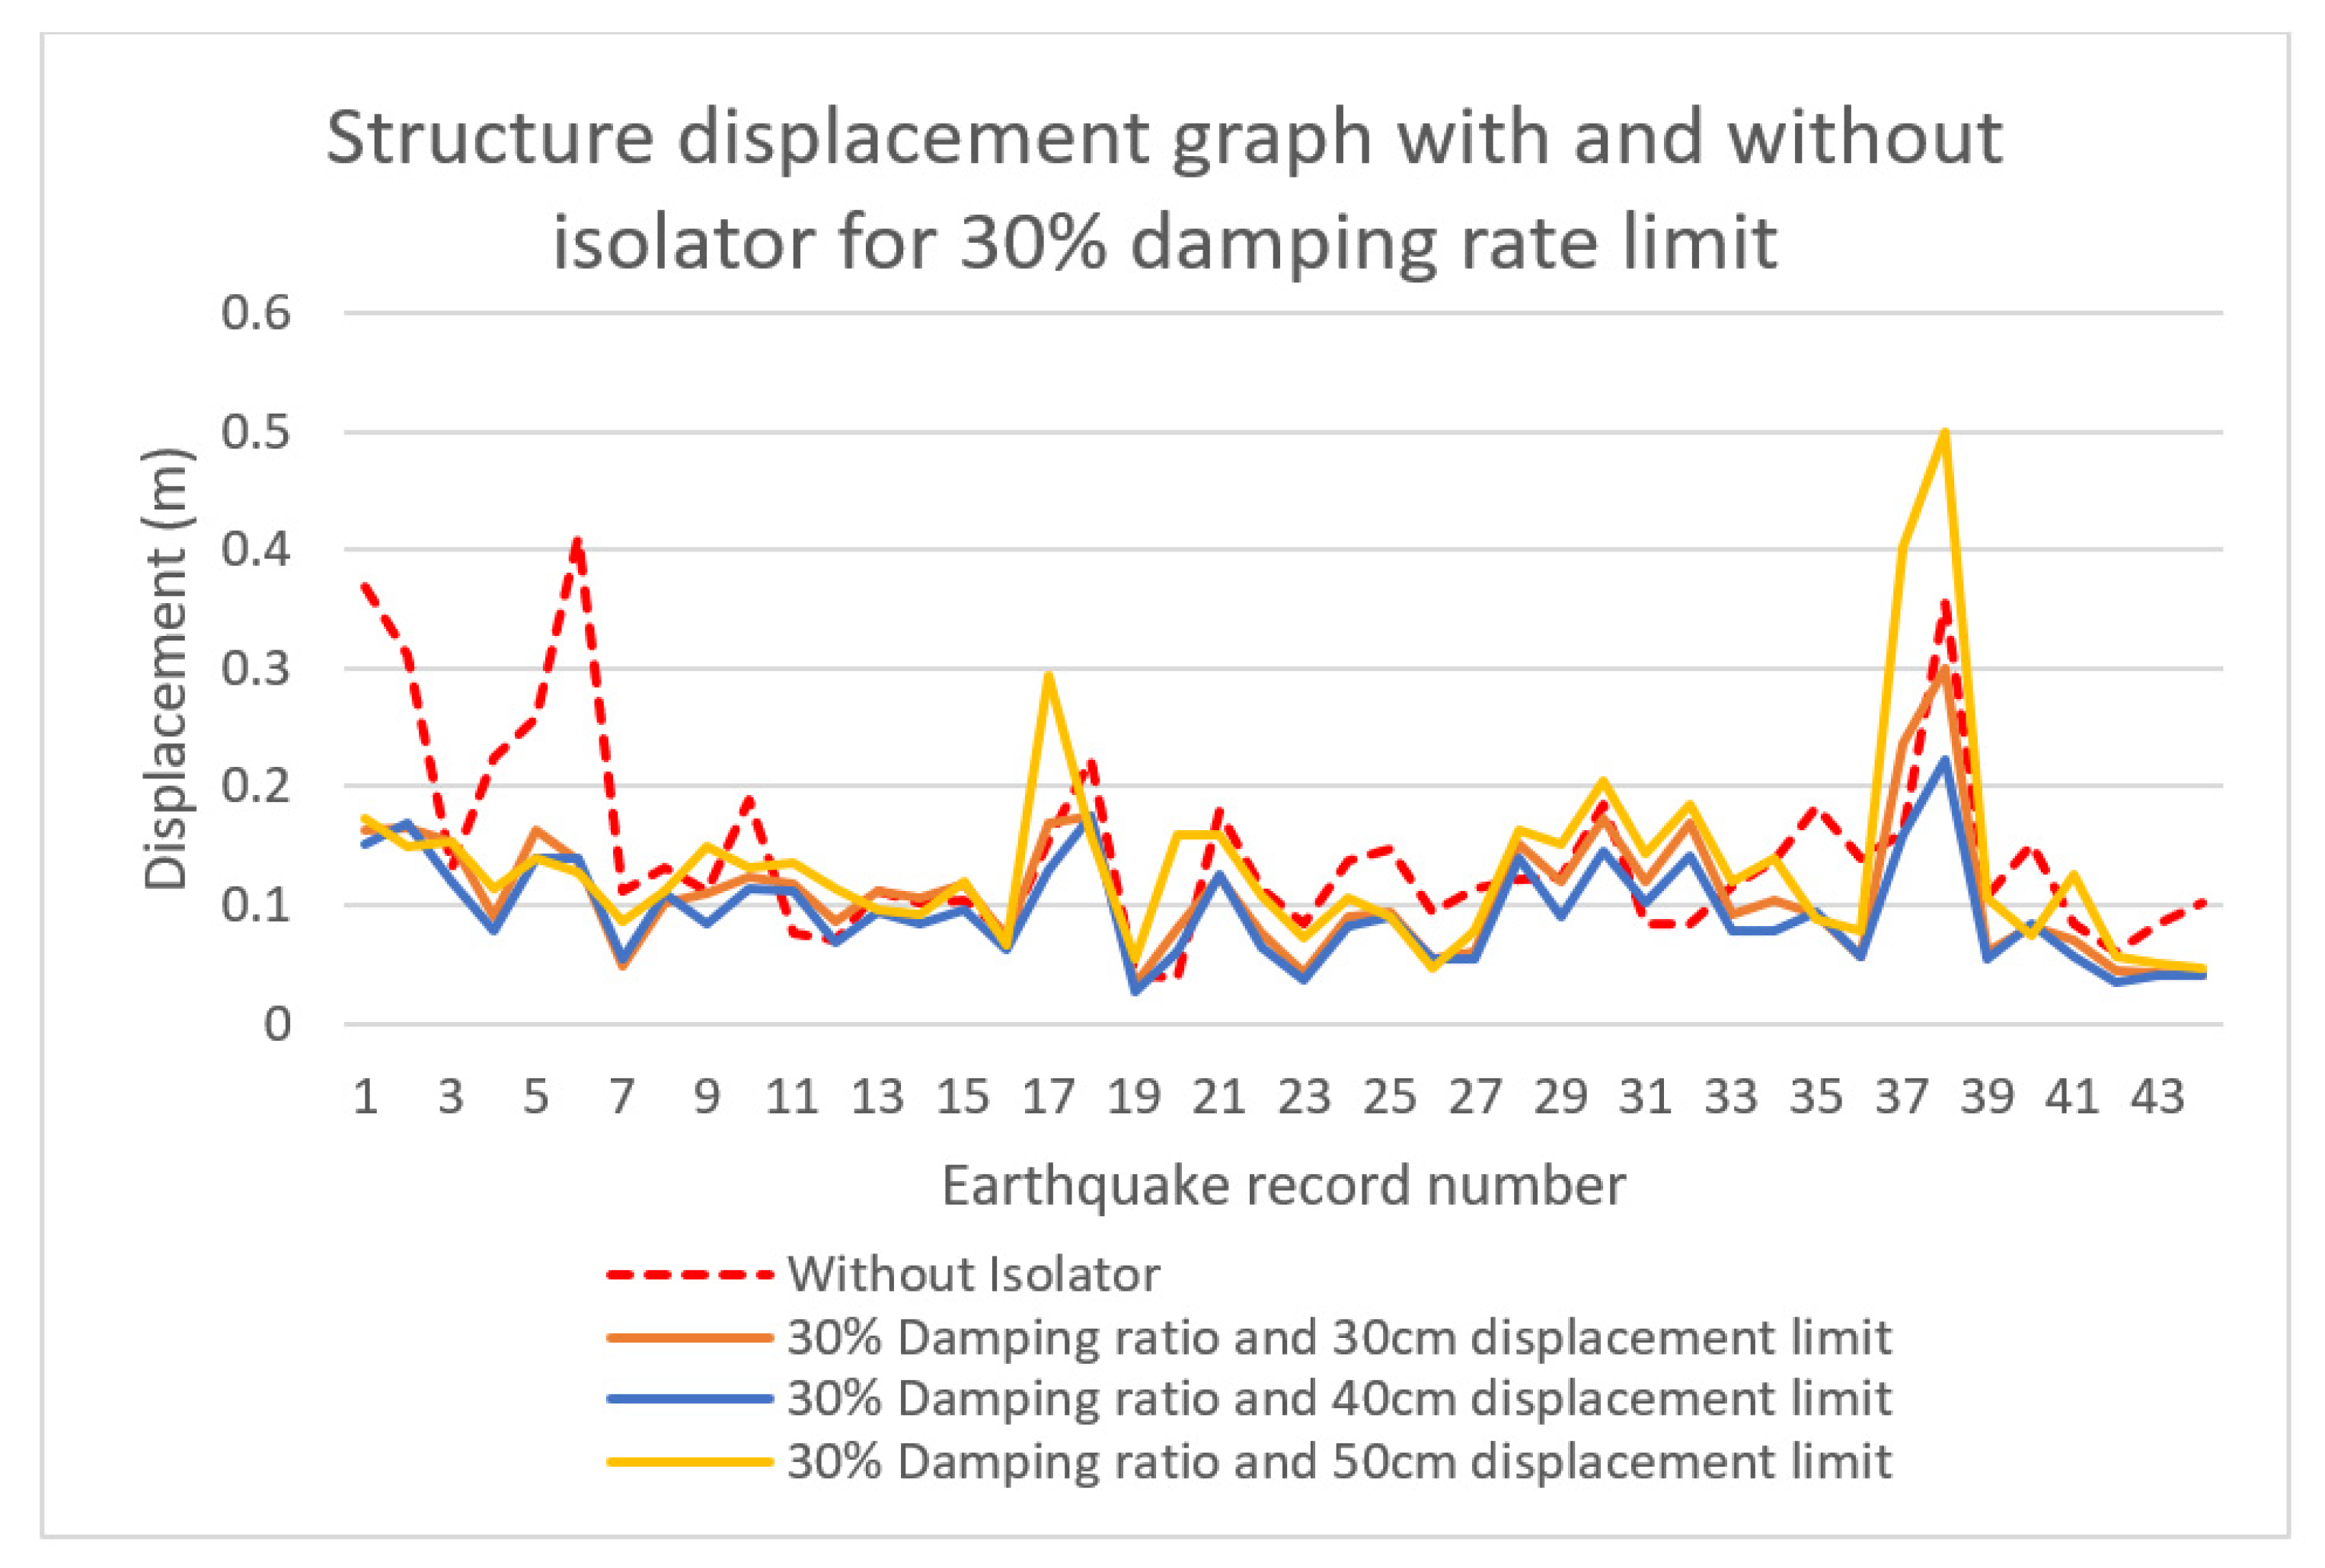
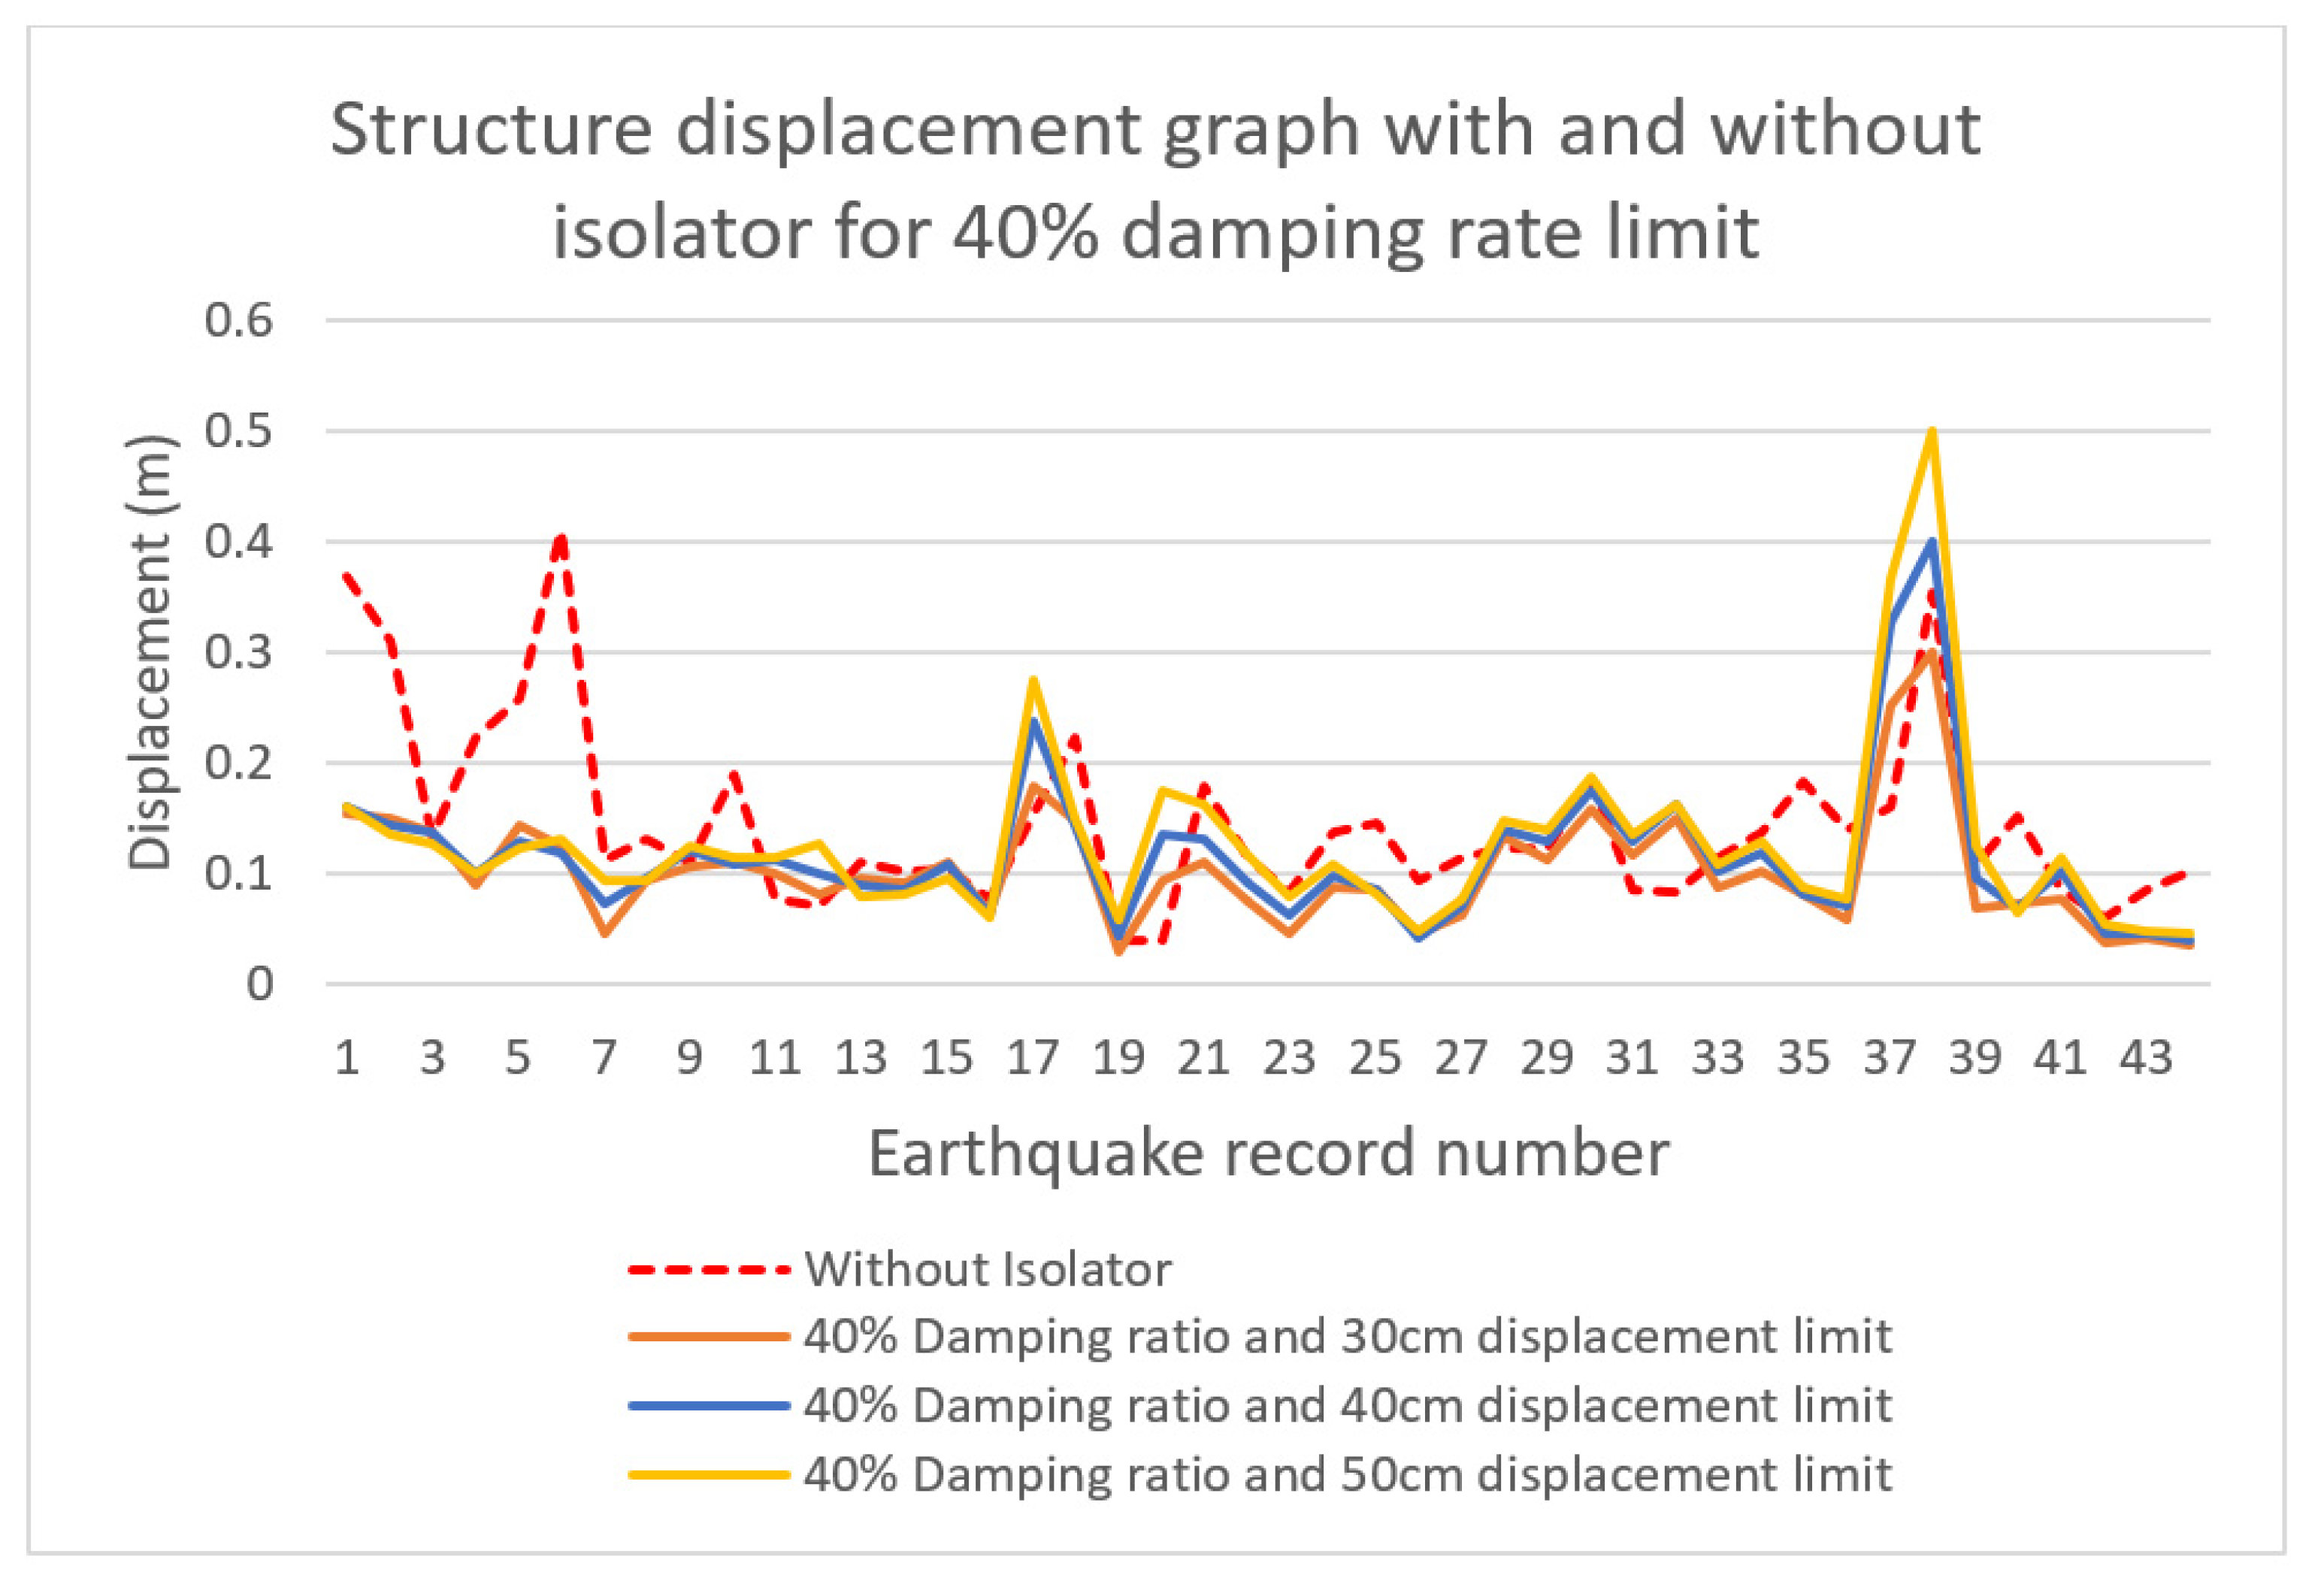
The maximum displacement reduction rate of approximately 72% was observed at the damping ratio of 50% and the displacement limit of 30 cm. Optimum displacement reductions were observed at 40 cm displacement limit for 40% damping limit and 50 cm displacement limit for 30% damping limit. It was observed that, after the optimum values, the performance decreased with the increase in displacement limit values. Based on these data, it is concluded that to obtain the optimum displacement reduction, it is necessary to reduce the mobility of isolators designed with a high damping ratio.
-
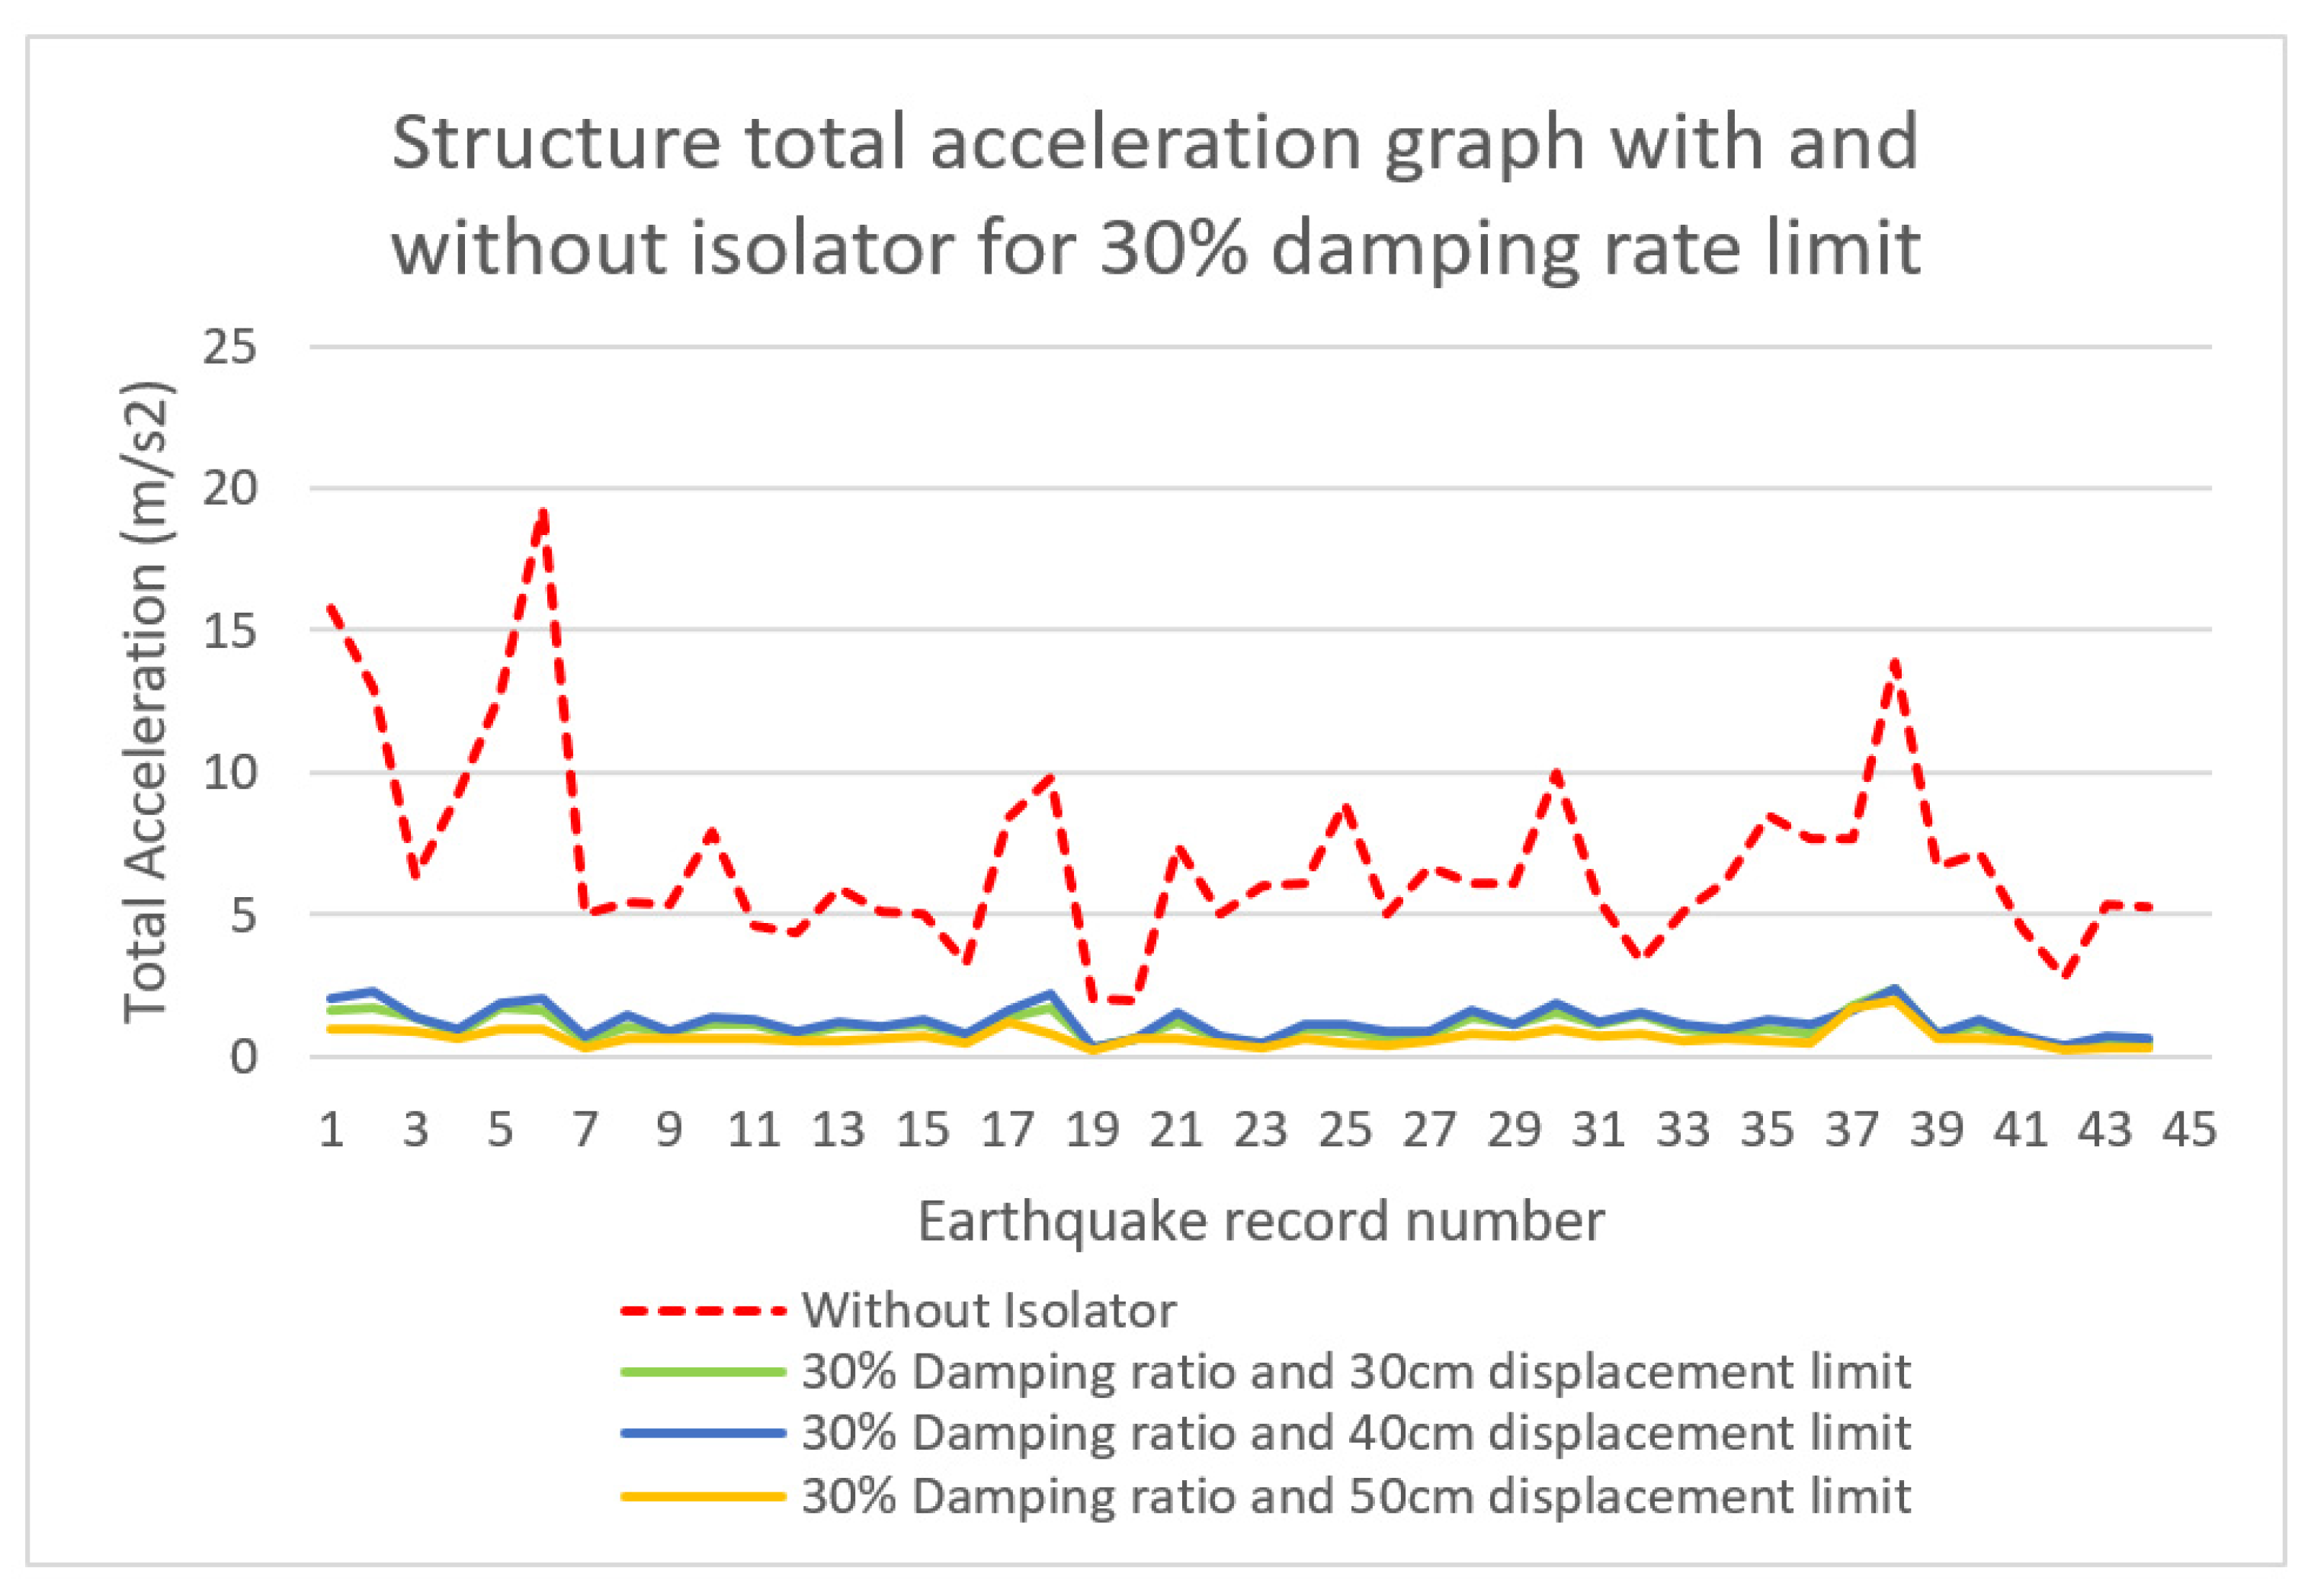
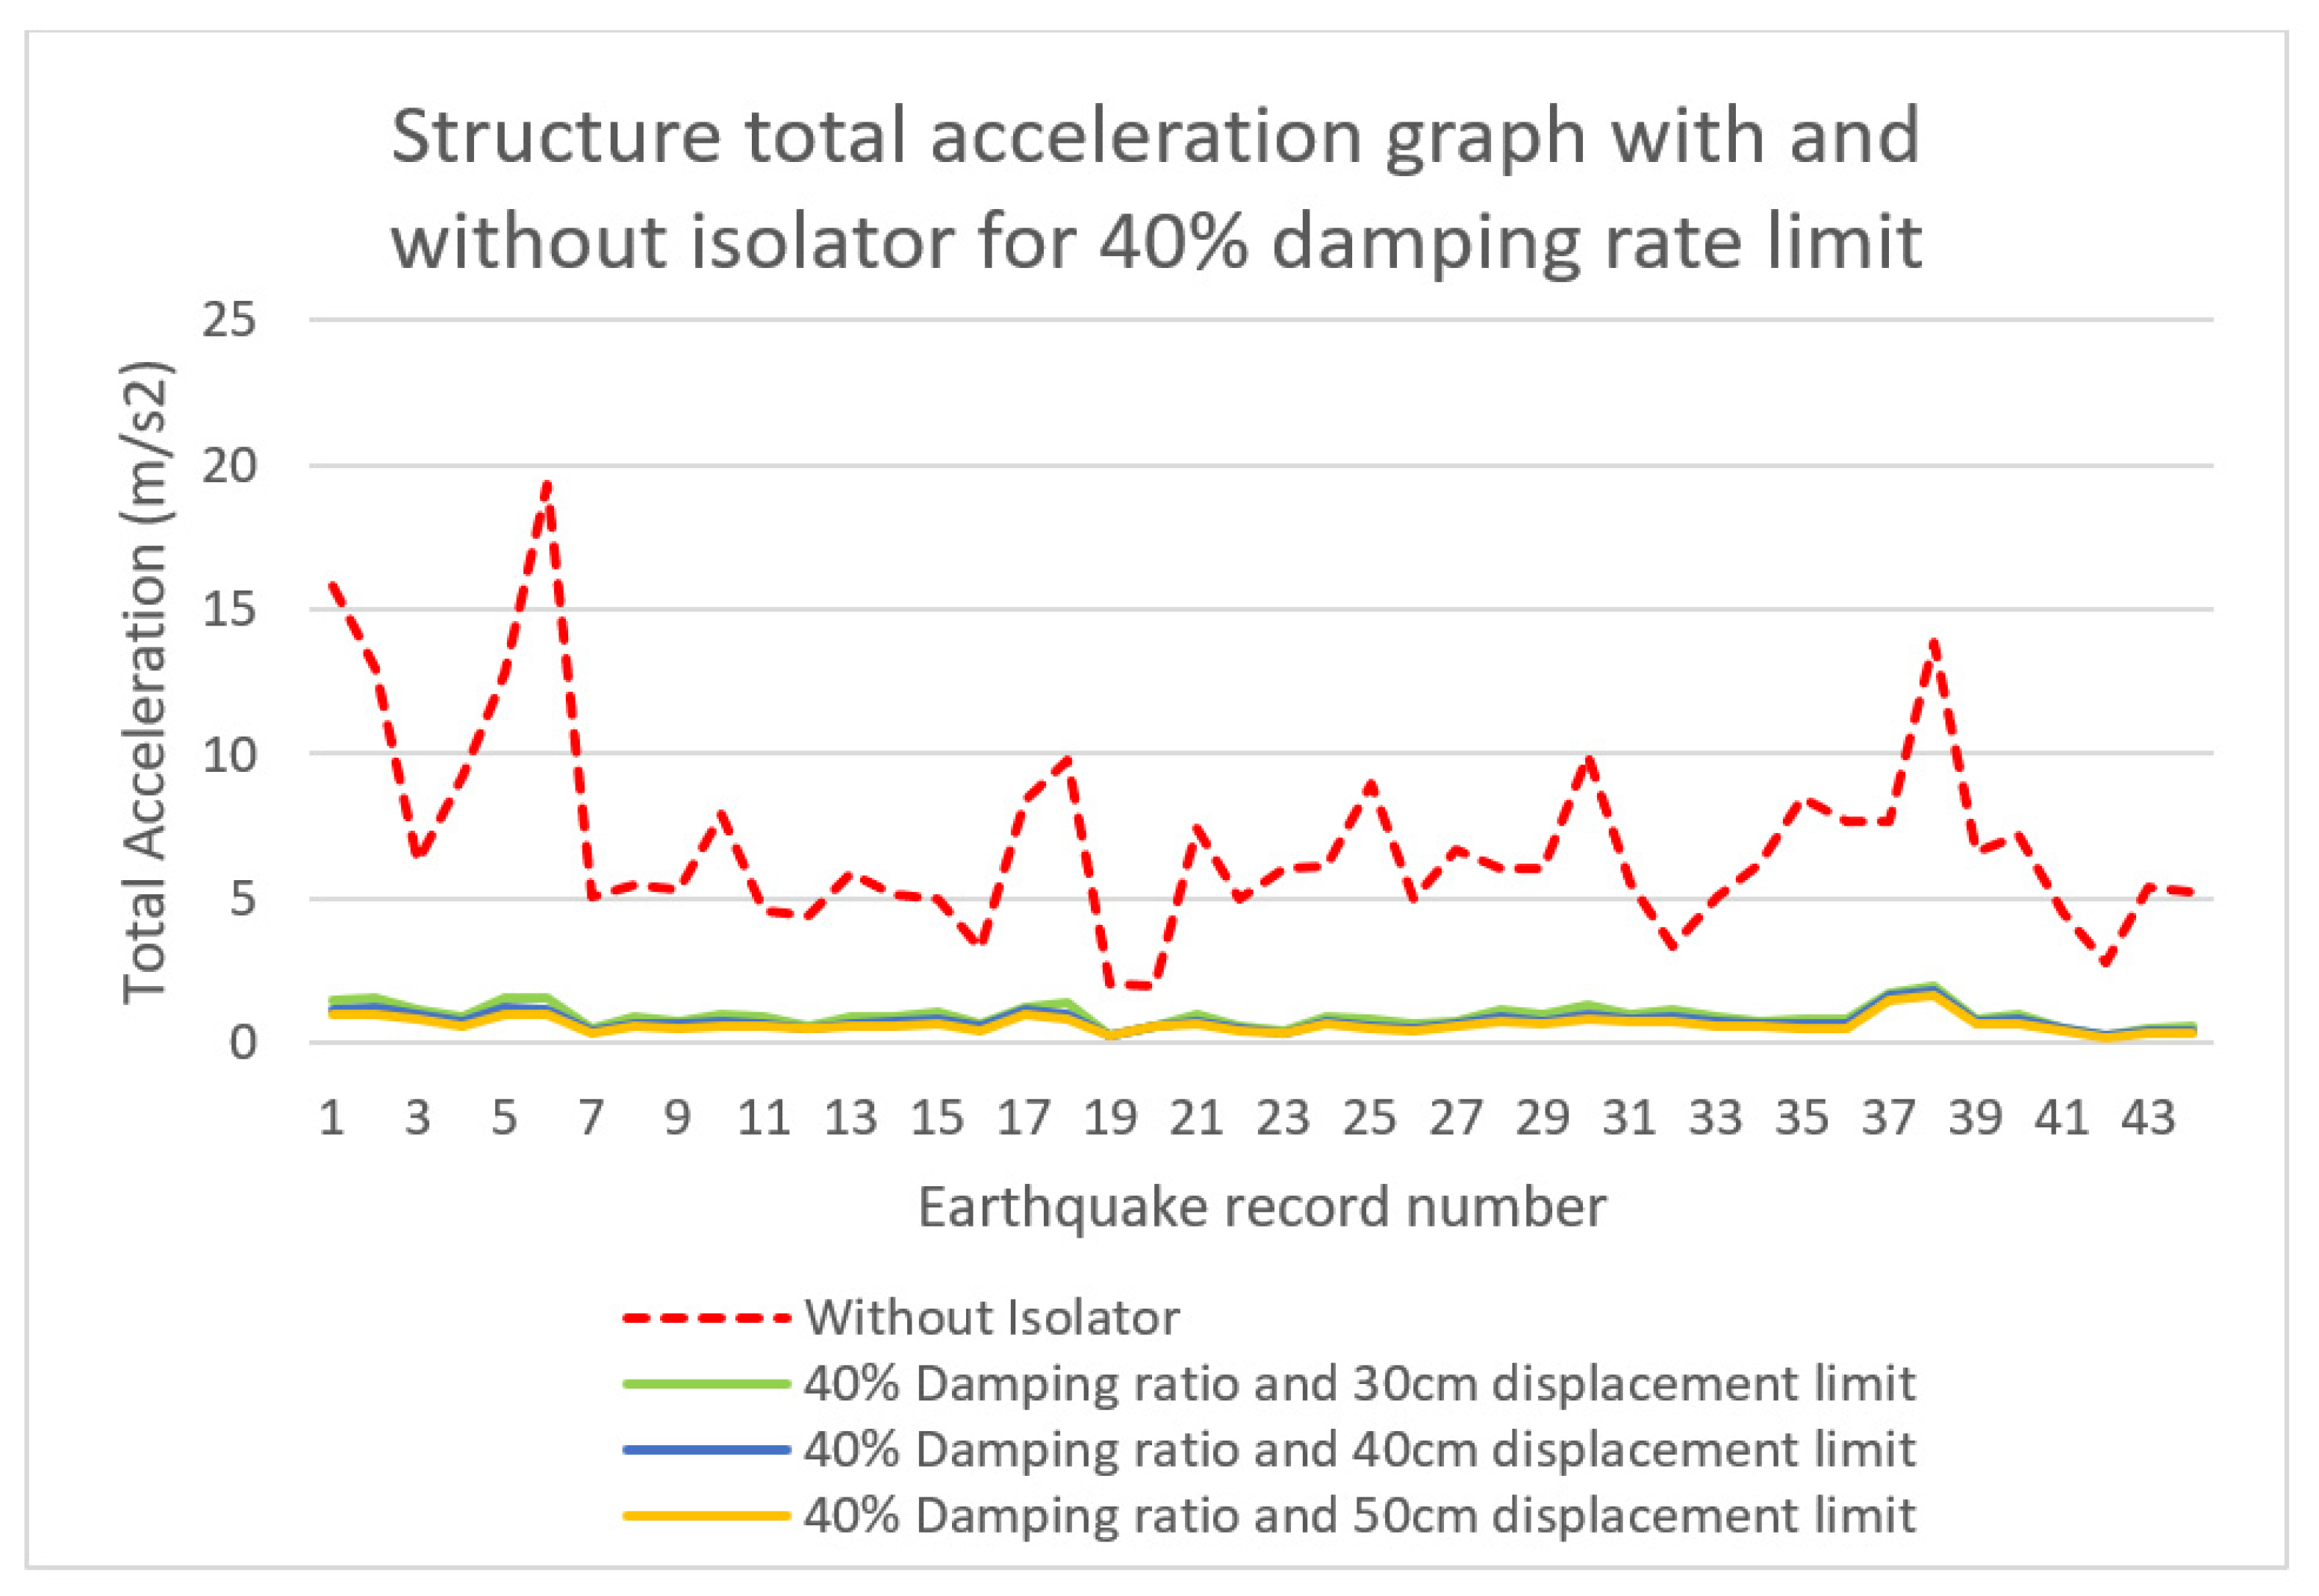
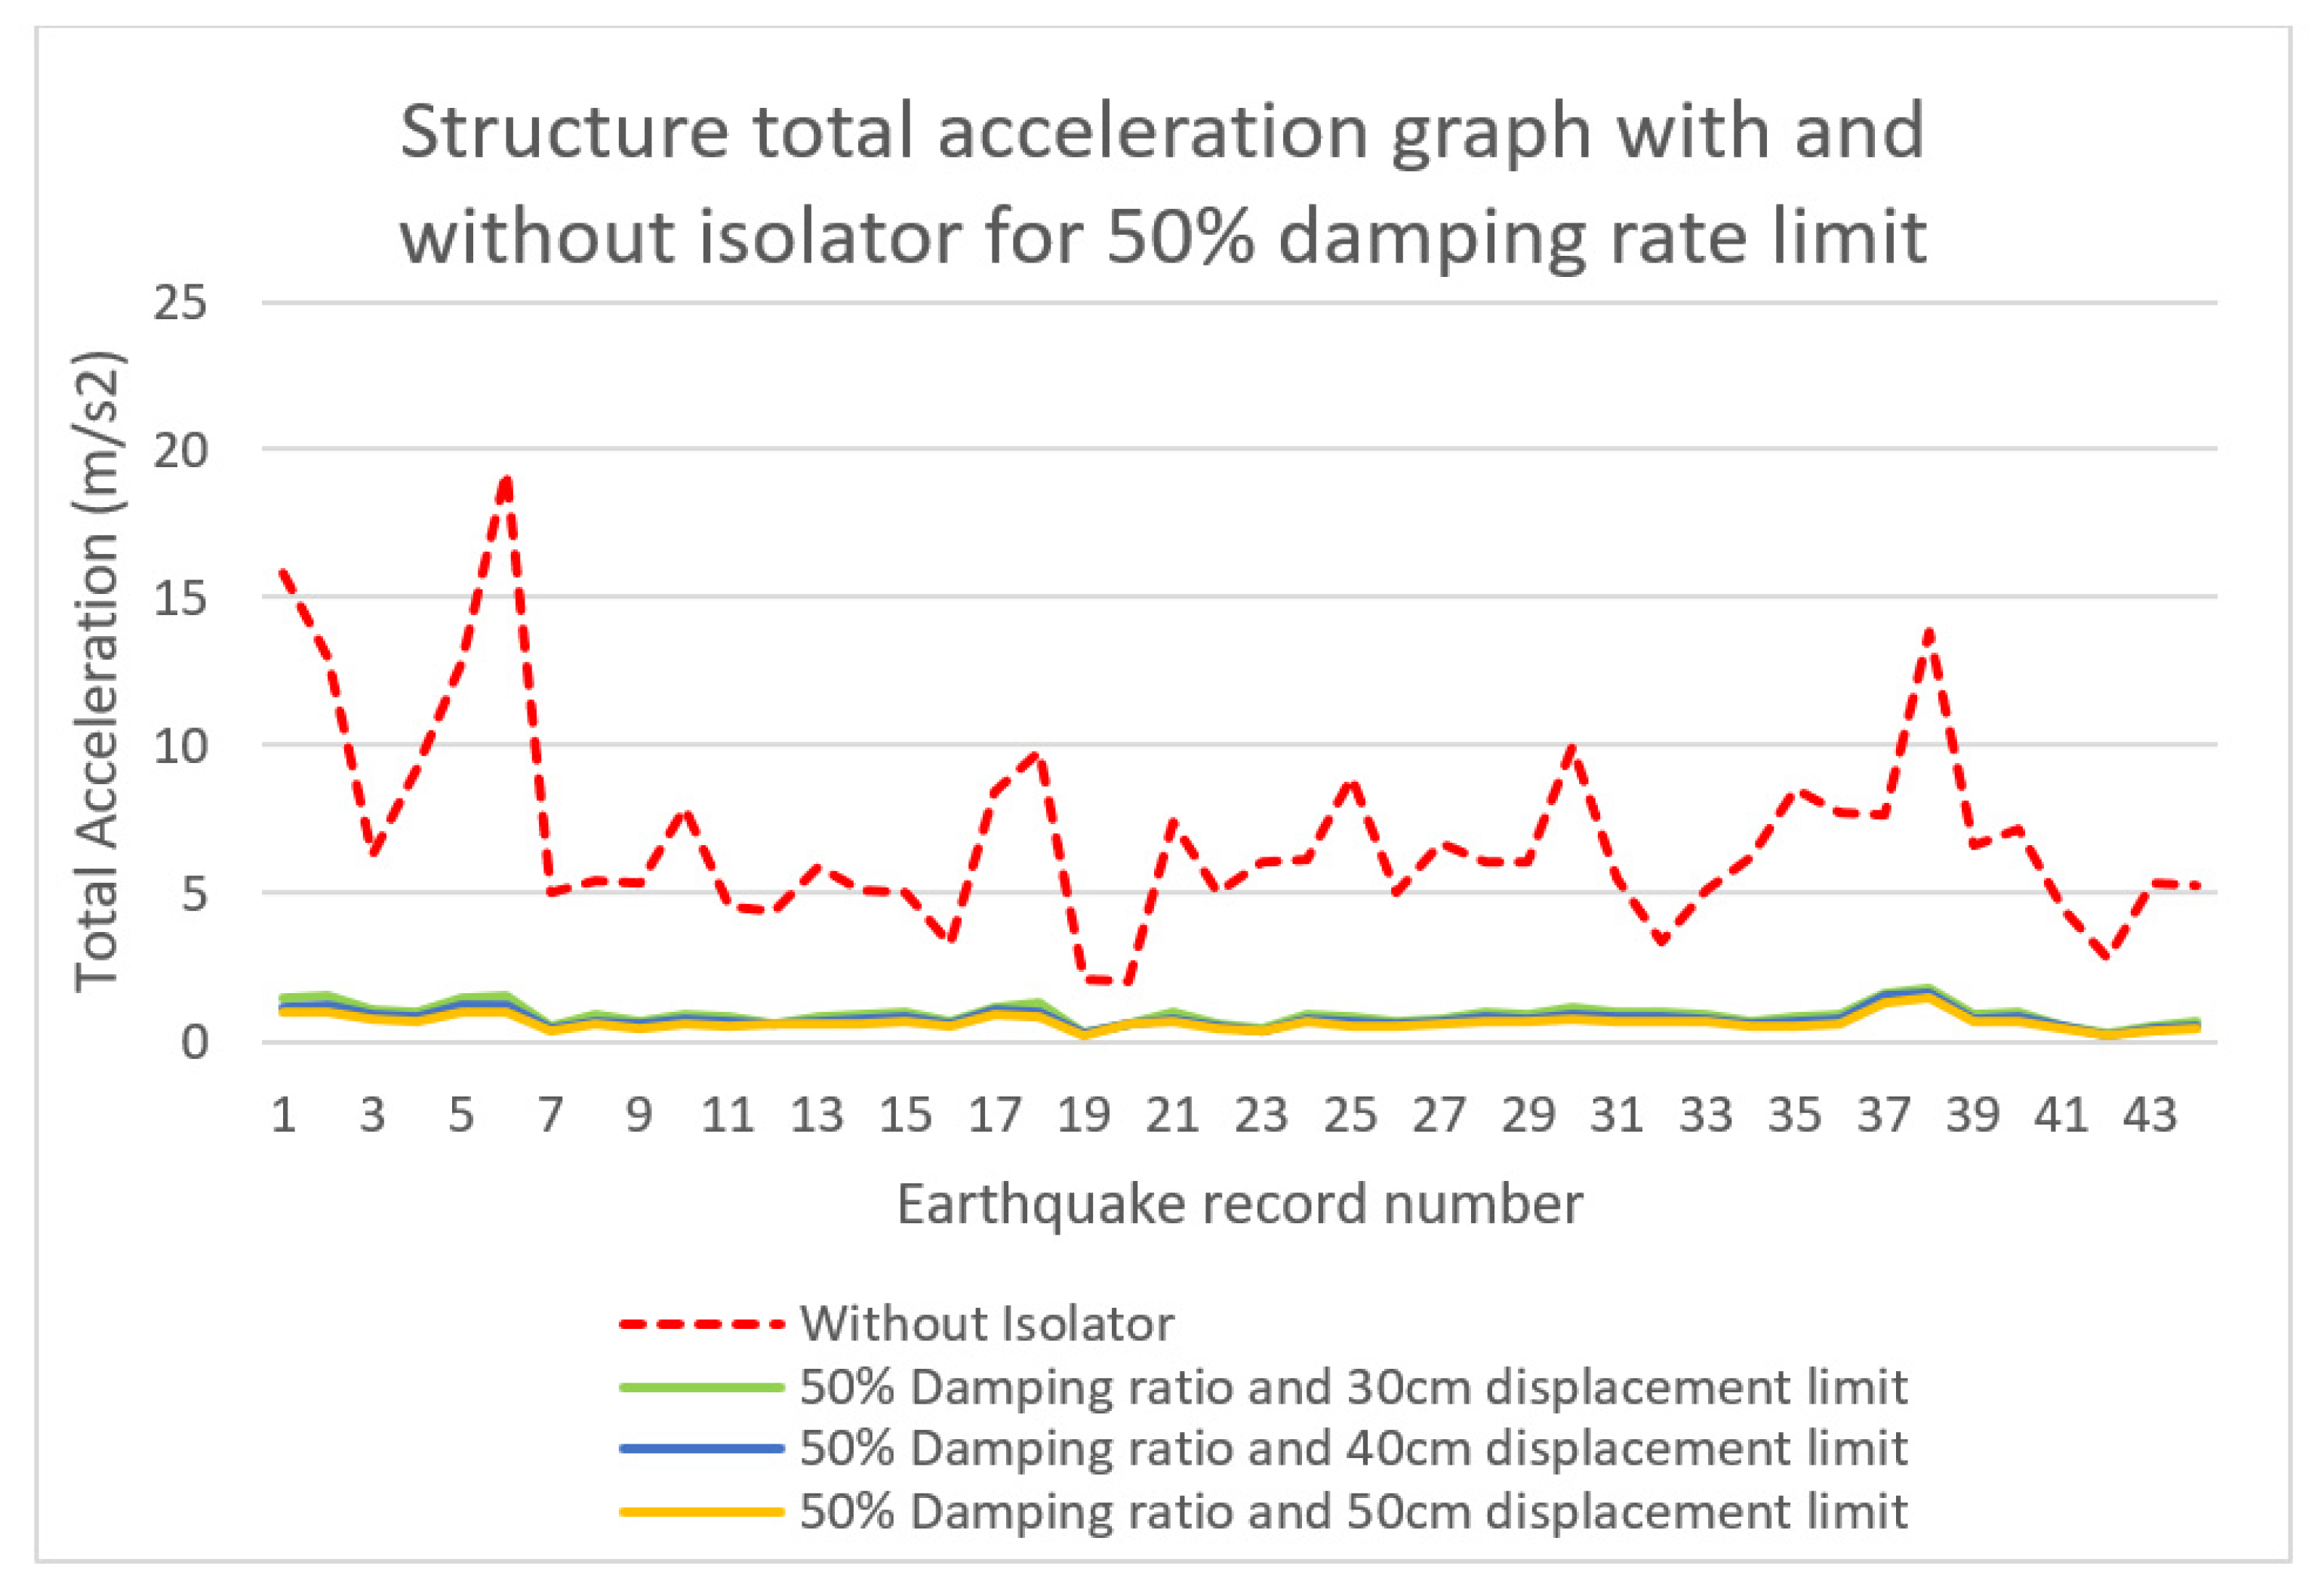
The maximum total acceleration reduction value was observed at approximately 95% for 30% damping and 50 cm displacement limit. For the 30%, 40%, and 50% damping ratio limits, optimum total acceleration drop rates were obtained at the 50 cm displacement limit. Based on this, it is derived that increasing the displacement limit, and hence the ductility of the isolator, is effective in reducing the total acceleration of the structure.
-
While the critical earthquake record of the uncontrolled structure was DUZCE/BOL090 earthquake, when the isolator was added, the critical earthquake record was the CHICHI/CHY101-N earthquake. All movement constraints defined for the structure on all damping ratios reached the limit value in the CHICHI/CHY101-N earthquake and caused the structure with isolators to be strained. Based on this, it is understood that adding an isolator system to the structure can change the earthquake behavior and acceleration values because of the high level of change in the period of the combined structure.

Author Contributions

A.O., G.B. and S.M.N. generated the analysis code. A.O. and S.M.N. developed the theory, background, and formulations of the control system. The modification of HS was performed by A.O. and G.B. The text of the paper was written by S.M.N., G.B. and A.O. The figures were drawn by S.M.N., G.B. and A.O. Lastly, S.K. and Z.W.G. edited the paper and supervised the research direction. All authors have read and agreed to the published version of the manuscript.

Funding

This research received no external funding.

Institutional Review Board Statement

Not applicable.

Informed Consent Statement

Not applicable.

Data Availability Statement

The data of the paper can be requested via e-mail to corresponding author.

Conflicts of Interest

The authors declare no conflict of interest.

References

  1. Bakkaloğlu, E. Seismic İsolator Systems in Hospital Buildings the Effects of the Use Decision on the Building Manufacturing Process. Master’s Thesis, Istanbul Technical Unıversity, Institute of Science, Istanbul, Turkey, 2018. [Google Scholar]
  2. Sheikh, H.; Van Engelen, N.C.; Ruparathna, R. A review of base isolation systems with adaptive characteristics. In Structures; Elsevier: Amsterdam, The Netherlands, 2022; Volume 38, pp. 1542–1555. [Google Scholar]
  3. Bao, Y.; Becker, T.C. Inelastic response of base-isolated structures subjected to impact. Eng. Struct. 2018, 171, 86–93. [Google Scholar] [CrossRef]
  4. Kelly, J.M. The role of damping in seismic isolation. Earthq. Eng. Struct. Dyn. 1999, 28, 3–20. [Google Scholar] [CrossRef]
  5. Habieb, A.B.; Formisano, A.; Milani, G.; Pianese, G. Seismic performance of Unbonded Fiber-Reinforced Elastomeric Isolators (UFREI) made by recycled rubber. Influence of suboptimal crosslinking. Eng. Struct. 2022, 256, 114038. [Google Scholar] [CrossRef]
  6. Wang, Y.; Yu, W.; Chen, X.; Yan, L. Fatigue life prediction of vulcanized natural rubber under proportional and non-proportional loading. Fatigue Fract. Eng. Mater. Struct. 2008, 31, 38–48. [Google Scholar] [CrossRef]
  7. Markou, A.A.; Manolis, G.D. Mechanical models for shear behavior in high damping rubber bearings. Soil Dyn. Earthq. Eng. 2016, 90, 221–226. [Google Scholar] [CrossRef]
  8. Ozkaya, C.; Akyuz, U.; Caner, A.; Dicleli, M.U.R.A.T.; Pınarbası, S. Development of a new rubber seismic isolator: ‘Ball Rubber Bearing (BRB)’. Earthq. Eng. Struct. Dyn. 2011, 40, 1337–1352. [Google Scholar] [CrossRef]
  9. Zou, X.K.; Chan, C.M. Optimal drift performance design of base-isolated buildings subject to earthquake loads. In WIT Transactions on The Built Environment; WIT Press: Southampton, UK, 2001; Volume 54. [Google Scholar]
  10. Iemura, H.; Taghikhany, T.; Jain, S.K. Optimum design of resilient sliding isolation system for seismic protection of equipment. Bull. Earthq. Eng. 2007, 5, 85–103. [Google Scholar] [CrossRef]
  11. Jangid, R.S. Equivalent linear stochastic seismic response of isolated bridges. J. Sound Vib. 2008, 309, 805–822. [Google Scholar] [CrossRef]
  12. Bucher, C. Probability-based optimal design of friction-based seismic isolation devices. Struct. Saf. 2009, 31, 500–507. [Google Scholar] [CrossRef]
  13. Dicleli, M.; Karalar, M. Optimum characteristic properties of isolators with bilinear force-displacement hysteresis for seismic protection of bridges built on various site soils. Soil Dyn. Earthq. Eng. 2011, 31, 982–995. [Google Scholar] [CrossRef]
  14. Weber, F.; Distl, H.; Braun, C. Isolation performance of optimized triple friction pendulum. Int. Refereed J. Eng. Sci. 2016, 5, 55–69. [Google Scholar]
  15. Charmpis, D.C.; Komodromos, P.; Phocas, M.C. Optimized earthquake response of multi-story buildings with seismic isolation at various elevations. Earthq. Eng. Struct. Dyn. 2012, 41, 2289–2310. [Google Scholar]
  16. Xu, Y.; Guo, T.; Yan, P. Design optimization of triple friction pendulums for base-isolated high-rise buildings. Adv. Struct. Eng. 2019, 22, 2727–2740. [Google Scholar] [CrossRef]
  17. Xu, Y.; Becker, T.C.; Guo, T. Design optimization of triple friction pendulums for high-rise buildings considering both seismic and wind loads. Soil Dyn. Earthq. Eng. 2021, 142, 106568. [Google Scholar] [CrossRef]
  18. Moeindarbari, H.; Taghikhany, T. Seismic optimum design of triple friction pendulum bearing subjected to near-fault pulse-like ground motions. Struct. Multidiscip. Optim. 2014, 50, 701–716. [Google Scholar] [CrossRef]
  19. Dang, Y.; Zhao, G.; Tian, H.; Li, G. Two-Stage Optimization Method for the Bearing Layout of Isolated Structure. Adv. Civ. Eng. 2021, 2021, 4895176. [Google Scholar] [CrossRef]
  20. Aceto, L.; Quaranta, G.; Camata, G.; Briseghella, B.; Spacone, E. Optimum design of a hybrid isolation device for server racks using constrained differential evolution algorithm. In Proceedings of the 8th International Conference on Computational Methods in Structural Dynamics and Earthquake Engineering: ECCOMAS Thematic Conference, Athens, Greece, 27–30 June 2021. [Google Scholar]
  21. Tsipianitis, A.; Tsompanakis, Y. Optimizing the seismic response of base-isolated liquid storage tanks using swarm intelligence algorithms. Comput. Struct. 2021, 243, 106407. [Google Scholar] [CrossRef]
  22. Çerçevik, A.E.; Avşar, Ö.; Hasançebi, O. Optimum design of seismic isolation systems using metaheuristic search methods. Soil Dyn. Earthq. Eng. 2020, 131, 106012. [Google Scholar] [CrossRef]
  23. Etedali, S.; Hasankhoie, K.; Sohrabi, M.R. Optimal design of pure-friction isolators with and without restoring device: A multi-objective cuckoo search-based approach for seismic-excited structures. In Structures; Elsevier: Amsterdam, The Netherlands, 2020; Volume 25, pp. 708–719. [Google Scholar]
  24. Nigdeli, S.M.; Bekdaş, G.; Alhan, C. Optimization of seismic isolation systems via harmony search. Eng. Optim. 2014, 46, 1553–1569. [Google Scholar] [CrossRef]
  25. Geem, Z.W.; Kim, J.H.; Loganathan, G. VA new heuristic optimization algorithm: Harmony search. Simulation 2001, 76, 60–68. [Google Scholar] [CrossRef]
  26. Keshtegar, B.; Etedali, S. Nonlinear mathematical modeling and optimum design of tuned mass dampers using adaptive dynamic harmony search algorithm. Struct. Control Health Monit. 2018, 25, e2163. [Google Scholar] [CrossRef]
  27. Alkhadashi, A.; Mohammad, F.; Zubayr, R.O.; Klalib, H.A.; Balik, P. Multi-objective design optimization of steel-framed structures using three different methods. Int. J. Struct. Integr. 2021, 13, 92–111. [Google Scholar] [CrossRef]
  28. Toklu, Y.C.; Bekdaş, G.; Yücel, M.; Nigdeli, S.M.; Kayabekir, A.E.; Kim, S.; Geem, Z.W. Total Potential Optimization Using Metaheuristic Algorithms for Solving Nonlinear Plane Strain Systems. Appl. Sci. 2021, 11, 3220. [Google Scholar] [CrossRef]
  29. FEMA P-695. Quantification of Building Seismic Performance Factors; US Department of Homeland Security, FEMA: Washington, DC, USA, 2009. [Google Scholar]
  30. The MathWorks, Matlab R2018a. Natick, MA. 2018. Available online: https://ww2.mathworks.cn/company/newsroom/mathworks-announces-release-2018a-of-the-matlab-and-simulink-product-families.html (accessed on 3 May 2022).
  31. Singh, M.P.; Singh, S.; Moreschi, L.M. Tuned mass dampers for response control of torsional buildings. Earthq. Eng. Struct. Dyn. 2002, 31, 749–769. [Google Scholar] [CrossRef]
Figure 1. (a) SDOF structure model with base isolator; (b) 3D view of the model.
Sustainability 14 07456 g001
Figure 2. Displacement and total acceleration graphs under critical earthquake analysis for a 30% damping rate and 30 cm displacement limit.
Sustainability 14 07456 g002
Figure 3. Displacement and total acceleration graphs under critical earthquake analysis for a 30% damping rate and 40 cm displacement limit.
Sustainability 14 07456 g003
Figure 4. Displacement and total acceleration graphs under critical earthquake analysis for a 30% damping rate and 50 cm displacement limit.
Sustainability 14 07456 g004
Figure 5. Displacement and total acceleration graphs under critical earthquake analysis for a 40% damping rate and 30 cm displacement limit.
Sustainability 14 07456 g005
Figure 6. Displacement and total acceleration graphs under critical earthquake analysis for a 40% damping rate and 40 cm displacement limit.
Sustainability 14 07456 g006
Figure 7. Displacement and total acceleration graphs under critical earthquake analysis for a 40% damping rate and 50 cm displacement limit.
Sustainability 14 07456 g007
Figure 8. Displacement and total acceleration graphs under critical earthquake analysis for a 50% damping rate and 30 cm displacement limit.
Sustainability 14 07456 g008
Figure 9. Displacement and total acceleration graphs under critical earthquake analysis for a 50% damping rate and 40 cm displacement limit.
Sustainability 14 07456 g009
Figure 10. Displacement and total acceleration graphs under critical earthquake analysis for a 50% damping rate and 50 cm displacement limit.
Sustainability 14 07456 g010
Figure 11. Structure displacement–earthquake record number graph with and without isolator, obtained from all earthquake records for the 30% damping rate limit.
Sustainability 14 07456 g011
Figure 12. Structure displacement–earthquake record number graph with and without isolator, obtained from all earthquake records for the 40% damping rate limit.
Sustainability 14 07456 g012
Figure 13. Structure displacement–earthquake record number graph with and without isolator, obtained from all earthquake records for the 50% damping rate limit.
Sustainability 14 07456 g013
Figure 14. Structure total acceleration–earthquake record number graph with and without isolator, obtained from all earthquake records for the 30% damping rate limit.
Sustainability 14 07456 g014
Figure 15. Structure total acceleration–earthquake record number graph with and without isolator, obtained from all earthquake records for the 40% damping rate limit.
Sustainability 14 07456 g015
Figure 16. Structure total acceleration–earthquake record number graph with and without isolator, obtained from all earthquake records for the 50% damping rate limit.
Sustainability 14 07456 g016
Table 1. FEMA earthquake records list.
DateEarthquake NameEarthquake
Record
Number
Earthquake
Record
Earthquake
Record
Number
Earthquake
Record
1994 Northridge1NORTHR/MUL0092NORTHR/MUL279
1994 Northridge3NORTHR/LOS0004NORTHR/LA270
1999 Duzce, Turkey5DUZCE/BOL00006DUZCE/BOL090
1999 Hector Mine7HECTOR/HEC0008HECTOR/HEC090
1979 Imperial Valley9IMPVALL/H-DLT26210IMPVALL/H-DLT352
1979 Imperial Valley11IMPVALL/H-E1114012IMPVALL/H-E11230
1995 Kobe, Japan13KOBE/NIS00014KOBE/NIS090
1995 Kobe, Japan15KOBE/SHI00016KOBE/SHI090
1999 Kocaeli, Turkey17KOCAELI/DZC18018KOCAELI/DZC270
1999 Kocaeli, Turkey19KOCAELI/ARC00020KOCAELI/ARC090
1992 Landers21LANDERS/PLACE27022LANDERS/YER360
1992 Landers23LANDERS/CLW-LN24LANDERS/CLW-TR
1989 Loma Prieta25LOMAP/CAP00026LOMAP/CAP090
1989 Loma Prieta27LOMAP/G0300028LOMAP/G03090
1990 Manjil, Iran29MANJIL/ABBAR-L30MANJIL/ABBAR-T
1987 Superstition Hills31SUPERST/B-ICC00032SUPERST/B-ICC090
1987 Superstition Hills33SUPERST/B-POE27034SUPERST/B-POE360
1992 Cape Mendocino35CAPEMEND/RIO27036CAPEMEND/RIO360
1999 Chi-Chi, Taiwan37CHICHI/CHY101-E38CHICHI/CHY101-N
1999 Chi-Chi, Taiwan39CHICHI/TCU045-E40CHICHI/TCU045-N
1971 San Fernando41SFERN/PEL09042SFERN/PEL180
1976 Friuli, Italy43FRIULI/A-TMZ00044FRIULI/A-TMZ270
Table 2. The optimization parameters.
SymbolDefinitionValue
H M C R Harmony memory considering rate0.5–1
H M C R i n Initial harmony memory considering rate0.5
F W Fret width0–0.05
F W i n Initial fret width0.05
m t Maximum iteration number100
t Iteration number1–100
p n Population number10
T b Isolator period1–5 s
ζ b Isolator damping ratio1–50%
Table 3. Optimum results.
VariablesDamping Ratio
For 30%For 40%For 50%
Displacement LimitDisplacement LimitDisplacement Limit
30 cm40 cm50 cm30 cm40 cm50 cm30 cm40 cm50 cm
T b (s) 2.37142.01573.39512.68663.30263.80233.04143.67234.2966
ζ b 0.30000.30000.30000.40000.40000.40000.50000.50000.5000
Table 4. The displacement and total acceleration values obtained for the critical earthquake recording.
Damping RatioDisplacement Limit
(m)
Displacement
(m)
Total Acceleration
(m/s2)
With Isolator30%0.30.1371.613
0.40.1392.047
0.50.1270.934
40%0.30.1251.548
0.40.1191.177
0.50.1320.968
50%0.30.1131.511
0.40.1211.201
0.50.1330.986
Without Isolator0.41019.283
Table 5. Structure displacement and total acceleration reduction percentages with isolator for a 10-story structure.
Damping RatioDisplacement Limit
(m)
Displacement
(%)
Total Acceleration
(%)
30%0.366.5491.64
0.466.1989.39
0.568.9595.16
40%0.369.6391.97
0.470.9793.90
0.567.9194.98
50%0.372.4792.16
0.470.4093.77
0.567.6994.89
Publisher’s Note: MDPI stays neutral with regard to jurisdictional claims in published maps and institutional affiliations.

