Abstract
Investing labor time in herbage measurements is important for precision pasture management. In this study, the labor input of three smart herbage measurement tools—multispectral imagery linked to an unmanned aerial vehicle (UAV), a semi-automated rising plate meter (RPM), and near-infrared reflectance spectroscopy (NIRS) of cut herbage samples—and of direct observation was modeled based on the REFA work element method. Three to five users were observed during work execution to identify best-practice workflows. Time measurements were conducted using video footage. The resulting standard times of work elements were used to model labor input for herbage measurements in different farm sizes (i.e., milking platforms of 6–100 ha) and subdivisions of a farm’s milking platform (i.e., 4–45 paddocks). Labor time requirement differed between the smart farming tools (0.7–5.9 h) depending on the farm size and milking platform scenario. The labor time requirement increased for all tools with an increase in farm size and was lowest for the RPM. For the UAV tool, it did not increase noticeably when the division of the milking platform changed. Nevertheless, the potential to save time was identified for the UAV and the NIRS. Therefore, the automation of certain steps in the workflows would contribute to sociotechnological sustainable pasture management.
1. Introduction
Ensuring sustainable consumption and production patterns by 2030 was formulated by the United Nations member states as one of the 17 Sustainable Development Goals [1]. A sustainable and economically viable milk production can be achieved by the demand-based feeding of cows. Although pasture-based systems score better on ecological and economic sustainability than indoor dairy production systems [2], it is more difficult to implement demand-based feeding in pasture-based systems because the growth and nutritional value of herbage is affected by many environmental factors [3].
In pasture-based systems, herbage intake, not only in terms of quantity but also in terms of quality, is difficult to estimate, making it difficult to control how much concentrate feed to add. Well-implemented pasture management in strip or rotational grazing systems can ensure the high production levels and nutritional health of dairy cows [4,5]. Moreover, it can combine the farmer’s production goals with multiple ecosystem services [6,7,8] and positive aspects of animal welfare [9] that pasture-based systems offer.
Demand-based feeding on pasture relies on good pasture management, and thus experience is needed [8]. However, there are tools to support pasture management. For example, farmers can take destructive samples of defined grassland areas to weigh and measure available herbage mass [10], or they can use rising plate meters (RPMs) to convert measurements of compressed sward height into an estimate of herbage mass [11]. These estimates can be visualized in a so-called “grass wedge”, i.e., a bar graph where paddocks are sorted by the amount of available herbage so that it is easy to see which paddocks are below and which are above the required amount of feed for the grazing herd. Based on the grass wedge, farmers can better schedule the allocating or harvesting of paddocks, as well as anticipate herbage shortages [12]. Additionally, farmers can send dried herbage samples to a laboratory or use tables to look up the nutritional value of fresh herbage in the fields [13]. With this, farmers can manage the supplementary use of concentrates more efficiently [2].
However, even the basic tasks of grazing, such as setting up and checking fences and water troughs or bringing animals to grazing areas and back, are perceived as labor intensive [14,15]. Even more work is added when the precise herbage measurements are to be conducted [16]. There is even more time pressure during bad weather periods because the grass must not be wet for some measurement methods, which additionally complicates the completion of the task. The additional work can affect social components of sustainable farming practice, because there is less time and flexibility for family and social life [17].
In general, the volume of work in dairy farming and its physical strain are high [18,19], as is the psychological workload for farm managers [20]. Therefore, some farmers identified an unsatisfactory quality of life in a Swiss study [21]. In order for dairy farming to remain an attractive occupation for future generations, a better work–life balance is urgently needed [22,23].
Automation attempts to address these aspects of unsatisfactory social sustainability on farms, particularly by reducing working hours and physical workloads in standardized production processes [18,24,25]. Thus, new approaches and tools are constantly emerging from research and industry that are semi-automated and make estimations nearly in real-time and on-site, which supports farmers’ decision-making. They are hereafter referred to as smart farming tools.
Smart farming tools are being developed to assist herbage measurements in order to make paddock management more precise. One tool, which is already in use, is a semi-automated RPM that converts a sward height measurement into a herbage mass estimate in real-time [26]. Another tool is an unmanned aerial vehicle (UAV) that is equipped with optical sensors and generates a color-scaled farm map to indicate the spatially available herbage masses. This tool is still in the development stage, because an established prediction model was not accurate enough for practical use by farmers in an evaluation study [27]. However, it is seen as having a large potential to replace RPM measurements because it has a high operative capability in determining herbage mass and is also affordable [28,29]. In a study by Lussem et al. [30], the UAV approach used even outperformed an RPM in measurement accuracy. However, Sishodia et al. [31] note that image processing is complex and needs expertise. Therefore, it is difficult to develop an easy-to-use workflow for real-time application to promote the adoption of the tool [31]. A third tool uses near-infrared reflectance spectroscopy (NIRS) to analyze the nutritive value of fresh herbage cuttings on-site. By weighing the cut herbage samples, they can also be used to estimate the amount of herbage available in pastures and to create the so called grass wedge [32]. The NIRS is commercialized and available as a mobile work station to be operated either in farm offices or car boots or as fixed variant mounted onto harvest machinery. Calibrations are constantly evolving and are updated from time to time by the manufacturer.
To the best of our knowledge, labor times are as yet unknown for these tools, and therefore also the implications for social sustainability on farms. There are different methods to quantify or estimate labor time requirements. Interviewing persons can provide estimations on labor input. A more precise method is a work diary, for example, via a smartphone app as used by Deming et al. [16]. Although this method is partly subjective, it is well suited to getting insight into the required labor input of a production system. Thus, the total workload on a farm or the relative differences in workload for different work operations can be estimated [33].
However, work operations can also be directly observed and measured using traditional watches, hand-held computers, or smart devices with time measurement apps [34,35]. Indirect time measurements are possible by taking videos of working persons and analyzing video footage by means of time measurement software [36,37,38]. Direct and indirect time measurements are usually no longer done at the farm level, but at the level of individual work operations and procedures, for example, harvesting forage with a rotary mower [39] or trellising greenhouse crops with an angle of 30° [40]. Hereby, it is essential to determine influencing factors, for example, the distance driven with a tractor or the number of pepper and tomato plants trellised within the measured time interval.
These time measurements, which are based on a variety of observations on different farms, can further be used to establish dynamic labor time models [41]. Dynamic models allow estimating labor time requirements under changing conditions [38,41,42], for example, large versus small farms. Therefore, they are extremely valuable for labor planning and for comparing the labor input of different work procedures before a potential purchase decision is made.
The present study focuses on three smart farming tools supporting paddock management decisions for which there is little or no information available about the temporal labor input. No work diaries or survey data were available for two of the tools investigated, because they were still relatively new and have not yet been widely applied in practical agriculture. In addition, the best-practice workflow on farms is unknown, and it has not yet been studied under which farm conditions, such as farm size, pasture subdivision, and spatial and botanical heterogeneity, the tools are best used.
To study the above-mentioned aspects, dynamic labor time models were established to determine the required labor time. Furthermore, work observations were conducted to measure time in each work procedure.
The objectives of this study were (i) to model the labor time requirement of three smart farming tools and the conventional approach for herbage measurement on an exemplary dairy farm and (ii) to identify potential time savings by optimizing the smart farming tool applications, especially their workflows. In addition (iii), the impact of the farm size and the subdivision of the milking platform on labor input was investigated.
2. Materials and Methods
The labor time requirement for measuring herbage using the three smart farming tools and a conventional approach was calculated by means of a dynamic modeling approach. As the basis for modeling, the REFA work element method was used [34]. For this, the work operations had to be analyzed to create workflow models. To do so, video footage was gathered. From 2018 to 2020, different users were recorded on video during on-farm and real-time measurements of fresh herbage from pastures using three smart farming tools (Figure A1).
2.1. The Work Operations Using Different Work Procedures
The work procedures under study (i.e., three smart farming tools and the conventional approach “direct observation”) differed from each other in terms of the application method. However, they all consisted of a work operation “sampling” and “analysis,” the former involving sampling the pastures, i.e., collecting the data or fresh biomass for analysis. This included digitalization and visualization of the data as downstream work. The later analysis involved determining the herbage quality. Each work procedure’s workflow and associated sub-operations are described below.
2.1.1. Direct Observation
Determining herbage mass by direct visual observation is done by walking a few meters into a paddock, looking at the available herbage within the paddock, and noting down the herbage mass estimate as kilograms of dry matter per hectare.
For paddocks that will be grazed next, look-up tables are used to determine herbage quality parameters by observing a representative spot within the paddock. In look-up tables by Daccord et al. [13], users assess the herbage category (richness on legumes, grasses, and herbs) and the phenological stage of the plants (e.g., shooting and flowering). After the precise determination of the indicators mentioned, users can read the corresponding table values for several nutrient concentrations.
2.1.2. Unmanned Aerial Vehicle
Available herbage mass and crude protein concentration in herbage were determined by collecting and analyzing multispectral images via a UAV. For the collection of the images, a quadcopter (DJI Phantom 4 Pro+, DJI, Shenzhen, China) was set up on the farm at a starting point (=home-point), and the flight planning was done with the help of a smart device app (Pix4D Capture, Version 4.5.0, Pix4D, Lausanne, Switzerland), after which the flight took place autonomously. The attached multispectral camera (Parrot Sequoia sensor, Parrot SA, Paris, France) took images every 2 s to ensure an 80% overlap. For the radiometric correction, i.e., the calibration of the camera, images of a reference panel were taken immediately before or after the flight. The multispectral camera was operated using a separate app rather than the app for flight planning. The next generation of UAVs offers a version with a pre-installed camera for agricultural purposes.
After the flight in the field, the geo-referenced multispectral images were downloaded from the memory card in an office. Next, the images of each spectral band had to be merged to farm maps, which could then be analyzed on an online platform, e.g., the GrassQ platform. This platform uses an algorithm that was developed on Irish grasslands (www.grassq.com accessed on 2 July 2019) [43]. The process of merging images, in the present case by using the professional Pix4D Mapper software (Version 4.3.31, Pix4D, Lausanne, Switzerland), is detailed in Assmann et al. [44].
In the present study, it was assumed that sub-operations for merging images and analyzing farm maps were outsourced. Thus, for the UAV tool to gain practical relevance, image processing could be done overnight in the future by a commercial provider and via a cloud onto which images are uploaded. Consequently, the next day, the users are provided with color-scaled result maps, on which they could base their decisions on pasture management and supplemental feeding.
2.1.3. Rising Plate Meter
The RPM tool, as it was used in the present study, only allowed the determination of the compressed sward height, which was automatically converted into a dry matter estimate per unit area by an algorithm and did not measure any nutritional values. However, with the help of the Global Positioning System module, the precise portioning of herbage within a paddock can be easily implemented by the user. The semi-automated RPM works with a smart device app (Grasshopper G2 Sensor, TrueNorth Technologies, Shannon, Ireland). For the compressed sward height measurement, the ultrasonic sensor was first calibrated at the field boundary by measuring the distance between the sensor and the pendulous plate. This represented the reference value for a sward height of zero millimeters. After entering the paddock name, the estimated dry matter concentration (DM%), and the desired number of sampling points per paddock into the app, the user walked across the paddock in a zigzag pattern and placed the RPM on the sward at regular intervals until the appropriate number of RPM drops (i.e., sampling points) was reached. The same was done for the remaining paddocks. After completing the weekly farm walk across all paddocks, the grass wedge was displayed in the app, and the user could thus make a management decision while still in the field.
2.1.4. Cut Samples and Near-Infrared Reflectance Spectrometer
The NIRS analysis allowed for the determination of multiple nutrient concentrations relevant to livestock feeding: dry matter and crude protein concentrations as well as the concentrations of different structural carbohydrates and crude ash. The technology under study (HarvestLabTM 3000, Deere & Company, Moline, IL, USA) was a mobile NIRS laboratory that analyzed un-dried herbage in nearly real-time and on the farm.
However, the tool required destructive samples of fresh herbage. This can be done by hand-sampling while walking across a certain paddock if knowledge about available herbage mass per area is not required. It can also be done by cutting a defined area within the paddock in order to calculate available herbage mass per area unit (e.g., kg DM ha−1).
For the purpose of this study, the latter was done. By determining herbage mass, this work procedure could be compared to the other tools. For destructive herbage sampling, users randomly dropped a metal frame of one-quarter square meter into a representative area within the paddock. This was repeated twice within each paddock; one sample was taken in an area where the lowest herbage mass, and one where the highest herbage mass was assumed, as recommended by Nakagami [45]. A hand-held electronic shear was used to cut the herbage within the metal frame at approximately 5 cm above-ground. Plant material of each cut square was collected in a bag, and its fresh weight was determined using an electronic hanging scale and noted on the bag’s label.
Back at the farm, the measurements were digitized. First, an herbage subsample of each bag was grabbed by hand and analyzed for its dry matter concentration using NIRS. Therefore, the NIRS analysis software was set up using a laptop connected to the portable NIRS instrument. Next, the herbage sample was filled into the sample bowl of the instrument and analyzed in three measurement repetitions using the stored algorithms, interrupted by two mixing procedures. The determined dry matter concentration was related to the fresh weight of each cut herbage sample, resulting in an estimate for kg DM per ha. With this, the grass wedge was created, and it was decided which paddocks would be grazed next. Finally, fresh herbage samples of the paddocks that would be grazed next were analyzed similarly for the above-mentioned nutrient concentrations. The data storage, documentation, and illustration of the results took place manually via an Excel sheet. Further information on the HarvestLabTM 3000 system and the processing of multispectral images is given by Hart et al. [27].
2.2. Determining Labor Time Requirement
To determine the labor time requirement, an established model calculation approach was followed. For the model calculation, time measurements were performed for single work elements within a workflow.
2.2.1. Model Calculation System
The labor time requirement for each of the four herbage measurement tools was calculated using an established dynamic model calculation system called PROOF (Agroscope, Ettenhausen, Switzerland [46]). The PROOF system operated in MS Excel (Microsoft, Redmond, WA, USA) and was developed using the Visual Basic for Applications script language. There were PROOF modules available for different agricultural production branches such as arable farming, tree fruit production, and dairy farming. In the present study, the PROOF module on grazing (last updated 2001 [15]) was used. The module contained work operations such as bringing cows to pasture, fencing, and water trough control. The work operations for measuring herbage were newly modeled and comprised the four work procedures “UAV”, “RPM”, “NIRS”, and “direct observation”.
2.2.2. Modeling the Work Operations
To create the work operations in PROOF, workflow models were established to reflect the ideal execution variant for each of the work procedures UAV, RPM, NIRS, and direct observation. The workflow models of the three smart farming tools (i.e., UAV, RPM, and NIRS) were identified from the video observations wherein the users performed the individual tasks according to best experienced practice, or if a sub-operation involved an instrument, according to the manufacturer’s instructions. Section 2.1 gives an impression of the workflow of each work procedure and thus the respective workflow models. As an example, Table A1 shows the workflow model of the RPM.
The workflows for measuring herbage consisted of two work operations that can be described by a step where herbage is sampled and a second step where it is analyzed. The digitalization and visualization of the measurements were treated as a downstream sub-operation of sampling or analysis, respectively. They were performed in the office. To ensure the comparability of the work procedures, the workflow was modeled for each procedure until the work operation was completed, i.e., until the results were visualized. The next work operation would be the decision-making of the farmer about the paddock management and the supplementary feeding of the cows.
Each work element occurring in each workflow and the work elements’ standard time value (in centiminutes (cmin), i.e., 1/100 min) were identified during time measurements according to REFA [34]. They were either conducted as part of the present study (see Section 2.2.3) or previous projects, where an extensive database was created at Agroscope (Switzerland). The database currently contains around 3500 work elements, gathered since the 1980s [47]. The work elements used from the database (Table A2) were determined by numerous work experiments, and their standard time values are statistically verified.
In PROOF, all occurring work elements (Table A2 and Table A3) were itemized following the workflow models. The work elements’ standard time value was multiplied by the frequency of the work element occurrence. In addition, each work element was related to its procedure-specific influencing factors, for example, the number of sampled points per paddock by the RPM, and related to its farm-specific influencing factors, such as, among others, the paddock size, paddock number, and traveling distances (Table 1). Finally, the time values were summed up in MS Excel to calculate the total required time for each work procedure during a one-time execution (in manpower minutes (MPmin) or manpower hours (MPh)).

Table 1.
List of influencing factors with assumptions made during modeling in PROOF.
The modeled work procedures differed in the number of work elements they contained: 43 (UAV), 14 (RPM), 38 (NIRS), and 19 (direct observation). Some work elements occurred in multiple work procedures.
The workflow model for direct observation was established by interviewing an expert. The workflow in the field was similar to the work operation “sampling” of the NIRS tool (i.e., cutting samples) and included some of the same work elements. Three additional work elements (i.e., “estimating herbage mass”, “determining herbage category”, and “determining the phenological stage”) were defined and their duration estimated by the expert (Table A3).
2.2.3. Time Measurements
For work elements not available in the database, work observations were conducted on three dairy farms in Switzerland in 2018, 2019, and 2020. One of these farms was the Agroscope Dairy Research Barn Waldegg, located in the north-east of Switzerland. The other two farms were commercial farms, located in central Switzerland and the Zurich region. The farms were visited during the vegetation period when the tool users (technicians, researchers, and interns) performed regular herbage measurements as part of a study that evaluated the precision and accuracy of the tools [27]. The pastures were either grazed or defoliated four to six times per year with regular fertilization. They were permanent grasslands with multiple species (relative abundances of 5–28% ryegrasses, 30–72% other grasses, and 10–61% clover species and herbs).
For the time measurements, between three and five experienced users per smart farming tool and the associated work operations were filmed during several executions (Table 2). All work elements occurring in the workflow were identified by following the REFA method [34]. Their frequency of occurrence, their influencing factors, and their unit were determined. The respective start and end situation of each work element were defined, and its duration in centiminutes was measured using video analysis software for time measurements (MEZA, Version 8.8, Drigus Systeme GmbH, Dortmund, Germany). After a plausibility check, all measured values per work element were averaged to obtain the standard time value.
Table 2.
Overview of the video observations.
The sample size of each work element varied between 1 and 480, because during work observations the execution speed of the work differed between the users (Table A3). Whereas the coefficient of variation is a measure of the quality of a standard time value for non-cyclic work elements, the epsilon value is valid for cyclic work elements. Coefficients of variation of ≤25% and relative half confidence intervals (i.e., epsilon values (ε)) of ≤7% were targeted for the work elements based on the REFA recommendation [49]. Nevertheless, the coefficients of variation ranged from 1.7% to 69.4% between work elements and the epsilon values from 0.6% to 90.7% (Table A3).
2.2.4. Distribution of Working Time
The individual work elements were further assigned to individual time classes, namely operation time, fault time, and non-productive time [50]. These time classes can be further divided into sub-classes according to Reith et al. [50]. Thus, the class “operation time” designates the times for executing, turning, loading and unloading, inherent delay, adjusting, and relaxation allowance. “Fault time” occurs owing to functional and technical faults, weather, work organization, or contingency allowance. Supply time, job preparation and closing time, transit time, and servicing time are components of the time class “non-productive time.” The times belonging to the same time sub-class were added up, and the sub-class’s relative proportion on the total labor time requirement was calculated for each work operation.
2.3. Modeled Farm Scenarios
The model calculation system PROOF allows modeling different farm scenarios. In general, the modeled dairy farms followed a rotational grazing system where animals grazed on pasture full-time and rotated between paddocks every 1 to 1.5 days. For modeling, we assumed a farm site with good grass growth rates that was well suited for grazing, i.e., climatic conditions that allow full-time grazing from March to October and sufficient grass growth. As a result, we assumed paddocks that could be re-stocked every three weeks after herbage had re-grown.
Lactating cows grazed on paddocks of highly productive and nutritious pasture in contrast to the non-lactating cows. Those high-quality paddocks formed the milking platform. The size of the milking platform depended on the number of animals. According to Teagasc’s grassland management recommendation, 2.8 cows can be stocked per hectare of high-quality and high-production pasture, i.e., a sward dominated by perennial ryegrass and with a relatively high growth potential [51]. Consequently, an area of 0.36 ha was required per cow in the modeled farm scenarios.
2.3.1. Standardized Farm
An exemplary dairy farm (Figure 1), hereafter referred to as standardized farm, was used to compare the modeled labor time requirements of the four herbage measurement tools. The size and structure of the standardized farm was based on an average Irish dairy farm in the year 2019 and therefore comprised 80 lactating cows [52]. Considering the need for 0.36 ha of pasture per animal, cows grazed on a 28.8 ha milking platform that consisted of 20 paddocks between which cows were rotated. In the model, it was assumed that the 20 paddocks comprised an equal size of 1.44 ha each.
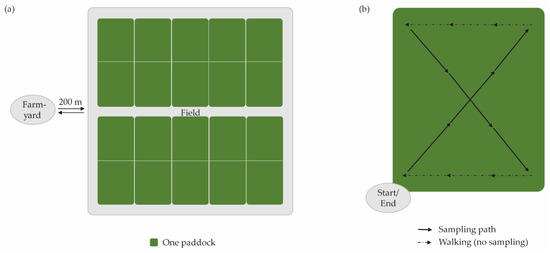
Figure 1.
Schematic illustration of the standardized farm (a) and the walking distance across one paddock during the work operation of cutting herbage samples (b). Paddocks are highlighted in green.
2.3.2. Modeled Farm Sizes and Subdivisions of the Milking Platform
Different farm structure scenarios were modeled to identify best use cases for each of the four herbage measurement tools. Best use cases were defined as the conditions where a tool requires the shortest working time compared with the other tools.
To model different farm sizes and subdivisions of the milking platform, two variables of the model calculation system were adjusted: the paddock size and the number of paddocks (Table 1). Different farm sizes comprising milking platforms of 6 to 100 ha were modeled by increasing the paddock size from 0.3 to 5.0 ha and keeping a constant number of 20 paddocks. These scenarios aimed to represent increasing farm sizes by increasing the numbers of animals but maintaining the rotation schedule.
Additionally, we modeled scenarios where the number of animals was kept constant, but rotations were shorter or longer because paddock sizes often differ from farm to farm. To do so, the size of the milking platform was kept at 28.8 ha, but we subdivided it in different numbers of rectangular paddocks. The number of paddocks was between 4 and 45, resulting in paddock sizes between 7.20 and 0.64 ha.
2.4. Varying Numbers of Cut Samples per Paddock
The impact of the number of cut samples per paddock on the labor time requirement was studied, because with a higher number of samples the measurement accuracy most likely increases compared with one-point-sampling (although one-point sampling is the most time efficient for on-farm use) [45]. Especially in multi-species swards, several cut samples from one paddock can represent the herbage quality and mass better than only one sample. Therefore, the labor time requirement was calculated for 1 to 10 cut samples taken per paddock by following a specific sampling path (Figure 1b). To do so, the input variable “number of sampling points per paddock” (Table 1) of the model calculation system was adjusted keeping all other variables according to the scenario of the standardized farm. It was assumed that for a number of four samples the sampling path is walked in the form of a cross, and before that a diagonal is walked into the paddock (Figure 1b).
2.5. Calculation of Optimization Potential
To calculate the working time to be saved when the three smart farming tools and respective workflows were optimized, we first identified the work elements that could be omitted if technologies would be further developed or when commercial installation and support were offered by manufacturers (i.e., development of apps, browser platforms and databases, data transfer via wireless LAN, automated UAV flight planning and take-off, automated data upload and analysis). We assumed that the identified work elements in each tool were subtracted from the total labor time requirement when using them to measure herbage and no additional labor was required through the adjustments in the technologies and workflows. The total time savings were calculated by summing up the time for superfluous work elements under the scenario of the standardized farm.
3. Results
3.1. Labor Input under Different Farm Scenarios
The labor time requirement for RPM and UAV increased most with increasing paddock size (Figure 2). Enlarging paddocks had the greatest effect on the labor time requirement for the UAV, whereby the required time was disproportionately greater than with other tools from a paddock size of 4 ha (i.e., a milking platform of >80 ha). Each additional 9 ha to be sampled using the UAV required flying back to the home-point to change batteries. Below paddock sizes of 1 ha (i.e., a milking platform of <20 ha), the UAV required less labor time than the other tools.
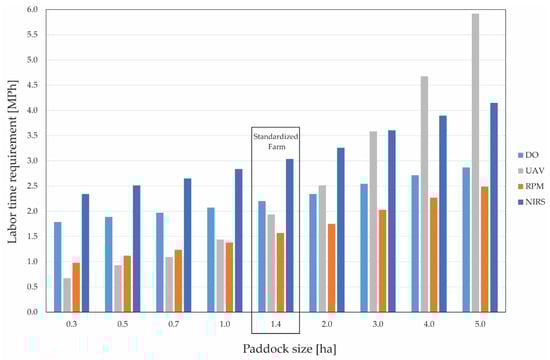
Figure 2.
Labor time requirement of three smart farming tools and direct observation (DO) in measuring herbage mass (and quality) of 20 paddocks on model farms with increasing paddock size and thus farm size. UAV, unmanned aerial vehicle; RPM, rising plate meter; NIRS, near-infrared reflectance spectrometer analysis with cutting samples.
An increase in paddock size affected the labor time required for direct observation and for NIRS slightly less, at least under the assumption that the number of sampled squares per paddock is constant. NIRS required more time than the RPM and direct observation among all paddock sizes.
When subdividing a given milking platform into fewer or more paddocks, the labor time requirement of the UAV tool remained approximately the same despite increasing paddock numbers (Figure 3). In contrast, labor time requirements for the other two smart farming tools and the direct observation increased significantly as the number of paddocks increased. For NIRS and direct observation, the labor time requirement increased even more with the increasing number of paddocks than for the RPM, making them unfavorable for large numbers of paddocks. NIRS required always more time than direct observation. The RPM required the least time when used on >4 and <30 paddocks.
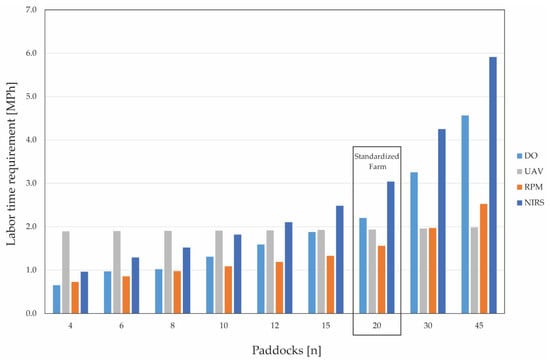
Figure 3.
Labor time requirement of three smart farming tools and direct observation (DO) in measuring herbage mass (and quality) on a model farm with a 28.8 ha milking platform and different paddock numbers. UAV, unmanned aerial vehicle; RPM, rising plate meter; NIRS, near-infrared reflectance spectrometer analysis with cutting samples.
3.2. Influencing Factors of Labor Input
In contrast to the other tools, the UAV’s labor time requirement was hardly influenced by the number of herbage estimates and sampling points per paddock, the distances between the paddocks, or the rotation scheduling (as described in Table 1), because in any case the UAV flies over and samples the entire milking platform. However, the size of the paddocks and the battery life do play a role for the labor input.
A strong effect of the number of sampling points per paddock on labor input was found for the NIRS tool (i.e., the number of cut samples). Additionally, the labor time requirement was noticeably influenced by the number of paddocks sampled in sequence and the fact that the sample bags must always be placed at the paddock boundaries owing to the limited carrying capacity of the user when no device with a carrying function (wheelbarrow or motorized cart) is used, as modeled in the present study. The labor time requirement reflects this particularly if herbage cuttings are repeated per paddock.
The work operation of cutting fresh herbage had a large share in the total labor time requirement of the NIRS tool and was responsible for the long adjustment and execution time in the field (see Section 3.3). It included the time for walking the respective pattern within a paddock and the time for cutting the herbage sample in a representative area.
The labor time requirement rose with each additional sample that had been cut (Figure 4). Whereas for up to three samples a diagonal was walked across the paddock, for four or more samples the complete cross was walked, as shown in Figure 1. From four samples per paddock, the labor time requirement increased linearly by 1.23 manpower minutes (MPmin) with each additional sample.
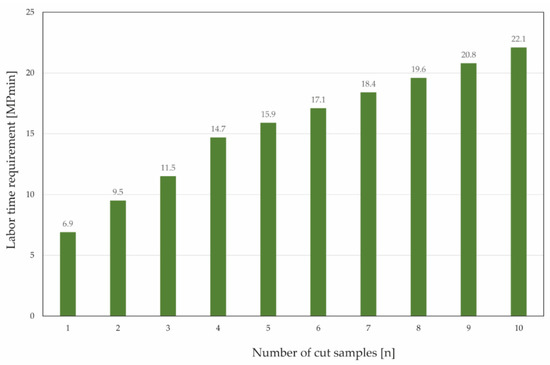
Figure 4.
Labor time requirement in relation to the number of samples cut within the same paddock. The numbers apply to a paddock size of 1.44 ha.
3.3. Time Distribution on the Standardized Farm
The labor time requirement in measuring herbage by direct observation was 132.1 MPmin. In contrast, using the three smart farming tools required 116.1 MPmin (UAV), 182.2 MPmin (152.1 MPmin for cutting samples and 30.1 MPmin for NIRS analysis), and 94.2 MPmin (RPM) under the conditions of the standardized farm.
The work procedures direct observation, UAV, and RPM had almost no job preparation time on the farm. Nevertheless, for the direct observation and UAV, job closing time occurred on the farm to document and visualize the herbage measurement results (for the direct observation) or to download the image data and prepare them for image analysis (for the UAV). For the RPM, most of the work, starting from calibrating the plate until visualizing the measurements of herbage mass, was performed in the field. The RPM had no fault time due to work organization, in contrast to the other tools (Figure 5).
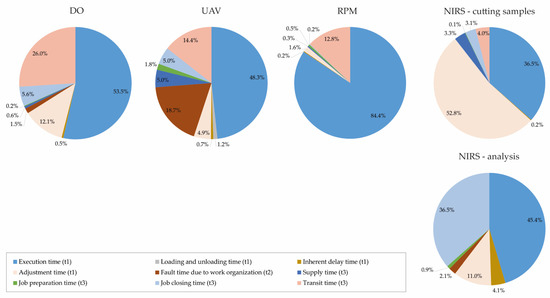
Figure 5.
Distribution of working time spent to measure herbage mass and quality by using different tools on the standardized farm. DO, direct observation; UAV, unmanned aerial vehicle; RPM, rising plate meter; NIRS, cutting samples in the field and near-infrared reflectance spectrometer analysis on farm; t1, operation time; t2, fault time; t3, non-productive time.
In contrast to direct observation, the three smart farming tools required the user to spend a smaller proportion of time on transit. This is because the user of direct observation has to enter the paddocks to estimate herbage mass in order to get a picture of the complete area. In addition, the user has to go to the field a second time to evaluate the herbage quality for the number of paddocks that will be grazed next.
The two work operations of NIRS had the highest proportions of adjustment time and job closing time. Adjustment time occurred during cutting samples in the field when the user walked across paddocks and a representative area for sampling had to be found. Job closing time included work for the documentation and visualization of measurements.
The total operation time (t1) was smallest for UAV (55.1%), where the remaining 26.3% and 18.7% of the total required time were non-productive time (t3) and fault time (t2), respectively. Unlike the other tools, the UAV has a large proportion of supply time and job preparation time within the non-productive time.
3.4. Optimization Potential
An automation of the workflow of the UAV tool could reduce the total labor time requirement by 34.4 MPmin under the conditions of the standardized farm (Table 3). Labor time invested in gathering multispectral images by means of UAV flights in the field could be reduced by 12.1 MPmin (−10.4%). Thereof, a great part are savings in supply time and job closing time (installing and uninstalling of UAV and supplies), and adjustment time (setting up the sensor calibration and capturing metrics, flight planning on the smart device). A minor part that can be saved is transit time (walking distance between the storage location of the UAV and the home-point).
Table 3.
Time saving potential through technological advancement of the tools using unmanned aerial vehicles (UAVs) and near-infrared reflectance spectroscopy (NIRS).
During the workflow in the office, the total labor time requirement can be reduced by another 22.3 MPmin (−19.1%). This time saving is largely due to the reduction in job preparation and closing time if a wireless LAN connection were to be used for image data backup instead of a physical memory card, and if images were uploaded automatically to a database where they are stored and analyzed via an external service.
When collecting the cut samples for real-time NIRS analysis, a smartphone app for in-field use could reduce the total labor time requirement by 4.9 MPmin (−2.7%) (Table 3). The app would eliminate the need to write down the bag weight in the field and enter it on the computer at the farm. In addition, the geolocation function of the smart device could automatically record the paddock name for the corresponding sample. A feed wedge would be available in real-time, and a decision on pasture management could be made directly in the field.
Another 5.7 MPmin (−18.8%) of job closing time spent on the farm could be saved by automating data storage, preparation, and visualization (−3.1% of the total labor time requirement). So far, the user manually exports the analysis results of the NIRS and creates an overview of the analyzed paddocks and the associated herbage quality values by means of table calculation software. Only then does the user derive the adequate feeding strategy. A user-friendly digital platform that clearly presents the analysis results on a farm map and communicates with the app would significantly reduce the time requirement for data storage, preparation, and visualization.
4. Discussion
4.1. Studies on Labor Input
At the present time, scientific studies on labor time requirements of smart farming tools are rare. Reasons for the lack of scientific investigations may be the novelty of the smart farming tools, the little knowledge on best-practice workflows, and the lack of commercial implementation of the tools. Overall, the topic of precision grazing management has found little application in practice but is gaining more and more focus in agricultural research. Because the development of precision grazing systems is still in progress, there is even less research on the subject of labor input.
A study by Deming et al. [16] determined a labor input of 0.23–0.35 h per cow and year for herbage measurements in Irish dairy farming. Nevertheless, there are no figures for the labor input involved in a one-time execution that could be compared with our results. In addition, it remains unclear which tools farmers used to measure herbage. Presumably, they cut samples or used the RPM, with both work procedures being promoted by the state agency [51].
Two other studies have addressed the labor time requirements of the RPM and cutting fresh herbage samples [10,53]. However, the estimated times of both studies were not based on time studies with a determination of generally valid values (in our case the standard times).
The time values for cutting samples in Lantinga et al. [10] were collected under specific conditions during grassland and pasture experiments. They were not statistically validated and are therefore not generalizable to other conditions.
The time estimation from Murphy et al. [53] is much lower (0.09 h/ha) than that of the present model (0.22 h/ha; one paddock of 1 ha). The authors calculated the labor time requirement for RPM measurements based on the average human walking pace and the manufacturer-recommended distance between measuring points. The work operations before and after measuring were not included. In the present study, when execution time is considered separately from other times before and after execution (i.e., only the work elements “walking with RPM on field” and “sampling RPM point”; Table A1), the time estimate of 0.06 h/ha is close to that of Murphy et al. [53].
In a follow-up study, Murphy et al. [54] developed a model that calculates the ideal sampling route, in terms of time saving and measurement quality, for an unbiased sampling point selection. This new approach is useful when, owing to homogeneous pastures (spatially and botanically), few measurement points are sufficient to obtain a meaningful measurement result. In the present study, the number of measurement points was set to 45, regardless of the paddock size and homogeneity. However, fewer measurement points can be taken in small paddocks if pasture conditions permit, because reducing the number of measurement points without losing measurement quality is highly dependent on pasture heterogeneity.
4.2. Methodological Reflections
The chosen modeling approach, based on the REFA work element method, has great strengths. First, however, we would like to point out some weaknesses.
The sample size of the present study was sometimes small, owing to the novelty of the studied work procedures. Furthermore, some of the individual work element times depended on the response time of the user and on intellectual labor time. In these cases, the coefficient of variation and the epsilon value sometimes exceeded the desired maximum thresholds of 25% and 10% at maximum, respectively [37,49]. However, the standard times of work elements that could be characterized by technical conditions showed very small variations (e.g., work element “HarvestLab analysis”; coefficient of variation: 11.72%; epsilon value: 3.11%). By measuring the work element times and creating the labor input models, it was nevertheless possible to gain informative insights for further development of the novel smart farming tools.
A great strength of the modeling approach used is the identification of the time saving potentials at the work element level. Thus, labor time requirements can be modeled for workplaces, conditions, or workflows that do not yet exist and used for planning purposes [36].
Another advantage of the work element method and the labor time models established is the simulation of different farm conditions such as sizes, structures, and animal numbers [41]. Thus, in the present study, it could be shown for which farm sizes and grazing managements (i.e., the duration of rotation cycles via the splitting of a given milking platform) each tool is most suitable.
4.3. Suitability of Tools for Use on Different Farms
One aspect that influences the suitability of a tool is the farm-specific conditions it is applied under. For example, Hart et al. [48] have shown that the UAV is less suitable on a farm with widely distributed paddocks because of the long travelling distances and relatively short battery capacity. Therefore, it is more suitable for farms with compact milking platforms.
The heterogeneity of the grassland can also play a role in the suitability of a work procedure. Because the resolution of the UAV measurement is in the centimeter range and extends over the entire area of interest, spatial differences in herbage quantity and quality can potentially be detected very well. In contrast, NIRS measurement resolution is tied to the number of cut samples, and thus always a point sampling that either represents the area well or not. Because an increase in the number of cut samples increases the labor time requirement (Figure 4), this work procedure is best suited for botanically and topographically homogeneous grasslands.
In the present study, we hypothesized that, despite increasing paddock size, a constant number of samples per paddock (two samples in the case of NIRS) was sufficient to make a statement about herbage mass and quality. Therefore, the increasing paddock size had hardly any influence on the labor time requirement for NIRS and direct observation (Figure 2). Our assumption was based on a study by Nakagami [45], who found that if it is possible to sample the areas with the most and the least herbage masses within a paddock, the herbage mass of the entire paddock can be estimated with an acceptable accuracy for practical farming. This requires a farmers’ experience and good knowledge of the spatial growth of grasslands as well as an elevated site to survey it [45]. The issue here is that the measurement is likely to be inaccurate if the farm is botanically and topographically heterogeneous, especially with increasing paddock sizes, and therefore more samples should preferably be taken.
An alternative to the variant of NIRS modeled here would be to determine herbage mass using direct observation or the RPM, and randomly taking grab samples of fresh herbage while walking across the paddock for subsequent grass quality analysis with mobile NIRS. However, although using grab samples might save a certain amount of time compared with cutting samples, the problem of pasture heterogeneity still has to be addressed by cutting samples following a sampling route across the paddock and collecting a representative sample. That is again time intensive.
When making a purchase decision for an herbage measurement tool, other aspects should be considered besides the differences in the labor time requirement between tools; for example, the costs, the technology affinity, and the personal preferences of the user play a major role in the decision for or against a tool. While almost no skills are required for the use of the RPM, except the almost self-evident operating skills for using a smartphone, the UAV requires knowledge for the installation of the sensitive technology (training via tutorial videos), as well as the operation of a controller for flight control, the download of image data, and general handling on the desktop. Flying over the grassland with a UAV requires attention and patience, whereas walking across the paddocks with an RPM and sampling the paddocks by cutting fresh matter for NIRS analysis is more physically demanding.
In addition, possible supplementary benefits of a tool could play a role in the purchase decision. For example, the RPM measures distances on a farm with the integrated Global Positioning System module besides measuring herbage mass. During the RPM farm walk, users can check fences, inspect water troughs, and undertake small maintenance jobs. At the same time, or via the farm map generated by the UAV procedure, the quality of the pastures can be assessed, and decisions can be made regarding necessary mowing after grazing events, over-seeding, or fertilizer application. In contrast, the UAV and NIRS have the advantage of measuring parameters of grass quality, which is not yet possible with the RPM. This is especially important for farms with supplementary feeding, because they can use this information to control their concentrate allocation according to animal demands.
4.4. Opportunities of Precision Farming
Precision farming holds great potential to drive agro-ecological change and makes agricultural systems more ecologically and economically sustainable [55,56]. The goal of the investigated smart farming tools is to increase the efficient use of grasslands, and subsequently to reduce the use of concentrates in dairy farming that may compete with human diets. Such a transformation of grazing systems contributes to Goal 12.2 of the Sustainable Development Goals, aiming to achieve sustainable management and efficient use of natural resources by 2030 [1]. To pursue this goal and use grassland efficiently, it must be optimally managed. For this, knowledge on labor input becomes necessary. However, technical solutions are available to support labor and reduce the time requirement if implemented in optimized systems (workflows and farm conditions). In this way, a system can satisfy the Sustainable Development Goals 12 and 8. These are aimed at promoting occupational health and safety, as well as economic productivity and technological upgrading.
Promoting occupational health includes the reduction of the temporal workload of farm managers and employees, which our study shows can be achieved in two ways: firstly by using smart farming tools instead of the conventional approach, and secondly by further developing two smart farming tools (NIRS and UAV), where labor time can be saved through technological advancement and workflow optimization (Table 3). The reduction in labor time, and thus labor costs, is associated with an economic advantage.
4.5. Limitations of the Study
By conducting herbage measurements, labor time is presumably reduced in other areas of feeding, farm management, and documentation. However, these aspects could not be quantified in our study because only the work operations for measuring herbage but not the farm as a whole production system were modeled in terms of the labor time requirement. Further time studies are needed to investigate the labor benefits of smart farming tools at the farm level.
5. Conclusions
The labor input for the investigated smart farming tools for near real-time herbage measurements on pastures is more favorable in contrast to the conventional approach of direct observations, except for the NIRS tool. However, the different work elements of the workflow are important to evaluate the labor input. For example, the number of sampled spots used for NIRS is an important factor. Under the conditions studied, the time for cutting two samples per paddock occupies about 83% of the total labor time requirement for the NIRS work procedure. Thus, NIRS is not temporally competitive with the other tools if two cut samples or more must be taken to determine the herbage quantity and quality representatively of the area. Apart from that, the required spot sampling is less advantageous in terms of measurement accuracy compared with RPMs or UAVs, making the NIRS work procedure less attractive for farms with topographically and botanically heterogeneous paddocks. It might be different if the NIRS and RPM tools were used in combination and grab samples were taken during the paddock walk.
Another important factor influencing the labor input is the size of the milking platform, where all work procedures require more time with increasing numbers of hectares to be measured. However, UAVs require disproportionately more time than the other smart farming tools for larger milking platforms (>80 ha) and are therefore not suitable for them. This is because the battery life of the consumer quadcopter used is currently not sufficient.
Both smart farming tools, UAV and NIRS, have the potential to additionally reduce labor input through further development and commercialization. The smart farming tools could contribute to sociotechnological sustainability because they potentially improve the work–life balance by reducing working hours.
Author Contributions
Conceptualization, L.H., E.Q. and C.U.; data curation, L.H.; formal analysis, L.H.; funding acquisition, C.U.; investigation, L.H.; methodology, L.H., E.Q. and C.U.; project administration, C.U.; resources, C.U.; software, L.H.; supervision, E.Q. and C.U.; validation, L.H., E.Q. and C.U.; visualization, L.H.; writing—original draft, L.H.; writing—review and editing, L.H., E.Q. and C.U. All authors have read and agreed to the published version of the manuscript.
Funding
This research was funded by the Swiss Disability Insurance Office (IV-Stelle), Clarifications Department, Bern, Switzerland.
Institutional Review Board Statement
Not applicable.
Informed Consent Statement
Not applicable.
Data Availability Statement
The data presented in this study are all listed in the Appendix A and will be part of the Agroscope database of work elements.
Acknowledgments
The authors would like to express their sincere thanks to Katja Heitkämper and Ruedi Stark for their advice on the methodology, to the tool users we had the pleasure to accompany at work, and to Giulia Bozzolini and Saskia Glück, who supported us in filming and analyzing numerous hours of video footage.
Conflicts of Interest
The authors declare no conflict of interest.
Appendix A

Figure A1.
Illustrations and system specifications of the three smart farming tools to measure herbage: (a) unmanned aerial vehicle with multispectral sensor, (b) rising plate meter, and (c) cut samples and the near-infrared reflectance spectrometer for usage on-site. Under each system, the corresponding visualization modes of the measurement results are shown as examples.

Table A1.
Example of a workflow model for calculating labor time requirement in PROOF. The workflow model is for the work procedure rising plate meter (RPM). The reference quantities relate to the influencing factors and assumptions shown in Table 1.
Table A1.
Example of a workflow model for calculating labor time requirement in PROOF. The workflow model is for the work procedure rising plate meter (RPM). The reference quantities relate to the influencing factors and assumptions shown in Table 1.
| Workflow including Work Elements | Unit | Standard Time (cmin/Unit) | Reference Quantity (n) | Total Time (cmin) |
|---|---|---|---|---|
| Walking without load (traveling) | m | 1.8 | 672.9 | 1211.3 |
| Taking/packing sampling tools | Qty | 5.8 | 2 | 11.6 |
| Putting down sampling tools | Qty | 6.0 | 2 | 11.9 |
| Turning on RPM | Qty | 10.8 | 1 | 10.8 |
| Setting up app and Bluetooth connection | Qty | 24.5 | 1 | 24.5 |
| Sensor calibration | Qty | 8.7 | 1 | 8.7 |
| Walking with RPM on field (sampling route) | m | 1.0 | 6068.1 | 6068.1 |
| Sampling RPM point | Qty | 2.1 | 900 | 1890.0 |
| Single touch on smart device application | Qty | 2.8 | 49 | 137.2 |
| Entering data at computer (decimal 2_2) | Qty | 9.8 | 1 | 9.8 |
| Viewing grass height results on smart device | Qty | 15.0 | 1 | 15.0 |
| Uploading measurement | Qty | 5.0 | 1 | 5.0 |
| Turning off RPM | Qty | 13.4 | 1 | 13.4 |
| Getting unnecessary tool out of the way | Qty | 7.3 | 1 | 7.3 |
Qty: quantity, cmin: centiminutes.
Table A2.
Available work elements from the Agroscope database that were used to model the operation “herbage measurement,” their documented mean standard time per unit, and statistical metrics.
Table A2.
Available work elements from the Agroscope database that were used to model the operation “herbage measurement,” their documented mean standard time per unit, and statistical metrics.
| Work Element | Code | Unit | Standard Time (cmin/Unit) | n/Unit | CV (%) | Epsilon (ε) (%) |
|---|---|---|---|---|---|---|
| Walking without load | AE_GEHE001 | m | 1.8 | 10 | 14.7 | 10.48 |
| Riding in car | AE_FAHR_001 | m | 0.1 | 10 | 0.0 | 0.00 |
| Turning on computer | AE_BÜRO009 | Qty | 140.8 | 10 | 12.9 | 9.20 |
| Turning off computer | AE_BÜRO010 | Qty | 48.1 | 10 | 16.0 | 11.38 |
| Opening file on computer | AE_BÜRO011 | Qty | 13.6 | 10 | 20.6 | 14.66 |
| Saving and closing file | AE_BÜRO012 | Qty | 11.6 | 10 | 15.7 | 11.17 |
| Launching Internet Explorer | AE_BÜRO013 | Qty | 13.3 | 10 | 28.3 | 20.12 |
| Closing Internet Explorer | AE_BÜRO014 | Qty | 7.3 | 10 | 25.7 | 18.26 |
| Email program login | AE_BÜRO015 | Qty | 25.1 | 10 | 10.0 | 7.09 |
| Email program logout | AE_BÜRO016 | Qty | 18.0 | 10 | 21.0 | 14.92 |
| Opening attachment in email | AE_BÜRO021 | Qty | 9.1 | 10 | 15.8 | 11.22 |
| Reading document/email (cover letter) | AE_BÜRO022 | Qty | 54.3 | 10 | 14.7 | 10.45 |
| Entering data at computer (decimal 2_2) * | AE_BÜRO054 | Qty | 9.8 | 10 | 29.7 | 21.11 |
| Entering text at computer (1–5 words) | AE_BÜRO079 | Qty | 13.6 | 10 | 20.0 | 14.18 |
| Making selection (5_10) + | AE_BÜRO089 | Qty | 82.9 | 10 | 17.2 | 12.25 |
Qty, quantity; cmin, centiminutes; n, number; CV, coefficient of variation. * Two-digit number with two decimal places. + Selection is made according to five criteria from ten elements.
Table A3.
Work elements of the operation “herbage measurement” using three different work procedures, their mean standard time per unit, and their statistical metrics. Work elements in bold fulfill the required statistical limits defined by REFA [49].
Table A3.
Work elements of the operation “herbage measurement” using three different work procedures, their mean standard time per unit, and their statistical metrics. Work elements in bold fulfill the required statistical limits defined by REFA [49].
| Work Element | Unit | Standard Time (cmin/Unit) | n/Unit | CV (%) | Epsilon (ε) (%) |
|---|---|---|---|---|---|
| Setting up app and Bluetooth connection | Qty | 24.5 | 10 | 19.46 | 13.82 |
| Turning on RPM | Qty | 10.8 | 8 | 19.10 | 15.72 |
| Plate calibration | Qty | 8.7 | 7 | 34.74 | 31.37 |
| Sampling RPM point | Qty | 2.1 | 479 | 41.35 | 3.71 |
| Walking with RPM on field | m | 1.0 | 480 | 6.64 | 0.60 |
| Turning off RPM | Qty | 13.4 | 7 | 21.00 | 18.96 |
| Viewing grass height results on smart device | Qty | 15.0 | 3 | 33.33 | 62.50 |
| Single touch on smart device application | Qty | 2.8 | 9 | 5.36 | 4.08 |
| Uploading measurement | Qty | 5.0 | 2 | 28.28 | 90.71 |
| Flight planning on smart device | Qty | 103.6 | 15 | 30.63 | 16.96 |
| UAV landing manually at runway | Qty | 22.5 | 13 | 35.11 | 21.18 |
| Starting UAV | Qty | 37.6 | 19 | 31.61 | 15.25 |
| UAV take-off to 50 m flight height | Qty | 33.9 | 11 | 15.69 | 10.49 |
| UAV landing from 50 m flight height | Qty | 54.5 | 9 | 33.40 | 25.41 |
| Setting up camera software | Qty | 20.4 | 9 | 35.95 | 27.35 |
| Installing UAV and supplies | Qty | 314.9 | 9 | 31.51 | 23.97 |
| Uninstalling UAV and supplies | Qty | 256.9 | 7 | 39.51 | 35.68 |
| Placing calibration plate horizontally | Qty | 43.5 | 12 | 35.35 | 22.39 |
| Setting up calibration in app | Qty | 68.5 | 14 | 57.01 | 32.88 |
| Calibrating multispectral camera above plate | Qty | 43.7 | 15 | 24.18 | 13.39 |
| Checking photos | Qty | 58.0 | 1 | n/a | n/a |
| UAV image capturing time | ha | 186.3 | 8 | 25.40 | 20.91 |
| Battery change UAV | Qty | 45.7 | 6 | 31.60 | 31.93 |
| Copying large amounts of data (images) | n img | 0.9 | 5 | 1.69 | 1.97 |
| Deletion process of large amounts of data (images) | n img | 0.02 | 5 | 17.91 | 20.86 |
| Marking files in computer folder and giving command | Qty | 9.1 | 7 | 33.07 | 29.86 |
| Creating new file folder on computer | Qty | 8.0 | 4 | 10.21 | 14.39 |
| Pasting files to folder on computer | Qty | 7.0 | 6 | 36.14 | 36.52 |
| Disconnecting USB card reader from computer | Qty | 15.2 | 5 | 28.45 | 33.13 |
| Entering date and 2 words at computer | Qty | 29.8 | 5 | 21.41 | 24.93 |
| Removing card reader with memory card from computer | Qty | 13.5 | 4 | 25.30 | 35.66 |
| Opening folder on computer | Qty | 7.4 | 12 | 23.32 | 14.77 |
| Control view over copied data | Qty | 21.8 | 4 | 7.85 | 11.06 |
| Connecting memory card with card reader to computer | Qty | 19.3 | 4 | 19.15 | 26.99 |
| Waiting time due to the loading process of computer | Qty | 196.8 | 4 | 3.92 | 5.52 |
| Waiting time until computer is shut down | Qty | 20.8 | 4 | 28.48 | 40.14 |
| Filling plant material into bag | ¼ m2 | 25.7 | 52 | 48.74 | 13.59 |
| Cutting herbage with electric shear | ¼ m2 | 74.3 | 47 | 43.92 | 12.92 |
| Choosing representative area | Qty | 4.6 | 47 | 64.12 | 18.86 |
| Taking/packing sampling tools | Qty | 5.8 | 64 | 69.43 | 17.37 |
| Cleaning electric shear | Qty | 6.5 | 14 | 32.51 | 18.75 |
| Labeling sample bag | Qty | 28.1 | 9 | 25.99 | 19.77 |
| Putting down sampling tools | Qty | 6.0 | 47 | 46.95 | 13.81 |
| Weighing sample in bag with electronic hanging scale | Qty | 49.6 | 10 | 38.28 | 27.19 |
| Lifting all four pieces of instrument equipment to/from table | Qty * | 45.8 | 12 | 34.58 | 21.90 |
| Placing/taking weight plate | Qty | 3.0 | 89 | 41.12 | 8.67 |
| Turning instrument on/off | Qty | 3.9 | 29 | 35.28 | 13.44 |
| Filling material in dish | Qty | 25.4 | 20 | 41.46 | 19.43 |
| Placing/taking dish on/from measurement instrument | Qty | 4.6 | 65 | 39.71 | 9.85 |
| HarvestLab analysis | Qty | 36.9 | 57 | 11.72 | 3.11 |
| Exporting analysis results | Qty | 22.2 | 15 | 43.18 | 23.90 |
| Turning on computer | Qty | 4.8 | 13 | 34.40 | 20.75 |
| Disposal of material | Qty | 27.3 | 19 | 45.55 | 21.98 |
| Mixing material | Qty | 9.8 | 40 | 41.35 | 13.25 |
| Cleaning of dish with glass cleaner spray and paper towel | Qty | 53.0 | 17 | 24.57 | 12.64 |
| Entering password at computer (5–10 characters) | Qty | 14.8 | 16 | 31.75 | 16.92 |
| Finishing analysis | Qty | 35.1 | 17 | 28.12 | 14.47 |
| Saving file at different storage location | Qty | 27.2 | 13 | 28.84 | 17.39 |
| Waiting time due to a loading process of an electronic system | Qty | 31.7 | 27 | 65.54 | 25.97 |
| Entering text at computer (5 words) | Qty | 16.3 | 54 | 35.46 | 9.69 |
| Starting analysis (second/third) | Qty | 4.1 | 35 | 50.97 | 17.54 |
| Opening software on computer | Qty | 10.0 | 46 | 35.73 | 10.63 |
| Getting unnecessary tool out of the way | Qty | 7.3 | 51 | 32.36 | 9.11 |
| Closing window/file on computer | Qty | 5.0 | 41 | 30.25 | 9.56 |
| Turning off computer | Qty | 10.0 | 12 | 32.47 | 20.57 |
| Viewing measurement results | Qty | 29.0 | 1 | n/a | n/a |
| Starting analysis (first) | Qty | 12.2 | 18 | 16.26 | 8.09 |
| Estimating herbage mass ° | Qty | 50.0 | n/a | n/a | n/a |
| Determining herbage category ° | Qty | 166.7 | n/a | n/a | n/a |
| Determining the phenological stage ° | Qty | 500.0 | n/a | n/a | n/a |
CV, coefficient of variation; Qty, quantity; cmin, centiminutes; img, images; n, number; n/a, not applicable. * Within 1.5 m radius. ° Determined by an expert.
Table A4.
Sub-operations and corresponding work elements that can potentially be saved through technological development.
Table A4.
Sub-operations and corresponding work elements that can potentially be saved through technological development.
| Sub-Operation with Time Saving Potential | Work Element | Saved Time (MPmin) * |
|---|---|---|
| UAV: Walking | Walking without load | 0.68 |
| UAV: Setting up the sensor calibration and capturing metrics | Setting up calibration in app | 1.37 |
| Setting up camera software | 0.20 | |
| UAV: Flight planning | Flight planning on smart device | 4.14 |
| UAV: Installing and uninstalling of UAV and supplies | Installing UAV and supplies | 3.15 |
| Uninstalling UAV and supplies | 2.57 | |
| UAV: Image data backup | Turning on computer | 0.05 |
| Entering password at computer (5–10 characters) | 0.15 | |
| Waiting time due to the loading process of computer | 1.97 | |
| Connecting/disconnecting memory card with card reader to computer | 0.39 | |
| Opening file on computer | 0.15 | |
| Creating new file folder on computer | 0.08 | |
| Entering text at computer (1–5 words) | 0.30 | |
| Marking files in computer folder and giving command | 0.27 | |
| Pasting files to folder on computer | 0.07 | |
| Copying large amounts of data (images) | 16.96 | |
| Control view over copied data | 0.22 | |
| Deletion process of large amounts of data (images) | 0.38 | |
| Disconnecting USB card reader from computer | 0.15 | |
| Removing card reader with memory card from computer | 0.14 | |
| Saving files at different storage location | 0.27 | |
| Closing window/file on computer | 0.15 | |
| Email program logout | 0.18 | |
| Closing Internet Explorer | 0.07 | |
| Turning off computer | 0.10 | |
| Waiting time until computer is shut down | 0.21 | |
| NIRS: Documenting data | Labeling sample bag | 2.81 |
| Opening file on computer | 0.14 | |
| Entering data at computer | 1.96 | |
| NIRS: Data storage | Exporting analysis results | 1.33 |
| Closing window/file on computer | 0.10 | |
| Saving file at different storage location | 1.63 | |
| Marking files in computer folder and giving command | 0.55 | |
| Pasting files to folder on computer | 0.42 | |
| NIRS: Data visualization | Opening file on computer | 0.82 |
| Entering text at computer (1–5 words) | 0.82 |
* Under the conditions of the standardized farm.
References
- United Nations. Take Action for the Sustainable Development Goals. Available online: https://www.un.org/sustainabledevelopment/sustainable-development-goals/ (accessed on 24 January 2022).
- Meul, M.; Van Passel, S.; Fremaut, D.; Haesaert, G. Higher sustainability performance of intensive grazing versus zero-grazing dairy systems. Agron. Sustain. Dev. 2012, 32, 629–638. [Google Scholar] [CrossRef]
- Michaud, A.; Plantureux, S.; Pottier, E.; Baumont, R. Links between functional composition, biomass production and forage quality in permanent grasslands over a broad gradient of conditions. J. Agric. Sci. 2015, 153, 891–906. [Google Scholar] [CrossRef]
- Papadopoulou, A.; Ragkos, A.; Theodoridis, A.; Skordos, D.; Parissi, Z.; Abraham, E. Evaluation of the contribution of pastures on the economic sustainability of small ruminant farms in a typical Greek area. Agronomy 2021, 11, 63. [Google Scholar] [CrossRef]
- Romera, A.J.; Beukes, P.; Clark, C.; Clark, D.; Levy, H.; Tait, A. Use of a pasture growth model to estimate herbage mass at a paddock scale and assist management on dairy farms. Comput. Electron. Agric. 2010, 74, 66–72. [Google Scholar] [CrossRef]
- Leroy, G.; Hoffmann, I.; From, T.; Hiemstra, S.J.; Gandini, G. Perception of livestock ecosystem services in grazing areas. Animal 2018, 12, 2627–2638. [Google Scholar] [CrossRef]
- Le Clec’h, S.; Finger, R.; Buchmann, N.; Gosal, A.S.; Hörtnagl, L.; Huguenin-Elie, O.; Jeanneret, P.; Lüscher, A.; Schneider, M.K.; Huber, R. Assessment of spatial variability of multiple ecosystem services in grasslands of different intensities. J. Environ. Manag. 2019, 251, 109372. [Google Scholar] [CrossRef]
- van den Pol-van Dasselaar, A.; Hennessy, D.; Isselstein, J. Grazing of dairy cows in Europe—An in-depth analysis based on the perception of grassland experts. Sustainability 2020, 12, 1098. [Google Scholar] [CrossRef]
- Arnott, G.; Ferris, C.; O’Connell, N.E. Review: Welfare of dairy cows in continuously housed and pasture-based production systems. Animal 2017, 11, 261–273. [Google Scholar] [CrossRef]
- Lantinga, E.A.; Neuteboom, J.H.; Meijs, J.A.C. Chapter 2: Sward methods. In Herbage Intake Handbook, 2nd ed.; Penning, P.D., Ed.; British Grassland Society: Dunsten, UK, 2004; pp. 23–52. [Google Scholar]
- Murphy, D.J.; O’ Brien, B.; Hennessy, D.; Hurley, M.; Murphy, M.D. Evaluation of the precision of the rising plate meter for measuring compressed sward height on heterogeneous grassland swards. Precis. Agric. 2021, 22, 922–946. [Google Scholar] [CrossRef]
- Beukes, P.; McCarthy, S.; Wims, C.; Gregorini, P.; Romera, A. Regular estimates of herbage mass can improve profitability of pasture-based dairy systems. Anim. Prod. Sci. 2018, 59, 359–367. [Google Scholar] [CrossRef]
- Daccord, R.; Wyss, U.; Kessler, J.; Arrigo, Y.; Rouel, M.; Lehmann, J.; Jeangros, B.; Meisser, M. Nutritional value of roughage. In Feed Recommendations for Ruminants (Green Book); Agroscope: Posieux, Switzerland, 2017; pp. 1–14. [Google Scholar]
- Gillespie, J.M.; Wyatt, W.; Venuto, B.; Blouin, D.; Boucher, R. The roles of labor and profitability in choosing a grazing strategy for beef production in the U.S. Gulf Coast region. J. Agric. Appl. Econ. 2007, 40, 301–313. [Google Scholar] [CrossRef]
- Schick, M. Weidehaltung Milchvieh: Zeitbedarf, Arbeitsorganisation und Vergleich mit Eingrasverfahren; FAT: Ettenhausen, Switzerland, 2001; Volume 562. [Google Scholar]
- Deming, J.; Gleeson, D.; O’Dwyer, T.; Kinsella, J.; O’Brien, B. Measuring labor input on pasture-based dairy farms using a smartphone. J. Dairy Sci. 2018, 101, 9527–9543. [Google Scholar] [CrossRef] [PubMed]
- Scheurich, A.; Penicka, A.; Hörtenhuber, S.; Lindenthal, T.; Quendler, E.; Zollitsch, W. Elements of social sustainability among Austrian hay milk farmers: Between satisfaction and stress. Sustainability 2021, 13, 13010. [Google Scholar] [CrossRef]
- Næss, G.; Bøe, K.E. Labour input in small cubicle dairy barns with different layouts and mechanisation levels. Biosyst. Eng. 2011, 110, 83–89. [Google Scholar] [CrossRef]
- Perkiö-Mäkelä, M.; Hentilä, H. Physical work strain of dairy farming in loose housing barns. Int. J. Ind. Ergon. 2005, 35, 57–65. [Google Scholar] [CrossRef]
- Hansen, B.G.; Bugge, C.T.; Skibrek, P.K. Automatic milking systems and farmer wellbeing–Exploring the effects of automation and digitalization in dairy farming. J. Rural Stud. 2020, 80, 469–480. [Google Scholar] [CrossRef]
- Häberli, I.; Contzen, S.; Straub, U. Wie Milchproduzentinnen und Milchproduzenten ihre Lebensqualität verbessern. Agrar. Schweiz 2021, 12, 121–127. [Google Scholar] [CrossRef]
- Beecher, M.; Gorman, M.; Kelly, P.; Horan, B. Careers in dairy: Adolescents perceptions and attitudes. J. Agric. Educ. Ext. 2019, 25, 415–430. [Google Scholar] [CrossRef]
- Hostiou, N. Work Organisation in Dairy Farms: Work Durations, Changes of Practices and Precision Livestock Farming. In Proceedings of the International Agricultural Workforce Conference, Cork, Ireland, 10 July 2018. [Google Scholar]
- Holte, K.A.; Follo, G.; Kjestveit, K.; Stræte, E.P. Agriculture into the Future: New Technology, New Organisation and New Occupational Health and Safety Risks? In Advances in Intelligent Systems and Computing, Proceedings of the 20th Congress of the International Ergonomics Association, Florence, Italy, 26–30 August 2018; Bagnara, S., Tartaglia, R., Albolino, S., Alexander, T., Fujita, Y., Eds.; Springer: Cham, Switzerland, 2018; Volume 825, pp. 404–413. [Google Scholar] [CrossRef]
- Marinoudi, V.; Sørensen, C.G.; Pearson, S.; Bochtis, D. Robotics and labour in agriculture. A context consideration. Biosyst. Eng. 2019, 184, 111–121. [Google Scholar] [CrossRef]
- McSweeney, D.; Coughlan, N.E.; Cuthbert, R.N.; Halton, P.; Ivanov, S. Micro-sonic sensor technology enables enhanced grass height measurement by a Rising Plate Meter. Inf. Process. Agric. 2019, 6, 279–284. [Google Scholar] [CrossRef]
- Hart, L.; Huguenin-Elie, O.; Latsch, R.; Simmler, M.; Dubois, S.; Umstatter, C. Comparison of spectral reflectance-based smart farming tools and a conventional approach to determine herbage mass and grass quality on farm. Remote Sens. 2020, 12, 3256. [Google Scholar] [CrossRef]
- Rueda-Ayala, V.P.; Peña, J.M.; Höglind, M.; Bengochea-Guevara, J.M.; Andújar, D. Comparing UAV-based technologies and RGB-D reconstruction methods for plant height and biomass monitoring on grass ley. Sensors 2019, 19, 535. [Google Scholar] [CrossRef] [PubMed]
- Bareth, G.; Schellberg, J. Replacing manual rising plate meter measurements with low-cost UAV-derived sward height data in grasslands for spatial monitoring. PFG-J. Photogramm. Remote Sens. Geoinf. Sci. 2018, 86, 157–168. [Google Scholar] [CrossRef]
- Lussem, U.; Schellberg, J.; Bareth, G. Monitoring forage mass with low-cost UAV data: Case study at the Rengen grassland experiment. PFG-J. Photogramm. Remote Sens. Geoinf. Sci. 2020, 88, 407–422. [Google Scholar] [CrossRef]
- Sishodia, R.P.; Ray, R.L.; Singh, S.K. Applications of remote sensing in precision agriculture: A review. Remote Sens. 2020, 12, 3136. [Google Scholar] [CrossRef]
- van den Pol-van Dasselaar, A.; de Vliegher, A.; Hennessy, D.; Peyraud, J. Decision support tools for farmers–Guidelines and tools to get the most from grazing in Ireland. In Innovations in Grazing, Proceedings of the 2nd Meeting of the EGF Working Group Grazing, Lublin, Poland, 3 June 2012; Wageningen UR Livestock Research: Wageningen, The Netherlands, 2012; p. 6. [Google Scholar]
- Einhell, C. Vollweide vs. Eingrasen–Ein Vergleich aus Arbeitswirtschaftlicher Sicht–Schwachstellenanalyse und Optimierungsmöglichkeiten. Master’s Thesis, Universität Hohenheim, Stuttgart, Germany, 2017. [Google Scholar]
- REFA. Methodenlehre des Arbeitsstudiums. Teil 2 Datenermittlung; Carl Hanser Verlag: München, Germany, 1978; p. 447. [Google Scholar]
- Bechar, A.; Eben-Chaime, M. Hand-held computers to increase accuracy and productivity in agricultural work study. Int. J. Product. Perform. Manag. 2014, 63, 194–208. [Google Scholar] [CrossRef]
- Bures, M.; Pivodova, P. Comparison of time standardization methods on the basis of real experiment. Procedia Eng. 2015, 100, 466–474. [Google Scholar] [CrossRef]
- Irlbacher, L.; Höhendinger, M.; Macuhová, J.; Treiber, M.; Bernhardt, H. Arbeitswirtschaftliche Untersuchungen zum Einsatz von Tierortungssystemen auf Milchviehbetrieben. Agroscope Sci. 2020, 94, 49–58. [Google Scholar]
- Quendler, E.; Kaufmann, R.; Schick, M. Arbeitszeitbedarf von aktuellen Gruppenhaltungsverfahren des Wartebereichs in konventioneller Zuchtsauenhaltung in Österreich. Die Bodenkult. J. Land Manag. Food Environ. 2021, 72, 21–32. [Google Scholar] [CrossRef]
- Schick, M.; Stark, R. Arbeitswirtschaftliche Kennzahlen zur Raufutterernte: Zeitbedarf und Verfahrensleistungen für Grassilage- und Heuernte; FAT: Ettenhausen, Switzerland, 2002; Volume 588. [Google Scholar]
- Riemer, R.; Bechar, A. Investigation of productivity enhancement and biomechanical risks in greenhouse crops. Biosyst. Eng. 2016, 147, 39–50. [Google Scholar] [CrossRef]
- Schick, M. Dynamische Modellierung Landwirtschaftlicher Arbeit Unter Besonderer Berücksichtigung der Arbeitsplanung; Habilitation, Universität Hohenheim: Stuttgart, Germany, 2008. [Google Scholar]
- Herrmann, C.; Prochnow, A.; Heiermann, M. Influence of chopping length on capacities, labour time requirement and costs in the harvest and ensiling chain of maize. Biosyst. Eng. 2011, 110, 310–320. [Google Scholar] [CrossRef]
- Askari, M.S.; McCarthy, T.; Magee, A.; Murphy, D.J. Evaluation of grass quality under different soil management scenarios using remote sensing techniques. Remote Sens. 2019, 11, 1835. [Google Scholar] [CrossRef]
- Assmann, J.J.; Kerby, J.T.; Cunliffe, A.M.; Myers-Smith, I.H. Vegetation monitoring using multispectral sensors—Best practices and lessons learned from high latitudes. J. Unmanned Veh. Syst. 2018, 7, 54–75. [Google Scholar] [CrossRef]
- Nakagami, K. A method for approximate on-farm estimation of herbage mass by using two assessments per pasture. Grass Forage Sci. 2016, 71, 490–496. [Google Scholar] [CrossRef]
- Umstätter, C.; Mann, S.; Werner, J. A simple measure for workload as a social sustainability indicator for family farms. Environ. Sustain. Indic. 2022, 14, 100180. [Google Scholar] [CrossRef]
- Heitkämper, K.; Stark, R.; Schick, M. Development of an Online Application for Labour-Planning Data. In Proceedings of the Environmentally Friendly Agriculture and Forestry for Future Generations, International Scientific XXXVI CIOSTA & CIGR Section V Conference, St. Petersburg, Russia, 26−28 May 2015; pp. 849–856. [Google Scholar]
- Hart, L.; Quendler, E.; Umstaetter, C. On Field Work Operations of Two Smart Tools That Support Decision-Making in Grazing Management. In Proceedings of the Thinking the Future of Work in Agriculture, 2nd International Symposium on Work in Agriculture, Clermont-Ferrand, France, 29 March–1 April 2021. [Google Scholar]
- Fricke, W. Statistik in der Arbeitsorganisation, 1st ed.; Hanser: Darmstadt, Germany, 2004. [Google Scholar]
- Reith, S.; Frisch, J.; Winkler, B. Revision of the working time classification to optimize work processes in modern agriculture. Chem. Eng. Trans. 2017, 58, 121–126. [Google Scholar] [CrossRef]
- Teagasc. PastureBase Ireland: Grassland Management; Teagasc: Carlow, Ireland. Available online: https://www.teagasc.ie/crops/grassland/pasturebase-ireland/grassland-management/ (accessed on 2 December 2021).
- O’Sullivan, K. ‘Average’ Dairy Herd Climbs from 64 to 80 Cows in a Decade. Available online: https://www.agriland.ie/farming-news/average-dairy-herd-climbs-from-64-to-80-in-a-decade/ (accessed on 2 April 2022).
- Murphy, D.J.; O’Brien, B.; Murphy, M.D. Development of a Labour Utilisation Decision Support Tool to Efficiently Measure Grass Herbage Mass Using a Rising Plate Meter. In Proceedings of the 2018 ASABE Annual International Meeting, Detroit, MI, USA, 29 July–1 August 2018. [Google Scholar]
- Murphy, D.J.; O’ Brien, B.; Murphy, M.D. Development of a grass measurement optimisation tool to efficiently measure herbage mass on grazed pastures. Comput. Electron. Agric. 2020, 178, 105799. [Google Scholar] [CrossRef]
- Finger, R.; Swinton, S.M.; El Benni, N.; Walter, A. Precision farming at the nexus of agricultural production and the environment. Annu. Rev. Resour. Econ. 2019, 11, 313–335. [Google Scholar] [CrossRef]
- Walter, A.; Finger, R.; Huber, R.; Buchmann, N. Opinion: Smart farming is key to developing sustainable agriculture. Proc. Natl. Acad. Sci. USA 2017, 114, 6148–6150. [Google Scholar] [CrossRef]


Publisher’s Note: MDPI stays neutral with regard to jurisdictional claims in published maps and institutional affiliations. |
© 2022 by the authors. Licensee MDPI, Basel, Switzerland. This article is an open access article distributed under the terms and conditions of the Creative Commons Attribution (CC BY) license (https://creativecommons.org/licenses/by/4.0/).