1. Introduction
China’s 14th Five-Year Plan and the outline of the long-term goals for 2035 have highlighted the necessity of strengthening the water conservancy infrastructure, promoting the construction of high-quality water-saving irrigation projects, and comprehensively improving the optimization of water resource allocation. Canals, as important components of water conservancy infrastructure, help to improve the uneven distribution of regional water resources, increase the efficiency of water resource utilization, and address the problem of irrigation water for farmland. The canal lining is an important part of a canal, which usually comprises a permanent support structure made of stone, brick, cement slabs, and/or other materials. Its function is to prevent water seepage and collapse [
1,
2]. Canal linings are mainly divided into concrete linings and masonry linings, of which the most widely used are concrete linings. Concrete linings are an important part of canal engineering, which can effectively reduce leakage in the process of water transportation, improve the canal water utilization coefficient, maintain bank slope stability, and prevent scouring [
3]. The construction of a canal project is often faced with problems such as large water crossing sections, tight construction periods, large construction scales, and great impacts on topography and geomorphology. It is difficult to achieve standardized and procedural operations in the construction process, which involves high technical requirements and construction difficulties, as well as high construction quality demands.
The formation cycle of a canal lining can be mainly divided into the design period, the construction period, and the maintenance period. The construction period is the key stage, affecting the quality of the whole canal [
4]. Wang et al. [
5] studied the construction scheme and quality control of bagged concrete in the canal lining of a single irrigation area, providing specific measures in three aspects: quality control of the bagged concrete raw materials, production and construction inspection, and quality control of the bagged concrete production process. Wang et al. [
6] pointed out that the quality control of canal linings during winter construction processes is focused on the control of compaction, geomembrane control is focused on adjusting the welding temperature through testing to ensure the quality of the welds, and the quality control of concrete construction is focused on temperature control during the pouring and maintenance period. Commonly used comprehensive construction quality evaluation methods include the gray relational analysis method [
7,
8], the technique for order preference by similarity to an ideal solution (TOPSIS) [
9,
10], and the undetermined measure theory [
11]. Mo et al. [
12] used the COMSOL software to evaluate the effect of laying composite geomembranes at the bottom of the entire canal lining in terms of improving the frost swelling of the canal lining. The results showed that laying composite geomembranes at the bottom of the canal lining reduced the frost swelling of the foundation soil, to a certain extent, resulting in 14.3% and 15.5% reductions in the maximum normal displacement of the canal lining slope and the top of the canal, respectively. Kahlown et al. [
13] constructed conventional and low-cost test sections to evaluate the effectiveness of different lining types in reducing canal leakage losses, and the results showed that the low-cost lining had better economic benefits than the conventional lining. Cui et al. [
14] conducted a sensitivity evaluation analysis of the factors causing cracks in canal linings using the 3D contact nonlinear finite element method for concrete cracks in canal linings during the construction and operation periods. They suggested that canal linings should be cut as soon as possible, and the swelling of the foundation soil and the construction quality of the canal lining should be strictly controlled. Lund et al. [
15] evaluated the effectiveness of a polymer sealant, LAPAM (linear anionic polyacrylamide), in reducing earthen canal leakage. Thirty-seven flowing-water balance tests were conducted in the field, considering three different medium-sized canals. The evaluation results showed that LAPAM significantly reduced the seepage loss of the canal. Eltarabily et al. [
16] evaluated the impact of geotextile linings on slope instability at four different lining locations in the Ismailia Canal. The evaluation results showed that the canal slopes were still safe during and after construction. El-Molla et al. [
17] evaluated the effect of using compacted earth linings with different hydraulic conductivity, thickness, and orientation. Their results showed that the use of a compacted earth lining can provide an efficient method for reducing conveyance losses.
Through the literature review, we found that many achievements have been made in the research on concrete canal lining construction quality assessment. However, there are many uncertain factors affecting the construction quality of canal linings during the construction process; for example: Is the canal excavation appropriate? Are the canal axis placement, elevation control points, and canal center control lines correct? Do the laying and lap joint of the composite geomembrane meet the requirements? Is the canal earthwork compacted? Are the slope and canal bottom leveled? Is the geomembrane connection intact? What is the quality of concrete pouring? Does the thickness of the lining board plastering surface meet the requirements? Is the concrete vibration sufficiently dense? Are the cutting time and depth appropriate? Some factors will have an important impact on the overall quality of the canal lining; however, some factors are only generated as construction progresses, and will not have a negative impact on the overall construction quality of the canal lining. In the subsequent quality control, it is necessary to focus on identifying and determining the main factors and key construction links affecting the construction quality of the canal lining. At the same time, in order to improve the overall construction quality of the canal lining, it is necessary to conduct a systematic evaluation of the construction quality. By determining the overall construction quality of the canal lining, it is convenient to take a series of measures to control the construction quality in the later stages, consequently increasing the durability and service life of the project.
2. Methods
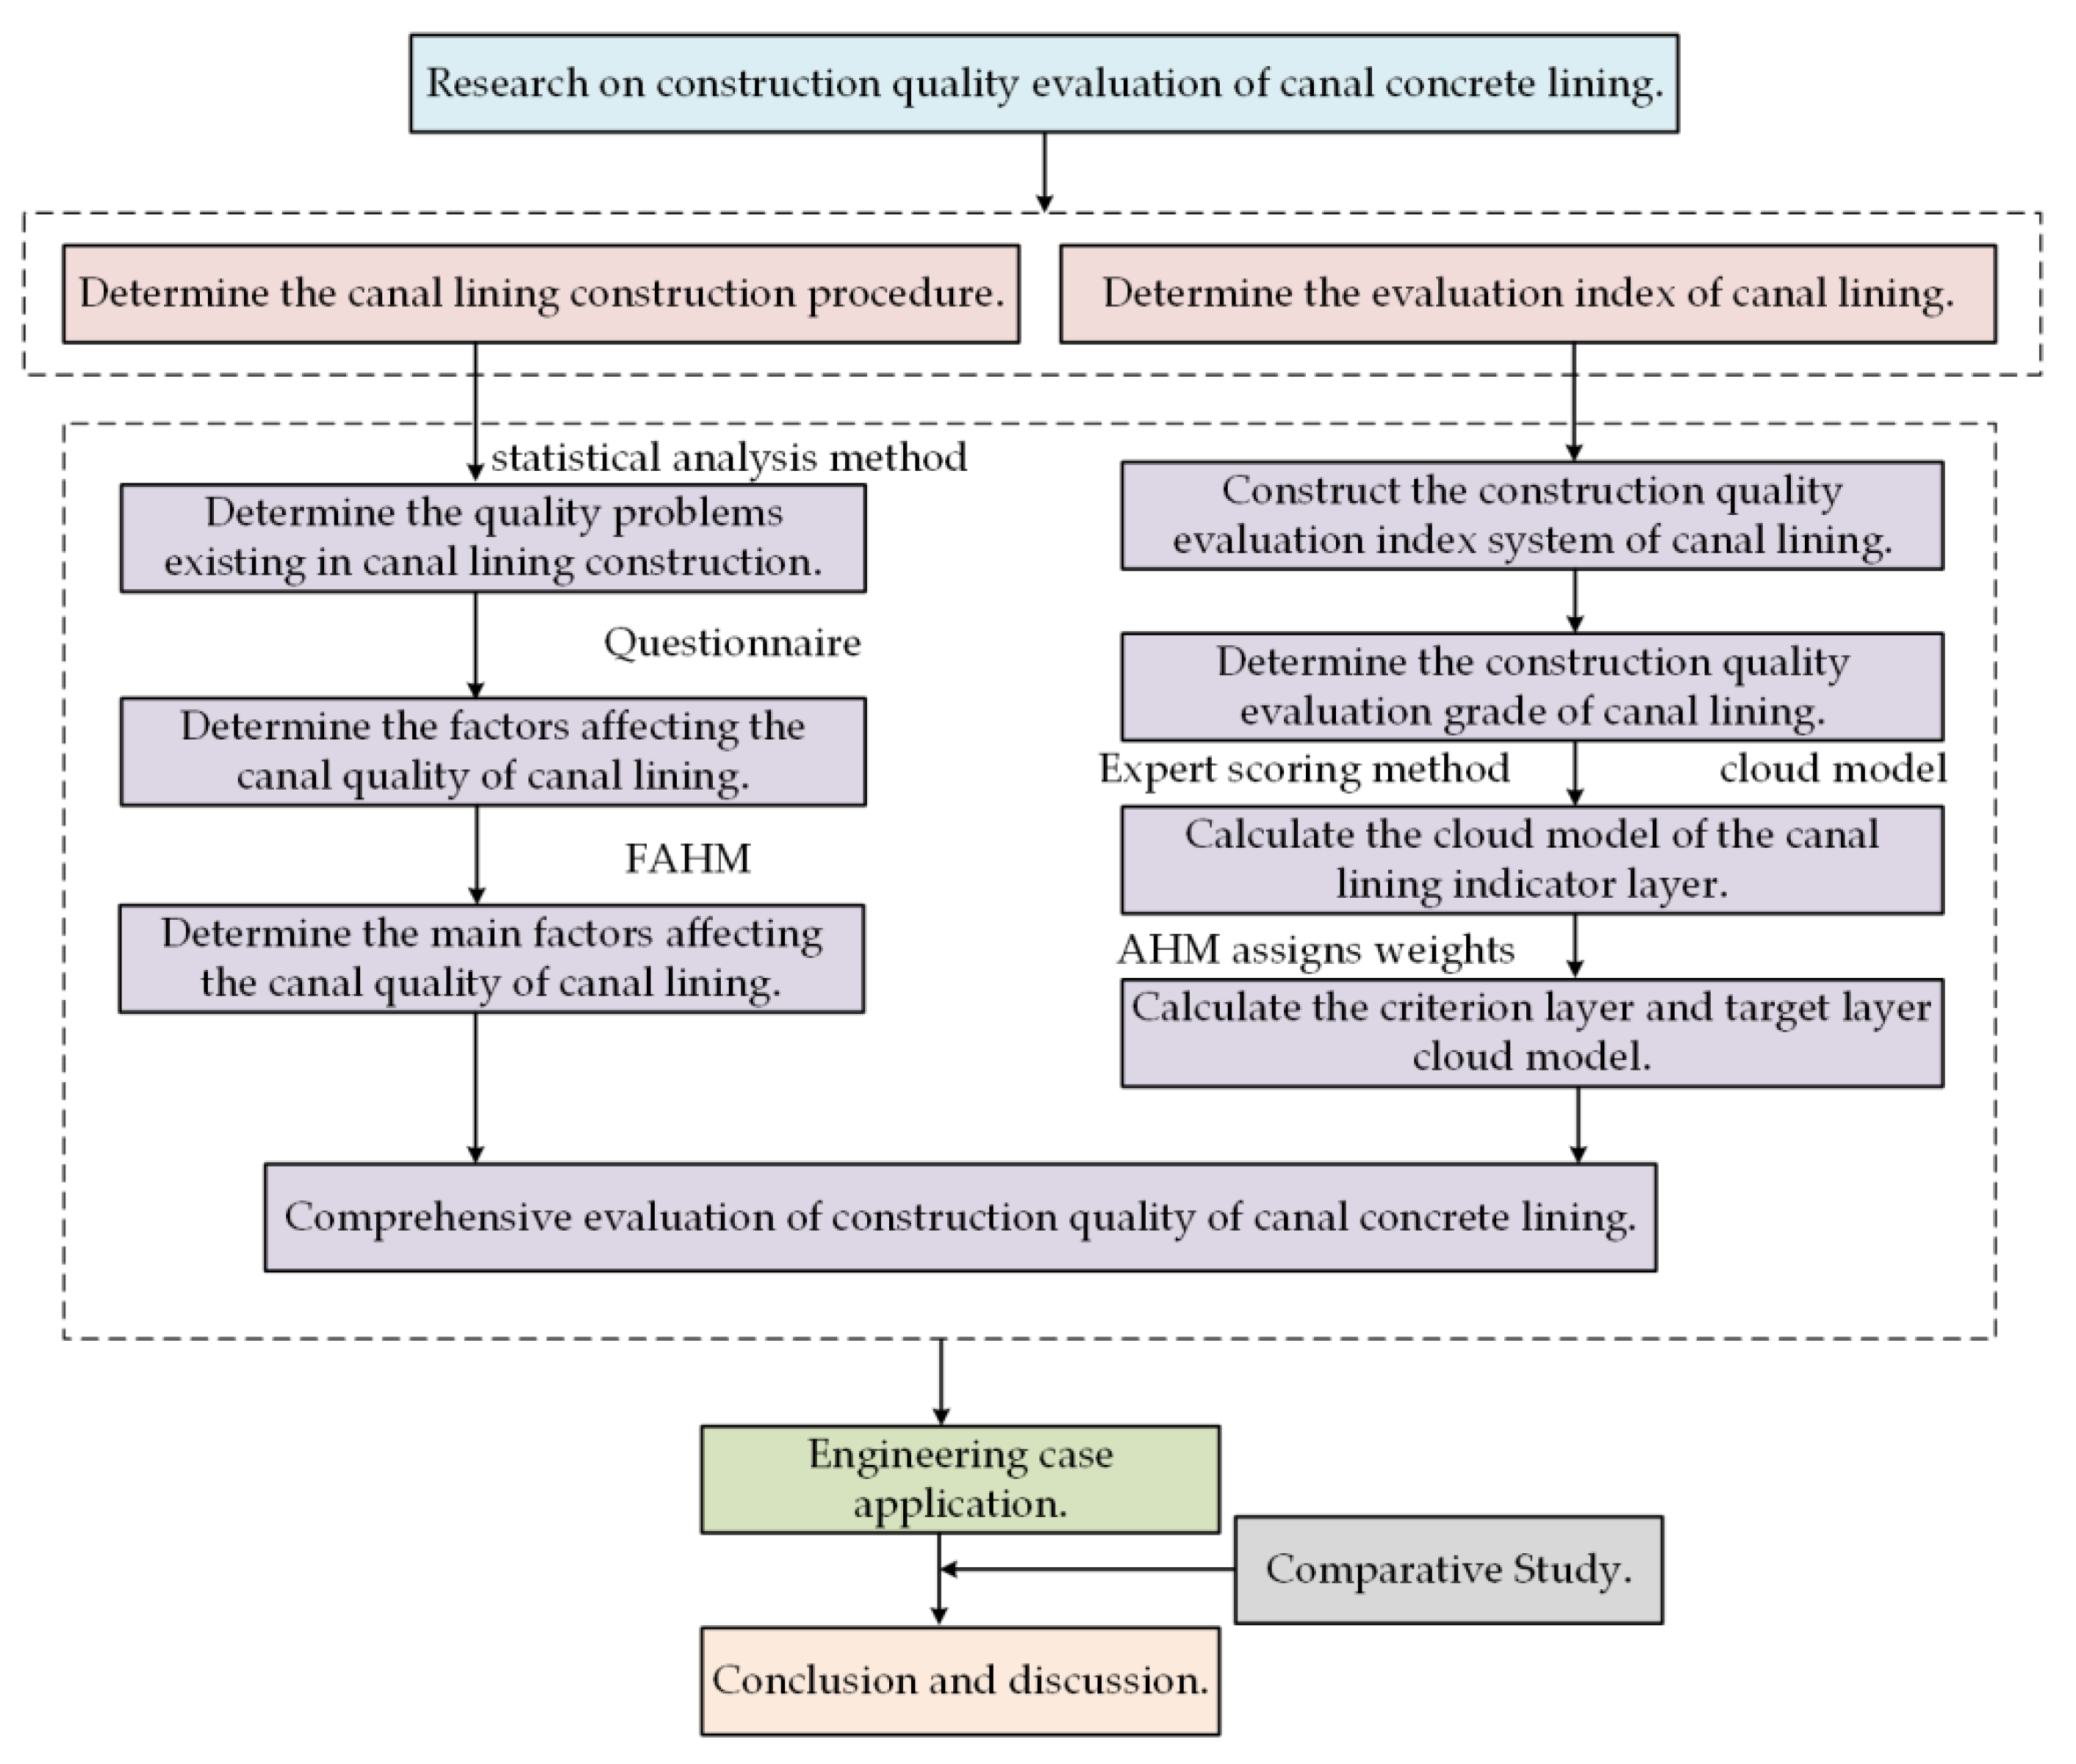
In this paper, we propose a method for evaluating the construction quality of canal concrete linings based on a statistical analysis method, the fuzzy attribute hierarchical model (FAHM), and the cloud model. The specific evaluation process of the method proposed in this paper is shown in
Figure 1.
2.1. Statistical Analysis Method
Statistical analysis methods [
18] are research methods that attempt to explore the internal links and potential development trends between things by carefully analyzing the quantitative relationships that exist and the characteristics of the research object itself, in order to obtain a reasonable explanation of it. For specific practical applications, the index scoring method and the chart evaluation method are commonly used to carry out statistical analyses. As far as canal lining quality is concerned, numerous diseases are the fundamental reasons for the qualitative change in its use function. Some of these diseases have obvious regularities in quantity and scope, and collecting a wide range of information and data can allow for the quantification of quality problems significantly affecting the quality of the canal.
2.2. Cloud Model
The cloud model is a mathematical model that converts uncertainty into certainty, can convert qualitative theoretical concepts into quantitative numerical analysis, and can reveal the intrinsic relevance of the randomness and ambiguity of the research object [
19,
20]. It was first proposed in 1995 by Li Deyi, an academic at the Chinese Academy of Engineering, and has been since used in the fields of water quality evaluation [
21] and risk assessment [
22]. The shapes used in the cloud model include rectangular clouds, trapezoidal clouds, and normal clouds. Among them, the normal cloud model has been widely used, due to its unique mathematical characteristics and applicability [
23].
The cloud model includes three digital features: expected value (
Ex), entropy (
En), and super-entropy (
He).
Ex represents the expected value of the cloud model, which is the most typical numerical feature of the concept for quantification.
En, as a metric, is used to comprehensively measure the ambiguity and probability of qualitative concepts, revealing the correlation between ambiguity and randomness which, on the one hand, directly reflects the range of elements in the number field space that can be accepted by the concept (i.e., the ambiguity) while, on the other hand, it also reflects the probability that the points in the number field can represent the concept (i.e., randomness).
He, the entropy of entropy, is related to the dispersion of the cloud droplets and indirectly reflects the thickness of the clouds. As
He increases, the more discrete the cloud droplets tend to be and, thus, thicker. There are three types of cloud generators: (i) forward cloud generators, which convert from qualitative to quantitative; (ii) backward cloud generators, which convert from quantitative to qualitative; and (iii) conditional cloud generators, which consist of separate conditional cloud generators
X and
Y. With
C (
Ex,
En,
He) and the specific conditions of
X and
Y, the degree of membership can be calculated. The evaluation process based on the cloud model is shown in
Figure 2.
2.2.1. Evaluated Indicators
Combined with the construction characteristics of the object to be evaluated and the actual construction situation, the indicators to be evaluated were determined through on-site investigation and a literature review.
2.2.2. Expert Evaluation
Experts were invited to evaluate each index, where the evaluation value ranged between [0, 1]: 0 indicates that the project is the least safe or has the worst quality, while 1 indicates that the project is the safest or has the best quality. Due to the different professional and technical levels of different experts, their professional titles and educational experiences also differed. The invited experts are detailed in
Table 1 below.
2.2.3. Quality Evaluation Grade
Through on-site research, literature review, expert consultation, and so on, the quality evaluation level was determined. We mainly consider the provisions of “Technical Specifications for Irrigation Canal Lining Engineering” (DB 64/T 811-2012) [
24], which divides the canal lining technical status into five grades, namely, good, basically good, minor damage, major damage, and severely damaged. In this paper, with reference to the specification, the canal lining construction quality evaluation grade was divided into five grades, as described in
Table 2.
2.2.4. Construction Quality Evaluation Standard Cloud
Assuming that the value range of the quality evaluation index is [0, 1], the interval is divided into n sub-intervals, where the ith interval is denoted by . The corresponding standard cloud is , where is the expectation of , is the entropy of , and is the super-entropy of . The calculation steps are as follows.
(i) According to the upper and lower limits of the interval, calculate the expectation,
, as [
25]:
where
and
represent the maximum and minimum values of the quality evaluation index in the
ith interval, respectively.
(ii) As the evaluation boundary value of each level in the quality assessment is the critical value of the transition between the two levels, the boundary value of the evaluation domain should belong to the two adjacent levels, namely,
(iii) Calculate
, where
is a constant value with value reflecting the randomness of the security evaluation target cloud evaluation standard. The larger the value of
, the greater the randomness of the evaluation standard and the more difficult it is to determine the evaluation standard. Therefore, its value should not be too large; here, it is taken as 0.005 [
26]. According to the five evaluation grades of construction quality, the quality grade interval [0, 1] was divided into five sub-intervals according to the principle of equal division, as follows: [0, 0.2] (grade V), [0.2, 0.4] (grade IV), [0.4, 0.6] (grade III), [0.6, 0.8] (grade II), and [0.8, 1] (grade I). From Equations (1) and (2), the evaluation standard clouds were calculated as follows: the grade V standard cloud,
CV, is (0,0.085,0.005); the grade IV standard cloud,
CIV, is (0.3,0.085,0.005); the grade III standard cloud,
CIII, is (0.5,0.085,0.005); the grade II standard cloud,
CII, is (0.7,0.085,0.005); and the grade I standard cloud,
CI, is (1,0.085,0.005). The evaluation standard cloud was generated using a forward cloud generator, and the result is shown in
Figure 3.
2.2.5. Computing the Evaluation Index Cloud Model
We first process the expert evaluation results
, where
is the serial number of the index factor
and
is the number corresponding to the index
to be evaluated. Then, we calculate the
th evaluation cloud model
, where
is the expectation of
,
is the entropy of
, and
is the super-entropy of
. The calculation steps [
27] are as follows.
(i) The expected value of
is calculated as:
where
is the average value of the expert scores for the first evaluation indicator,
is the average value of the expert scores for the
Mth evaluation indicator,
is the expected value of the first evaluation indicator, and
is the expected value of the
Mth evaluation indicator.
(ii) The entropy of
is calculated as:
where
is the score value of expert
for the first evaluation index,
is the score value of the
jth expert for the
Mth evaluation index,
is the entropy value of the first evaluation index, and
is the entropy value of the
Mth evaluation index.
(iii) The super-entropy of
is calculated as:
where
is the sample variance of the first evaluation index,
;
is the sample variance of the
Mth evaluation index;
is the super-entropy value of the first evaluation index; and
is the super-entropy value of the
Mth evaluation index.
2.2.6. Calculation of Criterion Layer and Target Layer Cloud Models
After calculating the indicator layer cloud model, the corresponding criterion layer cloud model and target layer cloud model are calculated, according to the numerical characteristics of the cloud model and the corresponding weights. The calculation process is as follows [
28]:
2.3. Fuzzy Attribute Hierarchical Model (FAHM)
The fuzzy attribute hierarchical model (FAHM) is a novel decision-making method that combines a fuzzy comprehensive evaluation method with an attribute hierarchical model. Among them, the fuzzy comprehensive evaluation method is based on fuzzy mathematics, taking into account the fuzziness and randomness of factors, while the attribute hierarchy model is a subjective assignment method based on the hierarchical analysis method by solving for relative attributes and, thus, improving it. Compared with the AHP, AHM does not require a consistency check or eigenvector calculation, and is a relatively simple and fast multi-attribute decision analysis method [
29,
30]. The calculation steps of FAHM are as follows:
(i) Determine the relevant factor indicators and establish a priority relationship judgment matrix.
If there are
related factors, determined through a questionnaire survey method or expert scoring method, the established factor set is
and the priority relationship judgment matrix is established as in Formula (7) [
31]:
where the value of
is based on the relative importance of the
ith factor
to the
jth factor
, with specific value as shown in Formula (8):
(ii) Build a fuzzy consistency matrix.
The fuzzy consistent judgment matrix,
R, is established based on the priority relationship judgment matrix, expressed as shown in Equation (9):
where
denotes the relative importance between elements
i and
j. When
, the smaller the value of
, the more important
is, compared to
; when
,
and
are equally important; finally, when
, the larger the value of
, the more important
is, compared to
. The specific value is quantified as
, where,
.
(iii) Determining the weights of the evaluation indicators.
For this, the AHM assignment is used. The calculation steps are as follows.
(1) Build a Hierarchical Hierarchy
When AHM is used for analysis, a multi-layered progressive hierarchy is first constructed, which is mainly divided into the target layer, criterion layer, and indicator layer. Then, the 1–9 scale method, proposed by the American operations researcher Professor T. L. Saaty, is used to determine the relative importance level between the factors (see
Table 3).
By comprehensively using the expert scoring method, the factors were compared in pairs to obtain the
n-order judgment matrix
, where
represents the relative importance between the
ith and
jth factors. The judgment matrix
possesses the following properties:
(2) Construct the attribute judgment matrix.
The
n-order matrix
consisting of the relative attributes
is called the attribute judgment matrix, where the relative attributes
and
have the transformation relationship in Equation (11):
where
is the attribute measure conversion parameter, which usually takes a value of 1 or 2; in this paper, we set
= 1.
(3) Calculate the relative attribute weight of the element index.
The calculation formula for the relative attribute weight of the element index is:
where
, with
n denoting the number of factor indicators.
(iv) Integrate the evaluation matrix with the weights.
The final result is given by .
3. Evaluation Process
The proposed evaluation process is carried out as follows:
(1) According to the construction characteristics and actual construction conditions, the canal concrete lining construction procedure is determined.
(2) Considering the construction procedure, based on the statistical analysis method, we determine the problems affecting the quality of canal lining construction; furthermore, based on the questionnaire survey, the factors affecting the construction quality of the canal lining are investigated in a cyclical manner, where the survey includes recording the actual situation on-site by the supervisor, the builder, or experts who have engaged in the construction of the canal, in order to establish a survey form of factors affecting the canal concrete lining construction quality.
(3) FAHM is used to identify the main factors affecting the construction quality of the canal; the evaluation indices were selected from the main factors affecting the construction quality of the canal lining, and the construction quality evaluation index system for the concrete lining structure of the canal is constructed. The construction quality evaluation level of the canal lining is determined. Based on cloud model theory, the forward cloud generator is used to generate the construction quality evaluation grade cloud model, while the evaluation index cloud model is determined based on the expert scoring method and the calculation of the digital characteristics of the cloud model, and the index cloud model and the index weight are calculated. The comprehensive evaluation cloud model is obtained by comprehensive calculation, which is then compared with the evaluation grade cloud model. The final evaluation grade is determined according to the maximum membership degree principle.
(4) According to the comprehensive evaluation of the canal lining construction quality, the problems and the main factors affecting the construction quality of the canal lining are determined. Based on the evaluation results, the canal lining construction quality level can be understood and the main construction procedures are identified, laying the foundation for further quality control.
4. Case Application
The second phase of the Zhao Kou Diversion Irrigation District in Henan Province, which started construction in December 2019, is a major water conservation and water supply project in China. The area of the Diversion Irrigation District is expected to reach 3913 square kilometers after the completion of the project, following which it will become the first irrigation district in Henan Province and the fourth largest in the country. The project includes 31 new canals with a total length of 373.98 km through Zhengzhou, Kaifeng, Zhoukou, Shangqiu, and other cities in Henan Province, which may alleviate the irrigation water shortages in local farmland. In this paper, we take the new canal lining in the section from pile number 29 + 73.1 to 32 + 254.6 as an example for analysis. The canal in this section is a trapezoidal section, with a width of 10.5 m at the bottom of the canal and 5 m at the top of the embankment on the right bank of the canal. The design water depth of the canal lining section is 2.2 m with a side slope of 1:2.5, and a horizontal expansion joint is set every 4 m along the water flow direction, with the width of the joint being 2 cm. The canal lining above the top of the design embankment is protected by C15 concrete framing and grassing, and the following is lined with C25 concrete in a full section. The frost resistance grade of the canal lining is set to F150, the seepage resistance grade is set to W6, the thickness of the concrete lining is 10 cm, and the depth of groundwater burial is about 1.77–5.3 m.
4.1. Determine the Canal Lining Construction Procedure
After field research on similar large diversion irrigation canal lining projects, a review of the existing literature on the construction procedure of canal lining projects, and consultation with water industry experts, it was determined that the main construction procedures for canal lining in large diversion irrigation areas mainly include measuring and laying out lines, canal soil engineering, canal renovation, geomembrane laying and welding, concrete pouring and curing, and canal concrete lining slab cutting and jointing.
4.2. Determining the Quality Problems Existing in Canal Lining Construction
As far as the quality of the canal lining is concerned, numerous diseases are the fundamental cause of qualitative changes in its use function. Some of these diseases have obvious regularities in quantity and scope, presenting clear patterns in the quantity and extent of the disease; thus, by using statistical analysis to collect a wide range of information and data, it is possible to quantify quality issues significantly affecting the quality of the canal. Through on-site research of a large irrigation district canal project in Shaanxi Province, China, the canal lining quality problems in the construction procedure were determined, specifically involving the following construction procedures: canal construction surveying and laying out, canal foundation soil excavation, canal foundation soil back-filling, slope and canal bottom renovation, composite geomembrane laying and welding, concrete lining pouring and curing, and canal concrete lining slab cutting and jointing. These construction procedures are highly representative and significantly reflect the distribution of canal lining quality problems throughout the construction period. The quality problems existing within Sections 1–7 of this irrigation district were counted, and the results are given in
Table 4.
The fish-bone diagram method was used to summarize the specific causes affecting the construction quality problem of the canal lining. The results are shown in
Figure 4.
After statistical analysis, the quality problems in each procedure were found to be due to inaccurate sampling of the control points, the height of the canal soil not meeting the design requirements, the bottom of the canal and the slope surface not being tidy, inadequate soil compaction, the slope surface not being flat, the composite geomembrane material not being qualified, the composite geomembrane laying not meeting the design requirements, the surface of the concrete slab being desiccated or pockmarked, the concrete slab skin bulging and peeling, the surface of the concrete slab being rough and sandy, cracks appearing in the concrete slab, and so on. Determination of the above quality issues was based on on-site research, combined with the quality issues raised by construction units, supervision units, quality inspection units, engineering consultancy units, and management units. The number of quality issues raised by each unit is shown in
Figure 5.
It can be seen from
Figure 5 that the supervision unit raised the most problems. As an important unit of quality supervision of the project, the supervision unit found the most problems in the actual construction supervision and management, accounting for 33% of the total number of problems, and played an important role in ensuring that the quality of the whole canal construction reached an excellent level. The construction unit and quality inspection units reported the most problems after the supervision unit, accounting for 26.1% and 20.6%, respectively. It is also easier to find problems in the actual construction and inspection procedure, making these important units for ensuring the quality of the canal lining. Engineering consulting units raised some quality issues in the project design and construction evaluation procedure, accounting for 13.9% of the total number of issues. Canal lining projects are important livelihood projects, being directly related to crop harvests and the income of farmers. The irrigation district construction authority, or the management department, plays the role of overall control and quality assurance in the whole canal construction process, although they found less problems, accounting for only 6.4% of the total. Each of these problems is straight to the point, and still plays an important role in improving the canal lining quality.
Based on modern management theory, after statistical analysis of the factors causing the canal lining quality problems, the respective weights of the five factors (i.e., human, mechanical, material, method, and environment) were determined, and the results are shown in
Figure 6.
As can be seen from
Figure 6, among the causes of the problems arising from the quality of canal lining, the quality problems caused by human factors were the most prominent, accounting for 40.56%; followed by materials, mechanical equipment, and methods, accounting for 24.61%, 19.47%, and 9.79%, respectively; finally, the quality problems caused by environmental factors were the least, accounting for only 5.57%.
4.3. Establishment of a Survey Table of Factors Affecting the Quality of Canal Lining Construction
Based on the quality problems in the construction of similar large diversion irrigation canal lining projects, in order to improve the construction quality of this project, the relevant factors causing these construction quality problems were analyzed, in order to prevent subsequent canal lining construction quality degradation. Many factors affect the quality of the canal lining in different construction procedure stages. Some quality factors are dynamically generated during the construction procedure. For example, concrete cracking can be caused by thermal strain due to the reaction associated with the heat of hydration during the concrete pouring procedure, there may also be cutting and inlay joints caused by inappropriate cutting time and depth in the stage of cracking, and so on.
In order to scientifically and reasonably identify the factors that may affect the construction quality of the canal lining in different construction stages, the factors affecting the construction quality of the canal lining in the building section were investigated in a cyclical manner. The investigation included recording the actual situation on-site and issuing questionnaires on factors affecting the canal lining construction quality to supervisors, constructors, or experts engaged in canal construction. The established quality factor questionnaire is provided in
Table 5.
As shown in
Table 5, the “construction procedure” in the questionnaire mainly includes canal construction surveying and laying out, canal soil engineering, canal renovation, geomembrane laying and welding, concrete pouring and curing, and canal concrete lining slab cutting and jointing. “Quality problem” counts the problems that may exist in each process during the construction process, such as those caused by inaccurate construction line placement, aging of lifting equipment, weather factors, and so on. In terms of these quality problems, it can be seen from the above that they are mainly caused by human, mechanical, material, method, and environmental factors. Classification can better indicate the factors that lead to canal lining quality problems. For example, the quality problem of inaccurate construction line placement may be due to manual staking errors (human factor), inaccuracy due to aging equipment (mechanical factor), or strong wind or rainfall affecting the position of staking points (weather factor). The quality control measures are aimed at diseases or influencing factors, and provide relevant solutions or measures, according to the respective fields of the respondents.
According to the canal lining construction process, the respondents gave the factors affecting the canal lining construction quality in each process. For example, in geomembrane laying and welding, problems may arise due to damage to the geomembrane, the unqualified material of the geomembrane, geomembrane laying not meeting the requirements, and defective geomembrane connection. Damage to the geomembrane may be due to unskilled operators, problems with the material itself, or damage caused by sudden rainfall. Statistics were calculated according to the quality factors in each process, determined according to the answers provided by the respondents, and summarized according to the type of factor (i.e., human, mechanical, material, method, and environmental). The factors affecting the canal lining construction quality were obtained by sorting the survey contents, as shown in
Table 6.
4.4. Using FAHM to Identify Main Factors Affecting Construction Quality of Canal
(i) Determine relevant factor indicators and establish a priority relationship judgment matrix.
As can be seen from
Table 6, we determined 27 factors affecting the quality of canal lining construction. The set of established factors is denoted by
. Through the expert scoring method, the relative importance between each procedure and influencing factor was scored. The composition of the expert group was five people from the construction supervision side, four people from the construction unit side, two people from the design unit side, two people from the material inspection side, and two industry experts and scholars.
Considering the construction procedure, a priority relationship matrix and fuzzy consensus matrix were established, according to the scoring results. The results are shown in
Appendix A. For the quality factors
Kij (
j = 1, 2, …,
n) corresponding to the
ith construction procedure,
Ki, the priority relationship judgment matrix, and the fuzzy consistency matrix are shown in
Appendix B.
(ii) Determine the weights of evaluation indicators.
Based on the 1–9 scale, the relative importance degree between each factor indicator was determined by comprehensive use of the expert scoring method. The procedures or factors were compared, and then the judgment matrix and attribute judgment matrix of the criterion layer to the target layer and the indicator layer to the criterion layer were obtained using Equations (10) and (11), respectively; the results are shown in
Appendix C. Similarly, by analogy with the methods in
Appendix C, the judgment matrix and attribute judgment matrix of other indicators were obtained, which are not listed here. According to Equation (12), the relative attribute weights of the criterion layer to the target layer and the index layer to each factor index of the criterion layer were obtained, respectively, and the results are shown in
Appendix D.
The fuzzy consensus matrix, R, was integrated with the weights, and the final results are shown in
Appendix E. As can be seen from
Appendix E, the main factors affecting the construction quality of the canal lining were the depth of the cutting the concrete lining slab, the time of cutting the concrete lining slab, the loss of soil from the slope and the bottom of the canal, and the poor filling of the joints. This is mainly because the canal concrete lining slab is a thin plate structure, and cutting joints too deep will damage the bottom geomembrane. Then, a large water distribution in the bottom of the lining slab will not only cause seepage damage but, in winter, will also cause frost damage, leading to a variety of lining slab diseases. A large number of engineering cases have shown that the timing of concrete lining slab cutting is crucial for the prevention of lining slab cracks [
32] and, if the cutting time is not appropriate, the whole slab is not released at a specific period, making it prone to cracks. The importance of the soil serving as the foundation of the canal cannot be overstated, as excessive soil loss can lead to collapse of the canal liner slab. When the caulking is not sufficiently dense, more aggressive media can enter the liner slab, causing issues such as common concrete sulphate damage.
4.5. Evaluation of Construction Quality of a Canal Lining
The quality of the canal lining can be affected by complex environments, construction conditions, human factors, and other influences, and evaluation of the canal lining construction quality can help to ensure actual sustainable use of the canal lining. In addition, the main factors affecting the canal lining construction quality are various. Due to the technical difficulties, cost, and other objective factors, there may not be a variety of resources to control at each link; therefore, the reasonable allocation of resources should be based on the relative importance of different parts of the canal lining construction process, and the impact of key procedures in the canal lining construction should be determined accordingly. On the basis of
Appendix E, the overall construction procedures of the canal lining were sorted and the evaluation index system was constructed, as depicted in
Figure 7.
The meanings represented by the letter numbers of the factors in
Figure 7 are given below.
u1—canal construction surveying and laying out; u2—canal soil engineering; u3—canal renovation; u4—geomembrane laying and welding; u5—concrete pouring and curing; u6—canal concrete lining slab cutting and jointing; u11—canal axis measurement and layout; u12—canal elevation control point layout; u13—canal center control line measurement and layout; u21—canal foundation soil excavation; u22—canal soil compaction; u23—canal foundation soil backfill; u31—repair canal lining slope; u32—leveling the bottom of the canal lining; u41—composite geomembrane laying; u42—composite geomembrane connections; u51—concrete mixing and transport; u52—concrete pouring; u53—setting up templates and reinforcement; u54—curing of concrete lining slabs for canal; u55—concrete paving and compaction and pounding; u61—concrete slab cutting; u62—concrete slab joint filling.
Using AHM weighting based on the 1–9 scale, the relative importance degree between the indicators or procedures was determined through the expert scoring method, following which the judgment matrix and attribute judgment matrix of the criterion layer to the target layer and the indicator layer to the criterion layer were obtained using Equations (10) and (11), respectively; the results are shown in
Appendix F. Similarly, by analogy with the methods in
Appendix F, the judgment matrix and attribute judgment matrix of other indicators were obtained, which are not listed here. According to Formula (12), the relative attribute weights of the criterion layer to the target layer and the index layer to each factor index of the criterion layer were obtained, and the results are shown in
Appendix G.
We take the index layer factor canal axis measurement and layout (u
11) as an example to illustrate the calculation process of the indicator layer cloud model. Ten experts were invited to score the relative importance of each process and influencing factor (the scoring range was 0 to 1; the higher the score, the better the construction quality level of a certain index). The composition of the expert group was three people from the construction supervision side, two people from the construction unit side, one person from the design unit side, two people from the material inspection side, and two industry experts and scholars. The evaluation result of the 10 experts with respect to the construction quality effect of canal axis measurement and layout (u
11) was
. Substituting
into Equations (3)–(5), it was calculated that
,
, and
, such that the cloud model
of the index layer factor
was
. In the same way, the cloud models of other factors in the index layer were calculated, the results of which are shown in
Table 7. The cloud model was drawn using MATLAB software, and the results are shown in
Figure 8.
Through cloud model theory, the cloud model of each evaluation index was compared with the standard cloud model, and the grade of the index to be evaluated was determined according to the principle of maximum subordination. As can be seen from
Figure 8, by evaluating the on-site construction quality corresponding to each evaluation index, we found that the construction quality of each construction process of the canal lining is basically at grade II (i.e., the overall construction quality level of the canal lining is good and the problem areas can be controlled). At the same time, we found that the indicators u
11 (canal axis measurement and layout), u
13 (canal center control line measurement and layout), u
31 (repair canal lining slope), u
32 (leveling the bottom of the canal lining), u
61 (concrete slab cutting), and u
62 (concrete slab joint filling), which are key construction processes, tended to change towards evaluation grade III. In order to prevent these processes from affecting the construction quality of the canal lining, attention should be paid to prevention and control of these aspects during later construction.
According to the cloud model numerical characteristics and the corresponding weights, we calculated the corresponding criterion layer cloud model and target layer cloud model, using Equation (6); the results are shown in
Table 8. We used MATLAB software to plot the criterion layer model and target layer model cloud maps; the results are shown in
Figure 9 and
Figure 10.
As can be seen from
Figure 9, the evaluation results for the construction quality of each of the main processes (i.e., u
1, u
2, u
3, u
4, u
5, and u
6) were all at grade II. This indicates that the quality of the main construction processes of the canal lining was overall good. As can be seen from
Figure 10, the evaluation results indicated that the overall construction quality of the canal lining was at grade II. The considered irrigation area improvement project, one of the 172 major water conservancy projects of the State Council of China, will be the first irrigation areas in Henan Province and the fourth largest in the country after completion; as such, it cannot be expected that the construction quality of the canal lining will be exactly at grade I, due to the influence of the environment, human factors, construction materials, machinery, and so on, which is in line with the derived results.
5. Comparative Study
In order to verify the feasibility of the evaluation method proposed in this paper, the calculation results were compared with those of the AHP–simple correlation function–cloud model method [
33], where AHP was the subjective weighting method, the simple correlation function was used for objective weighting, and the cloud model was the evaluation method. The core idea is to comprehensively use the subjective and objective weight values, combining the weight values with the numerical characteristics of the cloud model to complete the evaluation. As the simple correlation function method is an objective weighting method, in the weighting process, it is necessary to obtain the actual detection data of each evaluation index of the object to be evaluated to achieve weighting, which is unrealistic for determining canal lining construction quality evaluation indices, as most of the data are undetectable; for example, the degree of aging of equipment (e.g., total stations, theodolites) and the impact of severe weather are difficult to quantify, and most factors must be qualitatively described. This is the primary limitation of the method.
In this paper, AHP is used to determine the subjective weights in the calculation process, and the cloud model is still used to complete the evaluation. The cloud model has been introduced in the previous section, so it is not detailed here. We mainly introduce the AHP in the following.
The main steps of the AHP include constructing a hierarchical structure model, building a judgment matrix and weight distribution, consistency checking, and determining a total hierarchical ranking. Similar to the AHM method used in this paper, AHP can be used to determine the weights of evaluation indices through the expert scoring method—that is, comparing factors pairwise and quantifying them according to the 1–9 scale method, in order to determine the relative importance between the two. The difference is that the AHP needs to be checked for consistency. The consistency test usually uses the consistency ratio
CR as the test standard, which is defined as
CR =
CI/
RI, where
CI is the consistency index, calculated as
. Furthermore,
RI is the average random consistency index, which is related to the order
n of the judgment matrix, which can be determined using
Table 9.
Generally, when CR < 0.1, the consistency of the calculation results is considered acceptable; when CR ≥ 0.1, the consistency test fails, and the judgment matrix should be reconstructed for calculation, and the calculation results cannot be accepted until CR < 0.1.
5.1. Determining the Weight of Each Evaluation Index
As far as this case is concerned, the hierarchical structure model constructed by AHP also includes the target layer, the criterion layer, and the indicator layer, which is the same as in
Figure 7. In the process of constructing the judgment matrix, the 15 experts mentioned above were invited to score the evaluation indicators, and subjective weights were assigned according to the scoring results of the experts. After calculating the statistics of the expert scoring results, the square root method [
33] was used to obtain the weight of each factor. Finally, the judgment matrix of the index layer, relative to the criterion layer, was obtained, as shown in
Appendix H. Each judgment matrix was tested for consistency. The evaluation indicators were then sorted, according to their weight values.
5.2. Determining the Canal Lining Construction Quality Grade
In the comparative study, the evaluation grade was again divided into five levels. When using the cloud model evaluation, 10 experts were invited to score the relative importance of each process and influencing factor. We substituted the evaluation value of each index into Equations (3)–(5) for calculation, and then calculated the evaluation value and weight value of each index according to Equation (6). The results are shown in
Table 10 (the selected evaluation indicators were the same as those described in
Section 4.5), and the final target layer evaluation index cloud diagram is shown in
Figure 11.
It can be seen from
Figure 10 and
Figure 11 that the evaluation results of the two were consistent; that is, they both indicated that the construction quality of the canal lining in the irrigation area as being grade II. The overall quality of canal lining construction was determined to be in good condition. Comparing the two methods, the second limitation of the method used in the comparative study was that it needs to carry out a consistency test, and the associated weight calculation is complicated. The third limitation is that it is not considered to be comprehensive enough, and the evaluation process is not sufficiently systematic. We collected a wide range of information and data through statistical analysis, which allowed us to quantitatively analyze which quality problems may significantly affect the quality of the canal. The FAHM was adopted to identify the main factors affecting the quality of canal lining construction, and laid a foundation for canal lining construction quality control. In general, the method proposed in this paper considers construction quality assessment and canal lining quality assurance more comprehensively and reasonably.
6. Discussion
As far as the evaluation method proposed in this paper is concerned, it also presents certain limitations.
(i) As the weighting method used in this paper is the AHM, which is a subjective weighting method, it is necessary to rely on experts to judge the relative importance of different indicators. Therefore, the industry background and professional level should be taken into consideration when selecting experts, and the scores should be calculated more objectively. For example, when calculating the scores, the maximum and minimum values should be removed and the weighted average of all the scores should be taken, in order to make the assignment more reasonable.
(ii) This paper only systematically summarizes the quality problems that commonly occur in the canal lining construction process and the factors that affect the construction quality, and we only evaluate the overall construction quality of the canal lining. Thus, how to improve the construction quality of the canal lining and the quality control measures that can be taken were not discussed in detail. Further research should more comprehensively consider those factors affecting the quality of canal lining construction, the associated problems, and the key procedures required for the development of quality control methods or technical solutions.
7. Conclusions
(1) A statistical analysis method was used to quantify the problems affecting the canal lining construction quality, including the inaccurate sample placement of each control point, the insufficient compaction of soil, and de-sizing on the surface of concrete slab, among other factors. A questionnaire survey was used to determine the factors affecting the canal lining construction quality. After analysis and summarization, we found that the causes of these factors were human, mechanical, material, method, and environmental. At the same time, a statistical analysis was carried out on the units that raised quality problems, and we found that the supervision unit reported the most problems in the actual construction supervision, followed by the construction unit and the quality inspection unit. The function of these methods is to assist engineers in summarizing and sorting the problems affecting the canal lining construction quality, which can then be targeted and prevented during the specific construction period, thus reducing the occurrence of diseases, to a certain extent. It can also help researchers study the apparent regularities in the number or range of various other objects.
(2) Based on the FAHM method, we determined that the main factors affecting the construction quality of the canal concrete lining are the depth of the cutting slab, the timing of the slab cut joints, the loss of soil from the side slopes and the bottom of the canal, and the poor filling of the joint, among other factors. These factors should be focused on in the subsequent construction and management process, and corresponding technical measures can be taken to improve them, if necessary. The function of the above method is to assist engineers in determining the main factors affecting the canal lining construction quality, and to better concentrate capital, labor, and material resources to prevent and control these main factors. As the FAHM is a new decision-making method, it can fully take into account the rich experience of experts, and does not require a consistency check or eigenvector calculation; furthermore, the calculation amount is relatively small, making it easier to use.
(3) Based on cloud model theory, the construction quality evaluation grade of a specific canal lining was obtained as grade II (quantitative), which was consistent with the evaluation results of the AHP–cloud model, and was in line with the actual construction quality status (qualitative). The feasibility of the proposed method in this paper is demonstrated from both qualitative and quantitative perspectives, as it can effectively take into account the fuzziness and randomness of evaluation indices. At the same time, the canal axis measurement and layout, as well as the canal center control line measurement and layout, were identified as key construction procedures that should be paid attention to in the later stage. The function of this model is to assist engineers in determining the key links affecting the canal lining construction process. As the cloud model can reveal the randomness and ambiguity of different factors, the overall evaluation process is more systematic, and it can be used by other scholars to carry out related evaluation research.


