Article

Driving Factors of Microbial Community Abundance and Structure in Typical Forest Soils of Sanjiang Plain, Northeast China

1
School of Chemical and Environmental Engineering, Liaoning University of Technology, Jinzhou 121001, China
2
College of Resources and Environment, University of Chinese Academy of Sciences, Beijing 101408, China
3
Department of Civil and Environmental Engineering, The University of Toledo, Toledo, OH 43606, USA
*
Author to whom correspondence should be addressed.
Sustainability 2022, 14(13), 8040; https://doi.org/10.3390/su14138040
Submission received: 5 June 2022 / Revised: 26 June 2022 / Accepted: 29 June 2022 / Published: 30 June 2022
(This article belongs to the Section Sustainable Forestry)

Abstract

:
Until recently, a comprehensive evaluation of the environmental drivers on the abundance and structure of the microbial community in typical forest soils has not been thoroughly conducted. In this study, the typical forest soils (Mongolian oak (Quercus mongolica) soil, MOS; white birch (Betula platyphylla) soil, WBS; and white poplar (Populus davidiana) soil, WPS) in the Sanjiang Plain were selected to ascertain the differences and the major environmental factors driving soil microbial community abundance and structure. Results indicated that differences existed in the abundance and structure of the bacterial, archaeal, and fungal community. Co-occurrence network analysis showed that the bacterial and fungal networks were more complex than those of archaeal networks. Unclassified Acidobacteria and unclassified Pyrinomonadaceae were the keystone taxa in the bacterial networks, while Pleotrichocladium and Leotia were the keystone taxa in the fungal networks. Among all environmental factors, pH, SOM, and total N exhibited dominant roles in affecting the abundance of bacteria, archaea, and fungi. The redundancy analysis (RDA) showed that pH was the vital environmental factor responsible for driving the structure of the bacterial, archaeal, and fungal community.

1. Introduction

Soil microorganisms belong to the ecosystem’s important parts. They participate in the energy flow and nutrient cycling, etc. [1,2]. Soil microorganisms have relations with soil formation and development, fertility evolution, nutrient element transformation, etc. [3,4,5]. In the forest ecosystem, the microbial distribution and activities not only reflect the effects of various factors on the ecological distribution, biochemical characteristics, and functions of the microorganisms but also reflect the growth and development of plants soil fertility, etc. Different types of forest are relevant to the community structure of bacteria in soils [6,7]. Meanwhile, the composition and diversity of soil microbial community depend on the vegetation types that have different plant litter and root exudates [8]. However, controversial results, such as the above-ground vegetation having almost no effect on the bacterial community, were reported [9,10]. Therefore, in-depth research is needed to discuss the differences in the microbial community from different types of forest soils.
Much research has been carried out in evaluating the influence of environmental factors (pH and organic matter, etc.) on microbial communities. For example, Cui et al. [11] reported that total phosphorus content could affect the bacterial community, while NO3-N content governed the fungal community. Wang et al. [12] found that pH instead of nutrients performed significant roles in shaping the bacterial community in agricultural soils. In wetland soils, pH and conductivity were considered to be the most critical environmental factors that could affect bacterial community structure [13]. Although most of the previous studies have discussed the description of impacts of environmental factors on the abundance and structure of microbial community, it is still a challenge to investigate the drivers in terrestrial ecosystems, such as in forest ecosystems [8,14,15,16]. Meanwhile, it is vital to ascertain the environmental factors driving the community structure of forest soil microbes for predicting ecosystem responses to environmental changes [1,17,18]. However, a comprehensive and detailed survey into the environmental drivers on microbial community abundance and structure in the typical forest soils has not been conducted.
The Sanjiang National Nature Reserve (SNNR) is part of the Sanjiang Plain, which belongs to the alluvial plain and has a total area of 108,829 km2 [19,20]. This area contains the largest freshwater wetland area in China. It is considered to be a biodiversity hotspot because of its high forest coverage, which has natural forests, including coniferous forests and deciduous broad-leaf forests, etc. [19,21]. Previous studies mainly concentrated on the discussion of microorganisms in the wetland soil and cultivated soil of Sanjiang Plain [22,23,24,25,26]. However, the key factors driving the community abundance and structure in the typical forest soils in Sanjiang Plain have not yet been well documented. Thus, we aimed to (1) discuss the differences among the bacterial, archaeal, and fungal community in the typical forest soils, (2) investigate the associations between the microbial community abundance and soil physicochemical characteristics, and (3) elucidate the vital environmental factors governing the structure of the microbial community.

2. Materials and Methods

2.1. Soil Collection and Physicochemical Characterization

The study area belongs to SNNR, which is located in the Heilongjiang Province in northeastern China (133°43′20″–134°46′40″ E, 47°26′00″–48°22′50″ N). SNNR is situated at the border of Fuyuan City and Tongjiang City [27]. The Chinese government defined it as a National Nature Reserve in 2000. The total acreage of SNNR is 1980 km2 [27]. In October, the mean daily minimum and maximum temperatures are 1 °C and 10 °C, respectively. The mean annual precipitation in the study area is about 560 mm [23].
Broad-leaf forests such as Mongolian oak (Quercus mongolica), white birch (Betula platyphylla), and white poplar (Populus davidiana) are known as the typical forests in the SNNR [28]. These forests have been planted for at least 10 years. The latitude and longitude range of the study area are 134°12′ E to 134°14′ E and 48°09′ N to 48°11′ N. No additional fertilizers and no weed control have been applied in this area. The distance between each sample is set approximately 500 m. In each sampling site, surface soil samples in triplicate below the plant litter layer were taken with a core sampler device in October 2019. The triplicate samples were composited together as a mixed sample (Mongolian oak soil, MOS; white birch soil, WBS, and white poplar soil, WPS) and then transferred to the laboratory for the analysis of physicochemical characteristics and molecular analysis.
The soil physicochemical characteristics analyzed include soil pH, available P, available K, total nitrogen (Total N), ammonium nitrogen (NH4+-N), nitrate-nitrogen (NO3-N), and soil organic matter (SOM). The pH was measured with a soil-to-water ratio of 1:2.5. The available P content was extracted with 0.5 mol L−1 sodium bicarbonate and then measured with a spectrophotometer (UV-4802H, UNIC, Shanghai, China) [29]. The content of available K was extracted with 1.0 mol L−1 ammonium acetate and measured by the flame spectrophotometry method [30]. The total N content was analyzed by an element analyzer (Elementar, Hanau, Germany) [31]. The NH4+-N and NO3-N contents were determined on a flow-injection autoanalyzer (FIAstarTM 5000, Foss, Hillerød, Denmark) [32]. The K2Cr2O7 colorimetric method was used to quantify the SOM content [30]. All the above analyses were performed in triplicate.

2.2. DNA Extraction

DNA was extracted by the OMEGA-soil DNA kit [24]. DNA concentration was measured by a NanoDrop 2000 UV-vis spectrophotometer (Thermo Fisher Scientific, Waltham, MA, USA). The extracted DNA was purified with a DNeasy Tissue kit (Qiagen, Valencia, CA, USA) and then checked for qPCR and Illumina high-throughput sequencing [24].

2.3. qPCR

The qPCR technique could be used to study the abundance of the microbial community [1]. The primers and PCR conditions were shown in Table 1. Amplification was performed on a Line-Gene 9600 plus Detection System (Bioer Technology, Hangzhou, China) as per the description of our previous study [24]. The R2 and amplification efficiencies were 0.995 and 89.27% for bacterial 16S rRNA genes, 0.999 and 85.66% for archaeal 16S rRNA genes, and 0.997 and 90.7% for the fungal ITS region, respectively. All qPCR experiments were performed in triplicate.

2.4. Illumina MiSeq Sequencing

The pairs of primers for sequencing were shown in Table 1. The volume of PCR reactions of 16S rRNA genes and the ITS region was 20 μL, respectively. The amplification was conducted by ABI GeneAmp® 9700 based on five cycling procedures as previous studied [11,12,26]. After the successful PCR amplification, PCR products were purified then sequenced at Majorbio Co., Ltd. (Shanghai, China) [35,36]. Operational taxonomic units (OTUs) were clustered with a 97% similarity cutoff using UPARSE [37].

2.5. Statistical Analyses

One-way analysis of variance (ANOVA) followed by a Duncan test was conducted to study the significant differences between microbial community abundance and the environmental factors. Principal coordinates analysis (PCoA) and the analyses of the Venn diagram, microbial community structure, and α-diversity indices based on OTUs were achieved through the Online Cloud Platform (http://www.i-sanger.com/) (accessed on 10 October 2021). Redundancy analysis (RDA) was conducted by Canoco 5 [38]. Statistical analyses were conducted by SPSS 20.0. The figure of community composition was drawn using origin 2019. The co-occurrence network analyses were conducted by the psych package in the R program (V.3.6.1) [39].

2.6. Nucleotide Sequence Accession Numbers

All the bacterial, archaeal, and fungal sequences were submitted to the NCBI Sequence Read Archive (SRA) and obtained the accession PRJNA788180.

3. Results

3.1. Soil Physicochemical Characterization

Soil physicochemical characteristics, such as pH, SOM, and total N, varied significantly across all samples (p < 0.05), whereas no significant differences were detected in available P, and K, NH4+-N, NO3-N, and C/N ratio (p < 0.05) (Table 2). The pH of soil samples was slightly acidic. The highest and lowest pH were 5.12 in MOS and 4.92 in WBS, respectively. The contents of SOM and total N across all soil samples ranged from 62.25 g kg−1 to 78.35 g kg−1 and from 3.58 g kg−1 to 4.81 g kg−1, respectively. The SOM and total N contents in all soil samples followed the order WBS > WPS > MOS.

3.2. Abundance of Microbial Community in the Three Typical Forest Soils

As shown in Figure 1, 743 bacterial OTUs, 87 archaeal OTUs, and 50 fungal OTUs were common in the three groups. In contrast, MOS (148 bacterial OTUs, 278 archaeal OTUs, and 161 fungal OTUs), WBS (128 bacterial OTUs, 194 archaeal OTUs, and 127 fungal OTUs), and WPS (157 bacterial OTUs, 709 archaeal OTUs, and 165 fungal OTUs) had unique OTUs. The above results indicated that the three typical forest soils (WBS, WPS, and MOS) had a higher number of shared bacterial OTUs but a lower number of shared archaeal and fungal OTUs.
The α-diversity indices were expressed by the Shannon index and Simpson index in Table 3. The highest values of bacterial, archaeal, and fungal Shannon indices were observed in WPS (6.00), MOS (3.39), and WBS (2.96), respectively. However, no significant differences were present in the bacterial Shannon index from WBS, WPS, and MOS (p < 0.05). The bacterial, archaeal, and fungal Simpson indices varied from 0.0056 to 0.0105, 0.0879 to 0.1865, and 0.1254 to 0.2872, respectively. The Simpson indices of bacteria and archaea in WBS were higher than those in MOS and WPS, whereas those of fungi in WBS were the lowest compared with in MOS and WPS.
Bacteria, archaea, and fungi were present in all soil samples, with abundance in the range of 3.32 × 10⁶ copies g−1 dry soil to 9.01 × 10⁶ copies g−1 dry soil, 5.11 × 10⁵ copies g−1 dry soil to 9.03 × 10⁵ copies g−1 dry soil, and 0.86 × 10⁶ copies g−1 dry soil to 1.80 × 10⁶ copies g−1 dry soil, respectively (Figure 2). Results indicated that the copy numbers of archaea were lower than those of bacteria and fungi in WBS, WPS, and MOS. The bacterial copy numbers in WBS, WPS, and MOS were significantly different (p < 0.05). The highest bacterial copy numbers were detected in WPS, followed by those in MOS and WBS. The archaeal copy numbers were significantly different from WBS and WPS. Furthermore, significant differences in the fungal copy numbers were present in WBS, WPS, and MOS.
Correlation was the tightest between soil pH and bacterial community abundance (p < 0.01). Meanwhile, soil pH also was significantly correlated with archaeal and fungal community abundance (p < 0.01), as shown in Table 4. The contents of available NH4+-N, NO3-N, K, and P, showed negative correlations with the bacterial, archaeal, and fungal abundance, respectively. In contrast, positive correlations were shown between the C/N ratio and the abundance of bacteria, archaea, and fungi, respectively (Table 4). The bacterial, archaeal, and fungal abundance correlated significantly with SOM and total N (p < 0.05). The results revealed that pH, SOM, and total N could affect the abundance of the bacterial, archaeal, and fungal community more than other soil physical–chemical characteristics.

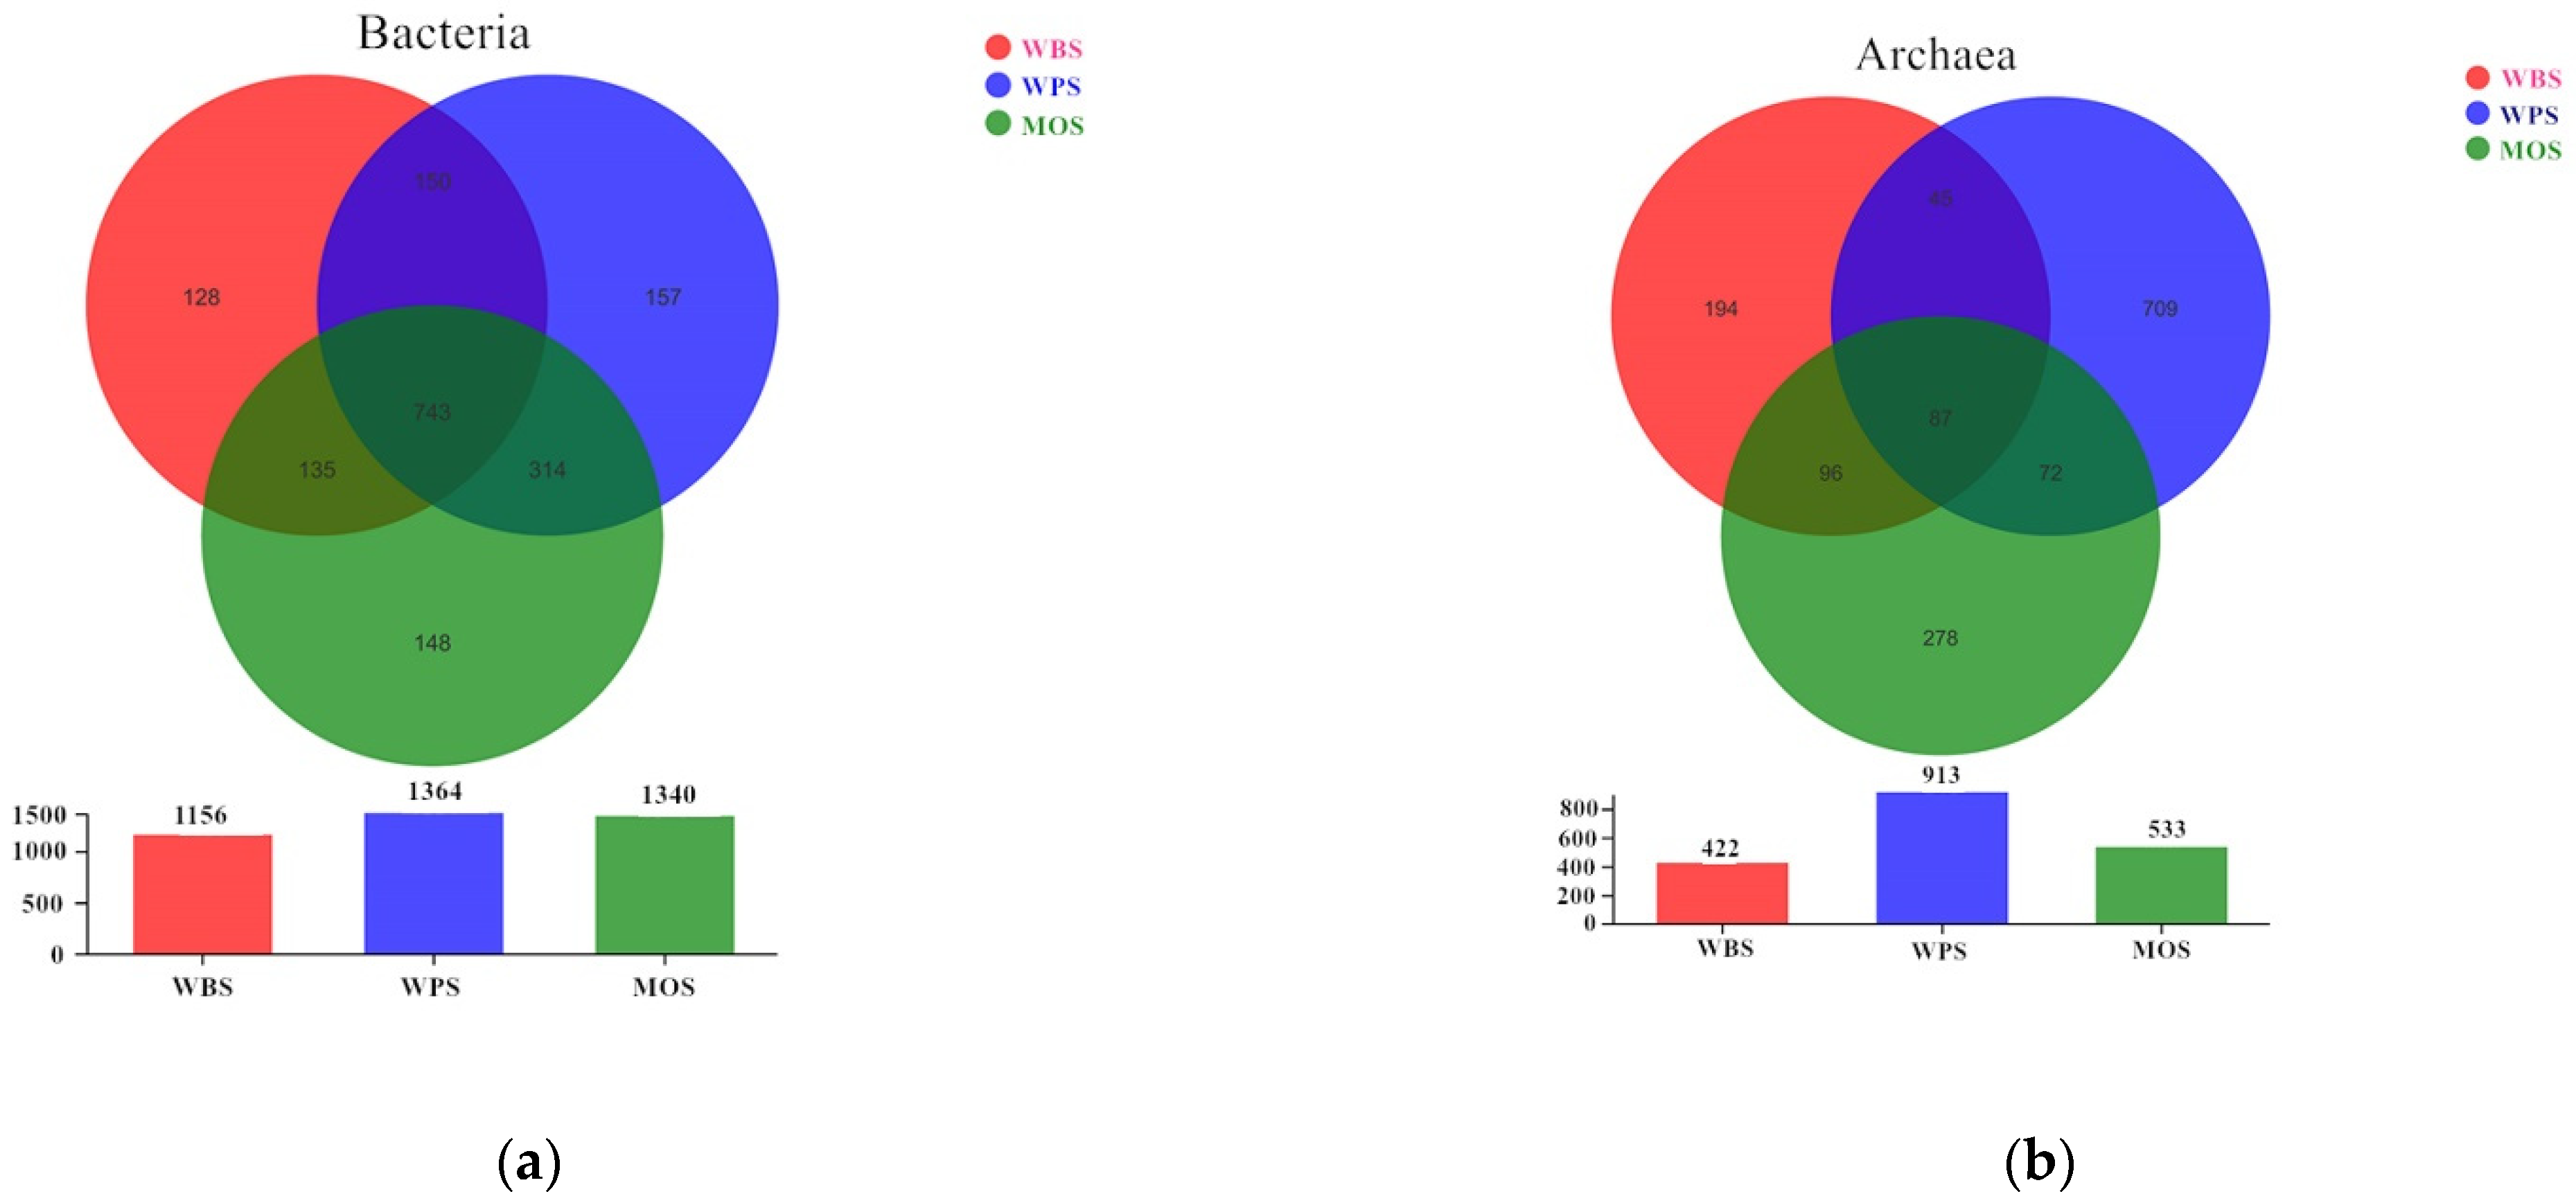
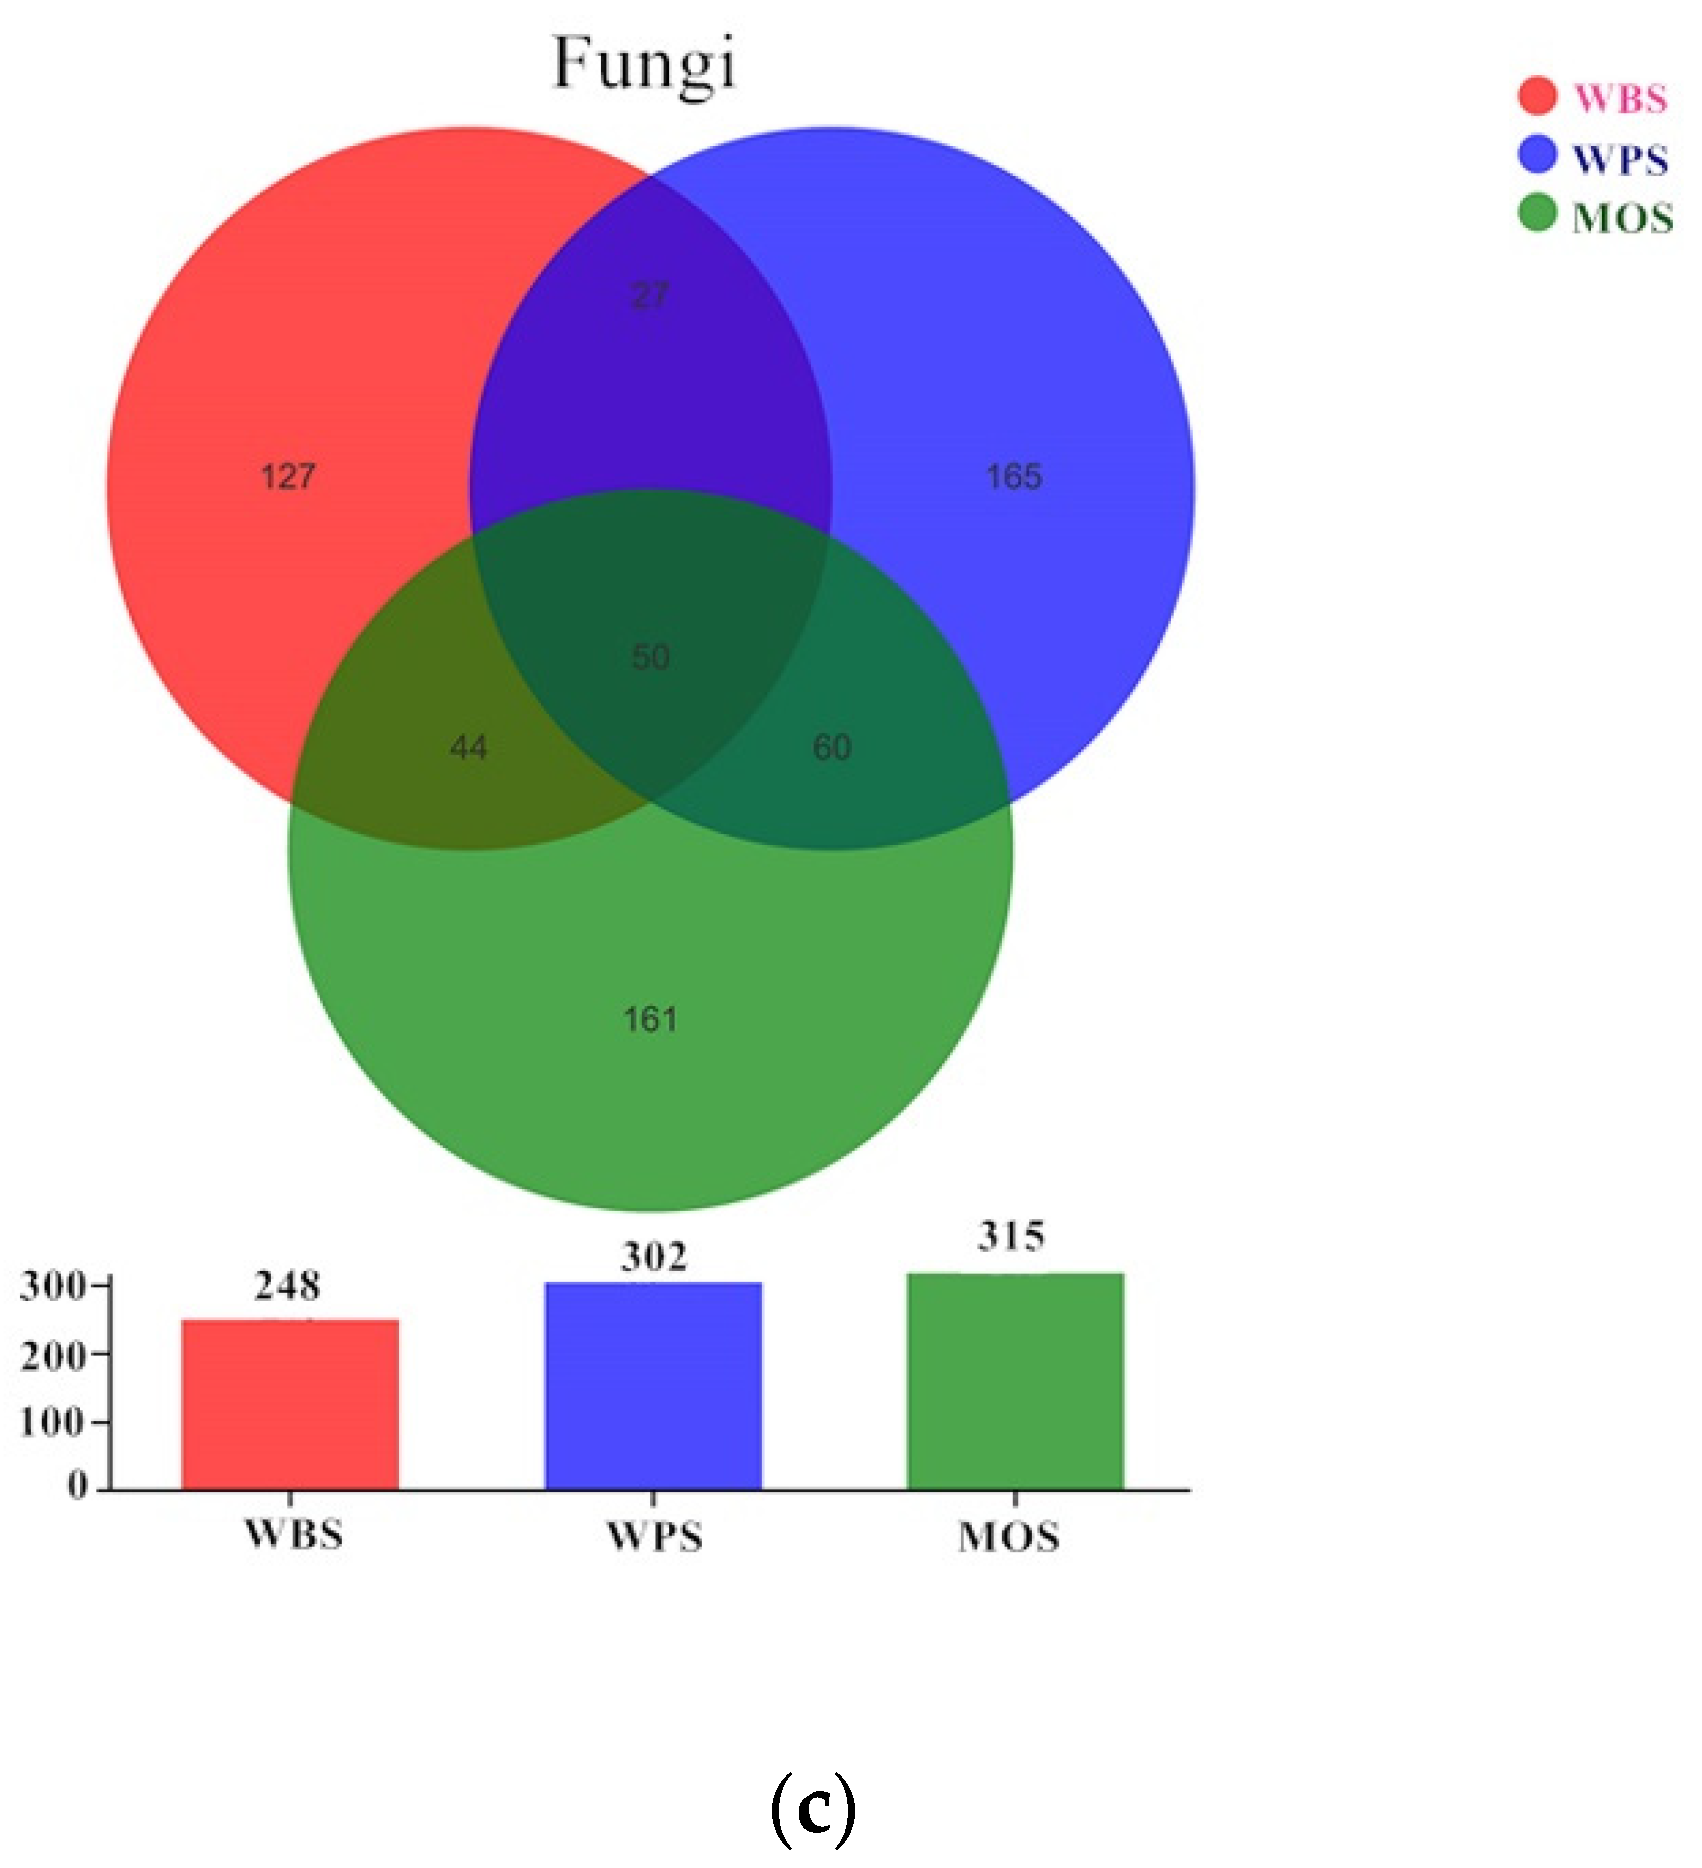
3.3. Community Structure of Microbial Community in the Three Typical Forest Soils

In this study, 464,855 high-quality prokaryotic sequences, including 88,538 bacterial sequences, 161,712 archaeal sequences, and 214,605 fungal sequences, were obtained through the three forest soils, with an average number of 154,952. Meanwhile, 1775 bacterial OTUs, 1481 archaeal OTUs, and 634 fungal OTUs were identified among these sequences. As shown in Figure 3, the two bacterial species that dominated WBS, WPS, and MOS were Acidobacteria (24.3–43.6%) and Proteobacteria (17.5–32.6%). Some species at a low relative abundance were found in all soils, such as Gemmatimonadetes, Rokubacteria, Patescibacteria, and Elusimicrobia. Bacterial community structure differed significantly in WBS, WPS, and MOS.
Among these three forest soils, the archaeal phyla Thaumarchaeota (MOS, 70.2%; WBS, 86.1%; WPS, 80.1%, respectively), unclassified Archaea (MOS, 22.9%; WBS, 13.1%; WPS, 17.2%, respectively), and Euryarchaeota (MOS, 6.8%; WBS, 0.6%; WPS, 2.7%, respectively) encompassed the largest proportion of archaeal sequences (Figure 3). At the phylum levels, the archaeal taxon Euryarchaeota was highly enriched in MOS. Furthermore, Thaumarchaeota was highly enriched in MOS and WPS but also present in WBS.
The fungal phyla of Ascomycota (17.6–61.1%), Basidiomycota (7.1–75.8%), and Mortierellomycota (4.0–52.8%) were prevalent fungal community in these three forest soils (Figure 3). The three dominant species accounted for 77.02%, 79.68%, and 87.42% of the total obtained fungal reads in WBS, WPS, and MOS, respectively. Ascomycota was dominant in WPS, but Basidiomycota dominated in WBS, and Mortierellomycota dominated in MOS. The relative abundance of Basidiomycota showed a significantly negative correlation with pH (p < 0.05) (Supplementary Table S1).
According to the results of PCoA (Supplementary Figure S1), site MOS was distant from WBS and WPS. These results showed that the bacterial, archaeal, and fungal community had significant differences among WBS, WPS, and MOS. These results showed that the structures of the bacterial, archaeal, and fungal community in the three typical forest soils (WBS, WPS, and MOS) differed in various degrees.

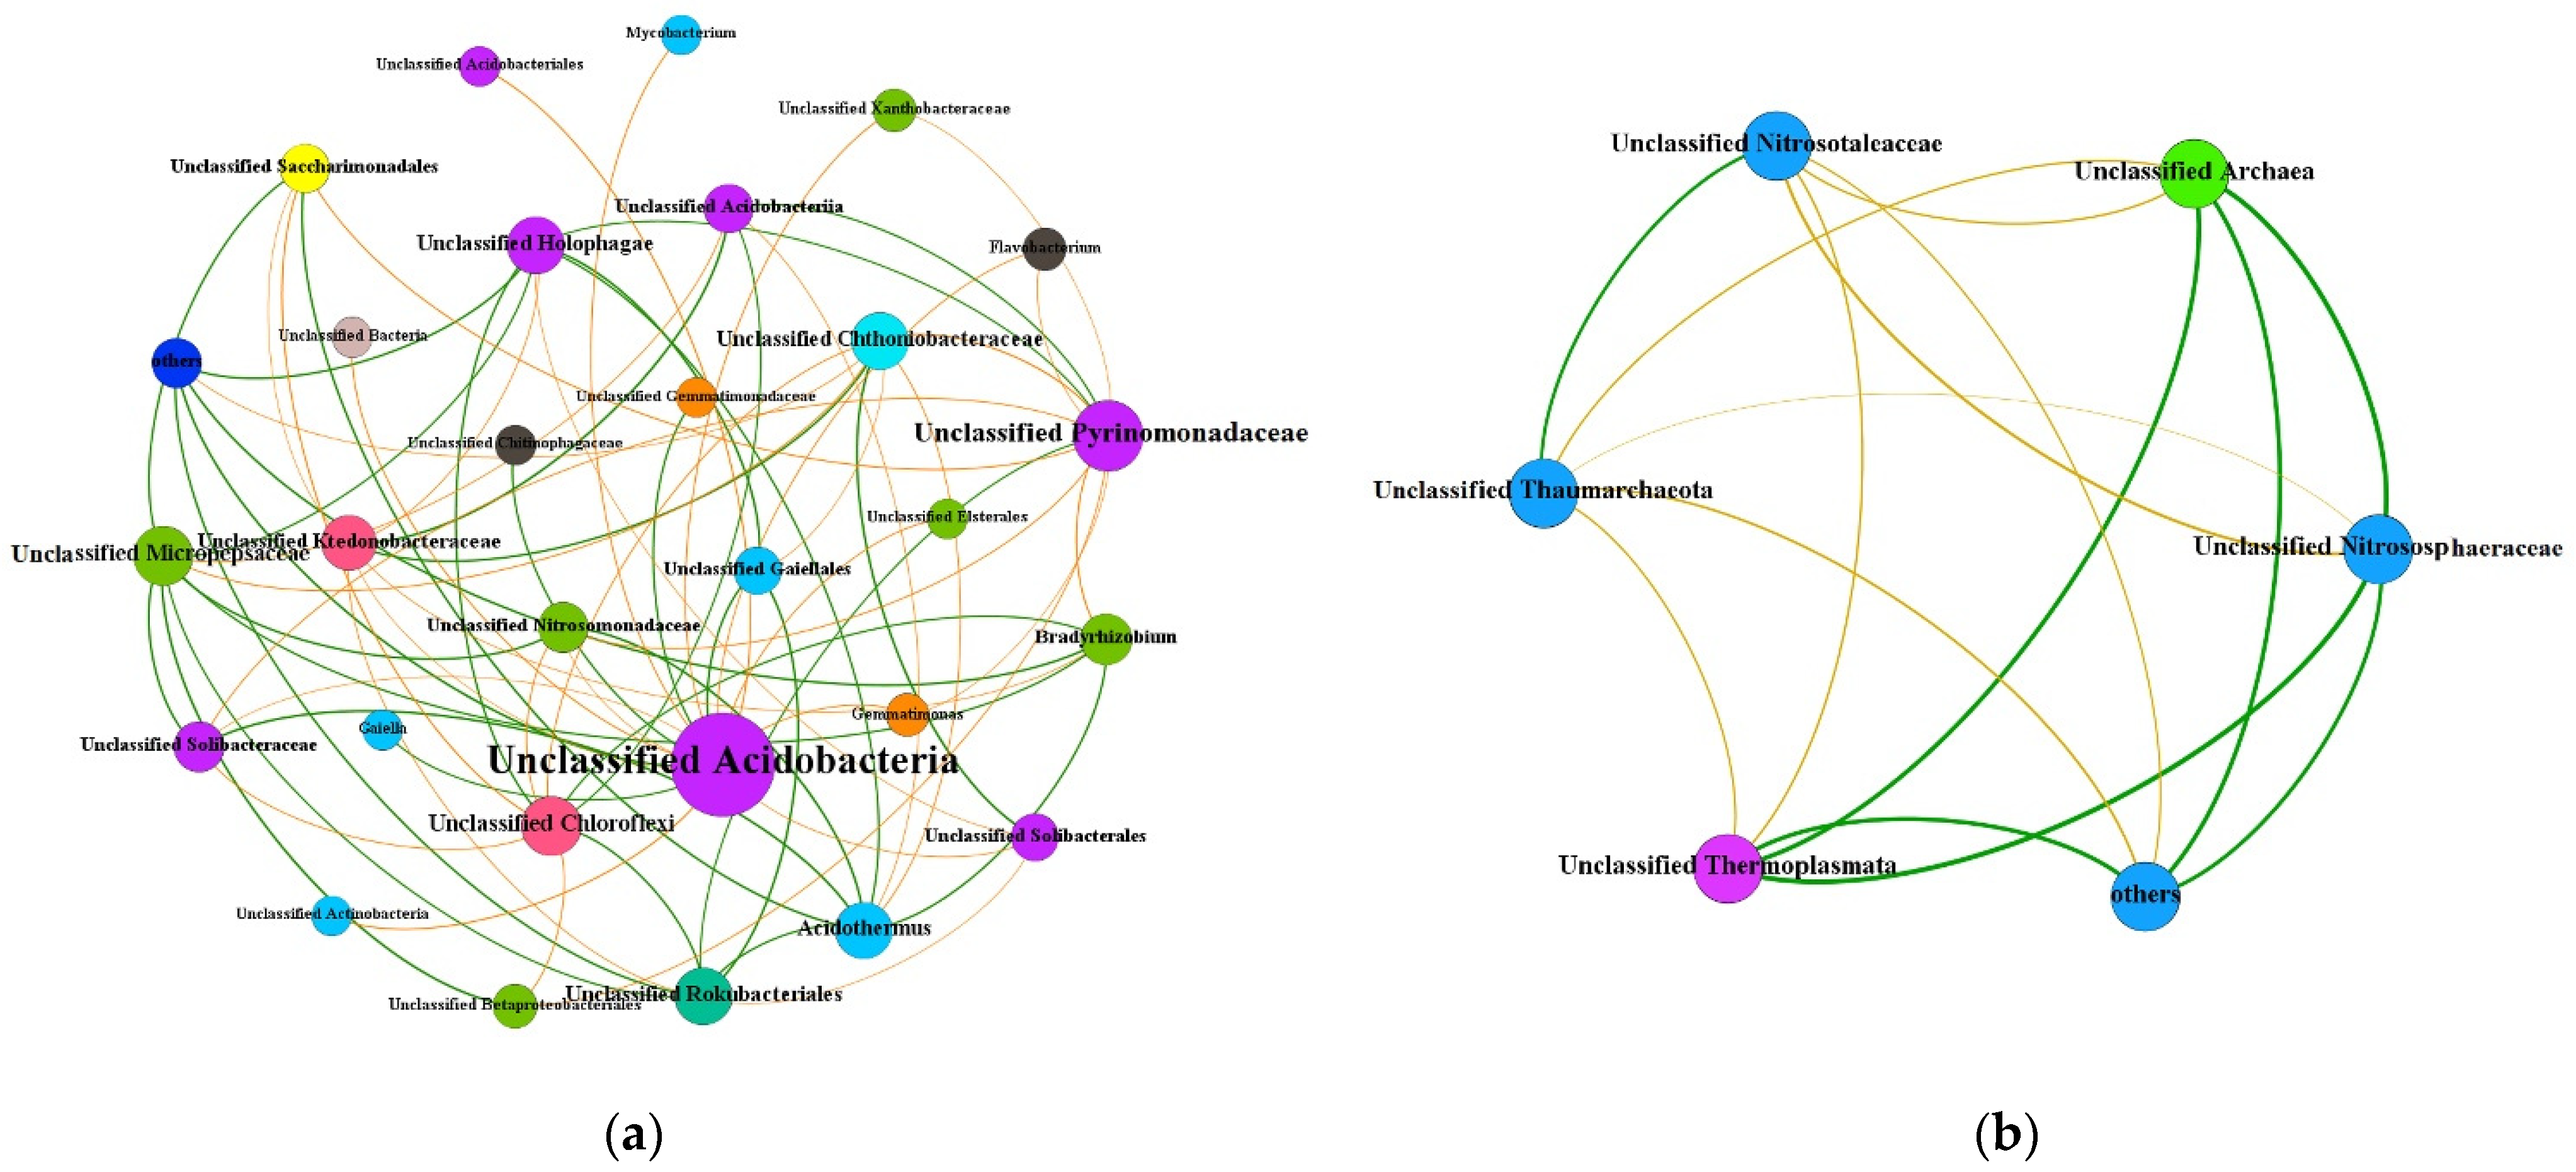
3.4. Co-Occurrence Network Analysis

Based on the co-occurrence network analysis (Figure 4), it was shown that the bacterial and fungal community was more connected than those of the archaeal community. The number of bacterial nodes was the most abundant compared with archaeal and fungal nodes. As shown in Figure 4, positive links in the bacterial networks were more than the negative links. On the contrary, fewer positive links than negative ones existed in the archaeal and fungal networks compared with the bacterial networks. The nodes of unclassified Acidobacteria and unclassified Pyrinomonadaceae, Pleotrichocladium, and Leotia had the top two betweenness centrality values in the bacterial networks and the fungal networks, respectively.

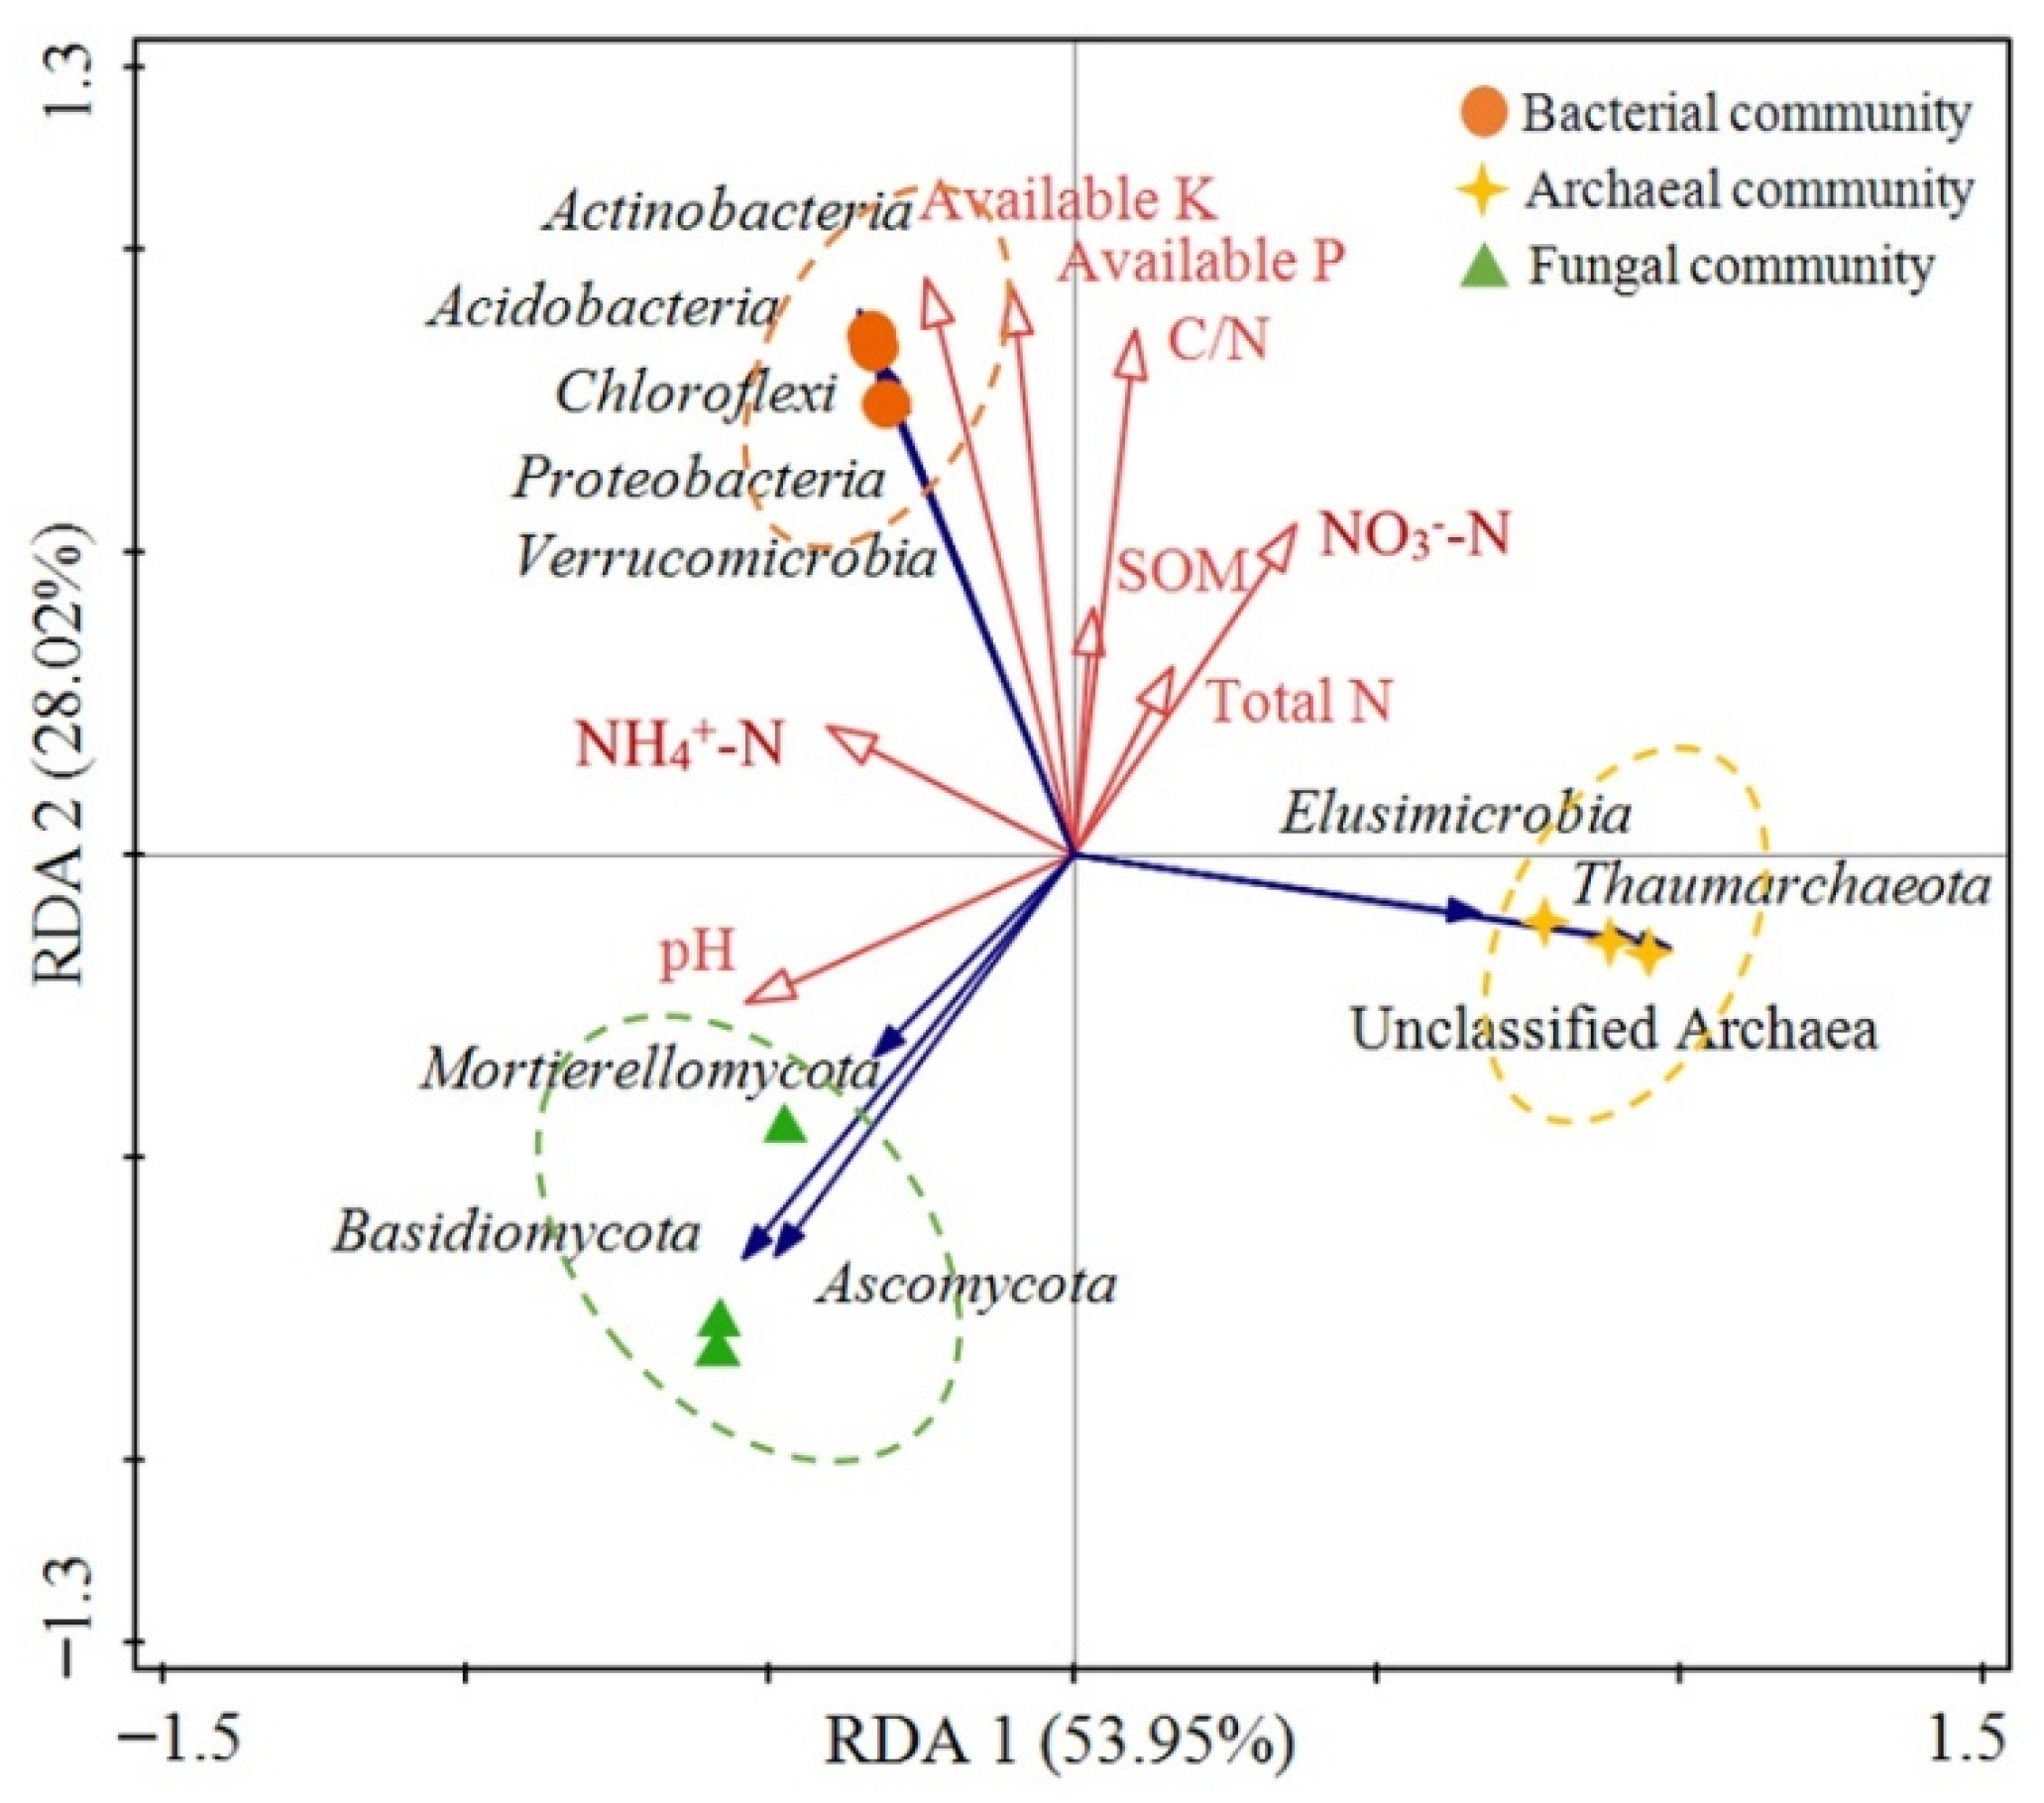
3.5. The Associations between Microbial Community Structure and Environmental Factors

The first two principal components of RDA could explain 81.97% of the overall variation (Figure 5). Compared with a variation of the first axis (RDA 1, 53.95%), the second axis (RDA 2, 28.02%) had a reduced variation. The RDA results indicated that the fungal community structure was positively influenced by pH, while both NO3-N and total N had positive correlations with the forest soil archaeal community structure. In comparison, the bacterial community structure was significantly correlated with all physicochemical characteristics of forest soils (Figure 5). Meanwhile, the interactive forward selection RDA results indicated that pH (F = 6.5, p = 0.01) performed a vital role in shaping the microbial community structure and could explain 9.7% of the overall variation. The above results indicated that the effects of physicochemical characteristics on the structure of bacterial, archaeal, and fungal communities showed differences, whereas pH was the dominant driver of the differences in the microbial community structure in the studied region.

4. Discussion

The driving factors of archaeal, bacterial, and fungal community abundance and structure in the soils of Mongolian oak (Quercus mongolica), white birch (Betula platyphylla), and white poplar (Populus davidiana) from Sanjiang Plain were discussed. The results indicated that significant differences in pH, SOM, and total N were present in three typical forest soils. The pH showed an opposite trend with SOM. A higher pH corresponded to a lower SOM. The inconsistent response was mainly due to the production of organic acids during the decomposition processes of SOM [40]. Furthermore, the negative correlation between pH and total N was consistent with previous studies [41,42]. In fact, soil pH could affect SOM and total N by regulating microbial activities [43]. The differences in pH, SOM, and total N in three typical forest soils may be related to leaf litter types.
In this study, soil pH, SOM, and total N had significant correlations with the abundance of bacteria, archaea, and fungi, respectively. The above results were in accordance with the studies conducted by Sui et al. [23], Hu et al. [14], and Tang et al. [16]. Soil pH was a vital environmental factor that influenced microbial community [12,16]. SOM and total N were considered as the soil nutrients that could affect the microbial community composition [14,44]. Furthermore, it was reported that the microbial community in soils gained energy depending on SOM decomposition [45]. The significant correlations between the archaeal abundance and SOM or total N were lower than those between the bacterial abundance or fungal abundance and SOM or total N. These results could be explained by the not readily available or incompetent to nutrients by the archaeal community, compared with the bacterial and fungal community [46]. In brief, pH, SOM, and total N were considered as the key environmental factors that could affect the abundance of bacteria, archaea, and fungi.
Co-occurrence network analysis could be used in discussing the putative interactions among microbial community [47]. The bacterial and fungal networks were more complex than those of the archaeal networks. This result showed that the bacterial and fungal networks had more cooperative and competitive interactions than the archaeal networks. Meanwhile, the bacterial and fungal community had more resistance to environmental perturbations than the archaeal community [48]. Unclassified Acidobacteria and unclassified Pyrinomonadaceae were the keystone taxa in the bacterial networks, while Pleotrichocladium and Leotia were the keystone taxa in the fungal networks. These taxa belonging to the dominant community could influence the ecosystem functions and the overall ecological processes [49,50]. They were also the drivers of microbiome structure and function [49].
In this study, Acidobacteria was the dominant species commonly present in forest soils, and it was sensitive to the changes in pH [51]. The relative abundance of Acidobacteria decreased from WBS to MOS as soil pH increased, which concurred with a previous study [52]. In contrast, the bacterial phylum Proteobacteria preferred to accumulate in soils at a higher pH. This finding agreed with the previous study conducted by Lauber et al. [53,54]. Furthermore, Acidobacteria and Proteobacteria were also considered the most abundant bacterial phyla in forest soils [51]. The bacterial phylum Actinobacteria showed the same trend as the changes of soil pH. Both Actinobacteria and Chloroflexi found in WBS, WPS, and MOS were the common phyla in forest soils [51,55,56]. The archaeal phylum Thaumarchaeota contributed to the ammonia oxidation of soil [57,58]. A previous study indicated that Thaumarchaeota was strongly influenced by soil pH in forest soils [57]. In this study, the relative abundance of Euryarchaeota showed a positive correlation with soil pH but negatively correlated with SOM and TN. These results were consistent with other surveys describing the relationships between Euryarchaeota and soil physicochemical characteristics [59]. The fungal species of Ascomycota, Basidiomycota, and Mortierellomycota constituted the dominant fungal community in this study. The study conducted by Zhou et al. [18] showed that Ascomycota was the most abundant species in forest soils, and soil pH could affect its spatial characteristics. Furthermore, Ascomycota could promote carbon transformation and was also involved in the refractory organic macromolecules’ metabolism [60,61]. The relative abundance of Basidiomycota showed a negative correlation with pH, while Mortierellomycota was positively correlated with pH. Basidiomycota was found to be the predominant fungal phyla in the soils of Betula albosinensis and Picea asperata Mast in the Qinling Mountains [61]. Furthermore, Basidiomycota could participate in the process of soil carbon transformation [62]. Bastida et al. [60] found that Mortierellomycota was related to the decomposition of organic matter in the rhizosphere.
According to the results of RDA, it could be concluded that pH was the mainly environmental factor shaping the structure of the microbial community. It was reported that soil pH was a critical factor affecting the structure of the bacterial, archaeal, and fungal community [12,63]. However, it was not easy to elucidate the difference between pH and other environmental factors [64]. In this study, pH was considered the only dominant environmental factor driving the structure of the microbial community. It was reported that pH could affect the microbial community structure by regulating soil nutrient availability [65]. Furthermore, pH could interact directly or indirectly with enzymes, soil moisture, organic carbon, etc. These interactions could impact the diversity and abundance of the microbial community [53]. To sum up, this study indicated that pH was the driving factor of the archaeal, bacterial, and fungal community structure in the soils of Mongolian oak (Quercus mongolica), white birch (Betula platyphylla), and white poplar (Populus davidiana).

5. Conclusions

The major environmental factors driving soil microbial community abundance and structure in the typical forest soils were discussed in this study. It was shown that pH, SOM, and total N play essential roles in affecting the bacterial, archaeal, and fungal abundance, while pH emerged as the primary determinant of archaeal, bacterial, and fungal community structure. In our study, the patterns of biodiversity are very clear between groups (bacteria, archaea, and fungi), but the diversity of OTUs is very high within the groups. Further studies are needed to address this issue.

Supplementary Materials

The following supporting information can be downloaded at: https://www.mdpi.com/article/10.3390/su14138040/s1, Figure S1: PCoA diagram of bacterial community (a), archaeal community (b), and fungal community (c) identified from WBS, WPS, and MOS based on Bray-Curtis distance matrix.; Table S1: Pearson’s correlation coefficients between pH, SOM, and total N and the relative abundance of bacteria, archaea, and fungi.

Author Contributions

Conceptualization, C.W. and Z.Z.; experiments, C.W.; software, X.H., Z.Z., B.Z., and T.Y.; data curation, X.H.; writing—original draft preparation, C.W. and X.H.; writing, C.W. and Z.U.I. All authors have read and agreed to the published version of the manuscript.

Funding

This research was funded by the Natural Science Foundation of Liaoning Province (No. 2021-BS-256) and the Scientific Research Funding Project of the Education Department of Liaoning Province (No. JQL202015402).

Institutional Review Board Statement

Not applicable.

Informed Consent Statement

Not applicable.

Data Availability Statement

Data are publicly available with accession number BioProject ID PRJNA788180.

Conflicts of Interest

The authors declare no conflict of interest.

References

  1. Siles, J.A.; Margesin, R. Abundance and Diversity of Bacterial, Archaeal, and Fungal Communities along an Altitudinal Gradient in Alpine Forest Soils: What are the Driving Factors? Microb. Ecol. 2016, 72, 207–220. [Google Scholar] [CrossRef] [PubMed] [Green Version]
  2. Wang, H.; Zeng, Y.; Guo, C.; Bao, Y.; Lu, G.; Reinfelder, J.R.; Dang, Z. Bacterial, Archaeal, and Fungal Community Responses to Acid Mine Drainage-laden Pollution in A Rice Paddy Soil Ecosystem. Sci. Total Environ. 2018, 616, 107–116. [Google Scholar] [CrossRef] [PubMed]
  3. Chaparro, J.M.; Sheflin, A.M.; Manter, D.K.; Vivanco, J.M. Manipulating the Soil Microbiome to Increase Soil Health and Plant Fertility. Biol. Fertil. Soils 2012, 48, 489–499. [Google Scholar] [CrossRef]
  4. Schulz, S.; Brankatschk, R.; Dümig, A.; Kögel-Knabner, I.; Schloter, M.; Zeyer, J. The Role of Microorganisms at Different Stages of Ecosystem Development for Soil Formation. Biogeosciences 2013, 10, 3983–3996. [Google Scholar] [CrossRef] [Green Version]
  5. Liu, L.; Tan, Z.; Gong, H.; Huang, Q. Migration and Transformation Mechanisms of Nutrient Elements (N, P, K) within Biochar in Straw-biochar-soil-plant Systems: A Review. ACS Sustain. Chem. Eng. 2018, 7, 22–32. [Google Scholar] [CrossRef]
  6. Hackl, E.; Pfeffer, M.; Donat, C.; Bachmann, G.; Zechmeister-Boltenstern, S. Composition of the Mmicrobial Communities in the Mineral Soil under Different Types of Natural Forest. Soil Biol. Biochem. 2005, 37, 661–671. [Google Scholar] [CrossRef]
  7. Lejon, D.P.H.; Chaussod, R.; Ranger, J.; Ranjard, L. Microbial Community Structure and Density under Different Tree Species in an Acid Forest Soil (Morvan, France). Microb. Ecol. 2005, 50, 614–625. [Google Scholar] [CrossRef]
  8. Yang, F.; Wu, J.; Zhang, D.; Chen, Q.; Zhang, Q.; Cheng, X. Soil Bacterial Community Composition and Diversity in Relation to Edaphic Properties and Plant Traits in Grasslands of Southern China. Appl. Soil Ecol. 2018, 128, 43–53. [Google Scholar] [CrossRef]
  9. Yu, S.; Ehrenfeld, J.G. Relationships among Plants, Soils and Microbial Communities along A Hydrological Gradient in the New Jersey Pinelands, USA. Ann. Bot. 2010, 105, 185–196. [Google Scholar] [CrossRef] [Green Version]
  10. Li, H.; Ye, D.; Wang, X.; Settles, M.L.; Wang, J.; Hao, Z.; Zhou, L.; Dong, P.; Jiang, Y.; Ma, Z.S. Soil Bacterial Communities of Different Natural Forest Types in Northeast China. Plant Soil 2014, 383, 203–216. [Google Scholar] [CrossRef]
  11. Cui, Y.; Bing, H.; Fang, L.; Wu, Y.; Yu, J.; Shen, G.; Jiang, M.; Wang, X.; Zhang, X. Diversity Patterns of the Rhizosphere and Bulk Soil Microbial Communities along an Altitudinal Gradient in an Alpine Ecosystem of the Eastern Tibetan Plateau. Geoderma 2019, 338, 118–127. [Google Scholar] [CrossRef]
  12. Wang, C.; Zhou, X.; Guo, D.; Zhao, J.H.; Yan, L.; Feng, G.Z.; Gao, Q.; Yu, H.; Zhao, L.P. Soil pH is the Primary Factor Driving the Distribution and Function of Microorganisms in Farmland Soils in North-eastern China. Ann. Microbiol. 2019, 69, 1461–1473. [Google Scholar] [CrossRef] [Green Version]
  13. An, J.; Liu, C.; Wang, Q.; Yao, M.; Rui, J.; Zhang, S.; Li, X. Soil Bacterial Community Structure in Chinese Wetlands. Geoderma 2019, 337, 290–299. [Google Scholar] [CrossRef]
  14. Hu, Y.; Xiang, D.; Veresoglou, S.D.; Chen, F.; Chen, Y.; Hao, Z.; Zhang, X.; Chen, B. Soil Organic Carbon and Soil Structure are Driving Microbial Abundance and Community Composition across the Arid and Semi-arid Grasslands in Northern China. Soil Biol. Biochem. 2014, 77, 51–57. [Google Scholar] [CrossRef]
  15. Lladó, S.; López–Mondéjar, R.; Baldrian, P. Drivers of Microbial Community Structure in Forest Soils. Appl. Microbiol. Biotechnol. 2018, 102, 4331–4338. [Google Scholar] [CrossRef]
  16. Tang, M.; Li, L.; Wang, X.; You, J.; Li, J.; Chen, X. Elevational is the main factor controlling the soil microbial community structure in alpine tundra of the Changbai Mountain. Sci. Rep. 2020, 10, 12442. [Google Scholar] [CrossRef]
  17. Balser, T.C.; Firestone, M.K. Linking Microbial Community Composition and Soil Processes in A California Annual Grassland and Mixed-conifer Forest. Biogeochemistry 2005, 73, 395–415. [Google Scholar] [CrossRef]
  18. Zhou, Y.; Jia, X.; Han, L.; Tian, G.; Kang, S.; Zhao, Y. Spatial Characteristics of the Dominant Fungi and Their Driving Factors in Forest Soils in the Qinling Mountains, China. Catena 2021, 206, 105504. [Google Scholar] [CrossRef]
  19. Wang, Z.; Song, K.; Ma, W.; Ren, C.; Zhang, B.; Liu, D.; Chen, J.; Song, C. Loss and Fragmentation of Marshes in the Sanjiang Plain, Northeast China, 1954-2005. Wetlands 2011, 31, 945–954. [Google Scholar] [CrossRef]
  20. Cao, Y.; Tang, C.; Song, X.; Liu, C.; Zhang, Y. Characteristics of Nitrate in Major Rivers and Aquifers of the Sanjiang Plain, China. J. Environ. Monit. 2012, 14, 2624–2633. [Google Scholar] [CrossRef]
  21. Du, B.; Zheng, Y.; Liu, J.; Mao, D. Threatened Plants in China’s Sanjiang Plain: Hotspot Distributions and Gap Analysis. Sustainability 2018, 10, 194. [Google Scholar] [CrossRef] [Green Version]
  22. Hernández, M.; Conrad, R.; Klose, M.; Ma, K.; Lu, Y. Structure and Function of Methanogenic Microbial Communities in Soils from Flooded Rice and Upland Soybean Fields from Sanjiang Plain, NE China. Soil Biol. Biochem. 2017, 105, 81–91. [Google Scholar] [CrossRef] [Green Version]
  23. Sui, X.; Zhang, R.; Frey, B.; Yang, L.; Li, M.H.; Ni, H. Land Use Change Effects on Diversity of Soil Bacterial, Acidobacterial and Fungal Communities in Wetlands of the Sanjiang Plain, North-eastern China. Sci. Rep. 2019, 9, 18535. [Google Scholar] [CrossRef] [PubMed]
  24. Wang, C.; Li, J.; Wu, Y.; Song, Y.; Liu, R.; Cao, Z.; Cui, Y. Shifts of the NirS and NirK Denitrifiers in Different Land Use Types and Seasons in the Sanjiang Plain, China. J. Basic Microbiol. 2019, 59, 1040–1048. [Google Scholar] [CrossRef]
  25. Guo, X.; Zhou, Y. Effects of Land Use Patterns on the Bacterial Community Structure and Diversity of Wetland Soils in the Sanjiang Plain. J. Soil Sci. Plant Nutr. 2021, 21, 1–12. [Google Scholar] [CrossRef]
  26. Wu, Y.; Xu, N.; Wang, H.; Li, J.; Zhong, H.; Dong, H.; Zeng, Z.; Zong, C. Variations in the Diversity of the Soil Microbial Community and Structure under Various Categories of Degraded Wetland in Sanjiang Plain, North-eastern China. Land Degrad. Dev. 2021, 32, 2143–2156. [Google Scholar] [CrossRef]
  27. Zhang, C.; Robinson, D.; Wang, J.; Liu, J.; Liu, X.; Tong, L. Factors Influencing ‘Farmers’ Willingness to Participate in the Conversion of Cultivated Land to Wetland Program in Sanjiang National Nature Reserve, China. Environ. Manag. 2011, 47, 107–120. [Google Scholar] [CrossRef]
  28. Zhou, Z.Q.; Liu, T. The Current Status, Threats and Protection Way of Sanjiang Plain Wetland, Northeast China. J. For. Res. 2005, 16, 148–152. [Google Scholar]
  29. Lin, Y.; Bhattacharyya, A.; Campbell, A.N.; Nico, P.S.; Pett-Ridge, J.; Silver, W.L. Phosphorus fractionation responds to dynamic redox conditions in A humid tropical forest soil. J. Geophys. Res. Biogeosci. 2018, 123, 3016–3027. [Google Scholar] [CrossRef]
  30. Zhao, X.; Gao, S.; Lu, D.; Chen, X.; Feng, W.; Wang, Y.; Zhao, S.; Wang, H. Analysis of Mechanisms of Soil Potassium-holding Capacity Using Different Soils of China. Agron. J. 2022, 114, 825–834. [Google Scholar] [CrossRef]
  31. Schaub, I.; Baum, C.; Schumann, R.; Karsten, U. Effects of an Early Successional Biological Soil Crust from a Temperate Coastal Sand Dune (NE Germany) on Soil Elemental Stoichiometry and Phosphatase Activity. Microb. Ecol. 2019, 77, 217–229. [Google Scholar] [CrossRef] [PubMed]
  32. Paasonen-Kivekäs, M.; Yli-Halla, M. A Comparison of Nitrogen and Carbon Reserves in Acid Sulphate and Non Acid Sulphate Soils in Western Finland. Agric. Food Sci. 2005, 14, 57–69. [Google Scholar] [CrossRef]
  33. Zeng, Q.; An, S. Identifying the Biogeographic Patterns of Rare and Abundant Bacterial Communities using Different Primer Sets on the Loess Plateau. Microorganisms 2021, 9, 139. [Google Scholar] [CrossRef] [PubMed]
  34. Taylor, D.L.; Walters, W.A.; Lennon, N.J.; Bochicchio, J.; Krohn, A.; Caporaso, J.G.; Pennanen, T. Accurate Estimation of Fungal Diversity and Abundance through Improved lineage-specific Primers Optimized for Illumina Amplicon Sequencing. Appl. Environ. Microbiol. 2016, 82, 7217–7226. [Google Scholar] [CrossRef] [Green Version]
  35. Dong, W.; Si, P.; Liu, E.; Yan, C.; Zhang, Z.; Zhang, Y. Influence of Film Mulching on Soil Microbial Community in a Rainfed Region of Northeastern China. Sci. Rep. 2017, 7, 8468. [Google Scholar] [CrossRef] [Green Version]
  36. Gao, J.; Li, M.M.; Zhao, G. Thiocyanate Increases the Nitrous Oxide Formation Process through Modifying the Soil Bacterial Community. J. Sci. Food Agric. 2022, 102, 2321–2329. [Google Scholar] [CrossRef]
  37. Xue, S.W.; Huang, C.; Tian, Y.X.; Li, Y.B.; Li, J.; Ma, Y.L. Synergistic Effect of rhamnolipids and inoculation on the bioremediation of petroleum-contaminated soils by bacterial consortia. Curr. Microbiol. 2020, 77, 997–1005. [Google Scholar] [CrossRef]
  38. Zhang, S.; Xia, T.; Wang, J.; Zhao, Y.; Xie, X.; Wei, Z.; Zhang, X.; Song, C.; Song, X. Role of Bacillus Inoculation in Rice Straw Composting and Bacterial Community Stability after Inoculation: Unite Resistance or Individual Collapse. Bioresour. Technol. 2021, 337, 125464. [Google Scholar] [CrossRef]
  39. Wu, C.; Wu, H.; Liu, D.; Han, G.; Zhao, P.; Kang, Y. Crab Bioturbation Significantly Alters Sediment Microbial Composition and Function in an Intertidal Marsh. Estuar. Coast. Shelf Sci. 2021, 249, 107116. [Google Scholar] [CrossRef]
  40. Zhou, W.; Han, G.; Liu, M.; Zeng, J.; Liang, B.; Liu, J.; Qu, R. Determining the Distribution and Interaction of Soil Organic Carbon, Nitrogen, pH and Texture in Soil Profiles: A Case Study in the Lancangjiang River Basin, Southwest China. Forests 2020, 11, 532. [Google Scholar] [CrossRef]
  41. Deng, L.; Shangguan, Z. Afforestation Drives Soil Carbon and Nitrogen Changes in China. Land Degrad. Dev. 2017, 28, 151–165. [Google Scholar] [CrossRef] [Green Version]
  42. Pietri, J.A.; Brookes, P.C. Relationships between Soil pH and Microbial Properties in a UK Arable Soil. Soil Biol. Biochem. 2008, 40, 1856–1861. [Google Scholar] [CrossRef]
  43. Kemmitt, S.J.; Wright, D.; Goulding, K.W.; Jones, D.L. pH Regulation of Carbon and Nitrogen Dynamics in two Agricultural Soils. Soil Biol. Biochem. 2006, 38, 898–911. [Google Scholar] [CrossRef]
  44. Zeng, Q.; An, S.; Liu, Y.; Wang, H.; Wang, Y. Biogeography and the Driving Factors Affecting Forest Soil Bacteria in an Arid Area. Sci. Total Environ. 2019, 680, 124–131. [Google Scholar] [CrossRef]
  45. Delgado-Baquerizo, M.; Maestre, F.T.; Reich, P.B.; Trivedi, P.; Osanai, Y.; Liu, Y.R.; Hamonts, K.; Jeffries, T.C.; Singh, B.K. Carbon Content and Climate Variability Drive Global Soil Bacterial Diversity Patterns. Ecol. Monogr. 2016, 86, 373–390. [Google Scholar] [CrossRef]
  46. Blaud, A.; Phoenix, G.K.; Osborn, A.M. Variation in Bacterial, Archaeal and Fungal Community Structure and Abundance in High Arctic Tundra Soil. Polar Biol. 2015, 38, 1009–1024. [Google Scholar] [CrossRef]
  47. Mundra, S.; Kjønaas, O.J.; Morgado, L.N.; Krabberød, A.K.; Ransedokken, Y.; Kauserud, H. Soil Depth Matters: Shift in Composition and Inter-Kingdom Co-occurrence Patterns of Microorganisms in Forest Soils. FEMS Microbiol. Ecol. 2021, 97, fiab022. [Google Scholar] [CrossRef]
  48. Santolini, M.; Barabási, A.L. Predicting Perturbation Patterns from the Topology of Biological Networks. Proc. Natl. Acad. Sci. USA 2018, 115, E6375–E6383. [Google Scholar] [CrossRef] [Green Version]
  49. Banerjee, S.; Schlaeppi, K.; van der Heijden, M.G.A. Keystone Taxa as Drivers of Microbiome Structure and Functioning. Nat. Rev. Microbiol. 2018, 16, 567–576. [Google Scholar] [CrossRef]
  50. Wu, X.; Yang, J.; Ruan, H.; Wang, S.; Yang, Y.; Naeem, I.; Wang, L.; Liu, L.; Wang, D. The Diversity and Co-occurrence Network of Soil Bacterial and Fungal Communities and Their Implications for a New Indicator of Grassland Degradation. Ecol. Indic. 2021, 129, 107989. [Google Scholar] [CrossRef]
  51. Wei, H.; Peng, C.; Yang, B.; Song, H.; Li, Q.; Jiang, L.; Wei, G.; Wang, K.; Wang, H.; Liu, S.; et al. Contrasting Soil Bacterial Community, Diversity, and Function in Two Forests in China. Front. Microbiol. 2018, 9, 1693. [Google Scholar] [CrossRef] [PubMed]
  52. Chu, H.; Fierer, N.; Lauber, C.L.; Caporaso, J.G.; Knight, R.; Grogan, P. Soil Bacterial Diversity in the Arctic is not Fundamentally Different from that Found in Other Biomes. Environ. Microbiol. 2010, 12, 2998–3006. [Google Scholar] [CrossRef] [PubMed]
  53. Lauber, C.L.; Hamady, M.; Knight, R.; Fierer, N. Pyrosequencing-based Assessment of Soil pH as A Predictor of Soil Bacterial Community Structure at the Continental Scale. Appl. Environ. Microbiol. 2009, 75, 5111–5120. [Google Scholar] [CrossRef] [PubMed] [Green Version]
  54. Lauber, C.L.; Strickland, M.S.; Bradford, M.A.; Fierer, N. The Influence of Soil Properties on the Structure of Bacterial and Fungal Communities across Land-use Types. Soil Biol. Biochem. 2008, 40, 2407–2415. [Google Scholar] [CrossRef]
  55. Azman, A.S.; Othman, I.; Fang, C.M.; Chan, K.G.; Goh, B.H.; Lee, L.H. Antibacterial, Anticancer and Neuroprotective Activities of Rare Actinobacteria from Mangrove Forest Soils. Indian J. Microbiol. 2017, 57, 177–187. [Google Scholar] [CrossRef]
  56. Xiao, X.; Liang, Y.; Zhou, S.; Zhuang, S.; Sun, B. Fungal Community Reveals Less Dispersal Limitation and Potentially More Connected Network than that of Bacteria in Bamboo Forest Soils. Mol. Ecol. 2018, 27, 550–563. [Google Scholar] [CrossRef]
  57. Lu, X.; Seuradge, B.J.; Neufeld, J.D. Biogeography of Soil Thaumarchaeota in Relation to Soil Depth and Land Usage. FEMS Microbiol. Ecol. 2017, 93, fiw246. [Google Scholar] [CrossRef]
  58. Biggs-Weber, E.; Aigle, A.; Prosser, J.I.; Gubry-Rangin, C. Oxygen Preference of Deeply-rooted Mesophilic Thaumarchaeota in Forest Soil. Soil Biol. Biochem. 2020, 148, 107848. [Google Scholar] [CrossRef]
  59. Feng, H.; Guo, J.; Wang, W.; Song, X.; Yu, S. Soil Depth Determines the Composition and Diversity of Bacterial and Archaeal Communities in A Poplar Plantation. Forests 2019, 10, 550. [Google Scholar] [CrossRef] [Green Version]
  60. Bastida, F.; Hernández, T.; Albaladejo, J.; García, C. Phylogenetic and Functional Changes in the Microbial Community of Long-term Restored Soils under Semiarid Climate. Soil Biol. Biochem. 2013, 65, 12–21. [Google Scholar] [CrossRef]
  61. Xu, C.; Du, C.; Jian, J.; Hou, L.; Wang, Z.K.; Wang, Q.; Geng, Z.C. The Interplay of Labile Organic Carbon, Enzyme Activities and Microbial Communities of Two Forest Soils across Seasons. Sci. Rep. 2021, 11, 5002. [Google Scholar] [CrossRef]
  62. Jiang, P.K.; Xu, Q.F.; Xu, Z.H.; Cao, Z.H. Seasonal Changes in Soil Labile Organic Carbon Pools within A Phyllostachys Praecox Stand under High Rate Fertilization and Winter Mulch in Subtropical China. For. Ecol. Manag. 2006, 236, 30–36. [Google Scholar] [CrossRef]
  63. Xue, L.; Ren, H.; Li, S.; Leng, X.; Yao, X. Soil Bacterial Community Structure and Co-occurrence Pattern during Vegetation Restoration in Karst Rocky Desertification Area. Front. Microbiol. 2017, 8, 2377. [Google Scholar] [CrossRef] [PubMed] [Green Version]
  64. Macdonald, C.A.; Thomas, N.; Robinson, L.; Tate, K.R.; Ross, D.J.; Dando, J.; Singh, B.K. Physiological, Biochemical and Molecular Responses of the Soil Microbial Community after Afforestation of Pastures with Pinus radiata. Soil Biol. Biochem. 2009, 41, 1642–1651. [Google Scholar] [CrossRef]
  65. Ma, B.; Lv, X.; Cai, Y.; Chang, S.X.; Dyck, M.F. Liming Does not Counteract the Influence of Long–term Fertilization on Soil Bacterial Community Structure and its Co–occurrence Pattern. Soil Biol. Biochem. 2018, 123, 45–53. [Google Scholar] [CrossRef]
Figure 1. Venn diagram analyses of the bacterial community (a), archaeal community (b), and fungal community (c) in different forest soils (WBS, WPS, and MOS).
Sustainability 14 08040 g001aSustainability 14 08040 g001b
Figure 2. The abundance of bacterial community, archaeal community, and fungal community in different forest soils (WBS, WPS, and MOS). Values are represented by mean ± standard deviations (n = 3). The a and b above the column chart represent the differences based on one-way ANOVA (n = 3, p < 0.05).
Sustainability 14 08040 g002
Figure 3. Community composition of bacterial community (a), archaeal community (b), and fungal community (c) in different forest soils (WBS, WPS, and MOS). Percentage represents relative abundance of different microbial community.
Sustainability 14 08040 g003
Figure 4. Network structures of the bacterial community (a), archaeal community (b), and fungal community (c) in all forest soils. Lines between two different nodes represent strong positive (green) or negative (yellow) interactions. Each node represents a different microbial community.
Sustainability 14 08040 g004aSustainability 14 08040 g004b
Figure 5. RDA of the structure of dominate bacterial community, archaeal community, fungal community, and environmental factors in all forest soil samples. Different communities are represented by different colors (red graphics mean bacterial community; yellow graphics mean archaeal community; and green graphics mean fungal community).
Sustainability 14 08040 g005
Table 1. Primer pairs and PCR programs for amplifying 16S rRNA and ITS regions.
Target GroupPrimersSequencePCR Conditions
Bacterial 16S rRNA338F5′-ACTCCTACGGGAGGCAGCAG-3′[33]
806R5′-GGACTACHVGGGTWTCTAAT-3′
Archaeal 16S rRNA524F10extF5′-TGYCAGCCGCCGCGGTAA-3′[8]
Arch958RmodR5′-YCCGGCGTTGAVTCCAATT-3′
Fungal ITS regionsITS1F5′-CTTGGTCATTTAGAGGAAGTAA-3′[34]
ITS2R5′-GCTGCGTTCTTCATCGATGC-3′
Table 2. The physical–chemical characteristics of WBS (white birch soil), WPS (white poplar soil), and MOS (Mongolian oak soil).
Typical Forest SoilspHAvailable P (mg kg−1) Available K (mg kg−1)NH4+-N
(mg kg−1)
NO3-N
(mg kg−1)
SOM
(g kg−1)
Total N
(g kg−1)
C/N
WBS4.92 ± 0.06 a33.2 ± 5.82 a97.5 ± 13.1 a28.25 ± 3.89 a8.63 ± 1.85 a78.35 ± 6.54 b4.81 ± 0.15 c9.43 ± 0.49 a
WPS5.03 ± 0.08 ab29.5 ± 5.84 a93.5 ± 13.1 a25.18 ± 3.51 a9.35 ± 1.01 a70.29 ± 3.51 ab4.20 ± 0.55 b9.71 ± 0.14 a
MOS5.12 ± 0.06 b30.6 ± 5.97 a98.1 ± 11.6 a20.36 ± 3.73 a6.76 ± 1.42 a62.25 ± 4.68 a3.58 ± 0.67 a10.12 ± 0.46 a
Values are mean ± standard deviations (n = 3). The superscripts denote differences based on one-way ANOVA (p < 0.05).
Table 3. The α-diversity indices in WBS, WPS, and MOS.
MicrobeTypical Forest SoilsShannon IndexSimpson Index
BacteriaWBS5.41 ± 0.26 a0.0105 ± 0.0008 b
WPS6.00 ± 0.57 a0.0056 ± 0.0007 a
MOS5.87 ± 0.41 a0.0071 ± 0.0006 a
ArchaeaWBS2.47 ± 0.13 a0.1865 ± 0.0109 b
WPS3.08 ± 0.23 b0.1725 ± 0.0086 b
MOS3.39 ± 0.22 b0.0879 ± 0.0087 a
FungiWBS2.96 ± 0.16 b0.1254 ± 0.0075 a
WPS2.15 ± 0.12 a0.2872 ± 0.0130 b
MOS2.34 ± 0.18 a0.2304 ± 0.0101 c
Values are mean ± standard deviations (n = 3). The superscripts denote differences based on one-way ANOVA (p < 0.05).
Table 4. Pearson’s correlation coefficients between soil characteristics and bacteria, archaea, and fungi abundance.
Soil CharacteristicsBacterial AbundanceArchaeal AbundanceFungal AbundancepHAvailable PAvailable KNH4+-NNO3-NSOMTotal NC/N
Bacterial abundance1.00
Archaeal abundance0.927 **1.00
Fungal abundance0.918 **0.952 **1.00
pH0.801 **0.795 *0.799 **1.00
Available P−0.176−0.358−0.326−0.1401.00
Available K−0.236−0.316−0.084−0.1400.9171.00
NH4+-N−0.363−0.244−0.161−0.3010.2350.2351.00
NO3-N−0.461−0.373−0.359−0.6250.3620.3620.5231.00
SOM−0.772 *−0.750 *−0.783 *−0.870 **0.1550.1550.4540.6581.00
Total N−0.755 *−0.705 *−0.715 *−0.899 **0.0470.0470.5850.6120.928 **1.00
C/N0.2270.1090.0890.3970.2660.266−0.493−0.148−0.174−0.5251.00
* Correlation is significant at the 0.05 level. ** Correlation is significant at the 0.01 level.
Publisher’s Note: MDPI stays neutral with regard to jurisdictional claims in published maps and institutional affiliations.

