Abstract
Hydrothermal carbonization makes it possible to transform lignocellulosic biomass into hydrochar, a carbon-rich material that can be used as fuel. Hydrochar has less calorific value than standard coal but generates less ashes during combustion. This study is a pre-feasibility analysis carried out to evaluate technically-economically and environmentally the use of hydrochar as fuel or co-fuel in thermal power plants in Chile. Until now there are no reports about it. The proposal of this work was to study the replacement of coal with a fuel that uses the same equipment and processes in power generation but with less air emission and with an economically profitable change. The results suggest that a plant with a supply of 104 t/h of bituminous coal could be replaced between 18 and 37 t/h of hydrochar, with a reduction of 8 and 27% in NOx and SO2 emissions, a reduction in 7 to 24% in ashes and a marginal increase in CO2 emission. The proposed use of hydrochar was economically profitable, with internal rates of return of up to 40% and with cash flows that reached USD 22 million.
1. Introduction
The search for less polluting energy is a goal that everyone pursues. Chile’s environmental authorities aim to decarbonize the energy matrix by closing all thermal power plants in the country by 2040. For 2016, the energy matrix uses different technologies and fuels to produce electricity. In particular, the use of coal represents 22%, the second-largest, behind natural gas. In turn, the use of coal in thermal power plants is responsible for 44% of the raw electricity generation in the country [1]. However, the medium to short-term closure compromises 13,900 jobs [2]. One way to mitigate the polluting effect of thermal power plants and, at the same time, have a reduced impact on the transition to a less-polluting source than coal would be the use of hydrochar, either as fuel or co-fuel.
Hydrochar is produced through hydrothermal carbonization (HTC), a thermochemical treatment that transforms lignocellulosic biomass into carbon-rich products with multiple applications [3,4,5]. The process is carried out by immersing the biomass in water inside a closed reactor; the biomass-to-water ratio can range from 1:6 to 1:12 since water serves as the reaction medium. In addition, it is necessary to purge any oxygen that could be left inside the reactor; this is typically achieved by circulating nitrogen inside the reactor; the absence of oxygen is crucial so that the reaction intermediates are not oxidized and can follow the pathways leading to the formation of the final products. As for the operating parameters, this process occurs at relatively low temperatures, in the range of 180–350 °C, and under self-generated pressure conditions for times ranging from a few minutes to several hours [6,7,8], at these conditions, the water is in subcritical conditions and its properties as a solvent are improved and acts as a catalyst [9].
The subcritical conditions of the aqueous medium are essential. It allows the water to remain in a liquid state above 100 °C, increasing the viscosity coefficient as the viscosity of water decreases. In addition, the solubility of specific compounds increases, such as cellulose, alcohols and aldehydes, when they would not be under standard conditions. These conditions favor the reactions involved in the hydrothermal carbonization process [9,10].
The reaction mechanisms of the hydrothermal carbonization process are complex and involve many reactions. However, it is possible to establish a simplified reaction route, which is, namely [11,12]:
- Hydrolysis. The cellulose is broken down into monosaccharides such as glucose or pentoses, while hemicellulose is dissociated into hexoses and other polysaccharides. Lignin is converted into different phenols.
- Dehydration. Pentoses and hexoses form furfurals. In addition, hexose reacts to form organic acids. Moreover, just as the name implies, water molecules are also produced.
- Aromatization. The furfurals converted into benzenes, mixing part of the organic acids and other furfurals, thus producing bio-crude.
- Decarboxylation. In this reaction, organic acids are converted to carbon dioxide.
- Polymerization. In this last reaction, the bio-crude condenses into a solid called hydrochar, releasing water molecules.
As mentioned, lignocellulosic biomass is used, which is composed of cellulose, hemicellulose, and lignin. The latter is essential because the higher the lignin composition, the more hydrophobic the biomass will be, and the hydrochar generated from it will have a higher calorific value. An hydrochar with high lignin content implies a high decomposition degree of the other constituents, which means a higher operating temperature of the process. Regarding temperature, hemicellulose decomposes from 180 °C, while cellulose does so at around 200 °C. For lignin, degradation occurs around 260 °C due to aromatic rings in its structure. Otherwise, temperatures close to 600 °C would be required if the biomass to be treated contains a large amount of lignin, as is usual with wood and its different derivatives [9,13,14]. Biomass can be obtained from agricultural, food, and wood wastes. Through the HTC process, it is possible to recirculate the carbon contained in these low-value wastes by potentially converting them into hydrochar, which can be used as fuel, among other applications (such as low-cost capacitors, heavy metal adsorbents, among others) [15].
This study aims to evaluate the technical-economic and environmental pre-feasibility of implementing hydrochar as a substitute fuel, or at least as co-fuel, in thermal power plants in Chile. Until this study, there are no reports about the implementation of HTC in this country for this purpose.
2. Materials and Methods
This study applied the following stages sequentially to carry out the technical-economic and environmental pre-feasibility assessment.
2.1. Thermal Power Plant Selection
The selection of the power plant was based on the following criteria.
- Gaseous emissions. Mainly CO2. The higher the emissions, the more significant contribution to environmental pollution, especially to global warming.
- Size of the plants. A larger capacity plant implies a larger investment capacity in a project.
- Deadline. All thermal power plants will close by 2040 [2], but some will close earlier; therefore, a later closing date would be a greater incentive to solve the problems they cause to the environment without having to close their facilities.
2.2. Biomass Selection
The biomass selection was based, first, on the types of biomasses available close to the power plant location. Then, analogously to the previous stage, a series of criteria were used.
- Annual production. The higher the production, the higher the availability of raw material, and the higher the hydrochar production capacity.
- Calorific value. The properties of hydrochar will depend on the biomass used, so not all hydrochar will have the same properties [7,8].
- Residence time. Since HTC uses batch-type reactors, it is a discontinuous process, so reactor systems that work in parallel will be required to give continuity to it; thus, at shorter residence time, less quantity of necessary equipment, in consequence, lower associated costs.
- Water requirement. In the HTC process, an aqueous medium is required, whose amount of water varies in literature [16,17], which depends on the biomass used. The lower the water requirements, the more convenient it is to select one raw material, considering its importance and value.
- Operating temperature. The lower the operation temperature, the lower the operating costs associated with the HTC process.
- Mass yield. This variable depends on the type of hydrochar obtained from one biomass or other [16,17].
2.3. Study Cases Construction
After selecting the thermal power plant and the biomass as input, five hypothetical cases were built where hydrochar could totally or partially replace the coal feed of the previously chosen thermal power plant.
2.4. Plant and Equipment Design
Subsequently, the unit operations to be carried out in a hydrochar production plant attached to the thermal power plant were defined. The stages considered were the pretreatment of the biomass passing through a grinder to homogenize its particle size, to a mixer to mix it with the process water; the batch reactor system to produce the hydrochar, and even to go through cooling, washing, filtration, drying and pelletizing as posttreatment, as illustrated in the block diagram of Figure 1.
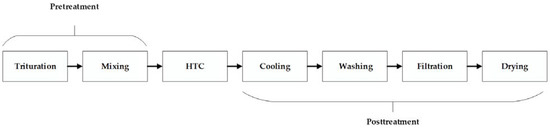
Figure 1.
HTC plant block diagram.
Then, the equipment that will carry out such unit operations were chosen, creating the flowsheet in the next step. Finally, having a flowsheet of the plant, the material and energy balances were carried out both for the plant and for each equipment, to design each of them and define the requirements of raw material, process water, cooling water, and electricity, among others.
2.5. Economic Analysis
At this stage, quotations were made to determine the prices of each equipment and thus obtain the total equipment cost. Subsequently, the total investment cost was estimated by the Lang-Chilton method [18], which considers the following items shown in Table A1. Then, the total cost of production was obtained from estimating the costs [18] of the items shown in Table A2.
Then, the total operating cost (COperation cost), which depends on electricity consumption in the HTC plant (CElectricity), was estimated with the Equation (1) [19]:
The electricity consumption in an HTC plant (CElectricity) in function to coal feed (FProduct), was calculated according to Equation (2) [20]:
All the above is necessary to build the cash flow for each case, projecting a valuable lifetime of 20 years. The following profitability indexes were used to determine the profitability by case:
- Net Present Value (NPV).
- The Internal Rate of Return (IRR) is fixed at 20%.
Thus, with an NPV greater than zero and with an IRR equal to or greater than the Minimum Attractive Rate of Return (MARR), it was considered whether a case is profitable or not.
At the end of the economic analysis, a sensitivity analysis was conducted. It was obtained by performing different cash flows in which energy sale price varies percentagewise between −3.2% and 10%.
2.6. Emission Analysis
The following procedure was carried out to determine the emission factors of both coal and hydrochar and in this way, obtain the emissions generated in each proposed case.
2.6.1. Power Plant Emission Factors
First, the emission factors (E/FC) of CO2, SO2, NOx, the ash production (A/FC) were determined. Next, the raw energy produced by the use of bituminous coal in the power plant (E/F) was estimated using the hourly data declared for the year 2019 on the page of the “National Environmental Enforcement Information System” (Snifa, in Spanish) [21], after having discarded the atypical data in these, the Equations (3) and (4) were used and subsequently an average value of these values was obtained.
Subsequently, the energy efficiency of the power plant (EET) was determined by the higher heating value of coal and the energy generated per flow of coal previously mentioned using Equation (5).
2.6.2. Hydrochar Emission Factors
The hydrochar emission factors were estimated by using the atomic composition percentages on a dry weight basis of the hydrochar from waste eucalyptus bark (PH i) [16], the atomic weights of C (PM C), N (PM N) y S (PM S), the molecular weights of CO2 (PM CO2), NO2 (PM NO2), SO2 (PM SO2) and the percentage of ash in the hydrochar. Then, Equations (6)–(9) were applied to determine the emission factors per flow of hydrochar supplied of CO2 (E/FH CO2), NO2 (E/FH NO2), SO2 (E/FH SO2), and the ash production (A/FH). These equations assume that all the C, N, and S contained in the hydrochar will be converted to CO2, NO2, and SO2, respectively, during combustion.
2.6.3. Flow of Coal and Hydrochar for Each Case
In each of the study cases, the amount of energy produced by the power plant must be the same. Therefore, the carbon flow for each case (FCj) should be calculated based on the amount of hydrochar replaced (FHj). The amount of energy the hydrochar (EPHj) provides is calculated based on its HHV and the energy efficiency reported by the power plant (EET). Then, the average amount of energy generated by the coal () was calculated based on the average flow of this () and the average of the raw amount of energy produced per unit mass of coal (), based on the information reported in the regular operation of the power plant. Finally, the coal flow in each case will be given by the fraction of energy that the coal must deliver. These calculations were made using Equations (10)–(12).
2.6.4. Emissions Produced in Each Case
Having determined the emission factors and the carbon flow in each stage, it proceeded with the calculation of the total emissions in each stage (TEi,j) using the Equation (13):
2.6.5. Emissions Reduction Percentage for Each Case
Using the total emissions of each stage (TEi,j), the percentage reduction of emissions in each stage (RPEi,j) was calculated concerning the average emissions generated by the coal used initially in the thermal power plant, this being calculated using the Equation (14):
3. Results
The results of the technical-economic and environmental evaluation of hydrochar as a potential substitute for coal in thermal power plants are presented below.
3.1. Thermal Power Plant Selection
The database between 2019 and 2020 of The Environment Superintendency of Chile [21] was analyzed to compare the gaseous emissions, plant size and deadline of the 28 thermal power plants. Table 1 summarizes the average raw electricity production (MW), the CO2, SO2, and NOx emissions (t/h), in which the average and maximum values are indicated for each.

Table 1.
Average raw energy production and CO2, SO2, and NOx emissions in all thermopower plants in Chile.
As can be seen in Figure 2, the Santa María de Colbún thermal power plant is in Coronel, Bío-Bío Region, in the south of Chile. It is the largest in the country and the one with the highest emissions of polluting gases. In addition, it does not have an upcoming closing date, so it is chosen as the object of this study.
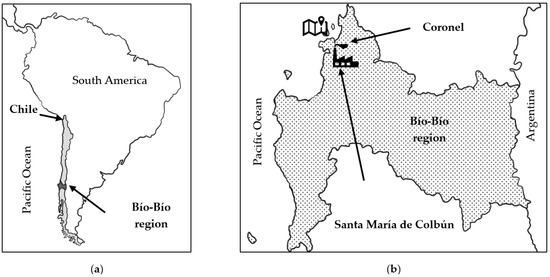
Figure 2.
Location of the thermal power plant. (a) Location respect to South America; (b) Location of Santa María de Colbún in the south of Coronel, Bío-Bío region, Chile.
3.2. Biomass
The biomasses available were agricultural and forest residues since these by-products are two of the most critical industries in the study area.
The potential of biomass from forest residues was reviewed based on a 2018 study on the potential of forest biomass carried out by the Ministry of Energy of Chile, while that of agricultural residues, based on a regional report by VIII region of 2018 by the Ministry of Agriculture of Chile.
The parameters mentioned in the literature were considered regarding the characteristics of hydrochar produced from forest and agricultural residues [10,16,22,23].
Table 2 compares both biomasses and the criteria described in Section 2.2.
Table 2.
Comparison between forest residual and agricultural residuals as biomass for the HTC process.
In principle, both biomasses have their pros and cons; however, taking into consideration how valuable the water resource is and the need to convert a discontinuous process into a continuous one with a batch reactor system working in parallel, it was decided to use forest residues as the biomass for the HTC process.
3.3. Case Construction
As mentioned in the previous section, the amount of forest residues estimated in 2019 was 5,242,169 m3 at the national level. Only in the Bío-Bío region, 1,959,646 m3 of these residues were produced, equivalent to 37.4% of the total at the national level [22].
Assuming that the average density of the wood is 400 kg/m3, it implies that approximately 2,096,867 and 783,858.4 t were produced yearly at the national level and in the Bío-Bío region, respectively. For this region, it is equivalent to a mass flow rate of 89,482 kg/h. In addition, considering a yield of 41.2% of hydrochar and that the bituminous carbon feed-in Santa María de Colbún was an average of 102 t/h for 2020, the following cases (see Table 3) are reached based on the partial replacement of the fuel supplied in the selected thermal power plant. As a consideration, for each case, the total energy produced by the plant must be equal to what it currently produces.
Table 3.
Cases in function to the hypothetical hydrochar feed for Santa María de Colbún.
3.4. Flowsheet of the Plant, Equipment Design and Plant Requirements
The batch reactors were proposed to obtain the hydrochar from forest residues. This equipment is usually used to control the temperature and pressure of the process. Furthermore, to give it continuity, a system made up of units that work in parallel was used. A flashing tower was considered since hydrothermal carbonization reaches pressures well above atmospheric, in addition to the fact that a part of the water will evaporate and be recirculated after condensation and cooling. Next, a tank gives continuity to the posttreatment part of the process. Meanwhile, given the transfer area requirements, tube and shell heat exchangers were used for all cases, and the water used for cooling was reused thanks to the cooling towers. Finally, the filter and dryer were considered a rotary type because they allow continuity of the process with little equipment.
Based on the block diagram in Section 2.4, the flowsheet (Figure 3) was designed in which the different one or multiple units will be found working in parallel; such is the reactor case.
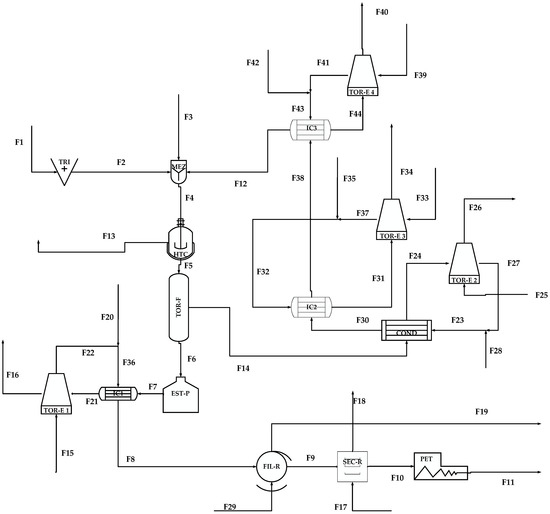
Figure 3.
HTC plant flowsheet.
The equipment chosen for each operation is summarized in Table 4.
Table 4.
Equipment and their tags in the flowsheet.
The pretreatment equipment corresponds to a system of shredders that will make it possible to homogenize the particle size of the incoming biomass (F1). At the same time, the mixers will do their job by mixing what comes out of the shredders (F2), a stream of fresh water (F3) and a water recirculation stream from a recovery zone made up of condensers, which will make it possible to recover a flow of liquid water from the flash tower from F14, by two systems of heat exchangers that will reduce its temperature from 124.7 to 80 °C and 80 °C to 30 °C. In contrast, the three cooling towers will decrease the temperature of the cooling water currents of the exchangers and condensers through the use of dry air.
The stream F4 will carry a mixture of biomass and water in the ratio of 1:10 that will feed the reactor system. Then HTC reaction occurs at 240 °C for 0.5 h. The gaseous product phase (which contains mainly CO2 and traces of methane) goes through F13 and the other products (hydrochar, water and water-soluble compounds) goes through F5. The flash tower allows the mixture to pass from 4.4 MPa to atmospheric pressure, which, as previously said, a stream of water vapor will pass through F14, which recovered as liquid water due to the decrease in pressure, and which is intended to be recirculated.
Then, F6, composed of hydrochar, water and soluble substances, passes through a tank and a heat exchanger to reduce the mixture temperature from 124.7 to 80 °C so that it can operate in the following stages without problems. In this posttreatment stage, there will also be a cooling tower that will reduce the temperature of the process water used by the heat exchangers.
Subsequently, from F8, the cooled hydrochar, water, and soluble mixture will come out, which will reach the rotary filter system to be able to separate the product of interest from the rest of the components of the mixture and reach the drying system, made up of rotary dryers that will eliminate most of the moisture contained in the hydrochar, from 10% to 1%, to enter the pelletizers from F10 and the refined product to exit from F11. The water with the soluble compounds and moisture contained by the hydrochar come out through F19 and F18, respectively.
Finally, the plant requirements for each case, obtained in the mass and energy balances, are summarized in Table 5.
Table 5.
HTC plant’s requirements for each case.
3.5. Equipment Cost, Total Investment Cost, Total Product Cost and Profitability
Table 6 shows the total equipment cost and the total investment cost by the Lang-Chilton method for each case.,
Table 6.
Total equipment and investment cost for each case in USD 1.
As expected, as the percentage of fuel replacement by hydrochar increases, the total investment also increases.
In Table 7, the total cost of the product is shown for each case. It should be noted that, in the energy requirements, it was assumed that the same thermal power plant would supply energy to its attached hydrochar plant.
Table 7.
Total cost of the product for each case, in USD.
It should be noted that as the plant that produces the hydrochar grows in capacity, the costs per kg of product decrease considerably.
Finally, Table 8 summarizes the cash flows for each case, considering a lifespan of 20 years, a tax rate of 27%, financing of 50% and a MARR of 20%.
Table 8.
Cash flow summary for each case.
3.6. Sensitivity Analysis of the Electricity’s Sale Price at the Local Level
The selling price used for previous estimates was 0.217 USD/kWh. Thus, for the sensitivity analysis, variations were made based on said value with percentage increases and decreases until the case with the highest profitability ceased to be profitable and until the worst possible case became profitable.
Table 9 shows the variation of the NPV for each case based on the variations in the sale price of electricity.
Table 9.
Variation of NPV for each case in thousands of USD.
Table 10 shows how the IRR varies depending on the variations in the electricity sale price for each case.
Table 10.
Variations of IRR for each case.
To become profitable, a variation greater than +4% is required for case 5, whose capacity is 11 t/h of hydrochar. On the other hand, a variation of −3.1% in the sale price of electricity causes that case 1, which has a capacity of 37 t/h of hydrochar, to become unprofitable.
3.7. Data of Thermal Power Plant and Emission Factors
The emission factors of coal, its ash production, its energy per mass of coal supplied and its energy efficiency were obtained considering the data available from the thermal plant. It is presented in Table 11.
Table 11.
Parameters of coal supplied to the thermal power plant.
Assuming the coal emission factors just presented, Table 12 shows the flows were considered as the normal operating condition of the thermal power plant.
Table 12.
Emissions generated using coal in the thermal power plant and normal operating parameters.
The data used to determine the hydrochar emission factors are presented in the Table 13 [16].
Table 13.
Data of hydrochar from waste eucalyptus bark.
The emission factors for the selected hydrochar and its ash production were determined by using the data from Table 13 which are presented in Table 14.
Table 14.
Emission factors and ash production for hydrochar.
The higher heating value of the selected hydrochar (Table 14) and the original energy production of the thermal power plant previously presented in Table 12, the coal flow and emissions were determined in each case considering the emission factors presented in this section. It is presented below in Table 15.
Table 15.
Total emission for each stage.
3.8. Percentage of Emissions Reductions
The emission reduction percentages (ERP) in each case are presented below in Table 16. A reduction in ash production was observed. A similar trend was obtained in all the emissions, except for the emission of CO2, which shows a slight increase.
Table 16.
Emissions reductions percentages for each case.
4. Discussion
The technical-economic results show a linear trend regarding hydrochar production, as evidenced in Figure 4, which shows two graphs. The first graph (a) shows how the total investment cost behaves concerning the capacity to produce hydrochar, while the second graph (b) shows how the total production cost behaves. In both cases, there is a proportional relationship between hydrochar production and the total investment and production costs.
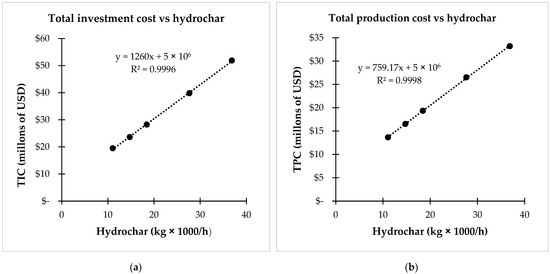
Figure 4.
Graphs. (a) Total investment cost and hydrochar graph; (b) total production cost and hydrochar graph.
This can be attributed to the fact that, even when the amount of equipment in the HTC plant changes non-linearly between the 5 cases studied with some equipment, the total capacities arithmetically increase as hydrochar production does.
The NPV of the 5 cases is expected to exhibit a similar behavior considering that it depends directly on total investment and production costs, which is evidenced in Figure 5. The first graph (a) in this figure shows such expected behavior. However, the second graph (b) shows how IRR behaves compared to hydrochar production, which does not exhibit linear performance. This is interesting given that it is possible to choose which case is more convenient only based on which case provides a more significant increase in the IRR.
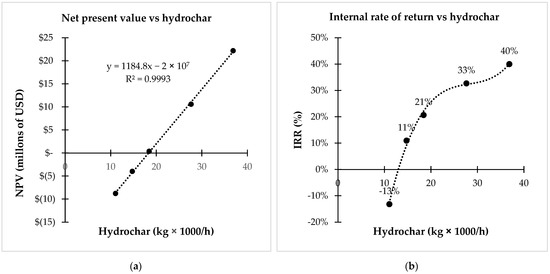
Figure 5.
Graphs. (a) Net present value and hydrochar graph; (b) internal rate of return and hydrochar graph.
Similar results were found in the sensitivity analysis regarding the energy sale price. However, this time both the NPV and IRR showed a linear behavior, as shown in Figure 6.
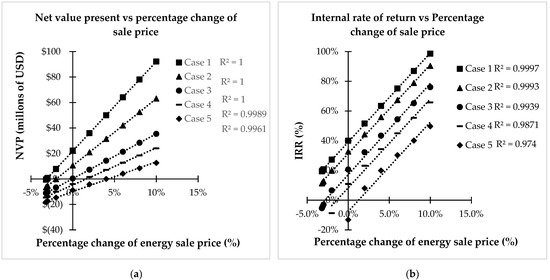
Figure 6.
Sensitivity analysis graphs. (a) Sensitivity analysis for NVP graph. (b) Sensitivity analysis for IRR graph.
The sensitivity analysis suggests a variation close to +4% in the sale price of energy generated with hydrochar, the profitability indicators of a project based on a hydrochar production of 11 t/h indicate that the project is feasible. Meanwhile, with a −3.2% variation in the energy sale price, producing around 38 t/h of hydrochar would be unprofitable.
It can also be seen that when hydrochar production is equal to or greater than 11 t/h, the profitability indicator show that the investment project is profitable.
On the other hand, regarding the results of emissions factors, a marginal increase in CO2 emissions can be observed in combustion coal-hydrochar, although a relatively significant decrease in SO2, NOx, and ashes emissions, which makes sense considering that hydrochar has the most traces of S and N, and that nitrogen oxides come from N2 coming from the air, as shown in Figure 7.
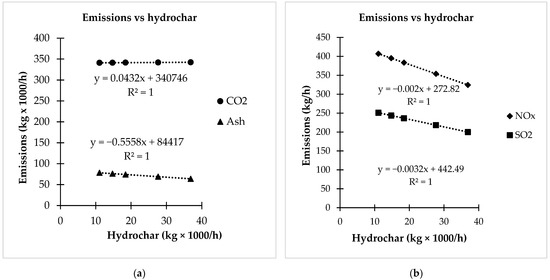
Figure 7.
Emissions vs hydrochar graphs. (a) Emissions of CO2 and ashes. (b) Emissions of NOx and SO2.
5. Conclusions
The hydrochar produced from hydrothermal carbonization using biomass from forest residues has proved economically profitable in Chile if the production is at least 18 t/h of hydrochar. Regarding gaseous emissions, there is a relatively significant reduction in SO2, NOx, and ash emissions. However, the CO2 emission has a marginal increase. The CO2 produced by the combustion of hydrochar is recirculated to the environment, which would imply a zero-carbon footprint for the hydrochar-producing plant, considering that its primary raw material is usually waste with low added value. Future studies should analyze the potential recirculation of the HTC waste process, precisely the liquid fraction, for better sustainable environment management.
Author Contributions
Conceptualization, S.C. and E.P.-C.; methodology, A.B.-M. and A.F.-G.; formal analysis, S.C., E.P.-C., A.B.-M. and A.F.-G.; investigation, A.B.-M. and A.F.-G.; data curation, A.B.-M. and A.F.-G.; writing—original draft preparation, S.C., A.B.-M. and A.F.-G.; writing—review and editing, S.C., A.B.-M., A.F.-G., E.P.-C. and M.L.; visualization, S.C.; supervision, S.C. All authors have read and agreed to the published version of the manuscript.
Funding
This research received no external funding.
Institutional Review Board Statement
Not applicable.
Informed Consent Statement
Not applicable.
Conflicts of Interest
The authors declare no conflict of interest.
Appendix A
Table A1.
Lang-Chilton method to estimate the total investment cost.
Table A1.
Lang-Chilton method to estimate the total investment cost.
| Item | Direct Fixed Capital | Comment |
| 1 | Updated equipment cost | Quotes |
| 2 | Cost of installed equipment | 35% of (1) |
| 3 | Process pipes | 20% of (2) |
| 4 | Instrumentation | 8.5% of (2) |
| 5 | Insulation | 12.5% of (2) |
| 6 | Paintings and finishes | 1.5% of (2) |
| 7 | Electrical installations | 11% of (2) |
| 8 | Steam installations | From matter and energy balance |
| 9 | Water installations | From matter and energy balance |
| 10 | Buildings | Depends on layout |
| 11 | Total fixed capital | (1) + (2) + (3) + … + (10) |
| Item | Indirect fixed capital | Comment |
| 12 | Land value | Local quote |
| 13 | Land preparation | Local quote |
| 14 | Engineering | 10%–17% of (18) |
| 15 | Contractor fees | 10% of (18) |
| 16 | Contingencies and unforeseen | 25% of (18) |
| 17 | Total Indirect fixed capital | (12) + (13) + (14) + (15) + (16) |
| Item | Capitals | Comment |
| 18 | Fixed capital total | (11) + (17) |
| 19 | Working capital | 15% of (20) |
| 20 | Total investment capital | (18) + (19) |
Table A2.
Total cost production items.
Table A2.
Total cost production items.
| Item | Comment | |
|---|---|---|
| I | Manufacturing cost | (A) + (B) + (C) |
| A | Direct production costs | 66% of (III) |
| A1 | Raw materials | From matter and energy balance |
| A2 | Operational staff | |
| A3 | Supervision | |
| A4 | General services (water, energy, etc.) | Form matter and energy balance |
| A5 | Maintenance and reparation | |
| A6 | Operating supplies | Others than raw materials |
| A7 | Laboratory expenses | |
| A8 | Patents and royalties | Between 0% to 8% of TCP |
| B | Indirect productions costs | (B1) + (B2) + (B3) + (B4) + (B5) |
| B1 | Depreciation | Straight line method |
| B2 | Local taxes | Quotes |
| B3 | Insurance | Quotes |
| B4 | leases | Quotes |
| B5 | Financing | |
| C | General expenses | (A2) + (A3) + (A5) |
| II | General business expenses | (D) + (E) + (F) |
| D | Administration | 20% of (A2 + A3 + A5) |
| E | Distribution and sale | 11% of (III) |
| F | Investigation and development | 5% of (III) |
| III | Total cost production | (I) + (II) |
References
- Ministerio de Energía de Chile. Matriz Eléctrica y Generación a Carbón en Chile; Ministerio de Energía de Chile: Santiago, Chile, 2017. [Google Scholar]
- Ministerio de Energía de Chile. Estrategia de Transición Justa en el sector Energía; Ministerio de Energía de Chile: Santiago, Chile, 2019. [Google Scholar]
- Sharma, R.; Jasrotia, K.; Singh, N.; Ghosh, P.; Srivastava, S.; Sharma, N.R.; Singh, J.; Kanwar, R.; Kumar, A. A Comprehensive Review on Hydrothermal Carbonization of Biomass and its Applications. Chem. Afr. 2020, 3, 1–19. [Google Scholar] [CrossRef] [Green Version]
- Parshetti, G.K.; Kent Hoekman, S.; Balasubramanian, R. Chemical, structural and combustion characteristics of carbonaceous products obtained by hydrothermal carbonization of palm empty fruit bunches. Bioresour. Technol. 2013, 135, 683–689. [Google Scholar] [CrossRef]
- Khan, T.A.; Saud, A.S.; Jamari, S.S.; Rahim, M.H.A.; Park, J.-W.; Kim, H.-J. Hydrothermal carbonization of lignocellulosic biomass for carbon rich material preparation: A review. Biomass Bioenergy 2019, 130, 105384. [Google Scholar] [CrossRef]
- Reza, M.T.; Lynam, J.G.; Uddin, M.H.; Coronella, C.J. Hydrothermal carbonization: Fate of inorganics. Biomass Bioenergy 2013, 49, 86–94. [Google Scholar] [CrossRef]
- Wang, L.; Chang, Y.; Li, A. Hydrothermal carbonization for energy-efficient processing of sewage sludge: A review. Renew. Sustain. Energy Rev. 2019, 108, 423–440. [Google Scholar] [CrossRef]
- Cao, X.; Ro, K.S.; Libra, J.A.; Kammann, C.I.; Lima, I.; Berge, N.; Li, L.; Li, Y.; Chen, N.; Yang, J.; et al. Effects of Biomass Types and Carbonization Conditions on the Chemical Characteristics of Hydrochars. J. Agric. Food Chem. 2013, 61, 9401–9411. [Google Scholar] [CrossRef] [PubMed]
- Kambo, H.S.; Dutta, A. A comparative review of biochar and hydrochar in terms of production, physico-chemical properties and applications. Renew. Sustain. Energy Rev. 2015, 45, 359–378. [Google Scholar] [CrossRef]
- Zhang, Z.; Yang, J.; Qian, J.; Zhao, Y.; Wang, T.; Zhai, Y. Biowaste hydrothermal carbonization for hydrochar valorization: Skeleton structure, conversion pathways and clean biofuel applications. Bioresour. Technol. 2021, 324, 124686. [Google Scholar] [CrossRef] [PubMed]
- Ischia, G.; Fiori, L. Hydrothermal Carbonization of Organic Waste and Biomass: A Review on Process, Reactor, and Plant Modeling. Waste Biomass Valorizat. 2021, 12, 2797–2824. [Google Scholar] [CrossRef]
- Kruse, A.; Funke, A.; Titirici, M.M. Hydrothermal conversion of biomass to fuels and energetic materials. Curr. Opin. Chem. Biol. 2013, 17, 515–521. [Google Scholar] [CrossRef] [PubMed]
- Krylova, A.Y.; Zaitchenko, V.M. Hydrothermal Carbonization of Biomass: A Review. Solid Fuel Chem. 2018, 52, 91–103. [Google Scholar] [CrossRef]
- Zhang, C.; Ma, X.; Chen, X.; Tian, Y.; Zhou, Y.; Lu, X.; Huang, T. Conversion of water hyacinth to value-added fuel via hydrothermal carbonization. Energy 2020, 197, 117193. [Google Scholar] [CrossRef]
- Fang, J.; Zhan, L.; Ok, Y.S.; Gao, B. Minireview of potential applications of hydrochar derived from hydrothermal carbonization of biomass. J. Ind. Eng. Chem. 2018, 57, 15–21. [Google Scholar] [CrossRef]
- Gao, P.; Zhou, Y.; Meng, F.; Zhang, Y.; Liu, Z.; Zhang, W.; Xue, G. Preparation and characterization of hydrochar from waste eucalyptus bark by hydrothermal carbonization. Energy 2016, 97, 238–245. [Google Scholar] [CrossRef]
- Wang, G.; Zhang, J.; Lee, J.-Y.; Mao, X.; Ye, L.; Xu, W.; Ning, X.; Zhang, N.; Teng, H.; Wang, C. Hydrothermal carbonization of maize straw for hydrochar production and its injection for blast furnace. Appl. Energy 2020, 266, 114818. [Google Scholar] [CrossRef]
- Peters, M.S.; Timmerhaus, K.D.; West, R.E. Plant Design and Economics for Chemical Engineers; McGraw-Hill Chemical Engineering Series; McGraw-Hill Education: Berkshire, UK, 2003; ISBN 9780072392661. [Google Scholar]
- Quiroga, C.; Rudnick, H. Tecnologías Modernas de Plantas Termoeléctricas a Carbón, Impacto en el Medio Ambiente y Costos; Pontificia Universidad Católica de Chile: Santiago, Chile, 2008. [Google Scholar]
- Lucian, M.; Fiori, L. Hydrothermal Carbonization of Waste Biomass: Process Design, Modeling, Energy Efficiency and Cost Analysis. Energies 2017, 10, 211. [Google Scholar] [CrossRef] [Green Version]
- Sistema Nacional de Información de Fiscalización Ambiental. Available online: https://snifa.sma.gob.cl/DatosAbiertos (accessed on 24 April 2021).
- Ministerio de Energía de Chile Potencial de Biomasa Forestal. Available online: https://energia.gob.cl/sites/default/files/estudio_potencial_biomasa_forestal.pdf (accessed on 10 March 2021).
- Ministerio de Agricultura de Chile ODEPA: Información Regional—Bio Bio. Available online: https://www.odepa.gob.cl/wp-content/uploads/2017/12/Biobio.pdf (accessed on 10 March 2021).
Publisher’s Note: MDPI stays neutral with regard to jurisdictional claims in published maps and institutional affiliations. |
© 2022 by the authors. Licensee MDPI, Basel, Switzerland. This article is an open access article distributed under the terms and conditions of the Creative Commons Attribution (CC BY) license (https://creativecommons.org/licenses/by/4.0/).