
Examining the Relationship between Rural and Urban Populations’ Access to Electricity and Economic Growth: A New Evidence

 ,
,  , and
, and
Abstract
:1. Introduction
2. Existing Literature
3. Materials and Methods
3.1. Econometric Model and Data Sources
3.2. Granger Causality Technique under Vector Error Correction Model (VECM)
4. Empirical Outcomes and Discussion
4.1. Descriptive Statistics and Variables Correlation
4.2. Unit Root Testing amid Variables
4.3. Bounds Test to Cointegration
4.4. Symmetric (ARDL) Technique Outcomes
4.5. Granger Causality Test under VECM Outcomes
5. Conclusions and Recommendations
Author Contributions
Funding
Institutional Review Board Statement
Informed Consent Statement
Data Availability Statement
Acknowledgments
Conflicts of Interest
References
- Chen, Y.; Fang, Z. Industrial electricity consumption, human capital investment and economic growth in Chinese cities. Econ. Model. 2018, 69, 205–219. [Google Scholar] [CrossRef]
- Shengfeng, X.; Sheng, X.M.; Tianxing, Z.; Xuelli, Z. The relationship between electricity consumption and economic growth in China. Phys. Procedia 2012, 24, 56–62. [Google Scholar] [CrossRef] [Green Version]
- Zhang, C.; Zhou, K.; Yang, S.; Shao, Z. On electricity consumption and economic growth in China. Renew. Sustain. Energy Rev. 2017, 76, 353–368. [Google Scholar] [CrossRef]
- Shiu, A.; Lam, P.-L. Electricity consumption and economic growth in China. Energy Policy 2004, 32, 47–54. [Google Scholar] [CrossRef]
- Wang, S.S.; Zhou, D.Q.; Zhou, P.; Wang, Q.W. CO2 emissions, energy consumption and economic growth in China: A panel data analysis. Energy Policy 2011, 39, 4870–4875. [Google Scholar] [CrossRef]
- Zaman, M.; Shaheen, F.; Haider, A.; Qamar, S. Examining relationship between electricity consumption and its major determinants in Pakistan. Int. J. Energy Econ. Policy 2015, 5, 998–1009. [Google Scholar]
- Hirsh, R.F.; Koomey, J.G. Electricity consumption and economic growth: A new relationship with significant consequences? Electr. J. 2015, 28, 72–84. [Google Scholar] [CrossRef]
- Wolde-Rufael, Y. Electricity consumption and economic growth: A time series experience for 17 African countries. Energy Policy 2006, 34, 1106–1114. [Google Scholar] [CrossRef]
- Burke, P.; Stern, D.; Bruns, S.B. The impact of electricity on economic development: A macroeconomic perspective. Int. Rev. Environ. Resour. Econ. 2018, 12, 85–127. [Google Scholar] [CrossRef]
- Chang, C.-C. A multivariate causality test of carbon dioxide emissions, energy consumption and economic growth in China. Appl. Energy 2010, 87, 3533–3537. [Google Scholar] [CrossRef]
- Yuan, J.; Zhao, C.; Yu, S.; Hu, Z. Electricity consumption and economic growth in China: Cointegration and co-feature analysis. Energy Econ. 2007, 29, 1179–1191. [Google Scholar] [CrossRef]
- Wang, Y.; Wang, Y.; Zhou, J.; Zhu, X.; Lu, G. Energy consumption and economic growth in China: A multivariate causality test. Energy Policy 2011, 39, 4399–4406. [Google Scholar] [CrossRef]
- Zhang, C.; Su, B.; Zhou, K.; Yang, S. Analysis of electricity consumption in China (1990–2016) using index decomposition and decoupling approach. Jour. of Clea. Prod. 2019, 224–235. [Google Scholar] [CrossRef]
- Lin, B.; Liu, C. Why is electricity consumption inconsistent with economic growth in China? Energy Policy 2016, 88, 310–316. [Google Scholar] [CrossRef]
- Apergis, N.; Payne, J.E. Renewable and non-renewable electricity consumption–growth nexus: Evidence from emerging market economies. Appl. Energy 2011, 88, 5226–5230. [Google Scholar] [CrossRef]
- Chen, S.-T.; Kuo, H.-I.; Chen, C.-C. The relationship between GDP and electricity consumption in 10 Asian countries. Energy Policy 2007, 35, 2611–2621. [Google Scholar] [CrossRef]
- Džananović, E.; Dacić-Lepara, S. The relationship between GDP and electricity consumption in Southeast European countries. In Advanced Technologies, Systems and Applications; Springer: Cham, Switzerland, 2017; pp. 207–215. [Google Scholar] [CrossRef]
- Bildirici, M.; Bakirtas, T.; Kayıkçı, F. Economic growth and electricity consumption: Auto regressive distributed lag analysis. J. Energy S. Afr. 2012, 23, 29–45. [Google Scholar] [CrossRef]
- Ferguson, R.; Wilkinson, W.; Hill, R. Electricity use and economic development. Energy Policy 2000, 28, 923–934. [Google Scholar] [CrossRef]
- He, Y.; Guang, F.; Wang, M. The efficiency of electricity-use of China and its influencing factors. Energy 2018, 163, 258–269. [Google Scholar] [CrossRef]
- Azam, A.; Rafiq, M.; Shafique, M.; Yuan, J. Renewable electricity generation and economic growth nexus in developing countries: An ARDL approach. Econ. Res. Ekon. Istraž. 2021, 34, 2423–2446. [Google Scholar] [CrossRef]
- Chen, Y.; Wang, Z.; Zhong, Z. CO2 emissions, economic growth, renewable and non-renewable energy production and foreign trade in China. Renew. Energy 2019, 131, 208–216. [Google Scholar] [CrossRef]
- Zafar, M.W.; Shahbaz, M.; Hou, F.; Sinha, A. From nonrenewable to renewable energy and its impact on economic growth: The role of research & development expenditures in Asia-Pacific Economic Cooperation countries. J. Clean. Prod. 2019, 212, 1166–1178. [Google Scholar] [CrossRef]
- Mohapatra, G.; Giri, A.K. Examining the relationship between electricity consumption, economic growth, energy prices and technology development in India. Indian Econ. J. 2020, 68, 515–534. [Google Scholar] [CrossRef]
- Kahouli, B. The causality link between energy electricity consumption, CO2 emissions, R&D stocks and economic growth in Mediterranean countries (MCs). Energy 2018, 145, 388–399. [Google Scholar] [CrossRef]
- Smulders, S.; de Nooij, M. The impact of energy conservation on technology and economic growth. Resour. Energy Econ. 2003, 25, 59–79. [Google Scholar] [CrossRef] [Green Version]
- Asghar, Z. Energy-GDP relationship: A causal analysis for the five countries of South Asia. Appl. Econom. Int. Dev. 2008, 8, 167–180. [Google Scholar]
- Gertler, P.J.; Lee, K.; Mobarak, A.M. Electricity reliability and economic development in cities: A microeconomic perspective. J. Public Econ. 2017, 126, 64–73. [Google Scholar]
- Allcott, H.; Collard-Wexler, A.; O’Connell, S.D. How do electricity shortages affect industry? Evidence from India. Am. Econ. Rev. 2016, 106, 587–624. [Google Scholar] [CrossRef] [Green Version]
- Toman, M.T.; Jemelkova, B. Energy and economic development: An assessment of the state of knowledge. Energy J. 2003, 24, 93–112. [Google Scholar] [CrossRef]
- Nakićenović, N. Freeing energy from carbon. Daedalus 1996, 125, 95–112. [Google Scholar]
- Sharif, A.; Raza, S.A. Dynamic relationship between urbanization, energy consumption and environmental degradation in Pakistan: Evidence from structure break testing. J. Manag. Sci. 2016, 3, 3–23. [Google Scholar] [CrossRef] [Green Version]
- Raza, S.A.; Jawaid, S.T.; Siddiqui, M.H. Electricity consumption and economic growth in South Asia. South Asia Econ. J. 2016, 17, 200–215. [Google Scholar] [CrossRef]
- Ogundipe, A.A.; Akinyemi, O.; Ogundipe, M.O. Electricity consumption and economic development in Nigeria. Int. J. Energy Econ. Policy 2016, 6, 134–143. [Google Scholar] [CrossRef] [Green Version]
- Aneja, R.; Banday, U.J.; Hasnat, T.; Koçoğlu, M. Renewable and non-renewable energy consumption and economic growth: Empirical evidence from panel error correction model. Jindal J. Bus. Res. 2017, 6, 76–85. [Google Scholar] [CrossRef]
- Kahia, M.; Ben Aïssa, M.S.; Charfeddine, L. Impact of renewable and non-renewable energy consumption on economic growth: New evidence from the MENA Net Oil Exporting Countries (NOECs). Energy 2016, 116, 102–115. [Google Scholar] [CrossRef]
- Afshar, O.; Saidur, R.; Hasanuzzaman, M.; Jameel, M. A review of thermodynamics and heat transfer in solar refrigeration system. Renew. Sustain. Energy Rev. 2012, 16, 5639–5648. [Google Scholar] [CrossRef]
- Daut, M.A.M.; Hassan, M.Y.; Abdullah, H.; Rahman, H.A.; Abdullah, P.; Hussin, F. Building electrical energy consumption forecasting analysis using conventional and artificial intelligence methods: A review. Renew. Sustain. Energy Rev. 2017, 70, 1108–1118. [Google Scholar] [CrossRef]
- Mohammadi, M.; Noorollahi, Y.; Mohammadi-Ivatloo, B.; Yousefi, H. Energy hub: From a model to a concept—A review. Renew. Sustain. Energy Rev. 2017, 80, 1512–1527. [Google Scholar] [CrossRef]
- Sepehr, M.; Eghtedaei, R.; Toolabimoghadam, A.; Noorollahi, Y.; Mohammadi, M. Modeling the electrical energy consumption profile for residential buildings in Iran. Sustain. Cities Soc. 2018, 41, 481–489. [Google Scholar] [CrossRef]
- Engle, R.F.; Granger, C.W.J. Co-integration and error correction: Representation, estimation, and testing. Econometrica J. Econom. Soc. 1987, 55, 251–276. [Google Scholar] [CrossRef]
- Pesaran, M.H.; Shin, Y. An Autoregressive Distributed Lag Modelling Approach to Cointegration Analysis; University of Cambridge: Cambridge, UK, 1995. [Google Scholar]
- Johansen, S.; Juselius, K. Maximum likelihood estimation and inference on cointegration—With applications to the demand for money. Oxf. Bull. Econ. Stat. 1990, 52, 169–210. [Google Scholar] [CrossRef]
- Pesaran, M.H.; Shin, Y.; Smith, R.J. Bounds testing approaches to the analysis of level relationships. J. Appl. Econom. 2001, 16, 289–326. [Google Scholar] [CrossRef]
- Fuller, W.A. Distribution of the estimators for autoregressive time series with a unit root. J. Am. Stat. Assoc. 1979, 74, 427–431. [Google Scholar]
- Phillips, P.C.; Perron, P. Testing for a unit root in time series regression. Biometrika 1988, 75, 335–346. [Google Scholar] [CrossRef]
- Dwyer, G.P. The Johansen Tests for Cointegration. White Paper, 1–7. 2015. Available online: http://jerrydwyer.com/pdf/Clemson/Cointegration.pdf (accessed on 20 May 2022).
- Ashraf, Z.; Javid, A.Y.; Javid, M. Electricity consumption and economic growth: Evidence from Pakistan. Econ. Bus. Lett. 2013, 2, 21–32. [Google Scholar] [CrossRef] [Green Version]
- Kim, Y.S. Electricity consumption and economic development: Are countries converging to a common trend? Energy Econ. 2015, 49, 192–202. [Google Scholar] [CrossRef]
- Zhou, Y.; Liu, Y.; Wu, W.; Li, Y. Effects of rural–urban development transformation on energy consumption and CO 2 emissions: A regional analysis in China. Renew. Sustain. Energy Rev. 2015, 52, 863–875. [Google Scholar] [CrossRef]
- Zhang, Y.-J.; Peng, Y.-L.; Ma, C.-Q.; Shen, B. Can environmental innovation facilitate carbon emissions reduction? Evidence from China. Energy Policy 2017, 100, 18–28. [Google Scholar] [CrossRef]
- Dong, X.-Y.; Hao, Y. Would income inequality affect electricity consumption? Evidence from China. Energy 2018, 142, 215–227. [Google Scholar] [CrossRef]
- Yoo, S.-H.; Lee, J.-S. Electricity consumption and economic growth: A cross-country analysis. Energy Policy 2010, 38, 622–625. [Google Scholar] [CrossRef]
- Belaïd, F.; Zrelli, M.H. Renewable and non-renewable electricity consumption, environmental degradation and economic development: Evidence from Mediterranean countries. Energy Policy 2019, 133, 110929. [Google Scholar] [CrossRef]
- Aydin, M. Renewable and non-renewable electricity consumption–economic growth nexus: Evidence from OECD countries. Renew. Energy 2019, 136, 599–606. [Google Scholar] [CrossRef]
- Phimphanthavong, H. The impacts of economic growth on environmental conditions in Laos. Int. J. Bus. Manag. Econ. Res. 2013, 4, 766–774. [Google Scholar]
- Osobajo, O.; Otitoju, A.; Otitoju, M.; Oke, A. The impact of energy consumption and economic growth on carbon dioxide emissions. Sustainability 2020, 12, 7965. [Google Scholar] [CrossRef]
- Rehman, A.; Radulescu, M.; Ma, H.; Dagar, V.; Hussain, I.; Khan, M.K. The impact of globalization, energy use, and trade on ecological footprint in Pakistan: Does environmental sustainability exist? Energies 2021, 14, 5234. [Google Scholar] [CrossRef]
- Sharif, A.; Raza, S.A.; Ozturk, I.; Afshan, S. The dynamic relationship of renewable and nonrenewable energy consumption with carbon emission: A global study with the application of heterogeneous panel estimations. Renew. Energy 2019, 133, 685–691. [Google Scholar] [CrossRef]
- Saidi, K.; Rahman, M.M.; Amamri, M. The causal nexus between economic growth and energy consumption: New evidence from global panel of 53 countries. Sustain. Cities Soc. 2017, 33, 45–56. [Google Scholar] [CrossRef]
- Wang, Y. The analysis of the impacts of energy consumption on environment and public health in China. Energy 2010, 35, 4473–4479. [Google Scholar] [CrossRef]
- Muhammad, F.; Karim, R.; Muhammad, K.; Asghar, A. Population density, CO2 emission and energy consumption in Pakistan: A multivariate analysis. Int. J. Energy Econ. Policy 2020, 10, 250. [Google Scholar] [CrossRef]


| LnECG | LnAEP | LnAERP | LnAEUP | LnENUS | |
|---|---|---|---|---|---|
| Mean | 2.220 | 4.574 | 4.559 | 4.603 | 7.146 |
| Median | 2.235 | 4.577 | 4.559 | 4.603 | 7.082 |
| Maximum | 2.655 | 4.605 | 4.605 | 4.605 | 7.743 |
| Minimum | 1.362 | 4.524 | 4.496 | 4.597 | 6.602 |
| Std. Dev. | 0.277 | 0.026 | 0.035 | 0.002 | 0.423 |
| Skewness | −0.731 | −0.386 | −0.162 | −0.866 | 0.173 |
| Kurtosis | 4.523 | 1.883 | 1.766 | 2.492 | 1.374 |
| Jarque-Bera | 5.207 | 2.153 | 1.899 | 3.803 | 3.224 |
| Probability | 0.073 | 0.340 | 0.386 | 0.149 | 0.199 |
| LnECG | LnAEP | LnAERP | LnAEUP | LnENUS | |
|---|---|---|---|---|---|
| LnECG | (1.000) | −0.140 | −0.187 | −0.074 | −0.188 |
| LnAEP | −0.140 | (1.000) | 0.993 | 0.958 | 0.953 |
| LnAERP | −0.187 | 0.993 | (1.000) | 0.934 | 0.969 |
| LnAEUP | −0.074 | 0.958 | 0.934 | (1.000) | 0.849 |
| LnENUS | −0.188 | 0.953 | 0.969 | 0.849 | (1.000) |
| DF-GLS Tests (at the Level) I (0) | |||||
|---|---|---|---|---|---|
| LnECG | LnAEP | LnAERP | LnAEUP | LnENUS | |
| Probability values * with Test statistics | −1.998 (0.056) | −1.122 (0.273) | −0.786 (0.440) | −0.615 (0.544) | −1.753 (0.101) |
| DF-GLS Tests at First Difference I (1) | |||||
| Probability values * with Test statistics | −0.738 (0.008) | −0.392 (0.007) | −5.506 (0.000) | −6.998 (0.000) | −2.059 (0.050) |
| P-P Test (at the Level) I (0) | |||||
| Probability values * with Test statistics | −3.962 (0.005) | −4.039 (0.666) | −2.012 (0.279) | −4.361 (0.002) | −0.008 (0.949) |
| P-P Test at First Difference I (1) | |||||
| Probability values * with Test statistics | −8.359 (0.000) | −1.182 (0.004) | −5.386 (0.000) | −7.000 (0.000) | −2.786 (0.074) |
| [F-Bounds Testing] | Founds no Levels Relationship at Null Hypothesis | |||
|---|---|---|---|---|
| [Critical Values] | [Lower Bound I (0)] | [Upper Bound I (1)] | ||
| F-statistic value | [5.486] | [10%] | 2.2 | 3.09 |
| [5%] | 2.56 | 3.49 | ||
| [2.5%] | 2.88 | 3.87 | ||
| [1%] | 3.29 | 4.37 | ||
| Trace Test | ||||
|---|---|---|---|---|
| E-Value | T-Statistic | C-Values at (0.05) | Prob. Values ** | Hypo-No. of CE(s) |
| 0.814 | 103.962 | 69.818 | 0.000 | None * |
| 0.688 | 60.126 | 47.856 | 0.002 | At most 1 * |
| 0.526 | 29.780 | 29.797 | 0.050 | At most 2 |
| 0.225 | 10.322 | 15.494 | 0.256 | At most 3 |
| 0.132 | 3.694 | 3.841 | 0.054 | At most 4 |
| Maximum Eigenvalue Test | ||||
| E-Value | Max-Eigen Statistic | C-Values at (0.05) | Prob. Values ** | Hypo-No. of CE(s) |
| 0.814 | 43.835 | 33.876 | 0.002 | None * |
| 0.688 | 30.345 | 27.584 | 0.021 | At most 1 * |
| 0.526 | 19.458 | 21.131 | 0.084 | At most 2 |
| 0.225 | 6.627 | 14.264 | 0.534 | At most 3 |
| 0.132 | 3.694 | 3.841 | 0.054 | At most 4 |
| Short-Run Dynamics | ||||
|---|---|---|---|---|
| Variables | Coefficients | Standard Error | Test Statistic | p-Values |
| C | −173.126 | 151.376 | −1.143 | 0.269 |
| LnGDPG(−1) | −0.492 | 0.123 | −3.976 | 0.001 |
| LnAEP | 8.038 | 10.985 | 0.731 | 0.004 |
| LnAERP | −14.125 | 7.547 | −1.871 | 0.079 |
| LnAEUP | 43.196 | 37.743 | 1.144 | 0.000 |
| LnENUS(−1) | 0.409 | 0.310 | 1.317 | 0.007 |
| D(ENUS) | 2.047 | 0.660 | 3.100 | 0.006 |
| CointEq(−1) | −0.492 | 0.074 | −6.572 | 0.000 |
| Long-run Dynamics | ||||
| Variables | Coefficients | Standard Error | Test Statistic | p-Values |
| LnAEP | 16.334 | 22.840 | 0.715 | 0.005 |
| LnAERP | −28.704 | 14.646 | −1.959 | 0.077 |
| LnAEUP | 87.776 | 77.554 | 1.131 | 0.000 |
| LnENUS | 0.832 | 0.546 | 1.522 | 0.047 |
| C | −351.800 | 316.662 | −1.110 | 0.283 |
| Stability Tests | ||||
| R2 Log likelihood Prob(F-statistic) Schwarz criterion D-Watson stat | 0.864 28.105 0.000 −1.489 2.112 | Adjusted R2 F-statistic AIC HQC | 0.813 17.017 −1.835 −1.748 | |
| Tests | F-Statistics | Prob. Values |
|---|---|---|
| [Serial Correlation LM Test of Breusch–Godfrey] | 0.367 | 0.698 |
| [Harvey Heteroskedasticity Test] | 0.479 | 0.813 |
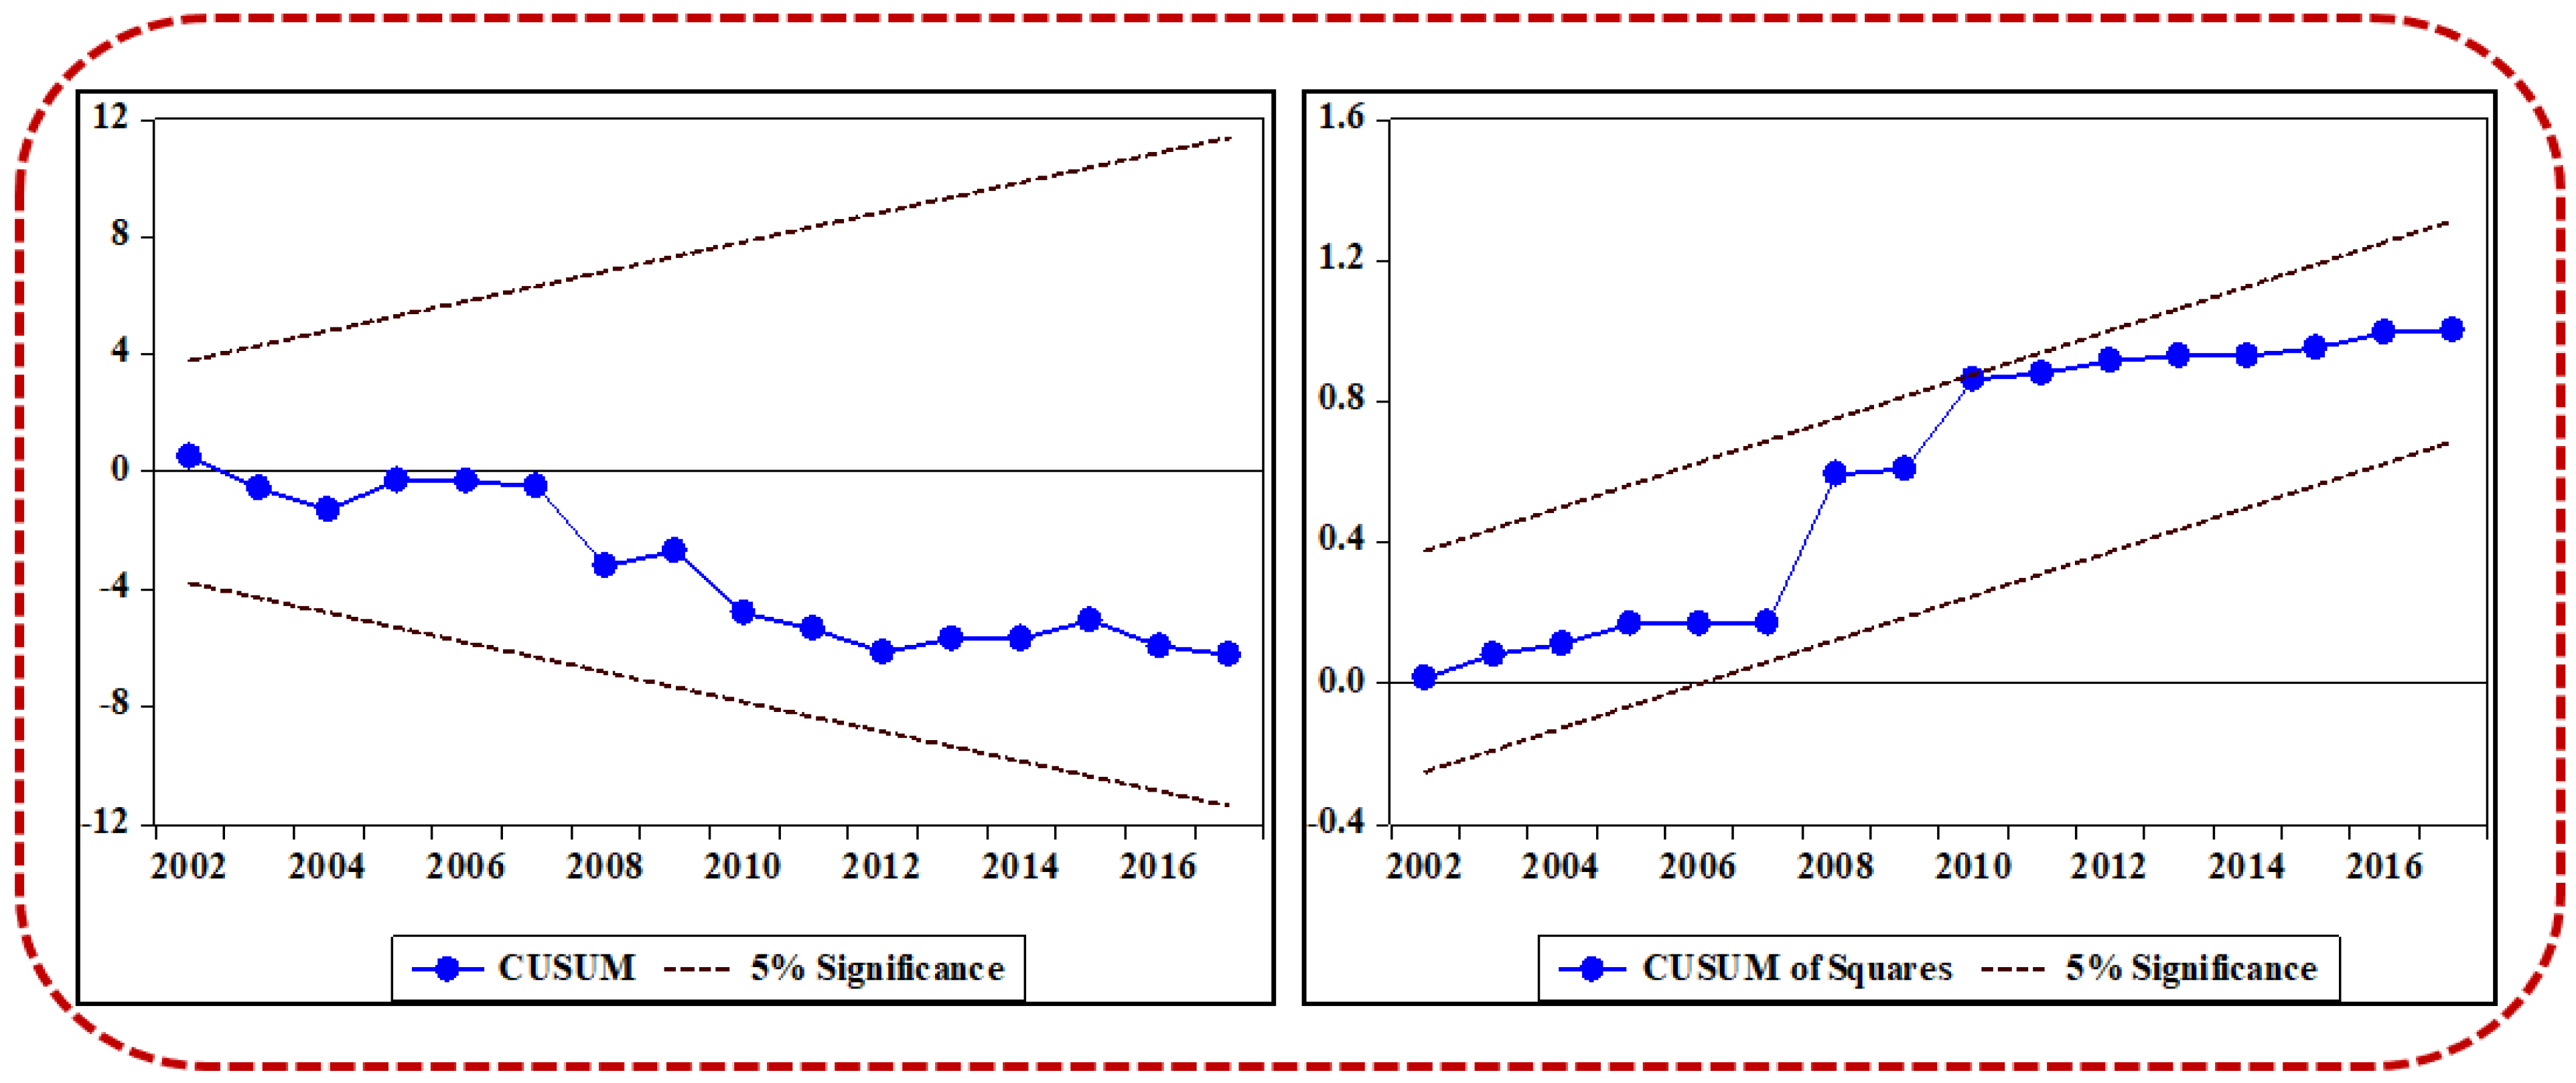
| [CUSUM test] | Stable | |
| [CUSUM of Squares test] | Stable | |
| Dependent Variables | Independent Variables | ||||
|---|---|---|---|---|---|
| ΔLnECG | ΔLnAEP | ΔLnAERP | ΔLnAEUP | ΔLnENUS | |
| ΔLnECG | - | 2.674 | 5.774 ** | 0.000 | 0.719 ** |
| ΔLnAEP | 1.255 | - | 5.094 ** | 1.410 | 2.047 |
| ΔLnAERP | 0.593 | 6.586 | - | 0.936 | 1.399 |
| ΔLnAEUP | 0.235 * | 1.781 | 3.071 | - | 1.740 |
| ΔLnENUS | 0.898 | 2.489 | 2.374 * | 0.704 | - |
Publisher’s Note: MDPI stays neutral with regard to jurisdictional claims in published maps and institutional affiliations. |
© 2022 by the authors. Licensee MDPI, Basel, Switzerland. This article is an open access article distributed under the terms and conditions of the Creative Commons Attribution (CC BY) license (https://creativecommons.org/licenses/by/4.0/).
Share and Cite
Milin, I.A.; Mungiu Pupazan, M.C.; Rehman, A.; Chirtoc, I.E.; Ecobici, N. Examining the Relationship between Rural and Urban Populations’ Access to Electricity and Economic Growth: A New Evidence. Sustainability 2022, 14, 8125. https://doi.org/10.3390/su14138125
Milin IA, Mungiu Pupazan MC, Rehman A, Chirtoc IE, Ecobici N. Examining the Relationship between Rural and Urban Populations’ Access to Electricity and Economic Growth: A New Evidence. Sustainability. 2022; 14(13):8125. https://doi.org/10.3390/su14138125
Chicago/Turabian StyleMilin, Ioana Anda, Mariana Claudia Mungiu Pupazan, Abdul Rehman, Irina Elena Chirtoc, and Nicolae Ecobici. 2022. "Examining the Relationship between Rural and Urban Populations’ Access to Electricity and Economic Growth: A New Evidence" Sustainability 14, no. 13: 8125. https://doi.org/10.3390/su14138125