Article

Uplift Behavior of Pipelines Buried at Various Depths in Spatially Varying Clayey Seabed

1
State Key Laboratory of Water Resources and Hydropower Engineering Science, Institute of Engineering Risk and Disaster Prevention, Wuhan University, 299 Bayi Road, Wuhan 430072, China
2
Department of Civil Engineering and Mechanics, Faculty of Engineering, China University of Geoscience (Wuhan), Wuhan 430074, China
3
School of Qilu Transportation, Shandong University, 12550 East Second Ring Road, Jinan 250002, China
4
Shenzhen Research Institute, Shandong University, A301 Virtual University Park, South District of Shenzhen, Shenzhen 518057, China
5
Key Laboratory of Geotechnical and Underground Engineering of Ministry of Education, Department of Geotechnical Engineering, College of Civil Engineering, Tongji University, China No. 1239 Siping Road, Shanghai 200092, China
6
Hebei Haoyu Engineering Technology Consulting Co., Ltd., No. 238 Jin Zhong He Street, Tianjin 300250, China
7
School of Civil Engineering, Chongqing University, No. 83 Shabei Street, Chongqing 400045, China
*
Author to whom correspondence should be addressed.
Sustainability 2022, 14(13), 8139; https://doi.org/10.3390/su14138139
Submission received: 25 May 2022 / Revised: 13 June 2022 / Accepted: 24 June 2022 / Published: 4 July 2022

Abstract

:
The behavior of buried offshore pipelines subjected to upheaval buckling has attracted much attention in recent years. Numerous researchers have made great efforts to investigate the influence of different soil cover depth ratios, soil strengths and pipe-soil interfaces on failure mechanisms and bearing capacities during pipeline uplift. However, attention to soil spatial variability has been relatively limited. To address this gap, a random small-strain finite element analysis has been conducted and reported in this paper to evaluate the influence of the random distribution of soil strength on pipe uplift response. The validity of the numerical model was verified by comparison with the results presented in the previous literature. The spatial variation of soil strength was simulated by a random field. The effect of soil variability on the failure mechanism was determined by comparing the displacement contours of each random realization. Probabilistic analyses were performed on the random uplift capacity obtained by a series of Monte Carlo simulations, and the relationship between the failure probability and the safety factor was also determined. The findings of the present work might serve as a reference for the safety designs of pipelines.

1. Introduction

Offshore oil and gas projects have experienced rapid growth in recent decades. Pipelines, as a safe, effective and swift transportation means, have been deployed widely for the conveyance of hydrocarbons from offshore fields to other processing facilities [1,2,3]. Generally, the pipelines are buried into the seabed to diminish external forces acting on them, which are caused by waves or human activities (see Figure 1). The transportation of fluids through the pipeline under very high temperatures and pressure conditions leads to thermal expansion, thus making it susceptible to buckling [4,5]. For buried pipes, upheaval buckling is a major current focus for oil and gas projects and, in this scenario, its resistance is affected by the shear strength and the submerged unit weight of the soil cover.
Numerous works have been conducted to investigate the uplift capacity and failure mechanism for pipelines, including experimental works and numerical modeling [6,7,8,9]. In existing studies, the influence of soil weight, soil cover depth, pipeline-soil interface and other factors has been extensively investigated. For instance, Liu et al. [9] conducted vertical pullout tests on pipelines of different diameters and at different buried depths and proposed a nonlinear soil resistance model to simulate the bearing capacity of the pipeline. Brennan et al. [8] carried out a series of centrifuge experiments in bulk clay to evaluate the effect of backfill on the uplift capacity. Maitra et al. [7] performed small-strain finite element analyses to investigate the influence of soil cover depths, soil–pipeline interfaces and soil properties on the uplift behavior of pipelines in clay and proposed a generalized framework to evaluate pipeline uplift capacity. As for the failure mechanism of soil due to pipeline uplift, many scholars have pointed out that it can be divided into global soil failure and local soil failure [5]. A shallowly buried pipeline is prone to the former failure mode, in which the failure zone extends up to the seabed surface. As the soil cover depth increases, the latter failure mode occurs, characterized by soil flow around the pipeline. And there is a specific soil cover depth where failure mode transitions often take place.
Previous studies have undoubtedly contributed to readers’ understanding of the upward buckling of pipelines. However, the soil in most of these analyses is treated as an idealized material, with homogeneous or linear increases in shear strength. In nature, the inherent properties of soil deposits generally vary spatially [10,11,12,13,14,15,16,17,18]. It has been widely recognized that such spatial variability in soil parameters can cause the mechanical behaviors of offshore structures to deviate from the results of deterministic analyses. Frequently, the spatial distributions of soil properties are treated as a random field and several random finite element analyses have been undertaken to explore the responses of offshore structures in spatially random soils. Charlton and Rouainia [19] undertook a probabilistic analysis on the bearing capacity of skirted foundations under combined vertical-horizontal-moment loadings and constructed several probabilistic failure envelopes. Cheng et al. [20] carried out a large deformation random element analysis to investigate the uplift responses of helical anchors in random clay, and the failure mechanisms and pullout capacities of anchors under different statistical characteristics are extensively analyzed. Luo and Li [21] combined large deformation finite element analysis, small-strain finite element analysis and random field theory to analyze the combined bearing capacities of spudcans considering installation effects in spatially varying soils.
In this paper, a random small-strain finite element (SSFE) analysis was conducted to study the uplift behavior of pipelines in a spatially varying clayey seabed. The validity of the numerical strategies adopted in the current study was verified by comparisons with previous numerical research. The soil’s undrained shear strength was simulated as a random field and realized in the finite element software ABAQUS 6.14 in the form of field variables. The effect of the random distribution of soil strength on the failure mechanism and uplift capacity was determined by Monte Carlo simulations. Finally, for the random uplift capacity of pipelines buried at different depths, the relation between different failure probabilities and safety factors was determined. The results obtained in this paper may facilitate design guidelines to take into account spatial variability in soil properties.

2. Modeling of Spatially Variable Soil

As pointed out in past literature, the soil’s undrained shear strength (i.e., s u ) significantly affects the failure mechanism of a pipeline as well as the uplift capacity, thus s u was modeled as a random field in this study for representation of spatial variability. According to the studies of Yi et al. [22] and Cheng et al. [20], s u can be considered to follow a normal or lognormal distribution. In this paper, the lognormal distribution was adopted to avoid the appearance of negative s u values. Then, the statistical characteristics of the random variable can be quantified by the coefficient of variation (i.e., C O V ) and the correlation length (i.e., θ ). With reference to Phoon and Kulhawy [10], the typical coefficient of variation of s u (i.e., C O V s u ) ranges from 0.1 to 0.5. As such, the C O V s u = 0.3 was chosen as a typical value. Furthermore, the correlation length in the horizontal direction (i.e., θ h ) is usually larger than the correlation length in the vertical direction (i.e., θ v ). Following Charlton and Rouainia [23], the correlation lengths of θ h = 6 D and θ v = D were selected (where D denotes the pipeline diameter).
For purpose of carrying out random finite element analyses, several efficient methods have been developed for the generation of random fields. Examples of these methods are as follows: the spectral representation method, the Karhunen-Loeve expansion method, the linear estimation method and the modified linear estimation method (MLEM). The MLEM, proposed by Liu et al. [24], was employed in this study because of its efficiency.

3. Finite Element Methodology

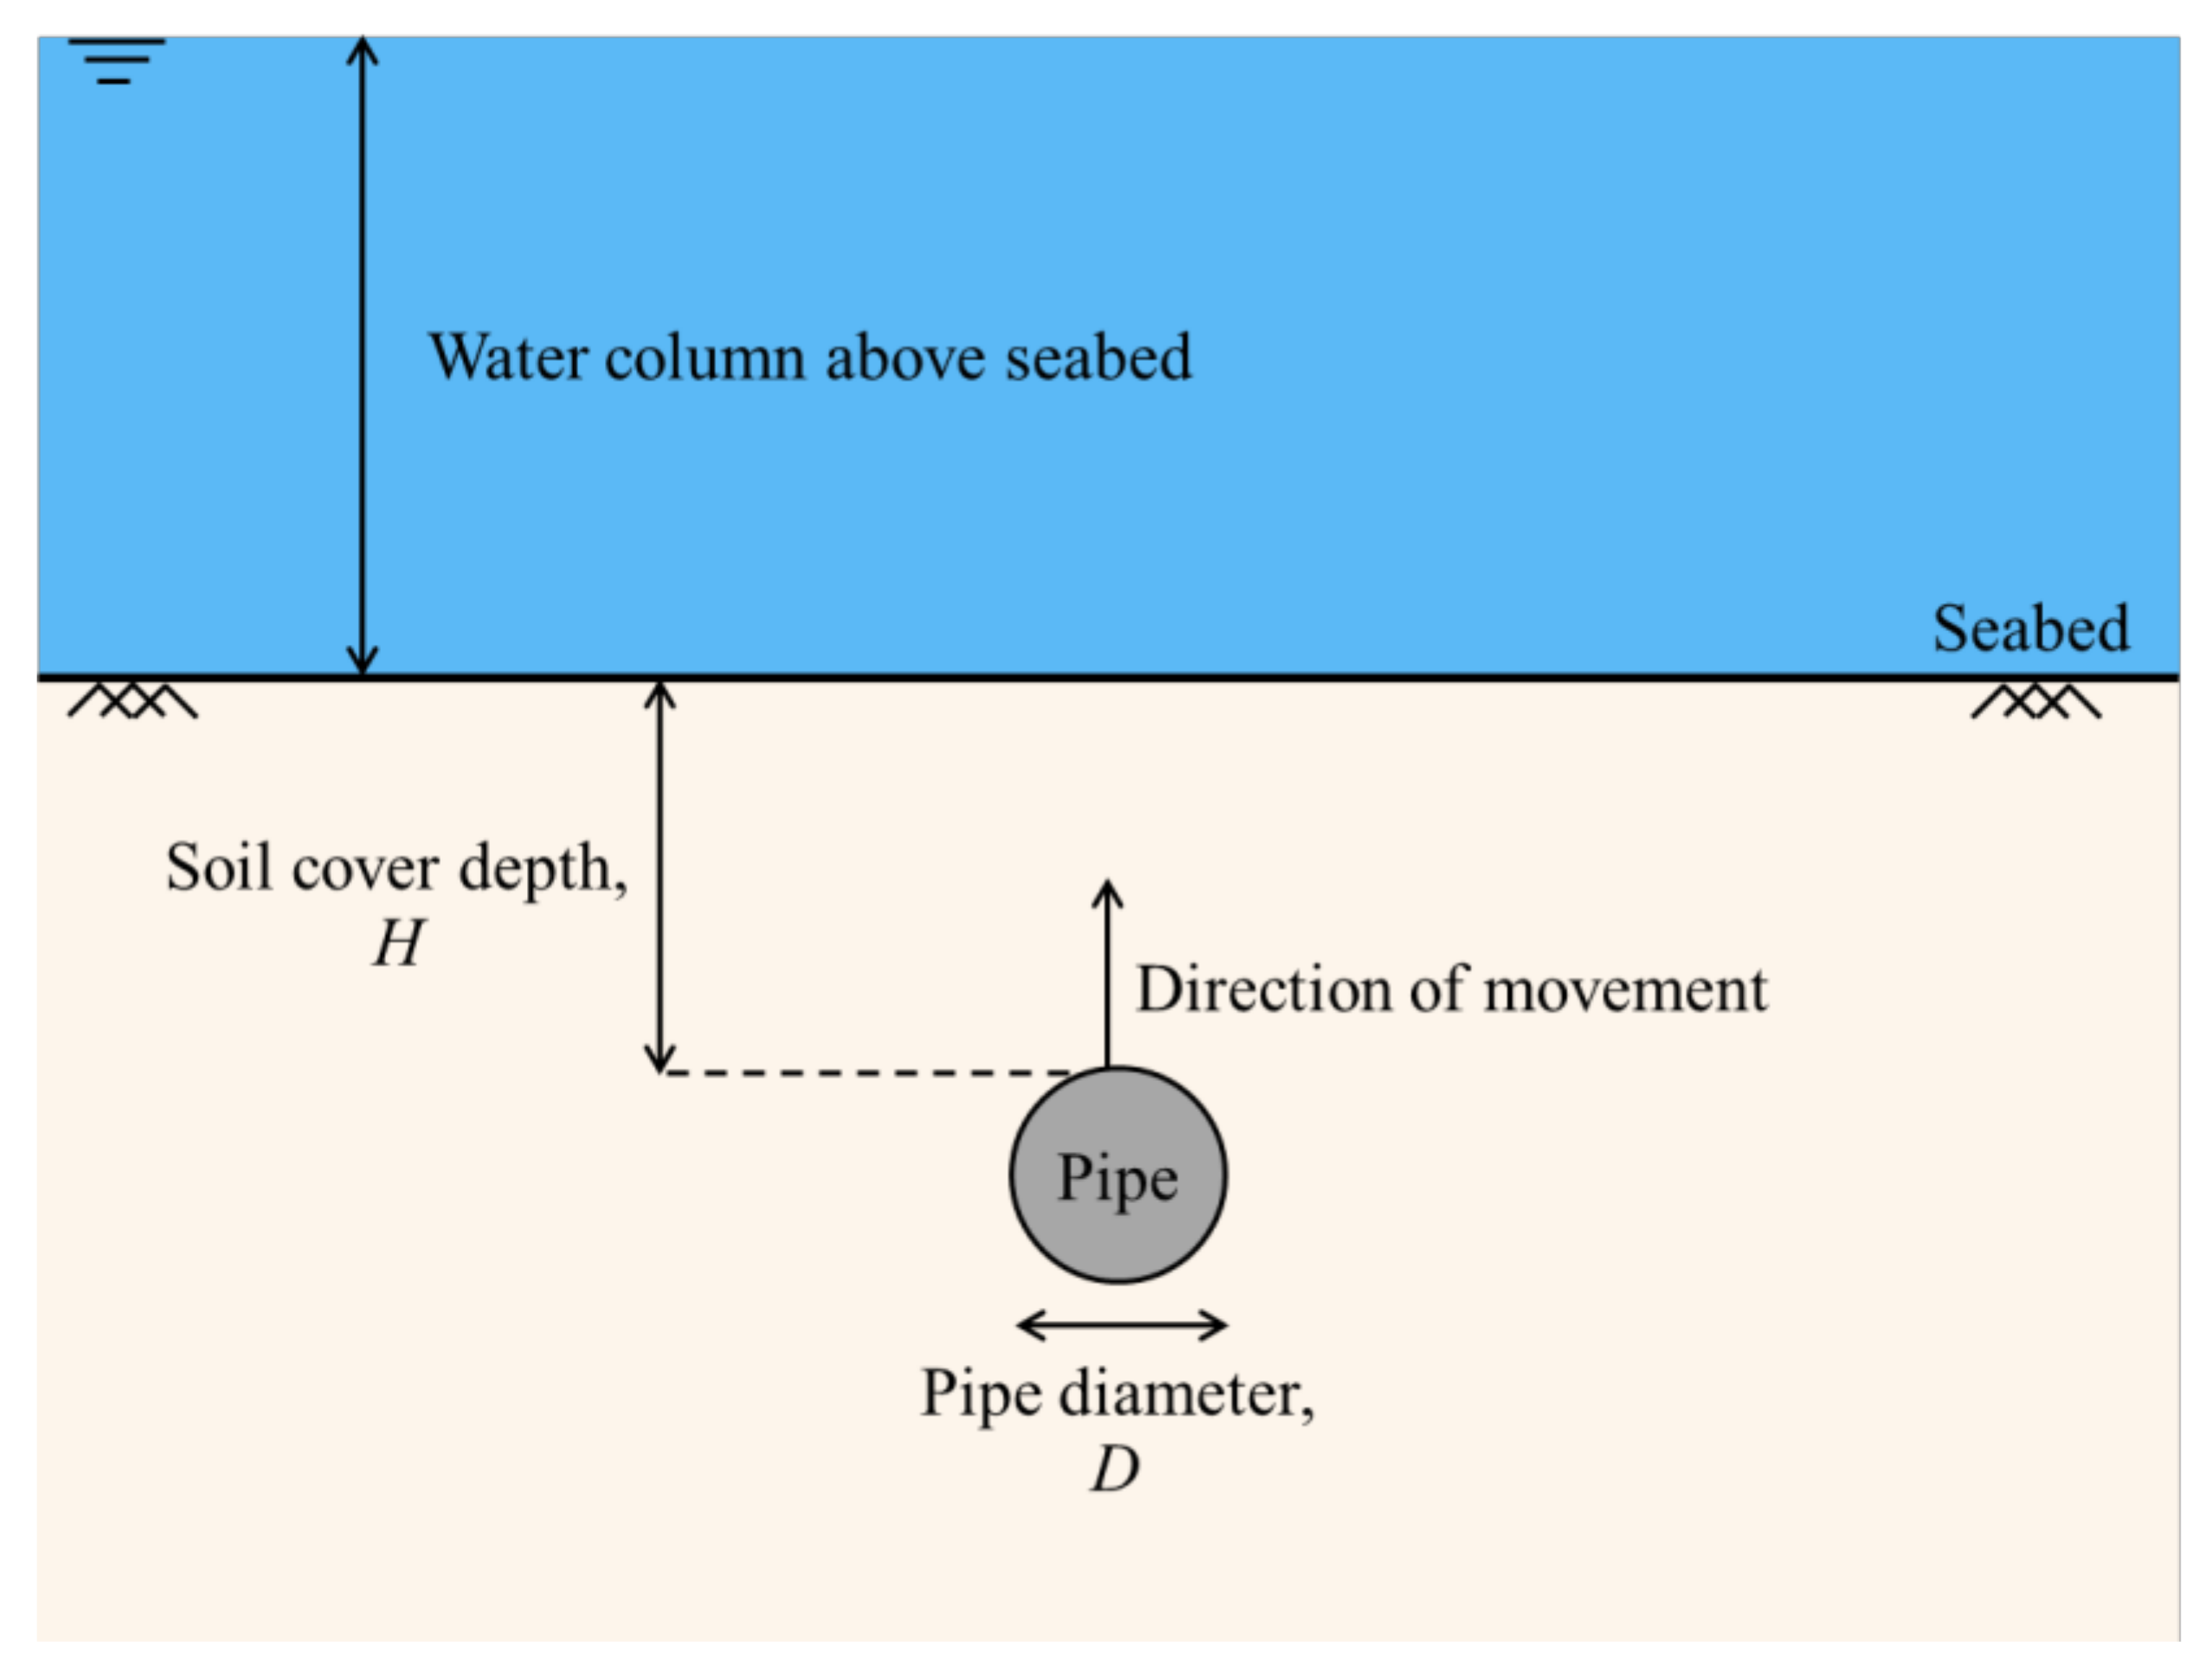
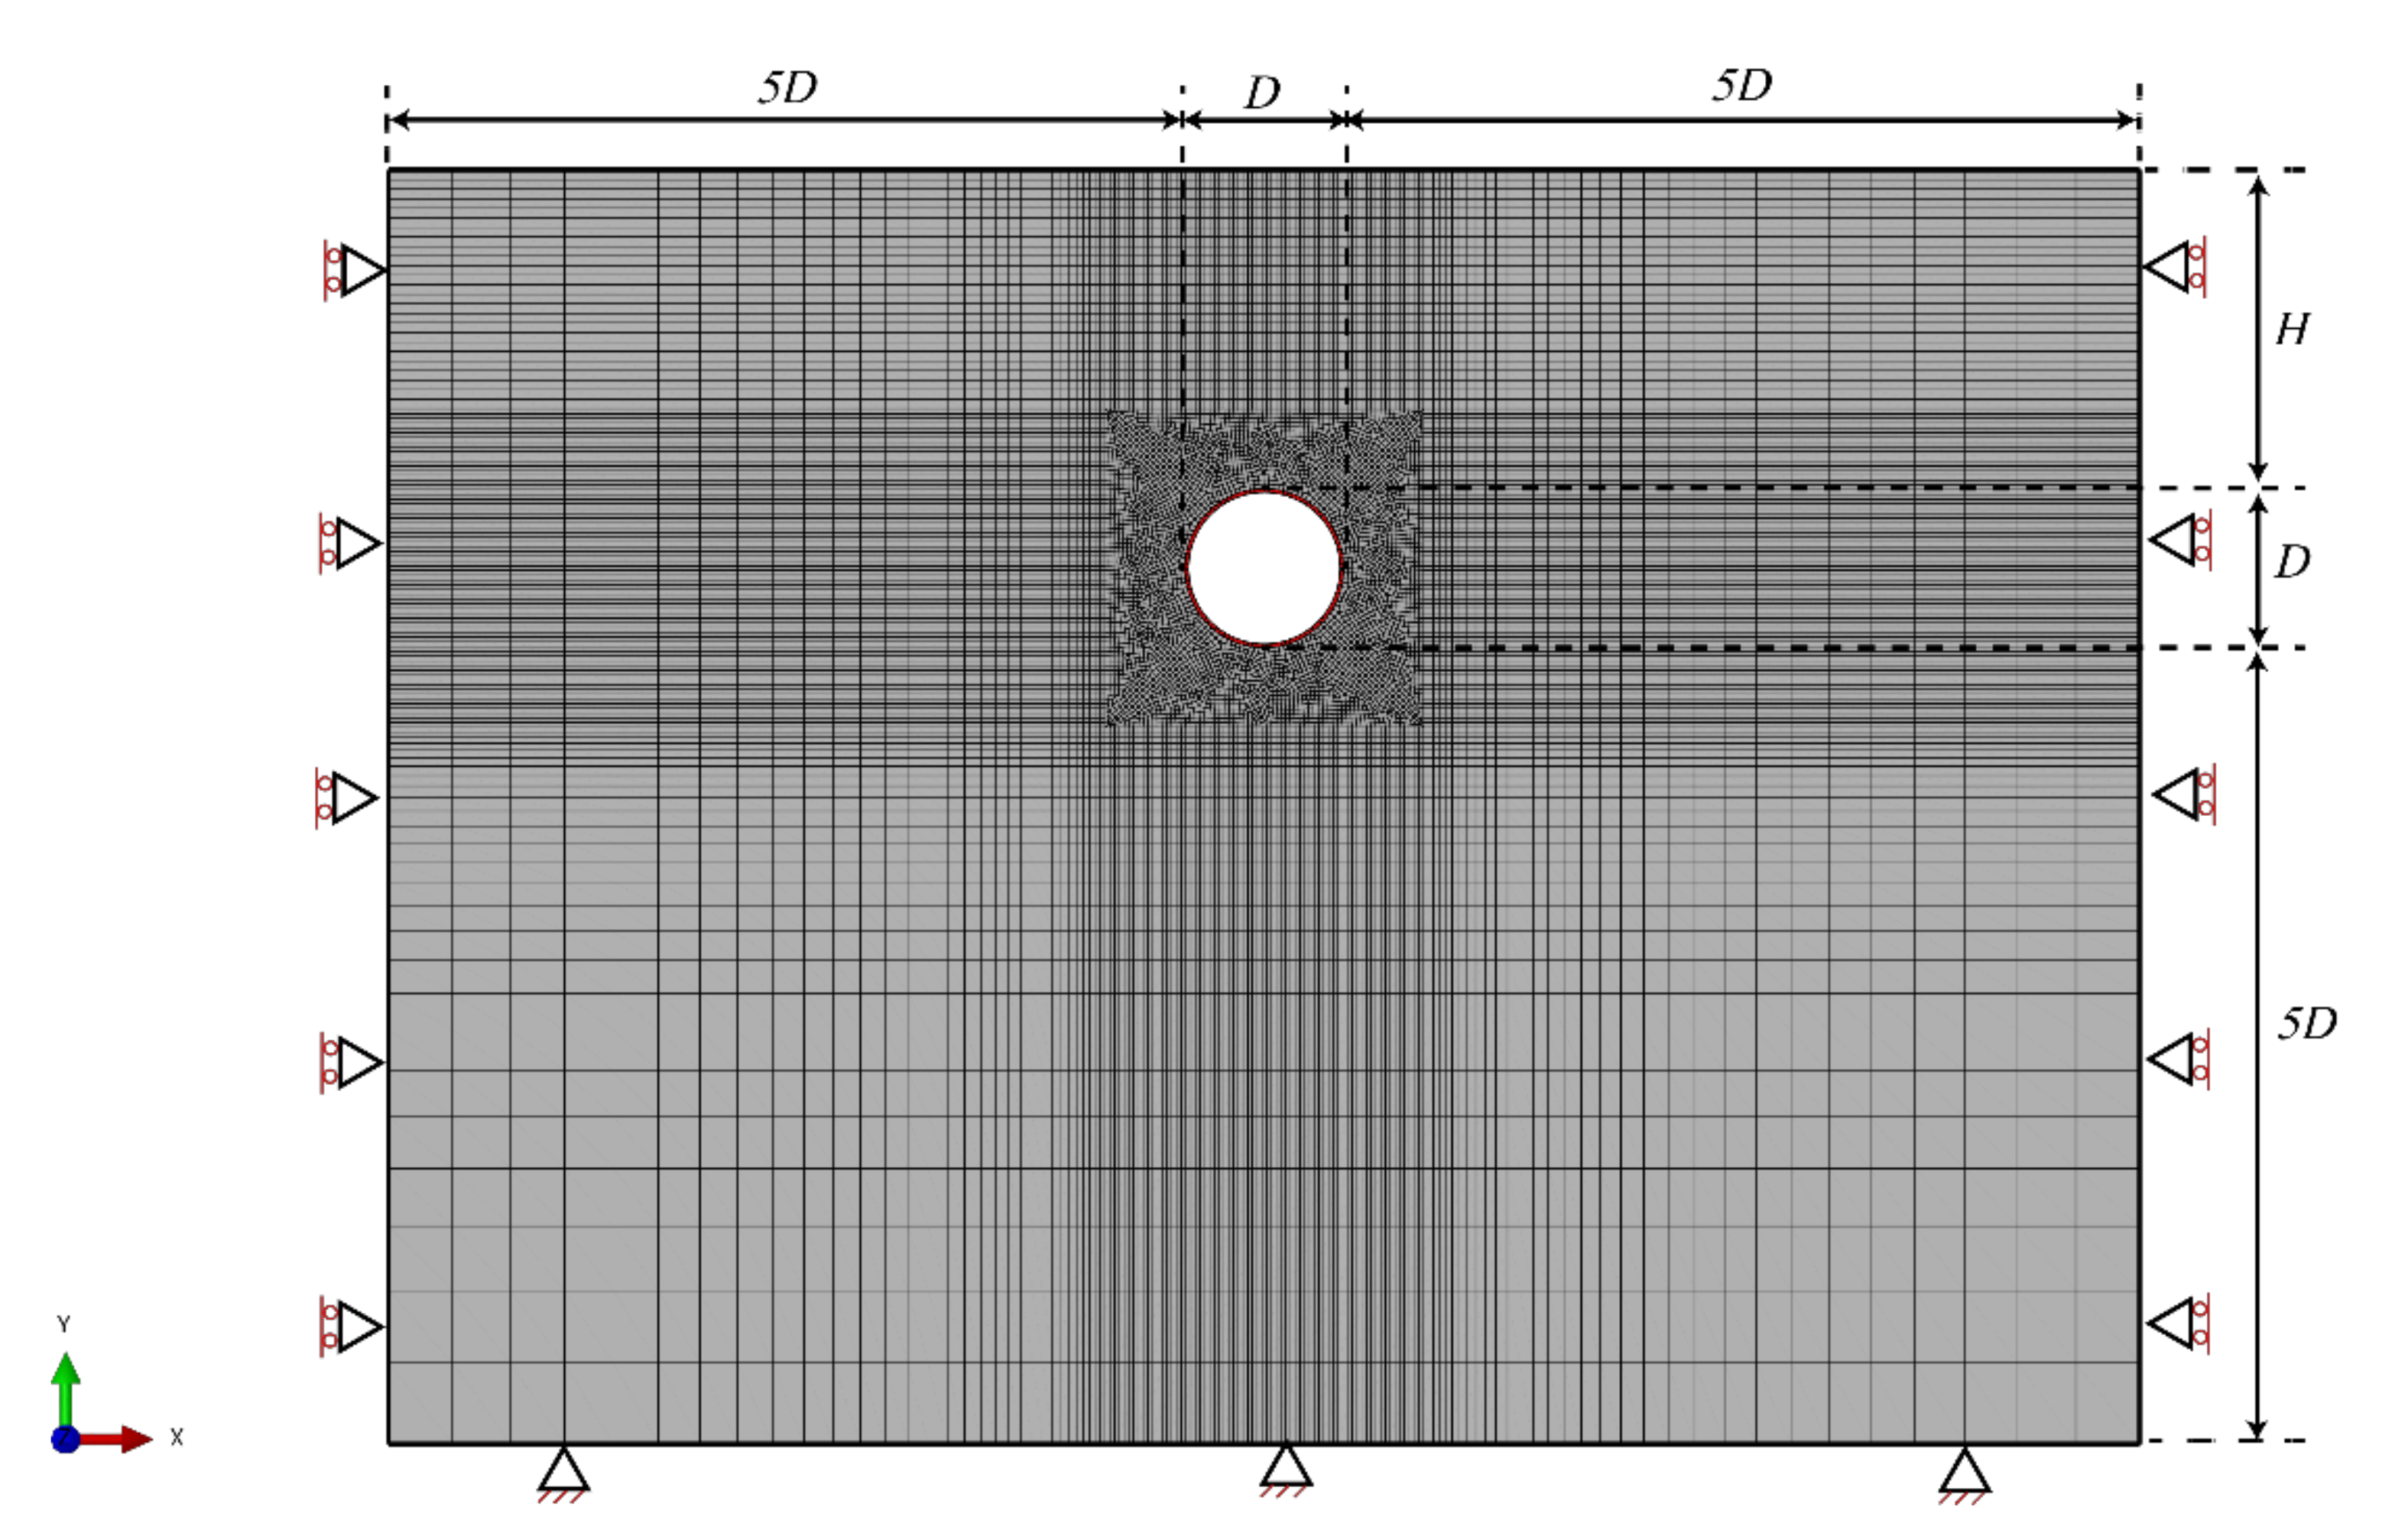
3.1. Small-Strain Finite Element Analysis Model

Pipelines are often used for long-distance transport, resulting in a very large length–diameter ratio. Therefore, a small-strain finite element (SSFE) analysis, based on the plane strain assumption, was adopted in this study to simulate the pipeline uplift process in order to improve computational efficiency.
Figure 2 depicts the typical mesh and the boundary dimensions of the two-dimensional finite element model. To ensure minimal boundary influence on the uplift response of the pipeline, the distance between the outer side of the pipeline and the lateral sides of the model as well as the distance between the lower part of the pipeline and the bottom of the model were set to 5D [5]. Meanwhile, the lateral faces of the model were constrained in the perpendicular direction, and the bottom boundary was restricted in all directions.
The soil domain was discretized using 4-node bilinear plane strain quadrilateral elements (i.e., CPE4). A finer mesh with a size of 0.01%D was prescribed in the vicinity of the pipeline since such a mesh size was adopted by Maitra et al. [5]. The elastic-perfectly-plastic Tresca constitutive model was adopted to model the behavior of the soil. The clayey seabed was assumed to be undrained and the Poisson’s ratio ( ν ) of 0.49 was employed [25]. Although an undrained condition implies a Poisson’s ratio of 0.5, a smaller value, like the one used in this paper (0.49), promotes numerical stability and efficiency without affecting the computed uplift capacity of a pipeline. The Young’s modulus of clay ( E ) was set to be 500 times the soil’s undrained shear strength ( E = 500 s u ). Having considered the practical ranges documented in the existing literature, a pipeline of a diameter of 1 m was selected. The magnitudes of the parameters used to define the soil and the pipe are summarized in Table 1. The stiffness of a pipeline is markedly greater than that of clay, thus the pipeline was modeled as a rigid body in this study [26,27,28]. In addition, for numerical expediency, the pipeline–soil interface was considered as rough with an infinite interface tensile strength (i.e., rough full tension condition) and the Tie constraint in ABAQUS was used for modeling such contact, which avoided considering the pipeline–soil interface elements. Meanwhile, the wished-in-place assumption was adopted and the pipeline was embedded at various anticipated depths. The displacement-controlled approach was employed to model the uplift process. A reference point was specified on the top of the pipeline and a vertical displacement was applied to the reference point. Then, the uplift capacity of the pipeline was obtained by outputting the reaction force of the reference point.

3.2. Validation of the Numerical Model

In order to verify the validity of the above-mentioned SSFE method, the uplift capacity factor N u obtained in this paper was compared with the results obtained in earlier studies. Here, N u can be calculated by the following equation:
N u = V u / D s u
where V u is the ultimate uplift capacity.
Maitra et al. [5] carried out a series of small-strain finite element analyses to explore the uplift behavior of the pipeline in uniform clays. A range of soil cover ratios (i.e., H / D ratios, where H represents the initial soil cover depth of the pipeline.) between 0.5 and 6 were considered. Table 2 illustrates the comparisons of the N u value for the rough pipelines under full tension. It can be seen that for pipelines at different depths, the calculated results from this study agree well with the work of Maitra et al. [5], with a maximum discrepancy of about 1%. Furthermore, when the soil cover depth ratio H / D was less than 2, N u increased with the increase of H / D and reached a maximum value when H / D equaled 2 and remained constant as H / D increased, indicating a critical depth ratio for H / D = 2 . According to the study of Kumar et al. [4], in the case of a full tension condition, H / D = 2 is the critical depth ratio for a failure mechanism to transition from a global failure to a local failure. The results of this study also indicate this trend. Furthermore, according to Randolph and Houlsby [29], for a lateral-loaded cylindrical pile with the local shear failure mechanism, the analytical solution of its bearing capacity factor is 11.94, while the ultimate bearing capacity factor obtained in this paper was 12.11. These results are in good agreement with each other. Therefore, it can be concluded that the SSFE method adopted in this paper can effectively simulate the uplift process of a pipeline.

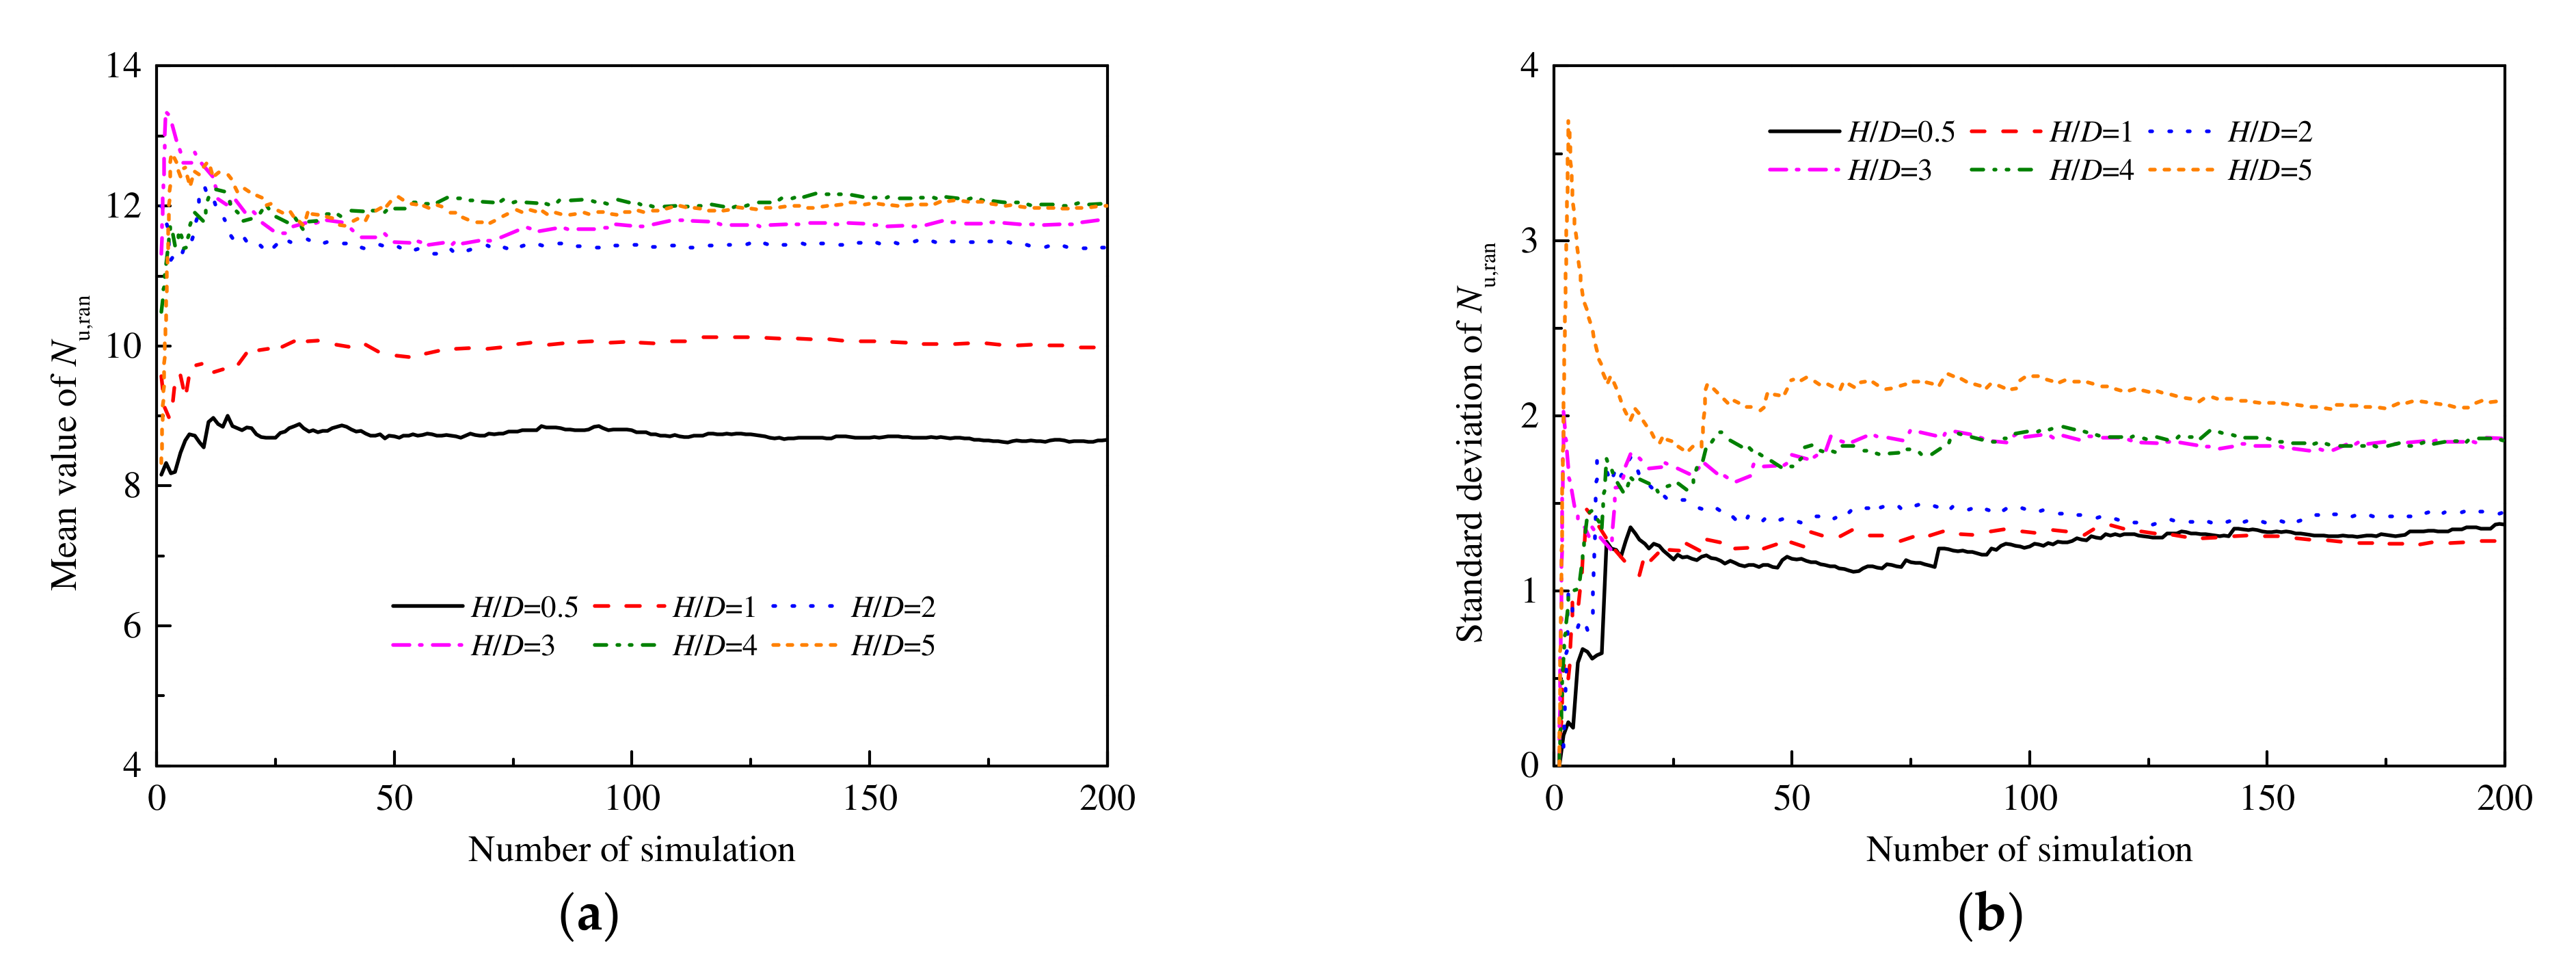
3.3. Random SSFE Analysis

Starting from this section, the undrained shear strength of the clayey seabed was considered as a random field and the random SSFE analyses were conducted. Six H / D values (i.e., 0.5, 1, 2, 3, 4 and 5) were considered, which are representative of typical soil cover depth ratios. The mean value of the soil’s undrained shear strength (i.e., μ s u ) was set to be 30 kPa. It should be noted herein that the random SSFE analysis in this study was a univariate analysis. Considering that s u was a random variable obeying lognormal distribution, there was a direct linear relationship between Young’s modulus E and soil strength (i.e., E = 500 s u ), resulting in E being a dependent random variable related to s u . In addition, other model details for random SSFE analyses, such as boundary dimensions, mesh size, element type, etc., were the same as those noted in Section 3.1.

4. Results and Discussions

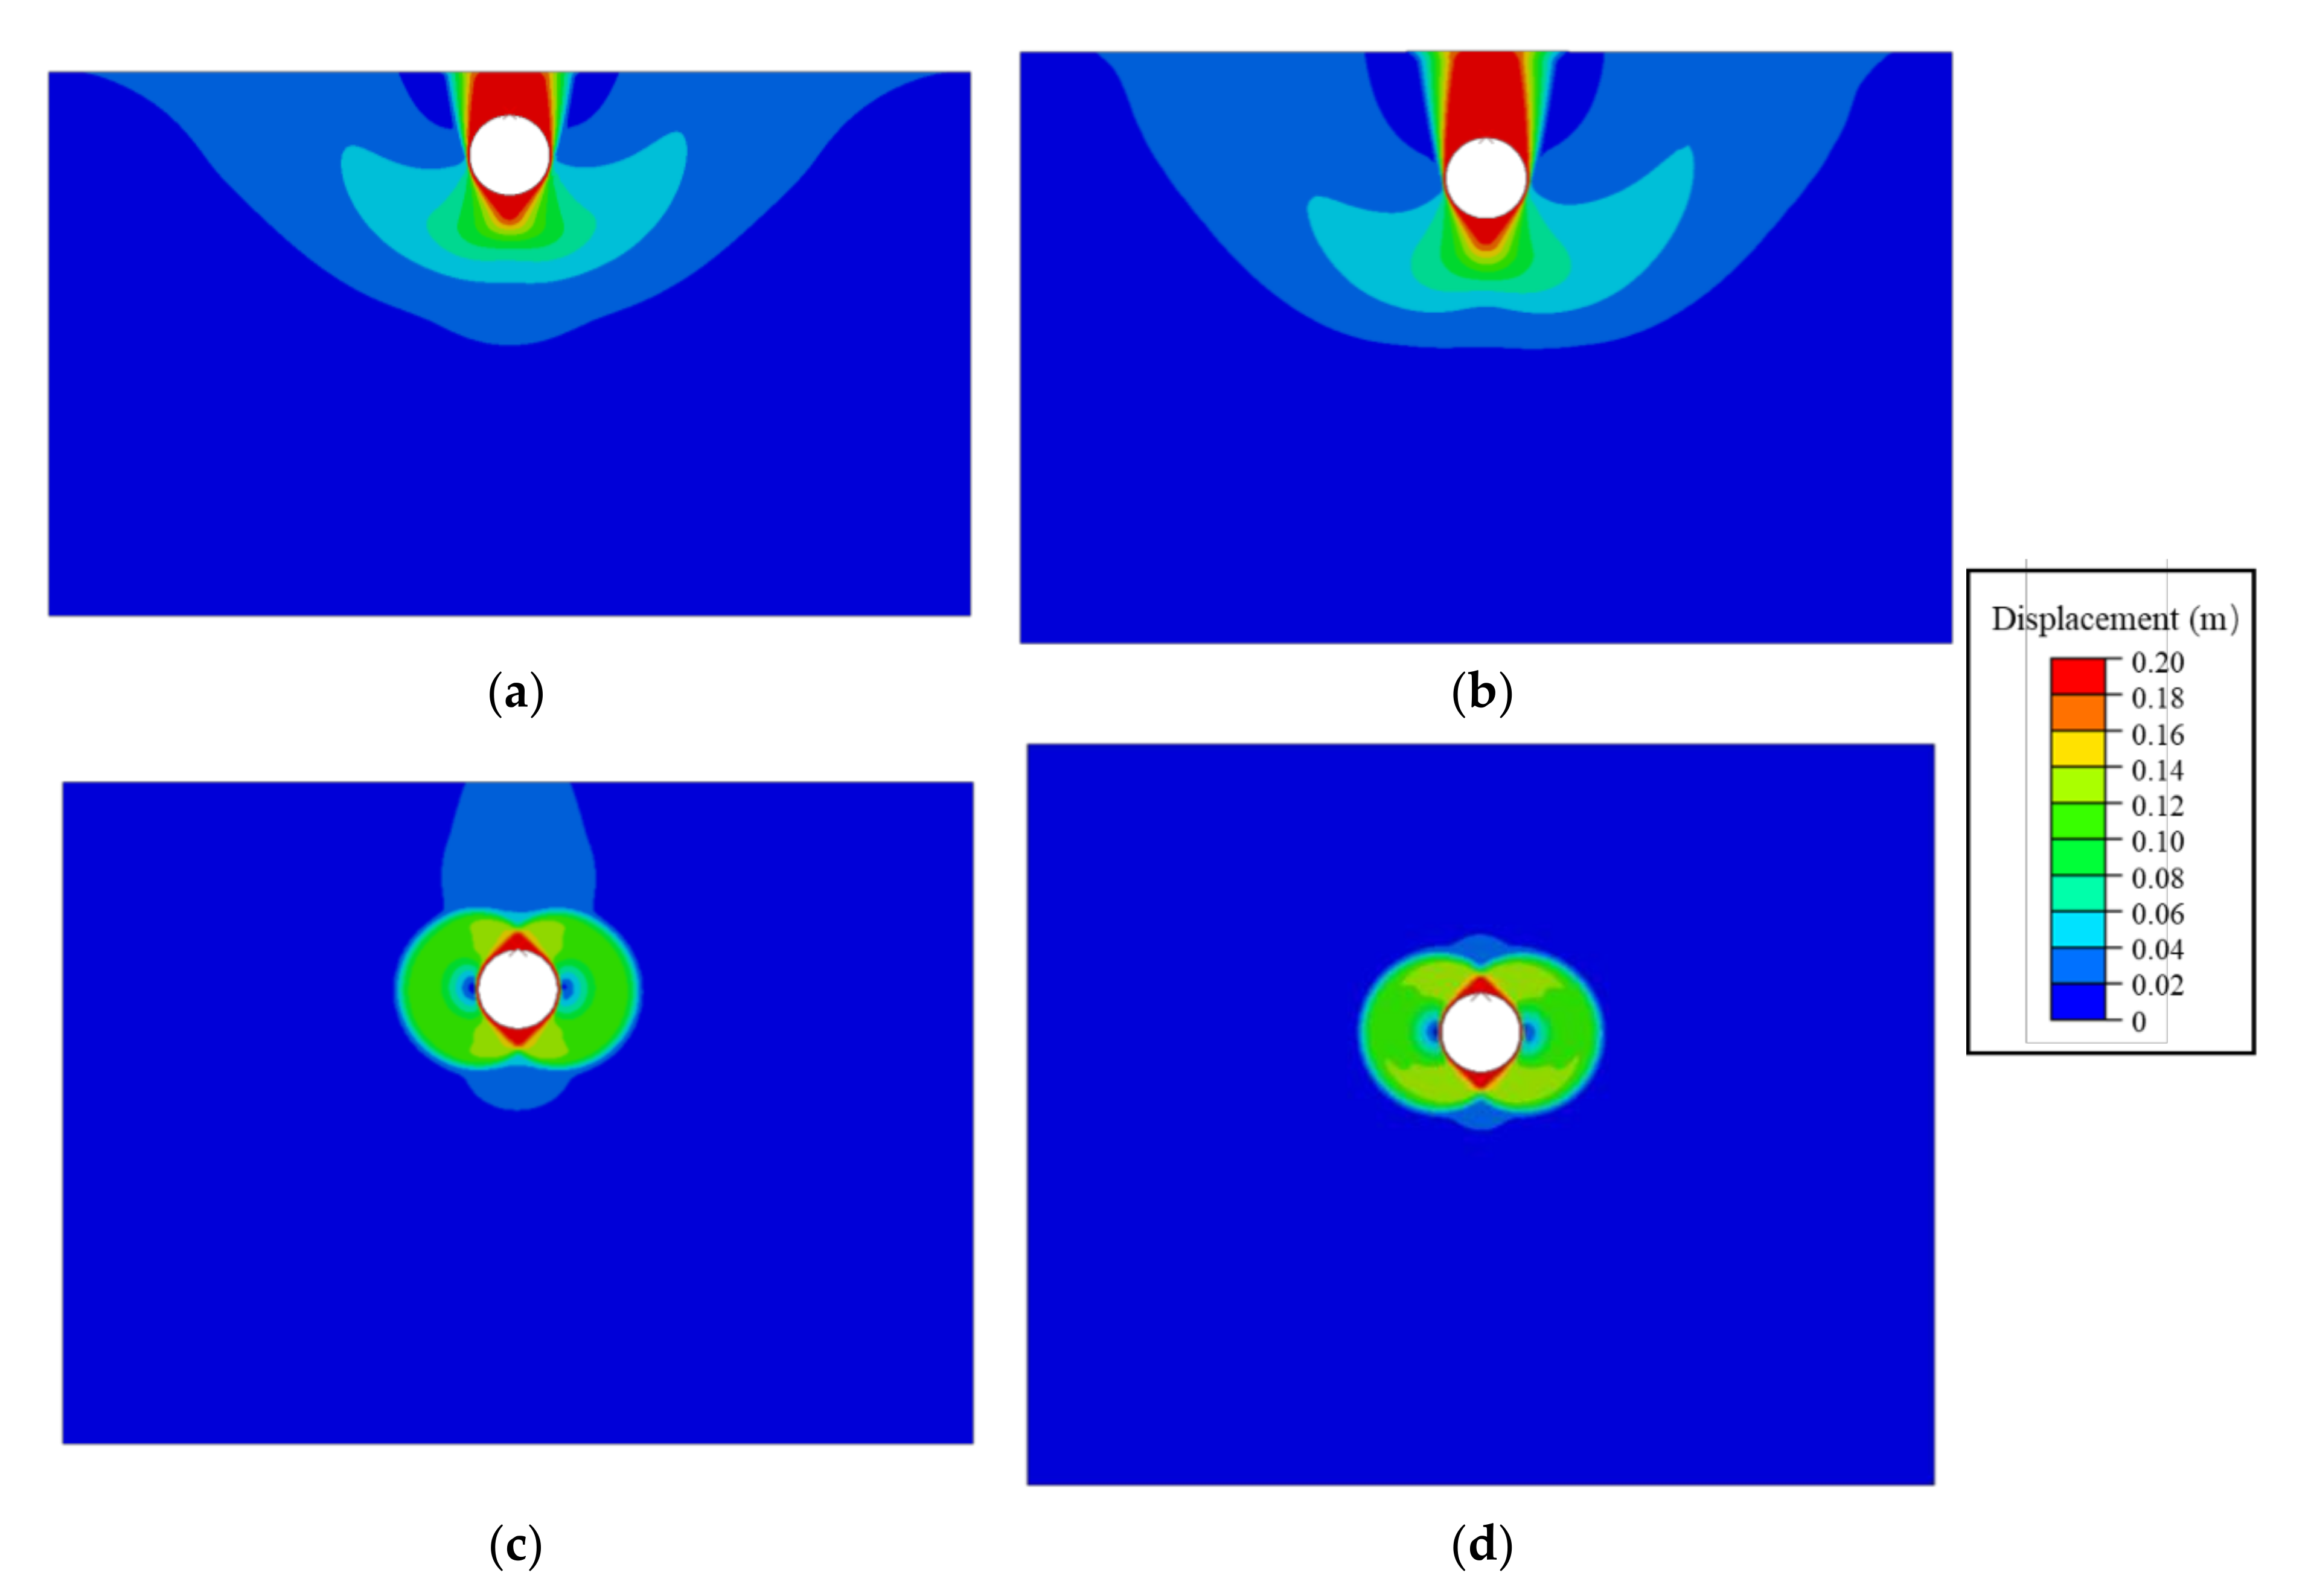
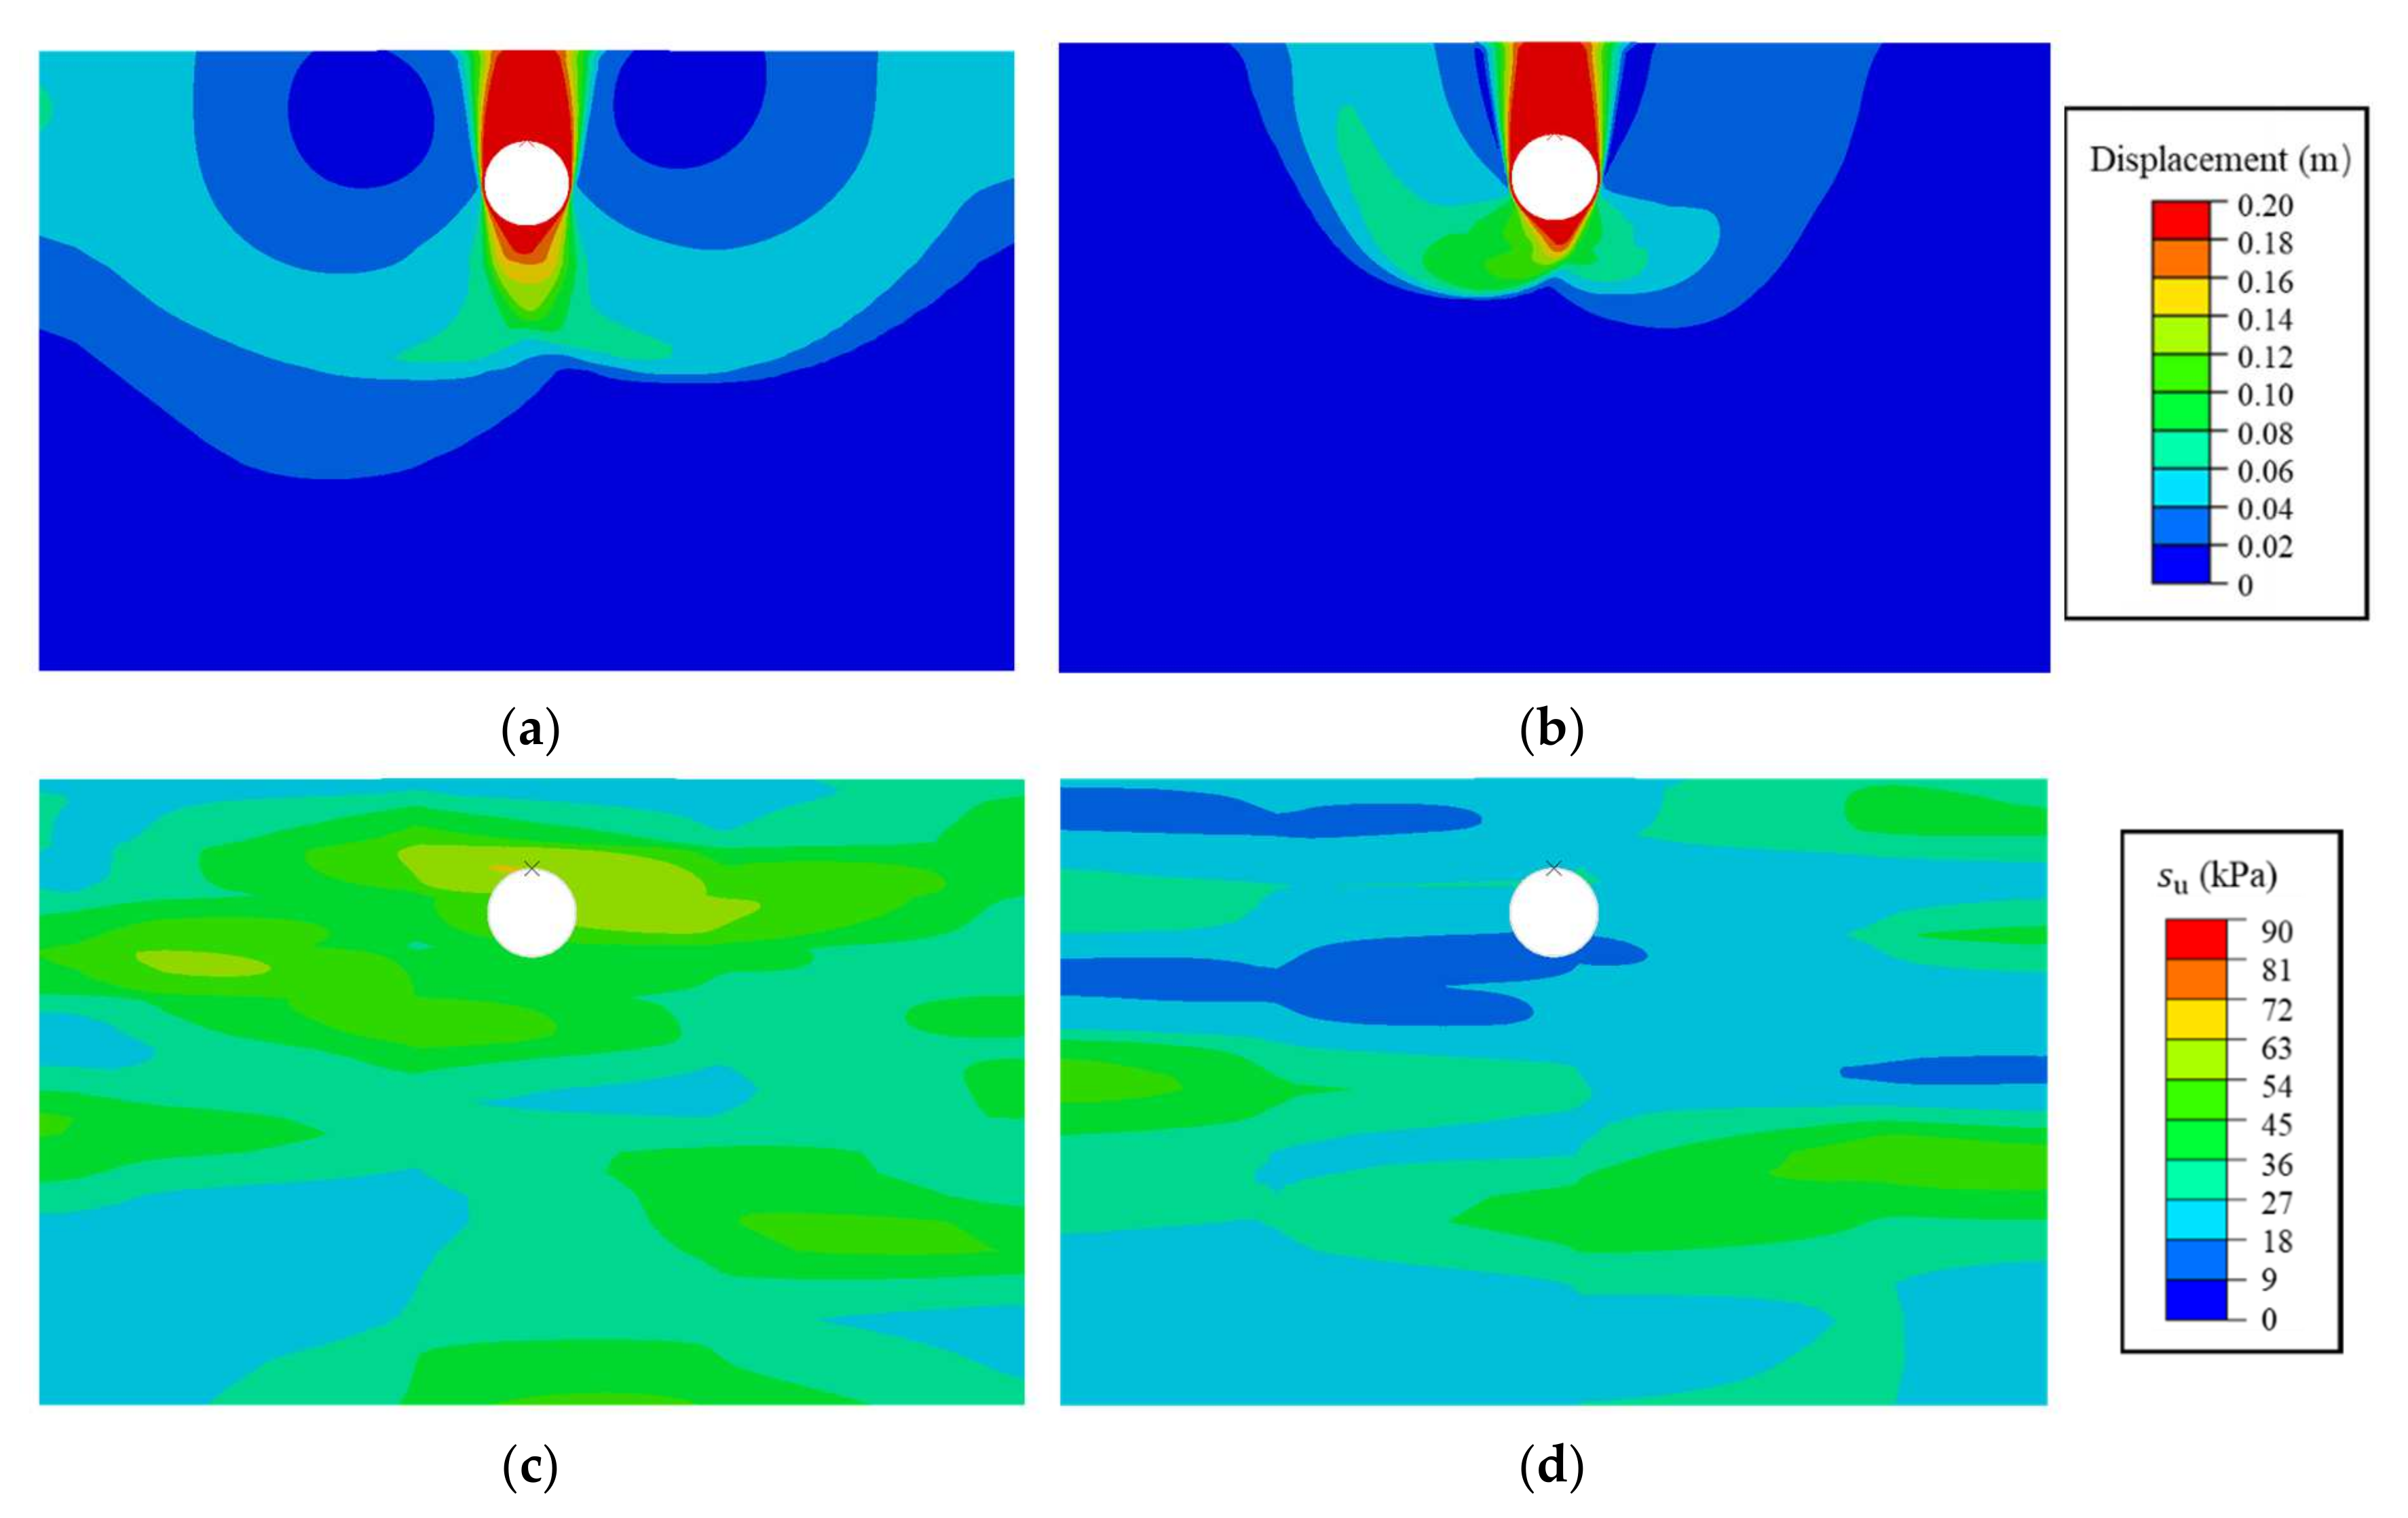
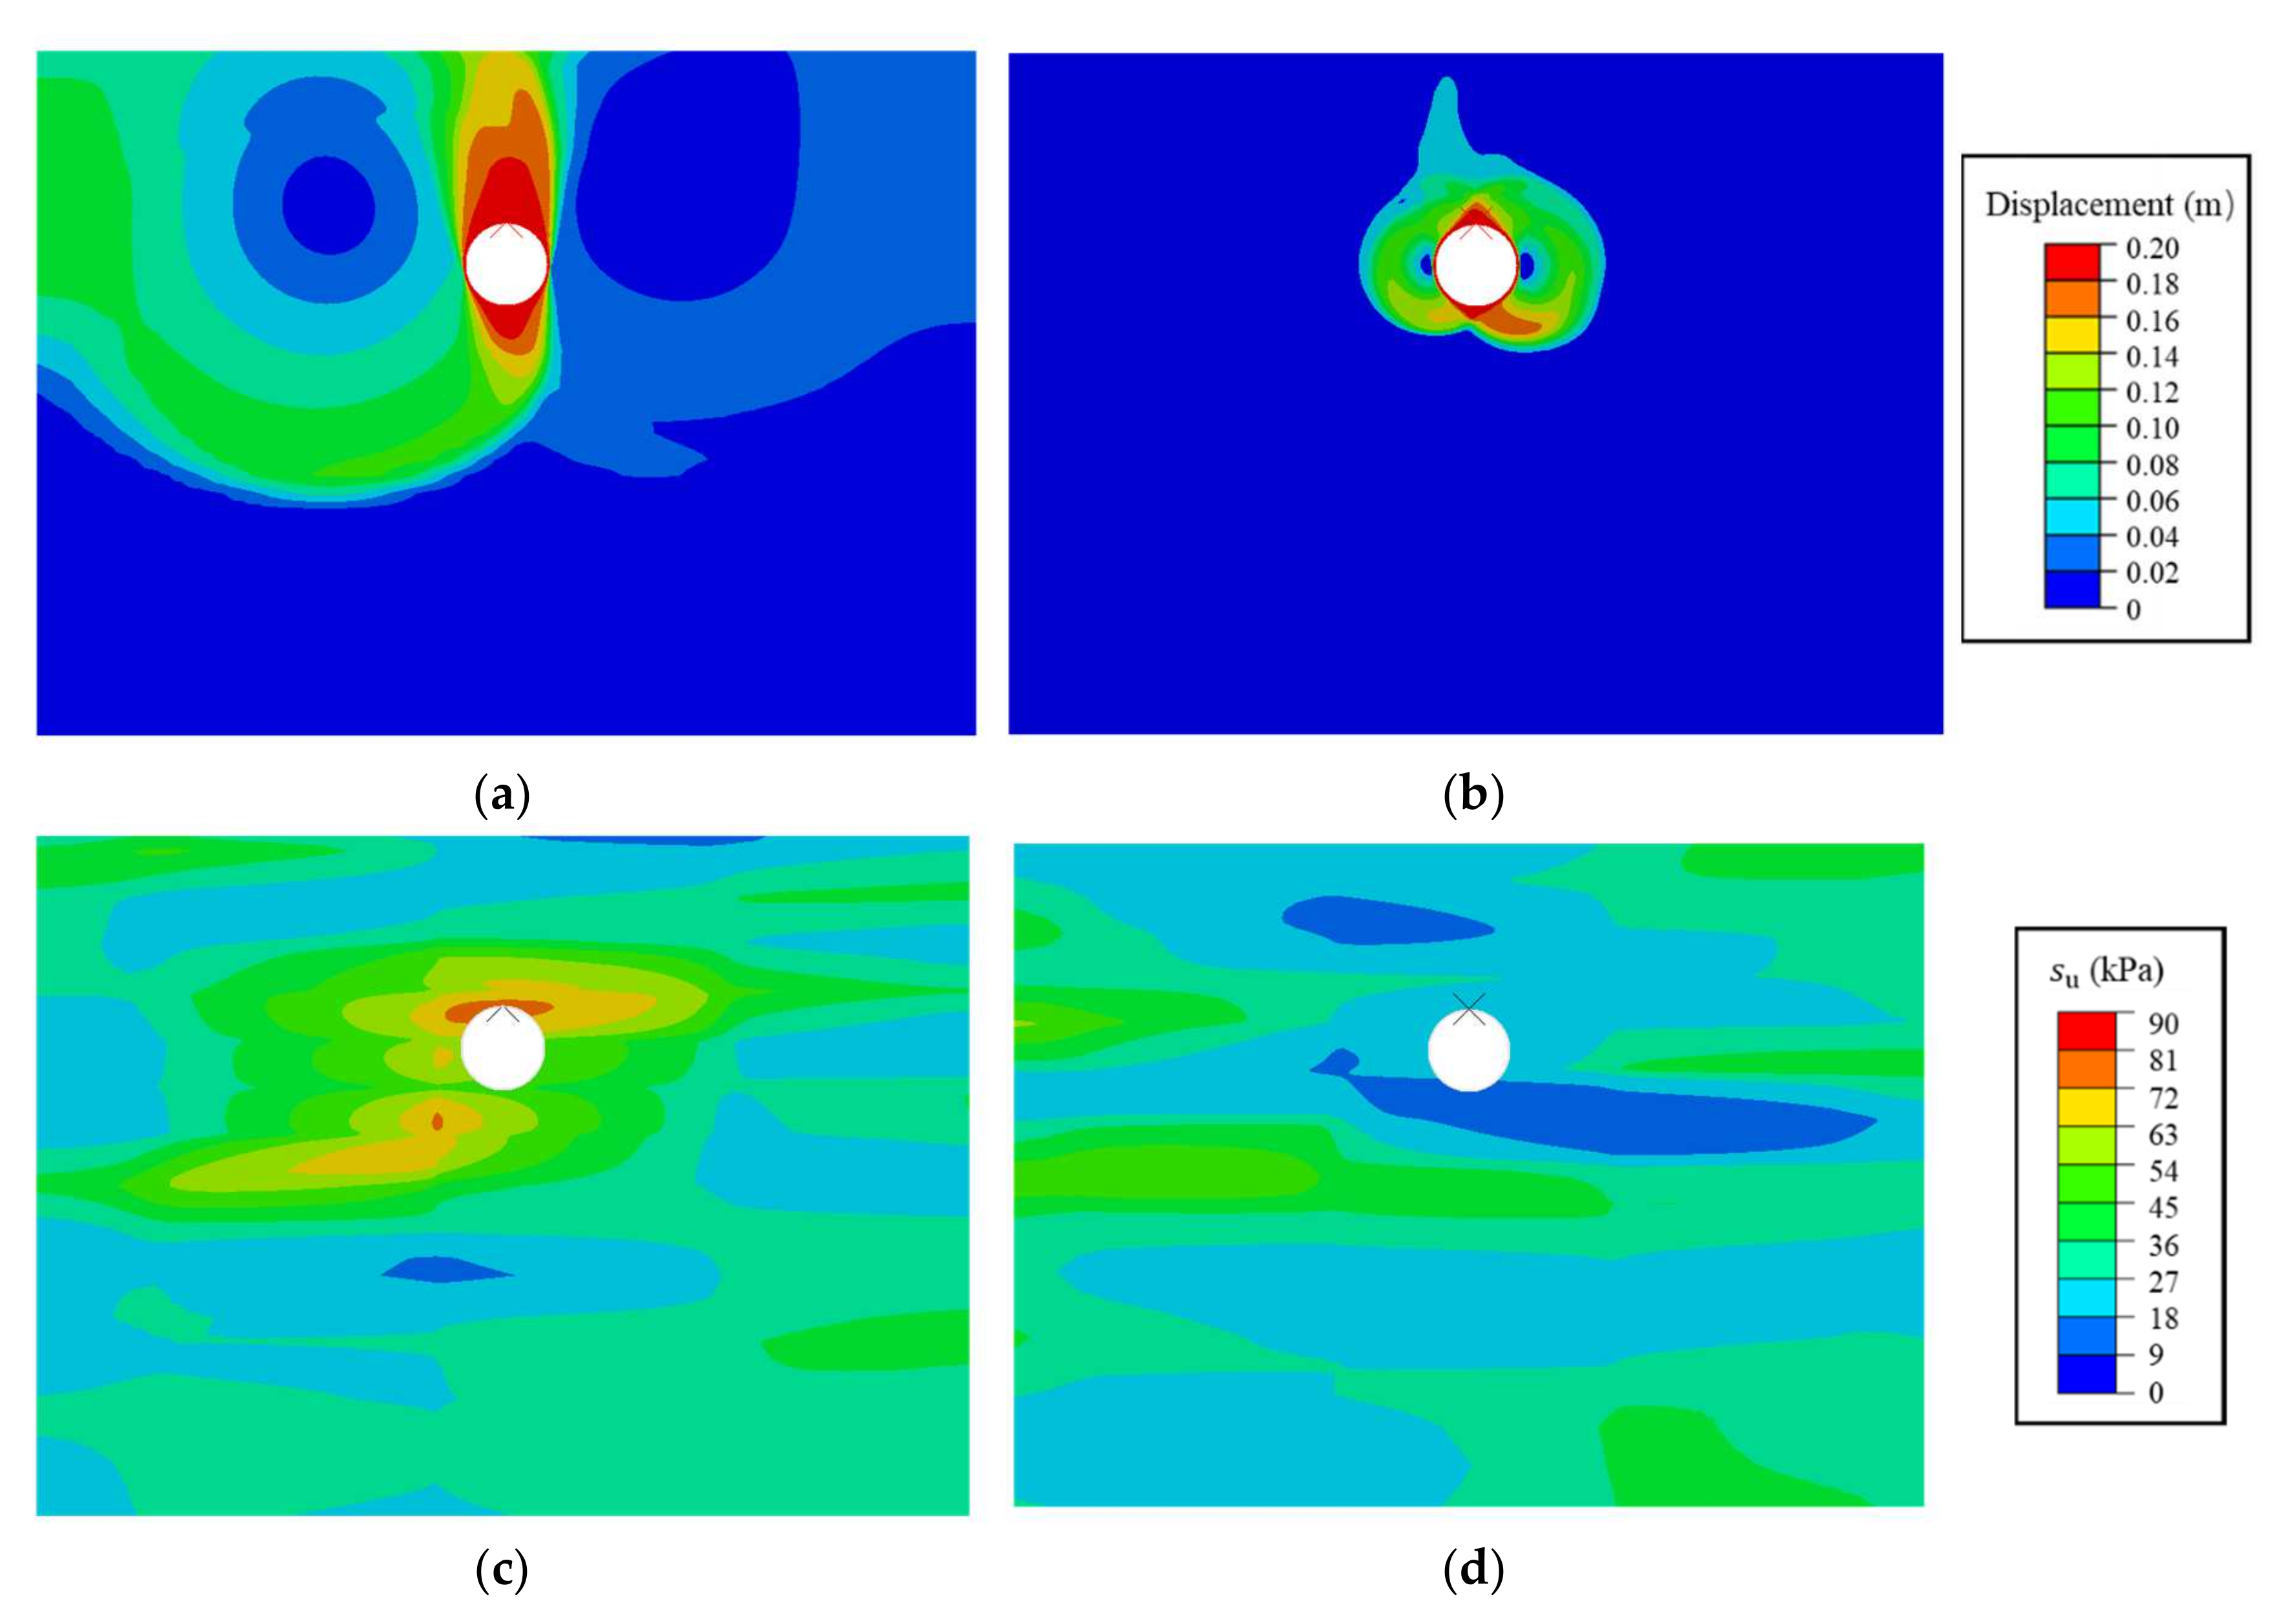
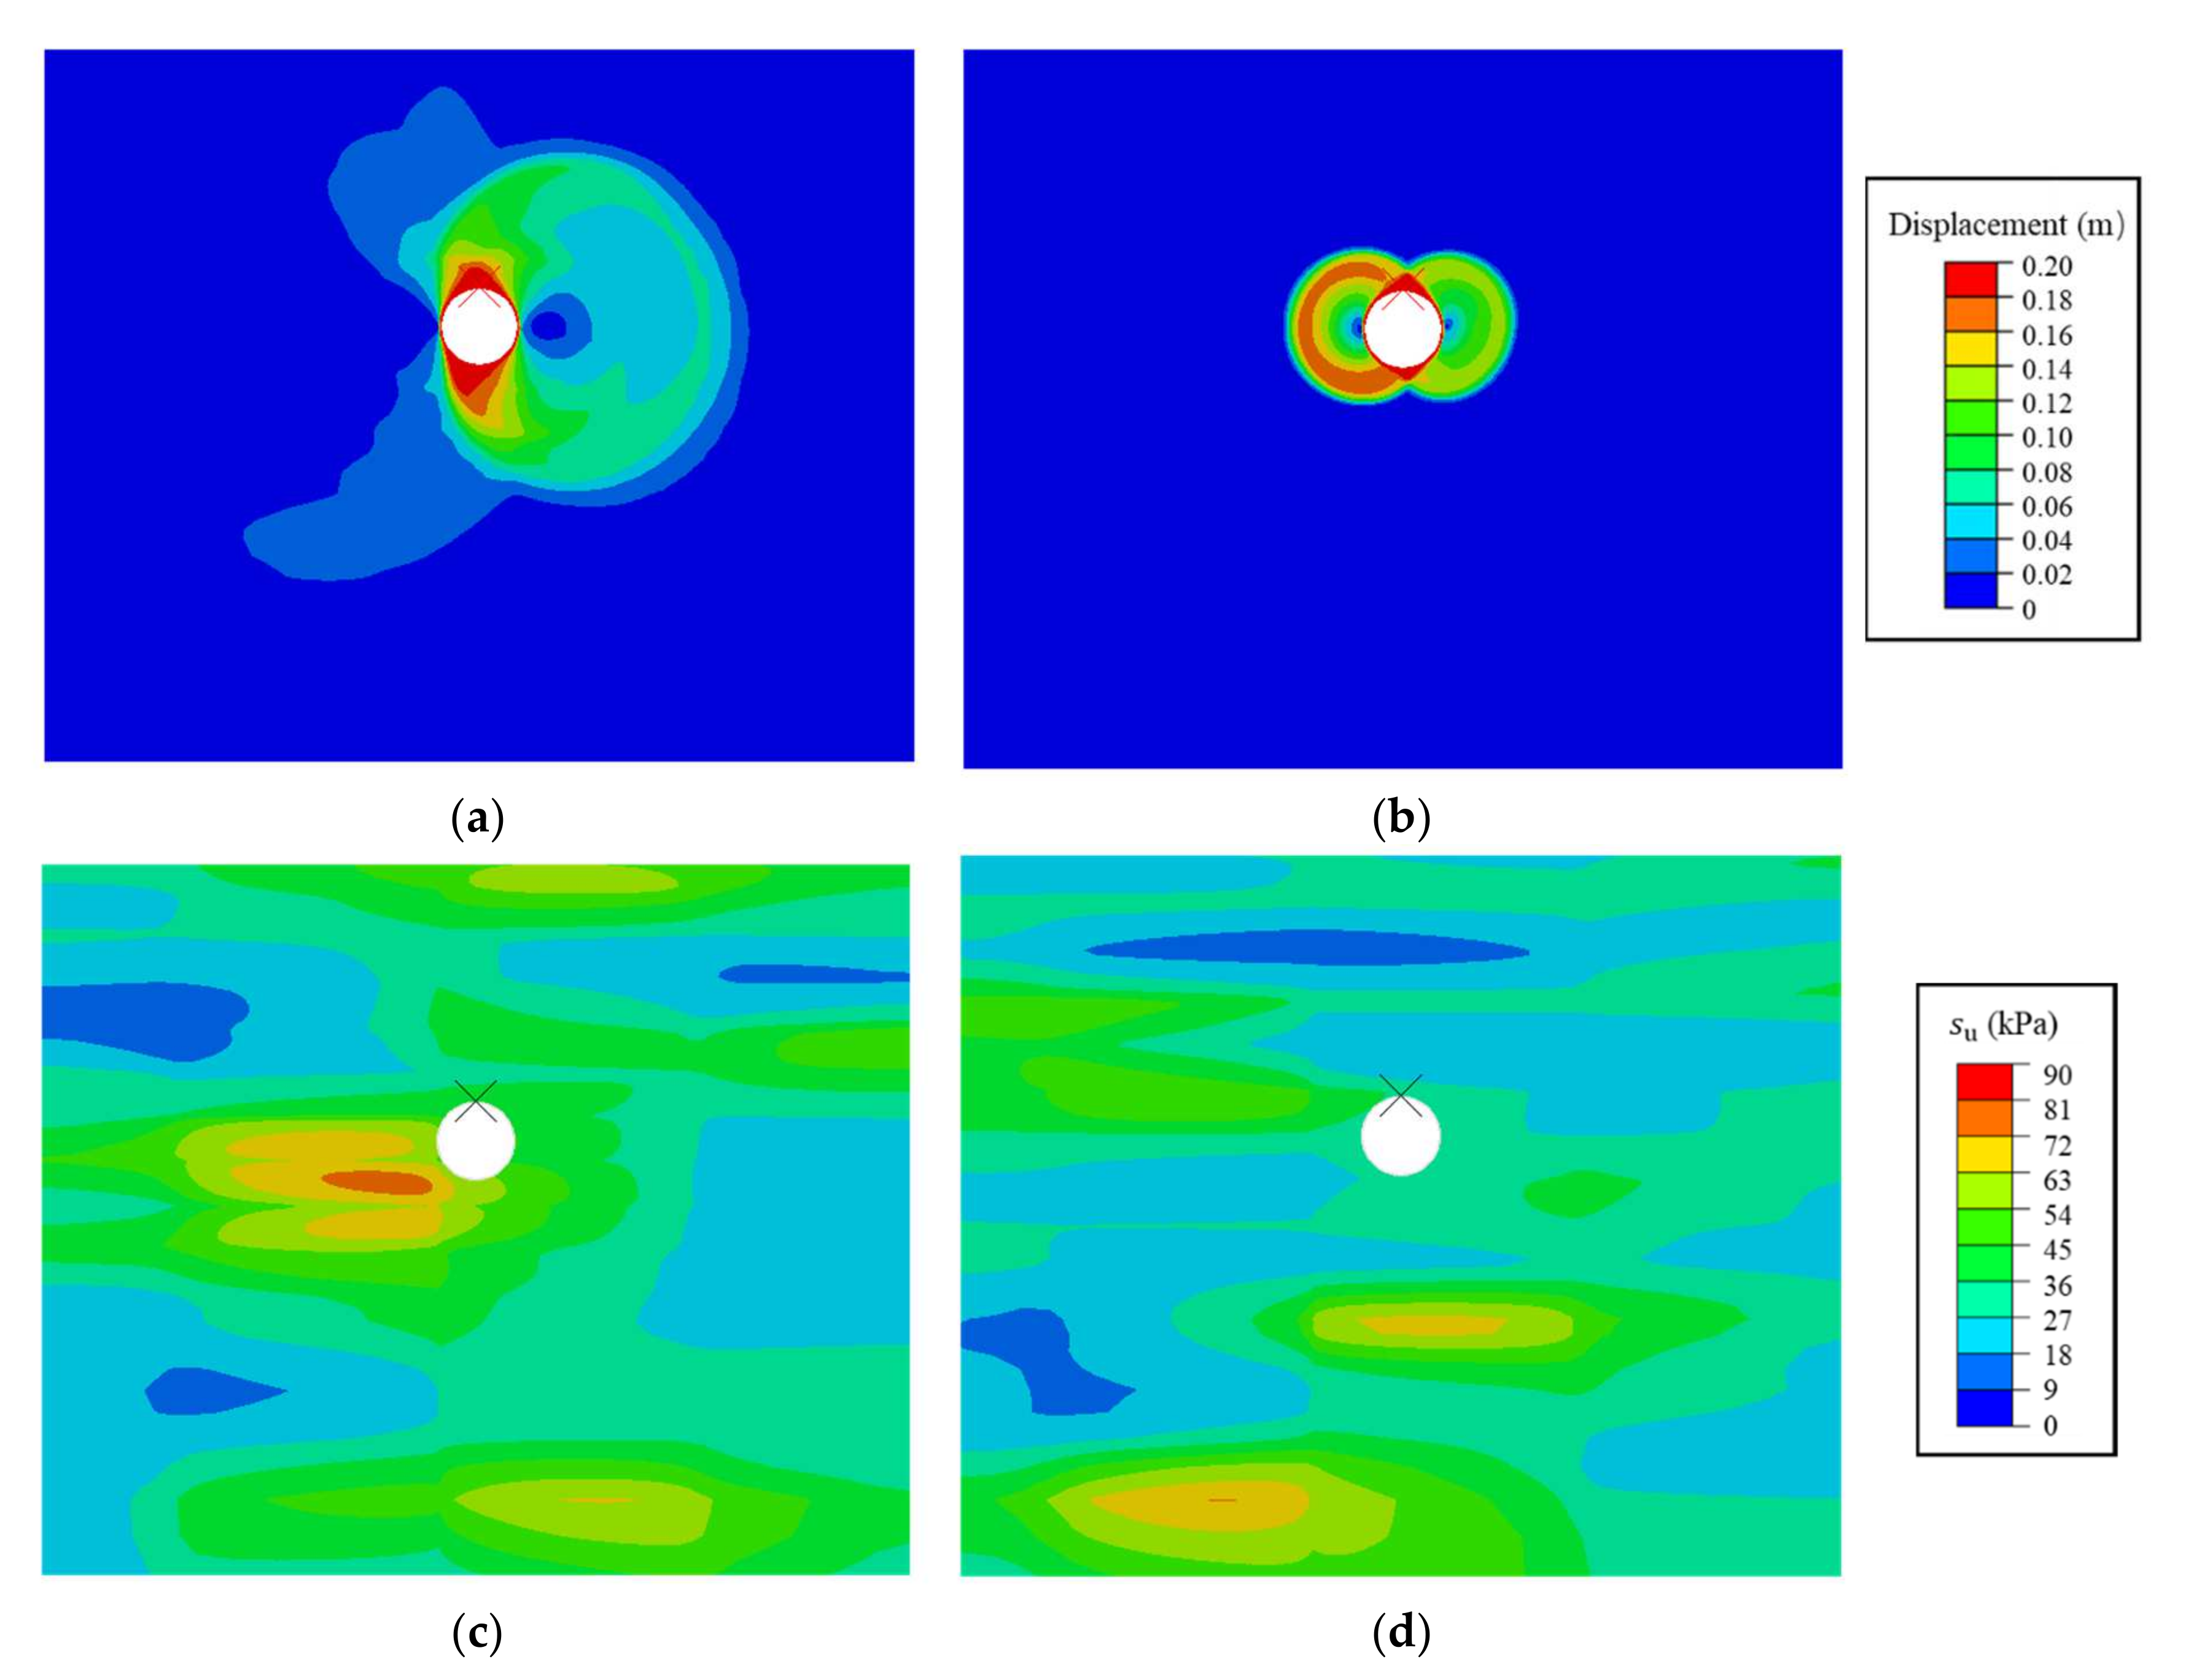
4.1. Failure Mechanism in Deterministic and Random Soil

The effect of the spatial variation of the soil’s undrained shear strength on the failure mechanism of the soil surrounding the pipeline is presented in this section. Figure 3a–d plot the displacement contours of the soil around the pipeline with the soil cover ratio H / D of 0.5, 1, 2 and 3 in the deterministic soil with s u = 30 kPa, respectively. It can be seen that in all the deterministic analyses, when pipeline upheaval buckling occurred, the displacement contours of the soil were symmetrical and the failure mechanism was closely related to the value of H / D . For pipelines with a H / D less than 2, the failure zone extended to the seabed surface, corresponding to the global failure mode. However, when H / D was greater than or equal to 2, a localized circumferential soil flow surrounding the pipeline occurred. This is consistent with the conclusions obtained by Kumar et al. [4], which suggested that critical soil cover depth ratios for both the global and local failure modes was 2 for rough pipelines under full tension in uniform soils.
Figure 4 and Figure 5 depict the displacement contours and the corresponding soil’s undrained strength distribution in the random soil with pipeline soil cover depth ratios of 0.5 and 1, respectively. As can be seen from the figures, when the soil cover depth ratio was relatively small (i.e., H / D = 0.5 ,   1 ), the failure mechanism in the random realizations was similar to the results in the deterministic analysis. The displacement contour extended up to the seabed surface, presenting a global failure mode as a whole. Meanwhile, due to the random distribution of the soil’s undrained shear strength, the displacement contours became asymmetric. Random bearing capacity factors (i.e., N u , ran ) deviated from the deterministic results (i.e., N u , det ), due to the existence of soil variability. In this study, N u , ran was calculated by the following equation:
N u , ran = V u , ran / D μ s u
where V u , ran denotes the uplift capacity in random soils.
It should be noted that Figure 4a shows the displacement contour when the random uplift capacity factor of the pipeline with H / D = 0.5 reached its maximum and its soil strength distribution corresponded to that shown in Figure 4c. Furthermore, Figure 4b plots the displacement contour when the uplift capacity factor was the smallest and its soil strength distribution corresponded to that shown in Figure 4d. This correspondence also applies in the results shown in Figure 5, Figure 6 and Figure 7. The influence of the spatial variability of s u on the failure mechanism was illustrated by establishing the relationship between the uplift capacity factor, the failure zone and the strength of the soil around the pipeline.
Taking the pipeline with H / D = 0.5 as an example, the failure zone in Figure 4a was larger than the deterministic result shown in Figure 3a and meanwhile, the soil strength around the pipeline was obviously greater than 30 kPa, which gave rise to the random uplift capacity factor ( N u , ran = 13.48 ) being significantly larger than the deterministic result ( N u , det = 8.98 ). By comparison, combined with Figure 4b,d, it is clear that a smaller failure zone and smaller soil strength around the pipe lead to a smaller random uplift capacity factor ( N u , ran = 5.63 ).
Figure 6 presents the displacement contours and corresponding soil strengths of pipelines with soil cover depth ratios of 2 in random soils. It was found that the failure mechanism in random soils was dependent on soil cover depth, but the results were different from the deterministic analysis due to the random distribution of soil strength. In uniform soil (ignoring soil variability), H / D = 2 was the critical soil cover depth ratio, that is, when H / D was greater than or equal to 2, the soil failure mode corresponded to the local failure mode. However, as shown in Figure 6a, when there existed a stronger interlayer around the pipeline, the displacement contour extended to the soil surface, showing a global failure mode. Conversely, as shown in Figure 6b, when the soil strength around the pipeline was weak, the failure mechanism corresponded to the local failure mode. This indicated that in random soils H / D = 2 was insufficient to ensure that the soil failure mode was the local failure one. For the pipeline with H / D = 2 in the spatially variable soil, the larger and smaller soil surrounding the pipeline made the failure modes to be global failure mode and local failure mode, respectively.
Figure 7 shows the displacement contours and corresponding soil strengths of pipelines with H / D = 3 . It was found that no matter whether the strength of the soil surrounding the pipeline was strong or weak, the failure zone would not extend to the soil surface, that is, the failure mechanism was the local failure mode. This means that when the spatial variability of soil was considered, the critical soil cover depth ratio of the rough pipelines under full tension was 3. For the foundation of different buried depths in spatially random soils, Li et al. [30] pointed out that the critical value of the buried depth ratio was 3, which agrees well with the results presented in this paper.

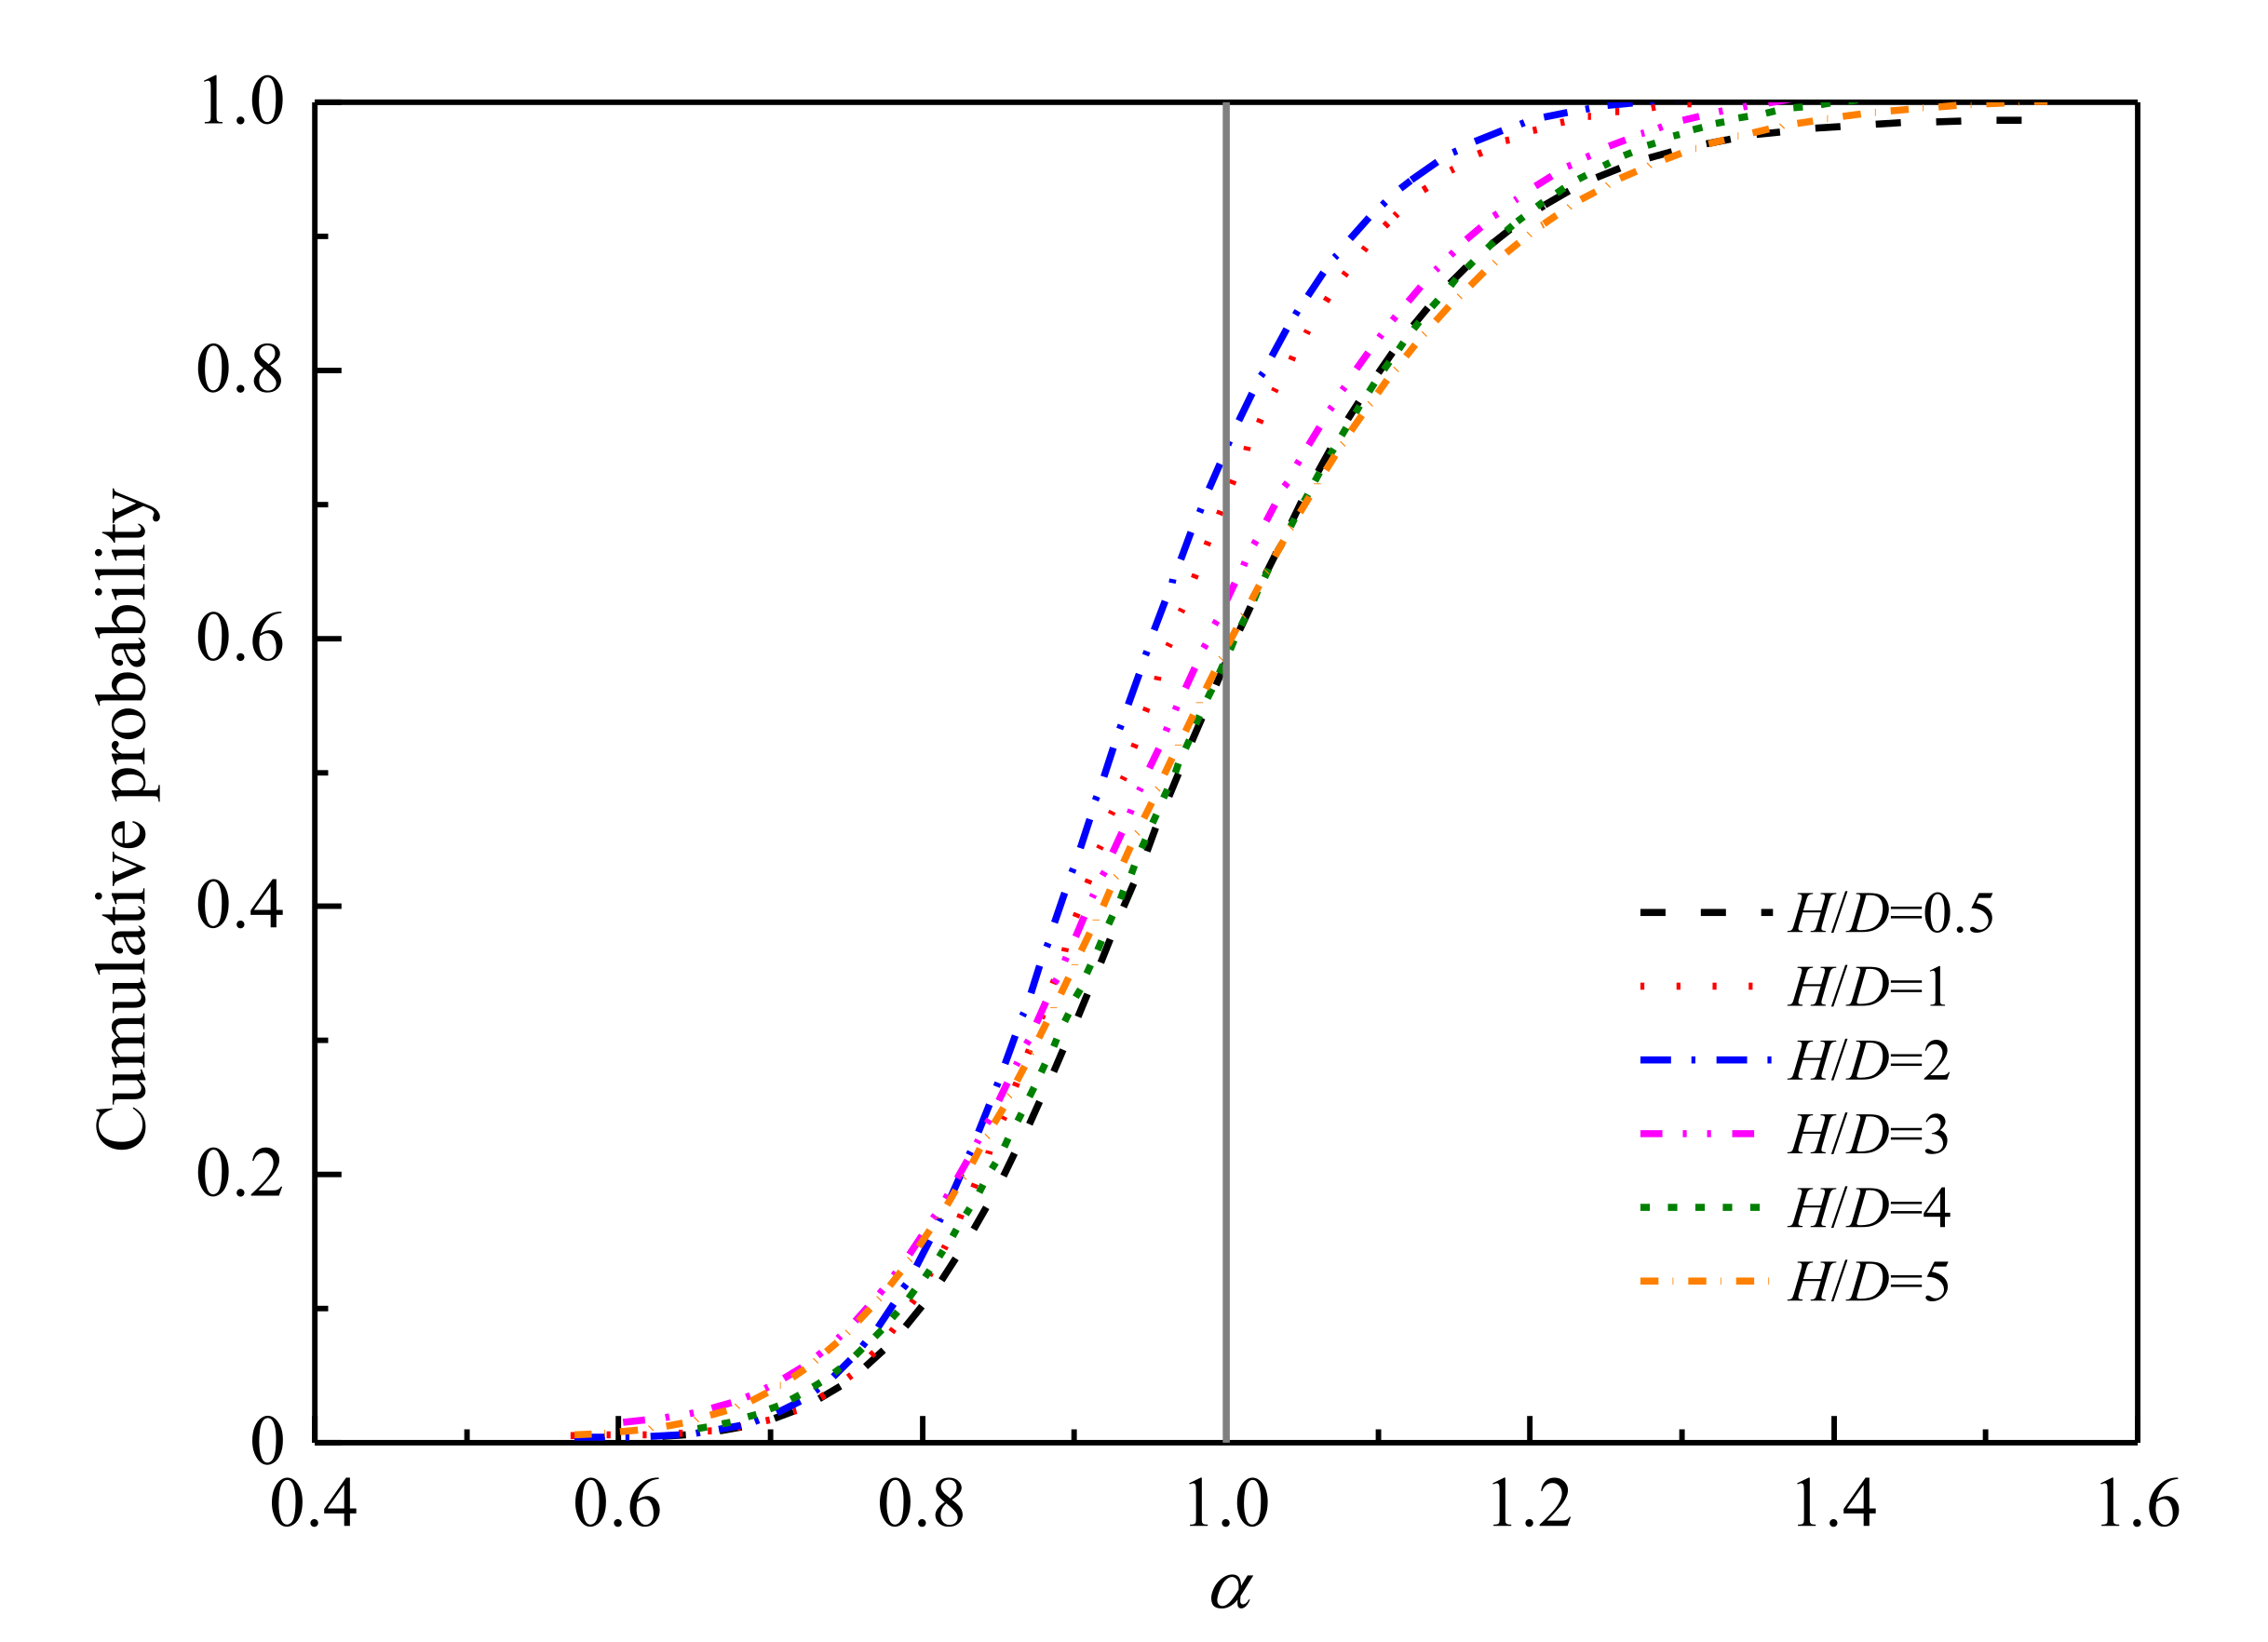
4.2. Uplift Capacity Factors for Pipelines at Various Depths

In the present study, Monte Carlo simulations were carried out for each random realization of soil strength for pipelines with different soil cover depth ratios. Then the statistical characteristics of random uplift capacity factors were determined. Generally, the errors of the Monte Carlo approach decrease with an increase in the number of simulations n sim . Thus, simulation accuracy can only be guaranteed once n sim is large enough. Figure 8 displays the results of the convergence analyses for the number of simulations required for pipelines with different soil cover depth ratios. It was found that in all random SSFE analyses, the mean and standard deviation of N u , ran converged over 200 simulations. Given that six soil cover depth ratios were considered in this paper, a total of 1200 random realizations of soil’s undrained shear strength were performed for Monte Carlo simulations.
Figure 9 shows the uplift capacity factors of pipelines buried at different depths in deterministic and random soils. Also plotted in the figure is the mean value of the random uplift capacity factor (i.e., μ N u , ran ). It was found that, due to consideration of the spatial variability of the soil strength, the bearing capacity factor was distributed in a large range, fluctuating between 5.5 and 18. Moreover, similar to the deterministic analyses, μ N u , ran increased as the soil cover depth ratio ( H / D ) increased and tended to be a constant value after H / D reached the critical depth ratio (i.e., H / D = 3 ), which was due to the transition from a shallow global failure mode to a deeply buried local failure mode. At the same time, for pipelines in random soils, μ N u , ran was smaller than that of the results of the deterministic analysis at the same soil cover depth ratio. This phenomenon has also been observed in other random finite element analyses, which can be attributed to the fact that once soil variability is taken into account, the failure zone tends to follow the weakest path, thereby reducing the bearing capacity [30].
Based on the above discussion, it can be suggested that the random distribution of the undrained shear strength of the soil significantly affected the uplift capacity factor of the pipeline, so it was necessary to carry out probabilistic analyses on its bearing capacity. For the random uplift capacity factor N u , ran of different soil cover depth ratios, the goodness-of-fit test was carried out. In this paper, the Kolmogorov–Smirnov (K–S) normal distribution goodness-of-fit test was used to verify whether N u , ran conformed to the lognormal distribution. Table 3 lists the mean and coefficient of variation of N u , ran (i.e., μ N u , ran and C O V N u , ran ) at various depths and the calculated p-values. As can be seen, all p-values were greater than 0.05, indicating that N u , ran followed the lognormal distribution [31]. Moreover, Figure 10 shows the histogram of the uplift capacity factor at different depths and the corresponding lognormal distribution fitting curve.
Regarding the bearing capacity of foundations in spatially variable soils, Griffiths and Fenton [32] suggested that failure can be defined as a situation where the random bearing capacity is less than the deterministic bearing capacity. This definition was also adopted in the current study—the failure was able to be expressed as when α was less than 1, where α = N u , ran / N u , det . Then, the failure probability was calculated by the cumulative probability of α . Figure 11 shows the cumulative probability of α under different soil cover depth ratios. It was seen that the probability of less than 1 was more than 50%, which means that ignoring the spatial variability of soil led to a high failure probability. For this reason, a safety factor (SF) was introduced to reduce the deterministic bearing capacity and the failure probability was defined as the probability that the random uplift capacity factor ( N u , ran ) was less than the reduced capacity factor ( N u , det / S F ). Since N u , ran followed a lognormal distribution, the failure probability can be calculated as follows:
p N u , ran < N u , det / S F = Φ ln N u , det / S F μ ln N u , ran σ ln N u , ran
where Φ denotes the cumulative function of normal distribution, μ ln N u , ran and σ ln N u , ran respectively denote the mean and standard deviation of the natural logarithm of N u , ran .
Table 4 summarizes the corresponding failure probability expressed in percentage for different safety factors. It was observed that the failure probability decreased sharply with the increase of the safety factor. In engineering applications, the failure probability is usually set at 1–0.1%, to ensure the safety of the structure [30]. For this reason, the safety factor corresponding to the failure probability below 1% was calculated and the results are shown in Table 5. It was seen that for pipelines with different soil cover depth ratios, a safety factor of 1.6 would ensure that the failure probability was less than 1%.

5. Conclusions

A two-dimensional random small-strain finite element analysis was carried out to study the uplift behavior of pipelines buried at various depths considering soil strength spatial variability. First, the reliability of the finite element model used in this paper was verified by comparisons with the results of past research. Then, the soil strength was simulated as a random field and a random finite element analysis was conducted using the Monte Carlo framework. Finally, the failure mechanism of each random realization of soil strength was compared and the probability analysis of the random uplift bearing capacity was performed. The major observations can be listed as follows:
(1) For rough pipelines under full tension, the random distribution of soil strength significantly affected its upward upheaval failure mechanism. When the spatial variability of soil was considered, the critical soil cover depth ratio corresponding to the transition of the failure mode from global to local failure was 3.
(2) For pipelines with different soil cover depth ratios, ignoring the soil variability would lead to a failure probability of more than 50%, resulting in an unconservative design.
(3) The failure probability would decrease sharply with the increase of the safety factor and a safety factor of 1.6 was required to satisfy the failure probability of less than 1%. This means that when considering the spatial variability of soil strength, a design guideline can specify a safety factor of 1.6 to reduce the deterministic results for achieving a target failure probability.
It is important to note that this study mainly focused on the uplift behavior of pipelines under different soil cover depth ratios when considering the spatial variability of soil strength and the conclusions obtained are only applicable to rough pipelines under full tension in specific soil strength configurations. The response to the upheaval buckling of pipelines was also affected by other factors, such as soil weight and the pipe–soil interface, etc., which require further research.

Author Contributions

Conceptualization, P.C. and F.L.; Formal analysis, C.L. and X.L.; Funding acquisition, K.Y.; Investigation, J.G.; Methodology, P.C., J.G., C.L. and F.L.; Resources, X.L. and K.Y.; Software, P.C.; Supervision, K.Y.; Validation, P.C.; Writing—original draft, P.C. and F.L. All authors have read and agreed to the published version of the manuscript.

Funding

This research was funded by the Shandong Excellent Young Scientists Fund Program (Overseas) (2022HWYQ-016), Shandong Provincial Natural Science Foundation (ZR2021QE254) and Guangdong Basic and Applied Basic Research Foundation (2021A1515110564).

Institutional Review Board Statement

Not applicable.

Informed Consent Statement

Not applicable.

Data Availability Statement

Not applicable.

Conflicts of Interest

The authors declare no conflict of interest.

References

  1. Sheil, B.B.; Byrne, B.W.; Martin, C.M. Rate effects on the uplift capacity of pipelines embedded in clay: Finite element modelling. Comput. Geotech. 2021, 137, 104155. [Google Scholar] [CrossRef]
  2. Maitra, S.; Chatterjee, S.; White, D.; Choudhury, D. Uplift resistance of buried pipelines: The contribution of seepage forces. Ocean. Eng. 2022, 250, 111037. [Google Scholar] [CrossRef]
  3. Seth, D.; Manna, B.; Kumar, P.; Shahu, J.T.; Fazeres-Ferradosa, T.; Taveira-Pinto, F.; Carvalho, H. 2021, Uplift and lateral buckling failure mechanisms of offshore pipes buried in normally consolidated clay. Eng. Fail. Anal. 2022, 121, 105161. [Google Scholar] [CrossRef]
  4. Kumar, P.; Seth, D.; Manna, B.; Shahu, J.T. Lateral and Uplift Capacity of Pipeline Buried in Seabed of Homogeneous Clay. J. Pipeline Syst. Eng. Pract. 2021, 12, 04021020. [Google Scholar] [CrossRef]
  5. Maitra, S.; Chatterjee, S.; Choudhury, D. Generalized framework to predict undrained uplift capacity of buried offshore pipelines. Can. Geotech. J. 2016, 53, 1841–1852. [Google Scholar] [CrossRef]
  6. Chen, R.P.; Zhu, B.; Ni, W.J. Uplift tests on full-scale pipe segment in lumpy soft clay backfill. Can. Geotech. J. 2016, 53, 578–588. [Google Scholar] [CrossRef]
  7. Martin, C.M.; White, D.J. Limit analysis of the undrained bearing capacity of offshore pipelines. Géotechnique 2012, 62, 847–863. [Google Scholar] [CrossRef]
  8. Brennan, A.J.; Ghahremani, M.; Brown, M.J. Strength reduction for upheaval buckling of buried pipes in blocky clay backfill. Ocean. Eng. 2017, 130, 210–217. [Google Scholar] [CrossRef] [Green Version]
  9. Liu, R.; Basu, P.; Xiong, H. Laboratory tests and thermal buckling analysis for pipes buried in Bohai soft clay. Mar. Struct. 2015, 43, 44–60. [Google Scholar] [CrossRef]
  10. Phoon, K.K.; Kulhawy, F.H. Characterization of geotechnical variability. Can. Geotech. J. 1999, 36, 612–624. [Google Scholar] [CrossRef]
  11. Phoon, K.K.; Kulhawy, F.H. Evaluation of geotechnical property variability. Can. Geotech. J. 1999, 36, 625–639. [Google Scholar] [CrossRef]
  12. Liu, Y.; Zhang, L. Seismic response of pile–raft system embedded in spatially random clay. Géotechnique 2019, 69, 638–645. [Google Scholar] [CrossRef]
  13. Liu, Y.; Zhang, W.; Zhang, L.; Zhu, Z.; Hu, J.; Wei, H. Probabilistic stability analyses of undrained slopes by 3D random fields and finite element methods. Geosci. Front. 2018, 9, 1657–1664. [Google Scholar] [CrossRef]
  14. Liu, Y.; He, L.Q.; Jiang, Y.J.; Sun, M.M.; Chen, E.J.; Lee, F.H. Effect of in situ water content variation on the spatial variation of strength of deep cement-mixed clay. Géotechnique 2019, 69, 391–405. [Google Scholar] [CrossRef] [Green Version]
  15. Liu, Y.; Jiang, Y.J.; Xiao, H.; Lee, F.H. Determination of representative strength of deep cement-mixed clay from core strength data. Géotechnique 2017, 67, 350–364. [Google Scholar] [CrossRef]
  16. Liu, Y.; Lee, F.H.; Quek, S.T.; Chen, E.J.; Yi, J.T. Effect of spatial variation of strength and modulus on the lateral compression response of cement-admixed clay slab. Géotechnique 2015, 65, 851–865. [Google Scholar] [CrossRef]
  17. Chen, X.; Li, D.; Tang, X.; Liu, Y. A three-dimensional large-deformation random finite-element study of landslide runout considering spatially varying soil. Landslides 2021, 18, 3149–3162. [Google Scholar] [CrossRef]
  18. Chen, X.J.; Fu, Y.; Liu, Y. Random finite element analysis on uplift bearing capacity and failure mechanisms of square plate anchors in spatially variable clay. Eng. Geol. 2022, 304, 106677. [Google Scholar] [CrossRef]
  19. Charlton, T.S.; Rouainia, M. A probabilistic approach to the ultimate capacity of skirted foundations in spatially variable clay. Struct. Saf. 2017, 65, 126–136. [Google Scholar] [CrossRef] [Green Version]
  20. Cheng, P.; Liu, Y.; Li, Y.P.; Yi, J.T. A large deformation finite element analysis of uplift behaviour for helical anchor in spatially variable clay. Comput. Geotech. 2022, 141, 104542. [Google Scholar] [CrossRef]
  21. Luo, W.; Li, J. Effects of installation on combined bearing capacity of a spudcan foundation in spatially variable clay. Appl. Ocean. Res. 2022, 120, 103055. [Google Scholar] [CrossRef]
  22. Yi, J.T.; Huang, L.Y.; Li, D.Q.; Liu, Y. A large-deformation random finite-element study: Failure mechanism and bearing capacity of spudcan in a spatially varying clayey seabed. Géotechnique 2020, 70, 392–405. [Google Scholar] [CrossRef]
  23. Charlton, T.S.; Rouainia, M. Probabilistic analysis of the uplift resistance of buried pipelines in clay. Ocean. Eng. 2019, 186, 105891. [Google Scholar] [CrossRef]
  24. Liu, Y.; Lee, F.H.; Quek, S.T.; Beer, M. Modified linear estimation method for generating multi-dimensional multi-variate Gaussian field in modelling material properties. Probabilistic Eng. Mech. 2014, 38, 42–53. [Google Scholar] [CrossRef]
  25. Taiebat, H.A.; Carter, J.P. Numerical studies of the bearing capacity of shallow foundations on cohesive soil subjected to combined loading. Géotechnique 2000, 50, 409–418. [Google Scholar] [CrossRef] [Green Version]
  26. Liu, F.; Yi, J.; Cheng, P.; Yao, K. Numerical simulation of set-up around shaft of XCC pile in clay. Geomech. Eng. 2020, 21, 489–501. [Google Scholar]
  27. Peng, Y.; Liu, H.; Li, C.; Ding, X.; Deng, X.; Wang, C. The detailed particle breakage around the pile in coral sand. Acta Geotech. 2021, 16, 1971–1981. [Google Scholar] [CrossRef]
  28. Yi, J.T.; Liu, F.; Zhang, T.B.; Yao, K.; Zhen, G. A large deformation finite element investigation of pile group installations with consideration of intervening consolidation. Appl. Ocean. Res. 2021, 112, 102698. [Google Scholar] [CrossRef]
  29. Randolph, M.F.; Houlsby, G.T. The limiting pressure on a circular pile loaded laterally in cohesive soil. Géotechnique 1984, 34, 613–623. [Google Scholar] [CrossRef]
  30. Li, J.; Tian, Y.; Cassidy, M.J. Failure mechanism and bearing capacity of footings buried at various depths in spatially random soil. J. Geotech. Geoenviron. Eng. 2015, 141, 04014099. [Google Scholar] [CrossRef] [Green Version]
  31. Cheng, P.; Yi, J.T.; Liu, F.; Dong, J.J. Characterization of Model Uncertainty for the Vertical Pullout Capacity of Helical Anchors in Cohesive Soils. J. Mar. Sci. Eng. 2020, 8, 738. [Google Scholar] [CrossRef]
  32. Griffiths, D.V.; Fenton, G.A. Bearing capacity of spatially random soil: The undrained clay Prandtl problem revisited. Géotechnique 2001, 51, 351–359. [Google Scholar] [CrossRef]
Figure 1. Problem geometry in this study.
Sustainability 14 08139 g001
Figure 2. Exemplar finite element mesh and boundary conditions ( H / D = 2 ).
Sustainability 14 08139 g002
Figure 3. Uplift failure mechanisms for pipelines embedded at different depths in deterministic soils: (a) H / D = 0.5 ; (b) H / D = 1 ; (c) H / D = 2 ; (d) H / D = 3 .
Sustainability 14 08139 g003
Figure 4. Displacement contours and corresponding soil‘s undrained strength of two random realizations at 0.5D depth: (a,b) displacement contours; (c,d) soil‘s undrained strength.
Sustainability 14 08139 g004
Figure 5. Displacement contours and corresponding soil‘s undrained strength of two random realizations at 1D depth: (a,b) displacement contours; (c,d) soil‘s undrained strength.
Sustainability 14 08139 g005
Figure 6. Displacement contours and corresponding soil‘s undrained strength of two random realizations at 2D depth: (a,b) displacement contours; (c,d) soil‘s undrained strength.
Sustainability 14 08139 g006
Figure 7. Displacement contours and corresponding soil’s undrained strength of two random realizations at 3D depth: (a,b) displacement contours; (c,d) soil’s undrained strength.
Sustainability 14 08139 g007
Figure 8. Variation trend for the mean and standard deviation of N u , ran with the number of Monte Carlo simulations. (a) Mean of N u , ran . (b) Standard deviation of N u , ran .
Sustainability 14 08139 g008
Figure 9. Uplift capacity factors of pipelines buried at various depths in deterministic and random soils.
Sustainability 14 08139 g009
Figure 10. Histogram and fitted lognormal distribution of pipelines with embedment ratio H / D of: (a) 0.5; (b) 1; (c) 2; (d) 3; (e) 4; (f) 5.
Sustainability 14 08139 g010
Figure 11. Cumulative probability of α for pipelines with different embedment ratios.
Sustainability 14 08139 g011
Table 1. The magnitudes of the pipe and soil parameters.
ParameterSymbolProperty ValueUnits
Pipe diameter D 1m
Soil density ρ 1600 kg / m 3
Poisson’s ratio ν 0.49
Undrained shear strength s u 30 kPa
Young’s modulus E 500 s u MPa
Table 2. Comparison of uplift capacity factor between this study and previous numerical analysis.
H / D N u   (Maitra et al. [5]) N u   ( This   Study )
0.59.028.98
110.4710.59
211.9812.11
311.9812.11
411.9812.11
511.9812.11
611.9812.11
Table 3. Uplift capacity factor statistics in random soil and the K–S test results.
H / D μ N u , r a n C O V N u , r a n p-Values
0.58.650.130.88
19.960.150.61
211.210.160.72
311.770.160.92
411.770.160.86
511.770.170.83
Table 4. Failure probabilities for different SF and soil cover depth ratios.
SF H / D
0.512345
152.9570.4574.4963.8758.9759.29
1.213.7619.0621.8322.0217.1420.76
1.41.891.922.314.242.604.43
1.60.170.090.120.540.250.67
1.80.01//0.050.020.08
2/////0.01
Note: / represents that failure probability is less than 0.01%.
Table 5. Safety factors for different failure probabilities and soil cover depth ratios.
Failure Probability (%) H / D
0.512345
11.461.451.461.541.491.56
0.11.641.601.611.751.671.78
0.011.771.701.711.891.811.94
Publisher’s Note: MDPI stays neutral with regard to jurisdictional claims in published maps and institutional affiliations.

