Abstract
The ecological protection and sustainable development of Urumqi have become an important part of the high-quality growth of the urban agglomeration on the northern slope of Tianshan Mountain. Under the impacts of multi-source factors, the ecological landscape pattern of Urumqi has changed due to it being in a fragile eco-environment, so an ecological network is desperately needed to enhance ecological security patterns. Taking Urumqi city as the study area, the ecological risk evaluation model and the minimum cumulative resistance model were integrated to analyze the spatial and temporal features of landscape ecological risk from 2000 to 2020, and the future land use simulation model was used to predict the ecological risk pattern of Urumqi in 2030, construct a landscape ecological network, and propose ecological security protection strategies. Since 2000, land use in Urumqi has undergone drastic changes: the built-up land area has increased significantly, the landscape has diversified, and landscape fragmentation has shown a decreasing trend from the main urban area as the core to the urban fringe. The high-risk landscape ecology shows a decreasing trend from east to west, mainly in the bare land areas with sparse vegetation, whereas the risk is relatively low in woodland, arable land, and built-up areas. The change of risk in the study area is mainly influenced by the typical defective factors of oasis cities such as urban expansion, land desertification, and sparse vegetation. The landscape ecological network is mainly located in the southwest, central, and east of the study area, whereas there is no corridor distribution in the north and southeast, which is mainly caused by the special geographical location and climatic conditions. The ecological network mainly consists of 10 ecological sources and 10 ecological corridors and proposes conservation strategies for the optimization of the landscape pattern and for the construction of the ecological security pattern in Urumqi, providing a guide for the improvement of ecological security.
1. Introduction
Landscape pattern change is the most direct manifestation of land use/land cover change (LUCC), which is a combination of natural, socioeconomic, and other factors [1], and shows a close link between the degree of land use and activeness. The rapid development of human society introduces great pressure and risk to the natural environment, which, in turn, affects the function and structure of the natural landscape and has a profound impact on the ecological environment of the whole region [2,3,4].
Since the concept of ecological risk emerged in the 1990s, ecological risk has played an important role in ecological quality assessment and ecological environment management [5]. Early research primarily concentrated on ecological risk assessment [6,7]. The research objects included urban land, watersheds, and islands [8,9,10], and the research methods encompassed ecological models, numerical models, and landscape ecological models [11]. Most ecological risk assessments of landscapes (LER) are currently based on the ecological “source-sink” theory or on assessing the evolution of their landscape patterns. To a certain extent, the latter shatters the traditional model of inherently integrated ecosystem evaluation, and takes LUCC results as the cornerstone to directly evaluate the spatial evolution of LER at a certain geographical scale, thus reflecting more finely the implications of LUCC on the relationship between ecological processes and functions and gradually becomes the hot research field of “landscape pattern-ecological process linkage” [12,13].
The relationship between LER and landscape ecological network construction is extremely close. The LER can point out the current situation of regional ecological safety and indicate a path for the improvement of the ecological network of geographic landscape, whereas the construction of the landscape ecological network needs to be realized by active human intervention in the ecological environment to lighten ecological risks and finally contribute to the construction of geographic ecological safety pattern [14]. The identification of decisive ecological elements and the maintenance of ecosystem functions is the basic spatial vein for the formation of ecological networks, consisting of three systems: ecological sources, ecological corridors, and ecological nodes. At present, the MCR model is widely used to construct ecological networks, which was first proposed by Knaapen in accordance with the principles of landscape ecology [15]. It has the advantage of considering both distance and resistance and has good applicability and extensibility [5,16]. The MCR model has been widely used by many academicians in various fields: monitoring non-point source pollution, water environmental protection, determining urban extension boundaries [17,18] to optimize the landscape pattern by constructing a landscape cumulative resistance surface, finding the “ corridor” with the least resistance in the cumulative resistance surface, and constructing key ecological elements such as ecological corridors and ecological nodes.
A joint study simulating urban expansion and regional corridors is needed to fill a temporary gap regarding the impact of urban expansion areas in Urumqi on potential corridors. Currently, the Future Land Use Simulation (FLUS) model [19,20] is a meta-automata-based land use prediction model that can maturely simulate the spatial evolution pattern of land use in different time periods and scenarios and spatially allocate the simulated land use quantity demand based on the transformation rules and quantitative relationships between each driver and land use type using a roulette selection algorithm [21]. However, this model exists to accurately simulate the number of land use outcomes, so it needs to be combined with other land use forecasting models or methods to estimate future land use distribution patterns. The Markov model is a land-use change prediction model that focuses on time dimension analysis and has the advantage of high long-term quantity prediction efficiency [22,23]. Combining it with the FLUS model can upgrade the prediction accuracy of the quantitative demand of land use; the strengths of the two models in quantitative forecasting and spatial allocation are fully demonstrated, and the dual simulation effects in space and quantity are better utilized.
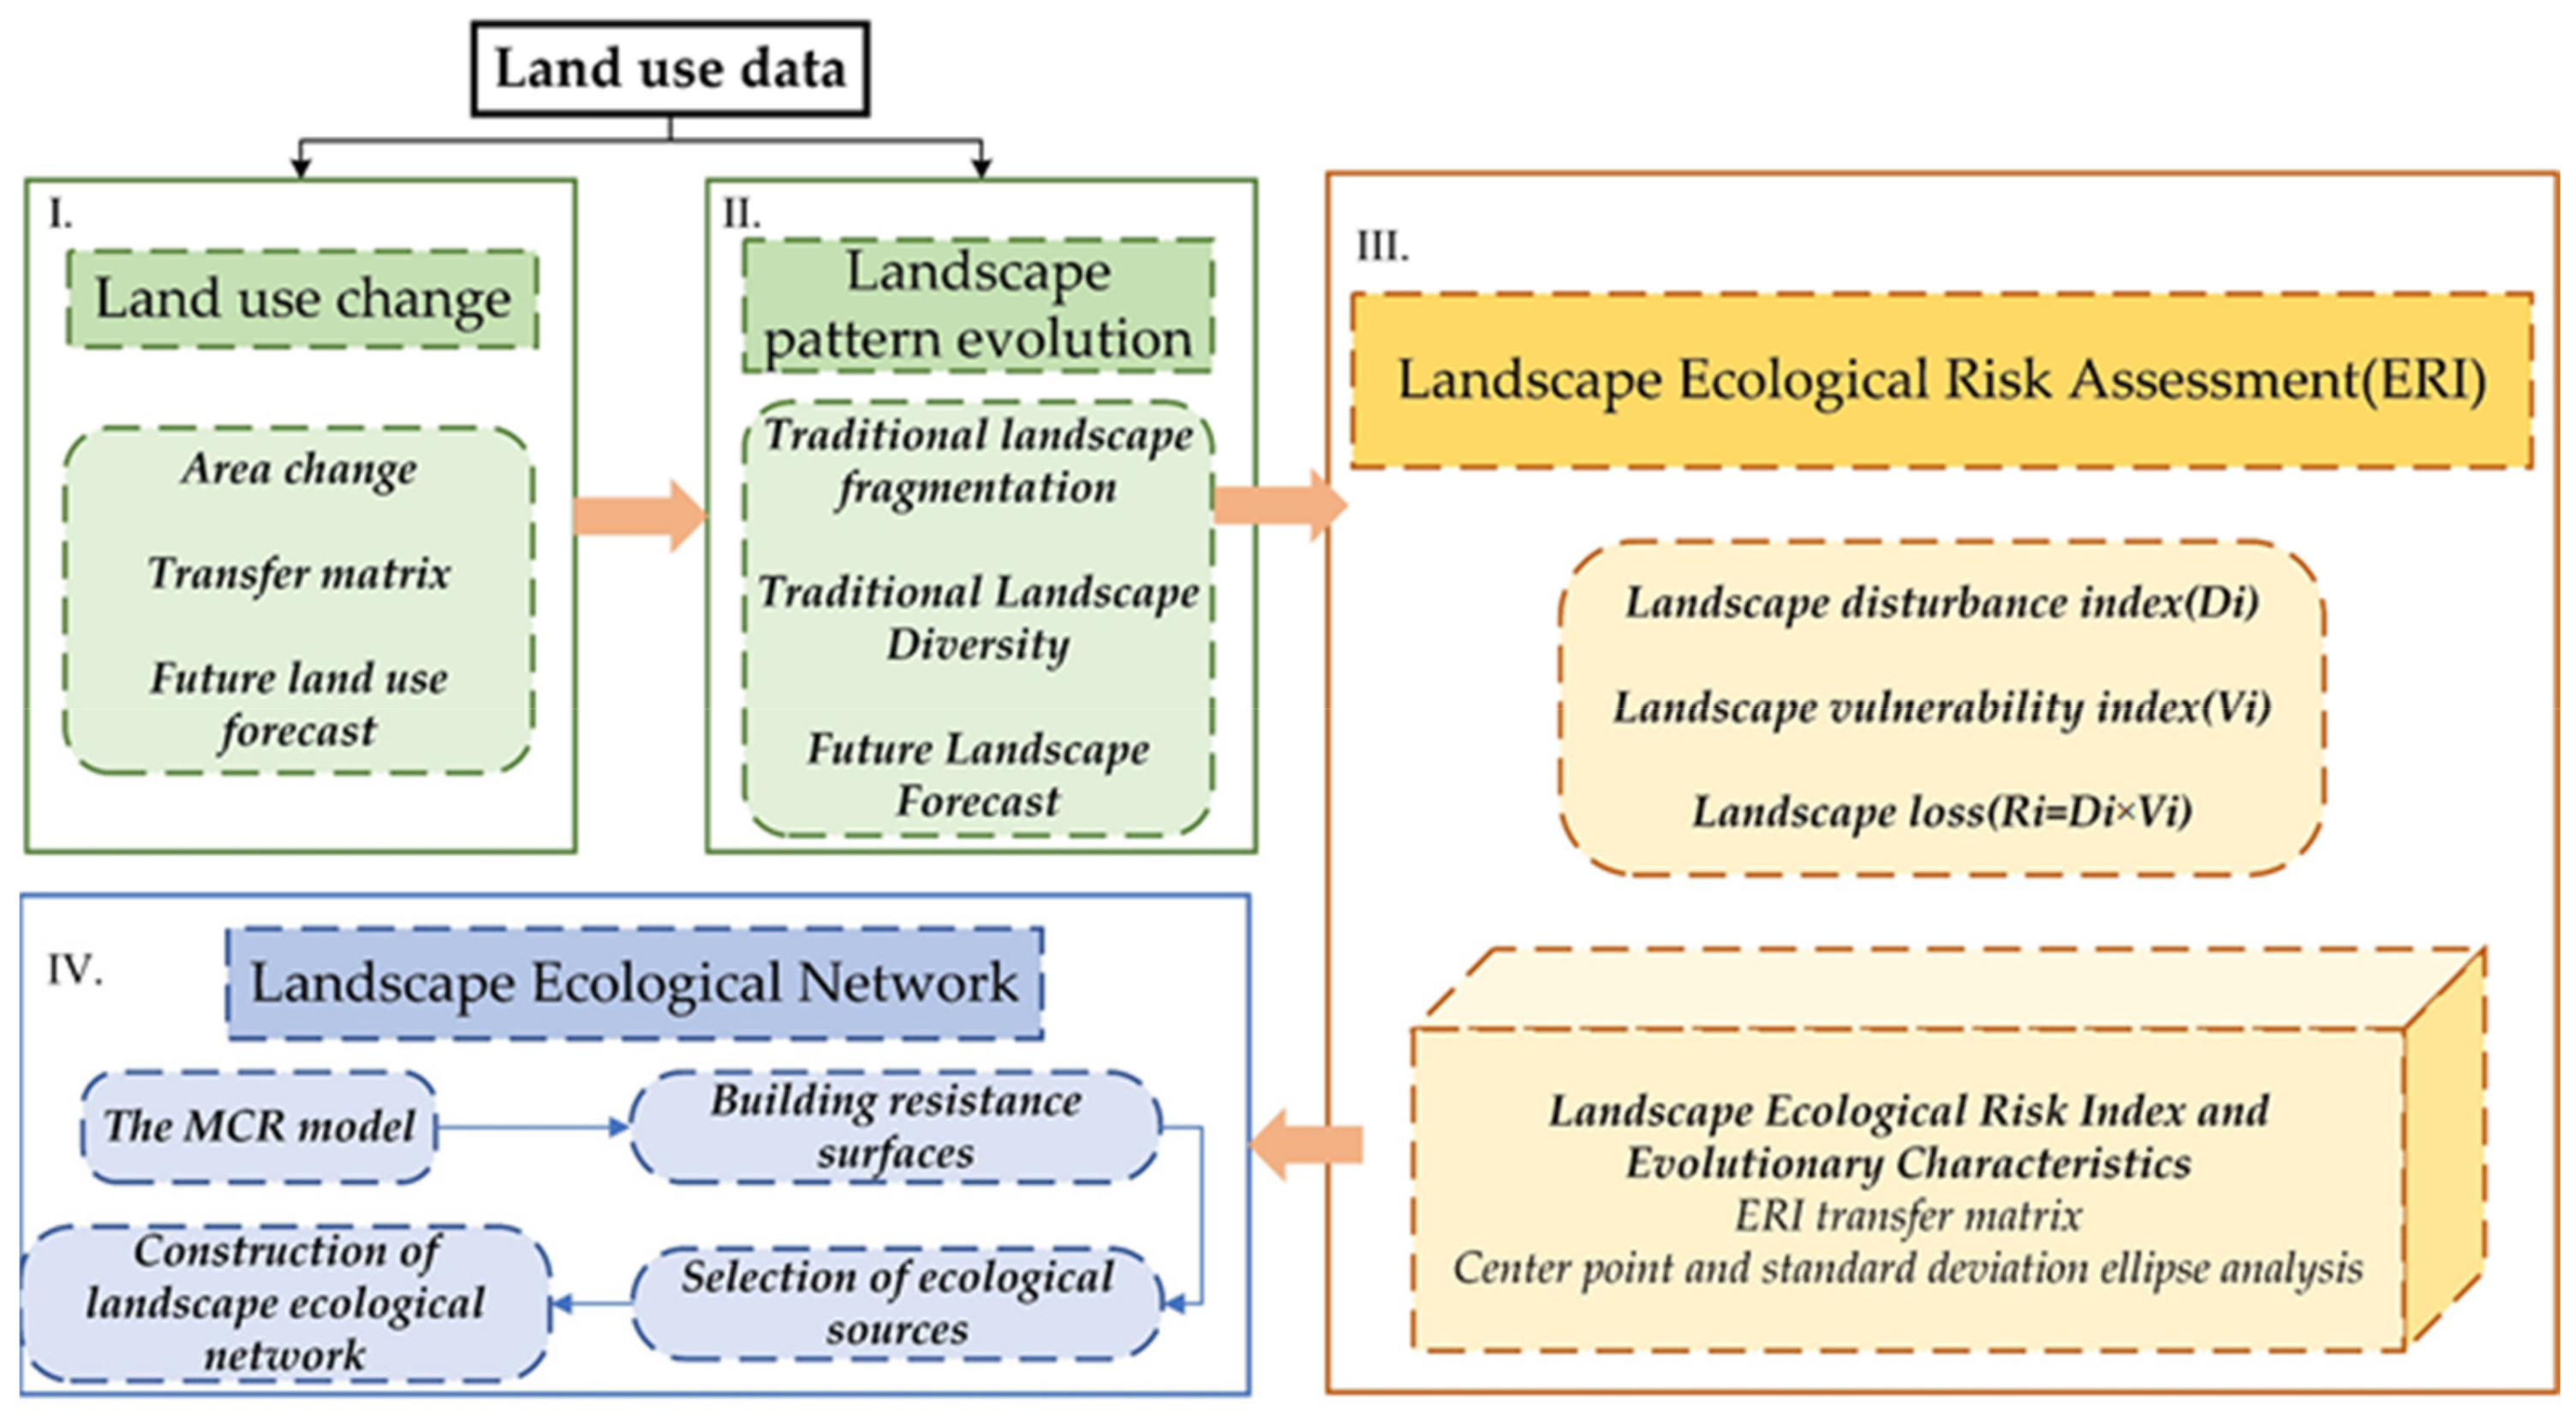
Urumqi is a paradigm example oasis city in the arid region of northwest China. With the in-depth implementation of “One Belt, One Road” and the construction of ecological civilization construction, how to reasonably gather industries and population, better undertake the “Silk Road Economic Belt” important node cities, and promote regional green development remain a series of issues in sustainable development. Therefore, it is more meaningful to clarify the spatial and temporal evolutionary characteristics of LER in Urumqi, analyze the landscape ecological network structure using the composite network method, and to predict the future ecological risks in Urumqi in 2035 for improving the viability and success of sustainable development in the region (Figure 1). On the one hand, it is also conducive to the better optimization of urban resource allocation and the promotion of coordinated social development. On the other hand, it is of practical significance to the stability of the ecosystem and thus it has a contributive role in improving the ecological security pattern of important node cities in northwest China.
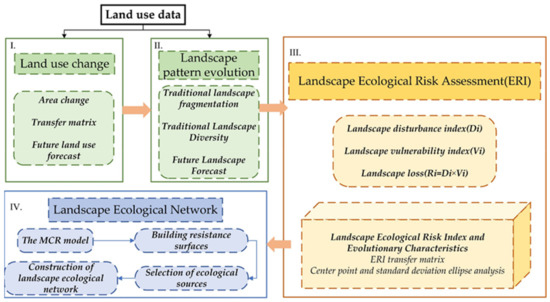
Figure 1.
Research framework.
2. Study Area and Materials
2.1. Study Area
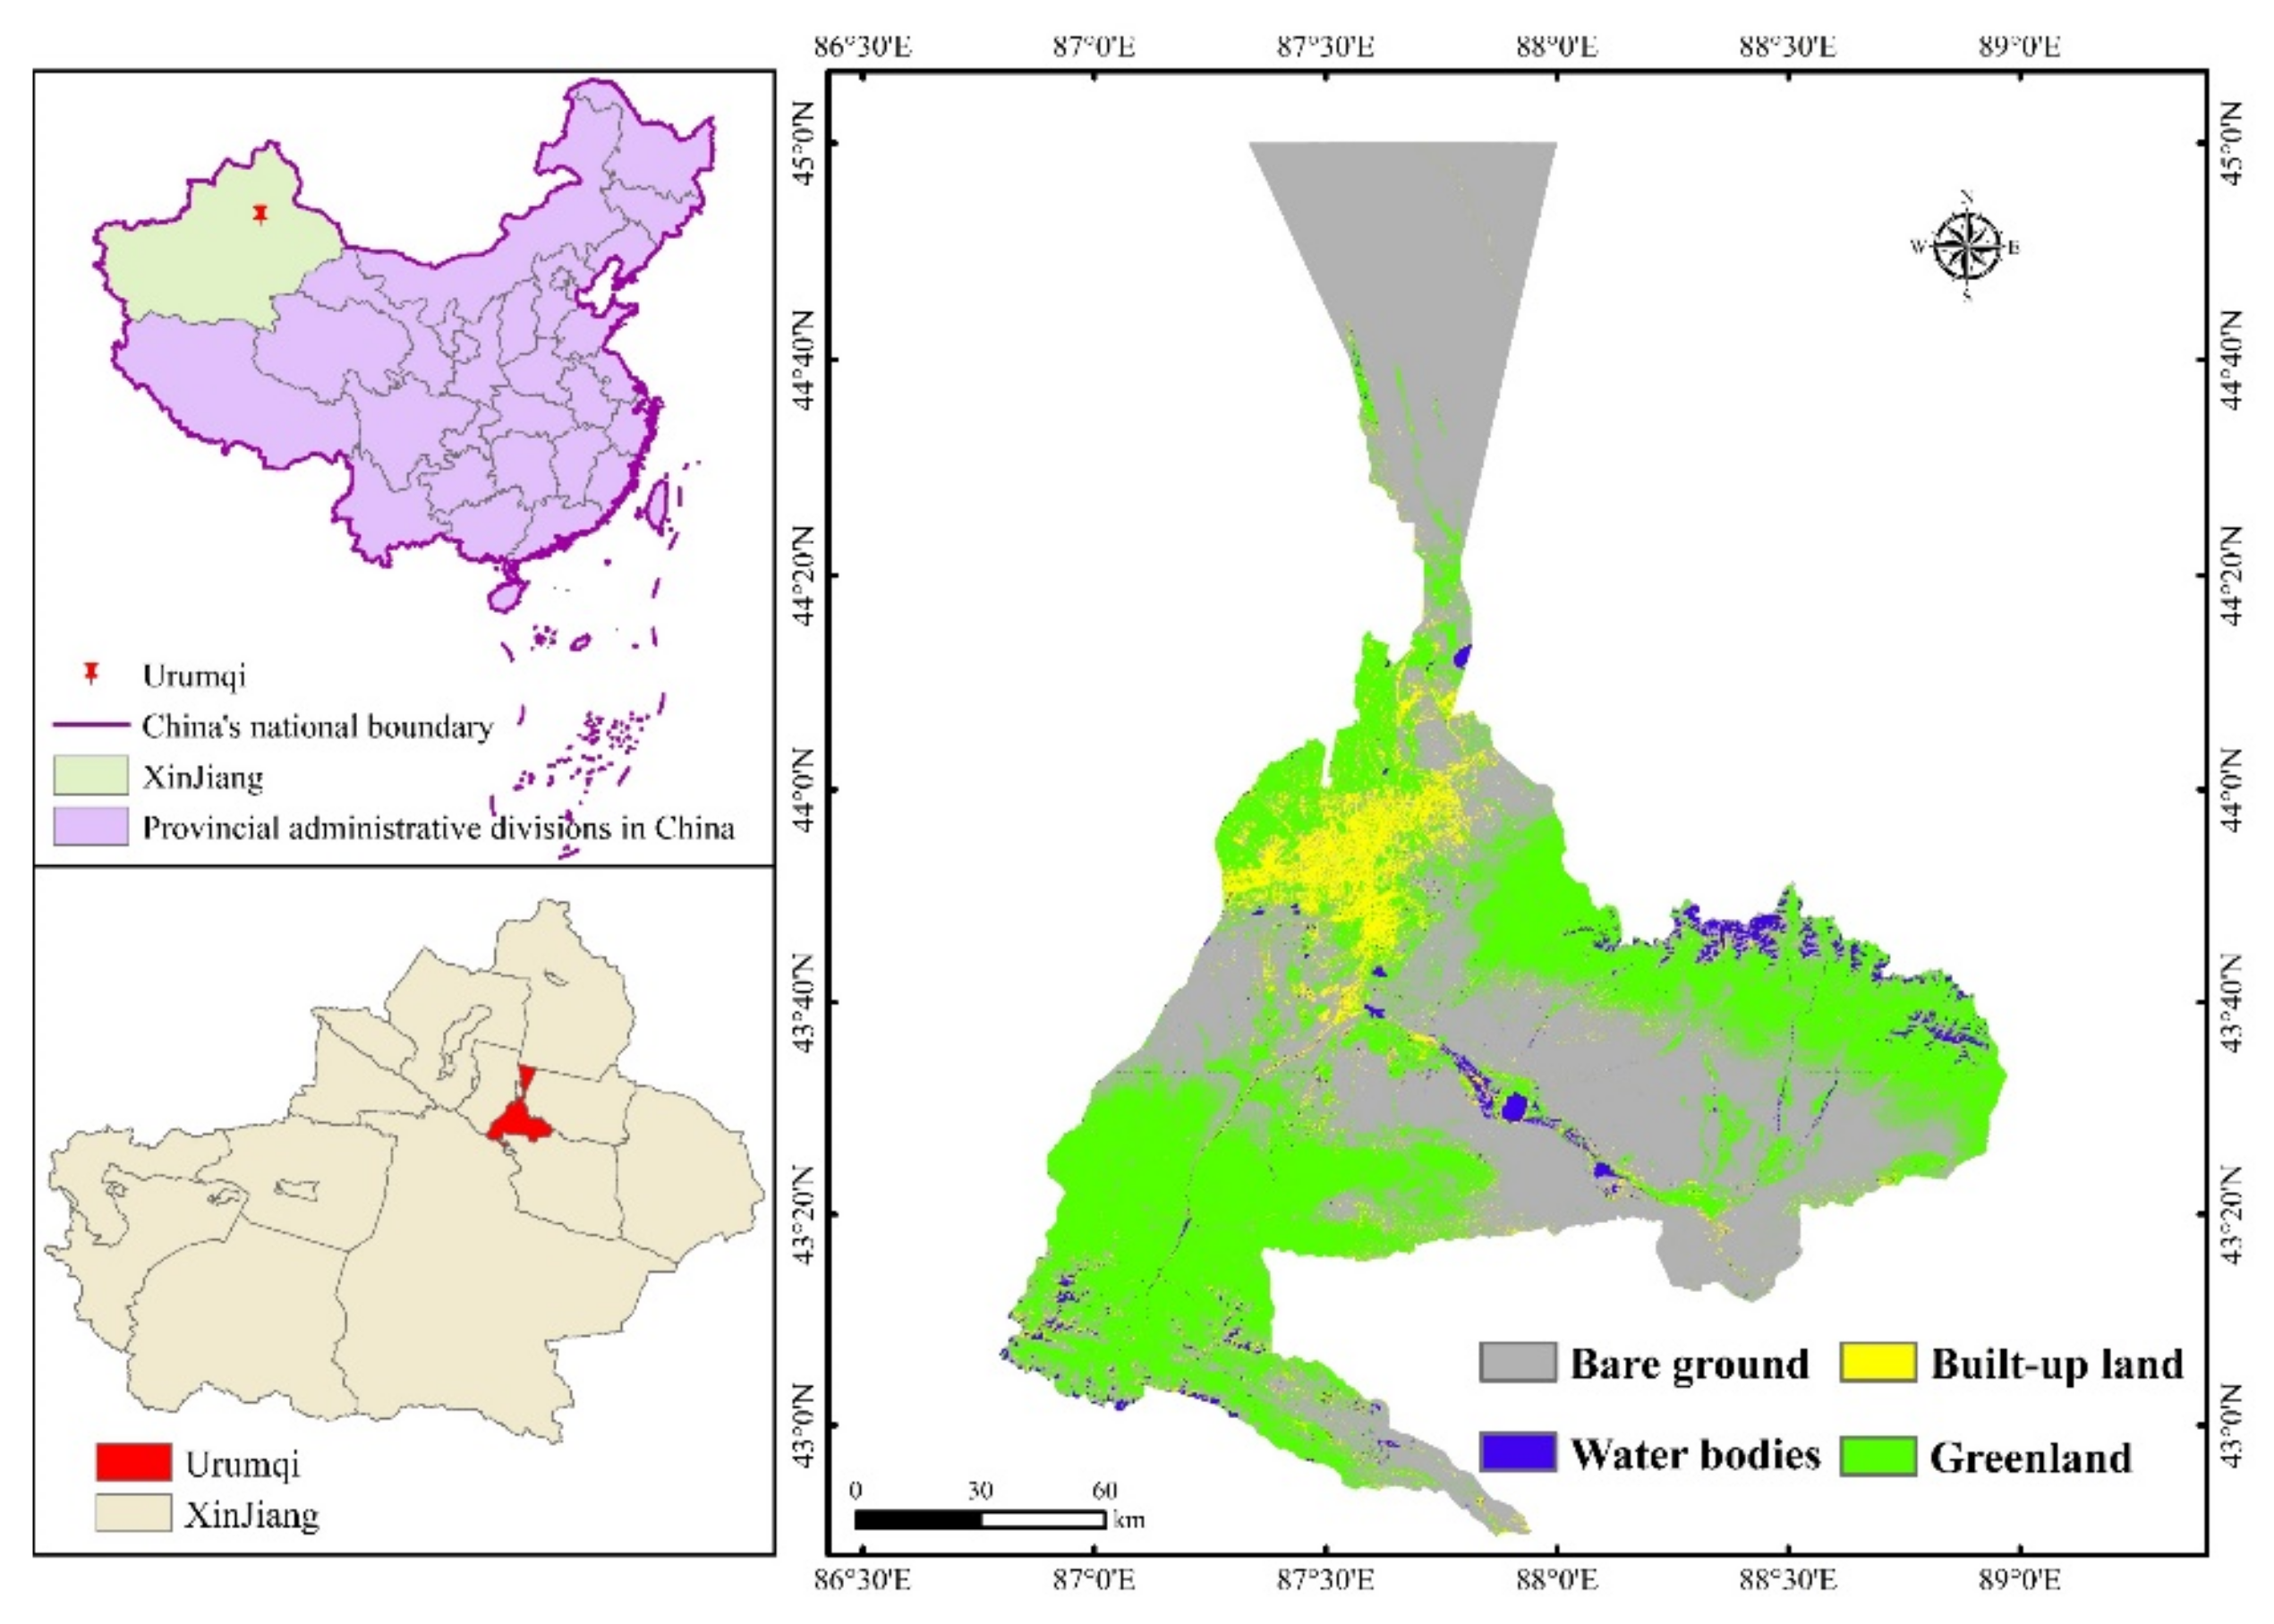
Urumqi is situated at the foot of the northern slope of the Tianshan Mountains in Xinjiang, China, and is situated at the southern edge of the Junggar Basin, and has an average elevation of about 800 m, with the highest elevation, Bogda Peak, reaching about 5445 m. The city is surrounded by mountains on three sides, forming a narrow topography that is high and narrow in the southeast and low and wide in the northwest, making a “T” shape. The area is dry and there is a lack of rain all year round and has sparse vegetation and a fragile ecological environment, all of which are characteristics of typical temperate semi-arid continental climates [24] (Figure 2). As the core location of Xinjiang’s politics, culture, and economy, Urumqi is one of the important economic centers in northwest China, an important window for opening up economic and cultural exchange to the outside world, as an important node in China′s opening to the west its positive influence on the whole of Xinjiang and much of Central Asia is increasing, gradually becoming a comprehensive modern oasis city.
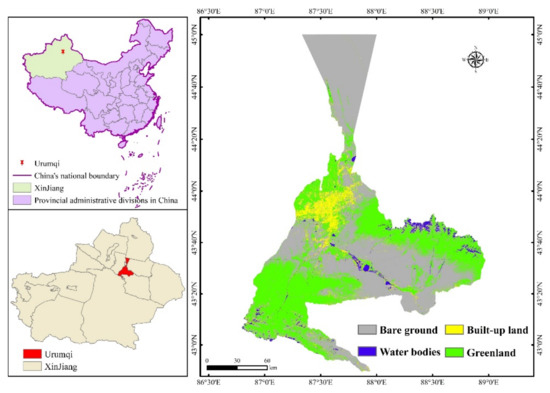
Figure 2.
Overview of the study area.
Because of the accelerating pace of urbanization in Urumqi, the contradiction between the urban layout and landscape structure has become increasingly acute, and a large variety of natural land types have been displaced by man-made surfaces, urban green areas have been reduced, and the problem of contradictory human–land relations has intensified. Understanding the characteristics of the ecological risk evolution pattern in Urumqi is the basis and key to taking reasonable measures to protect ecosystem security, and building a landscape ecological network will have an impact on the coordination as well as the healthy and sustainable development of urban land use in Urumqi to a certain extent.
2.2. Data Sources and Pre-Processing
In this study, three phases of Landsat TM (Thematic Mapper) and OLI (Operational Land Imager) remote sensing image data from 2000, 2010, and 2020, were used, and the data from the USGS had a spatial resolution of 30 m (Table 1). The imaging time was chosen to be from July to September due to the presence of good weather conditions, and the cloudiness of the images was below 2%, which mitigated to some extent the negative effects of seasonal changes. The DEM data originated from a geospatial data cloud and had a resolution of 30 m × 30 m. The location data for major highways, major railroads, prefecture-level cities, and county-level cities originated from the National Basic Geographic Information Center.

Table 1.
Information description of remote sensing image data.
In this paper, the random forest algorithm [25,26] was used to combine 11 land use types into four primary land use units (Table 2), namely, green land, built-up land, water bodies, and bare land (including mountainous areas without vegetation cover) [27], in order to upwardly adjust the classification accuracy by reducing the land use types [28]. The validation of the classification results showed that the results of the land use types decoded by random forest III with Kappa coefficients were all in the range of 0.8, which reached the classification accuracy standard using medium- and high-resolution remote sensing image data [29,30].

Table 2.
Land use classification of Urumqi City.
3. Research Methods
3.1. Landscape Ecological Risk Assessment
3.1.1. Landscape Pattern Index Analysis
In this study, the NP (number of patches), LPI (Largest patch index), SHDI (Shannon diversity index), DIVISION (separation), and AI (aggregation index) were picked to indicate the landscape pattern characteristics of Urumqi city (Table 3) and to avoid the problem of data redundancy as far as possible. Using FRAGSTATS software, the actual situation of Urumqi city was taken into account with the previous research results [31,32,33], and a moving window of 1200 m was used to study the fragmentation and diversity of the landscape patterns in Urumqi.

Table 3.
Landscape index meaning.
3.1.2. Landscape Risk Index Calculation
Landscape indices condense information on landscape patterns and can be used to analyze different ecological processes at each scale to demonstrate the structural features and spatial and temporal pattern development of the eco-landscape [34,35]. On the basis of earlier studies on LER evaluation [36,37] and combined with the characteristics of the study area and the ecological relevance of the landscape index, the calculations of repeated values and smaller values were discarded after repeated experiments. Landscape fragmentation, landscape separation, the landscape fractal dimension index, landscape disturbance, landscape vulnerability, and landscape loss were selected as the risk evaluation indicators (Table 4) and were used to construct the LER index and to characterize the spatial differentiation and pattern changes of LER in Urumqi. It can be calculated as follows:

Table 4.
Calculation method of landscape pattern index.
In the formula, k is the risk cell; i is the landscape type; N is the number of landscape types; Aki is the area of landscape type i in k risk cells; Ak is the area of the k-th risk cell; Di is the landscape disturbance index; Vi is the landscape vulnerability index. The higher the ERI value, the higher the ecological risk. The specific formula and description are shown in Table 4.
During urbanization, the ecosystems represented by different landscapes are subject to different degrees of external disturbances analogous to the external disturbances created by negative changes in resources and the environment due to population expansion. The greater the disturbance, the riskier the ecology, the higher the value [38,39], and the magnitude of the external disturbance is generally rendered using the landscape disturbance index. Studies have shown that the development of built-up land, the destruction of green spaces, and the construction of road networks have an impact on the urban landscape. Therefore, landscape fragmentation, detachment, and fractal dimensions can reflect the degree of disturbance to the landscape by human activities [40]. Among them, the higher the value of the landscape fragmentation index indicates that the internal structure of a single landscape unit is less stable and the safety coefficient of the ecosystem is lower. The index is generally used to reflect the severity of fragmentation of the whole landscape or a certain type of landscape under a specific setting [41]. The fragmentation degree of the spatial and temporal distribution of patches in a specific landscape type is generally expressed by the landscape separation index [42]. To some extent, the landscape fractal dimension can capture the sophistication of the patches and landscape patterns and the influence of external activities on landscape patterns, and its value usually ranges from 1 to 2. The larger the value, the more complex the geometry of the landscape [43]. Therefore, in this study we have chosen the landscape fragmentation index (F), separation index (S), and fractal dimension index (FD) to embody the magnitude of human production and life disturbance to the spatial and temporal distribution of the landscape, that is, the landscape disturbance index. In previous studies [44], the weights of each landscape for indexes a, b, and c were set to 0.5, 0.3, and 0.2, respectively.
The landscape vulnerability index is a composite index that measures the response of different landscape types to external disturbances or risks and the difficulty of falling into an unstable state. When the vulnerability index increases, the landscape is characterized by a weakened ability to recover from external disturbances and increased ecological risk [45,46]. According to the research results of domestic and foreign scholars [43,46,47,48], the sensitivity coefficients of unused land, water bodies, green areas, and construction land demolition sites were set as 4, 3, 2, and 1, respectively, taking into account the landscape characteristics of the study area.
3.1.3. Spatial Statistical Analysis of Landscape Ecological Risk
Geostatistical methods and GIS technology were used to realize regional ecological risk analysis. The ERI values were interpolated using ordinary kriging to acquire the LER spatial map of the entire study area. Using the natural breakpoint method, LER is categorized into five hierarchy levels: high-risk areas, medium-high-risk areas, medium-risk areas, medium-low-risk areas, and low-risk areas.
Currently, spatial statistical methods are widely used to analyze the geospatial distribution of socio-economic and geographic natural elements. Standard deviation ellipse (SDE) is a spatial statistical model that can accurately reveal the centrality, directionality, and deviation from the direction of change experienced in the spatial distribution of geographic elements [49]. The center coordinates of the standard deviation ellipse indicate the relative spatial position of the geographical elements; the direction of the long and short axes indicate the primary and secondary distribution directions of the geographical elements in space, respectively; the length of the long and short axes indicate the dispersion of the geographical elements in the primary and secondary distribution directions, from which the characteristics of directionality and dispersion can be calculated. The calculation formula is as follows [50]:
where M is the centroid coordinate of the standard deviation ellipse, xi and yi are the two-dimensional spatial coordinates of the ith geographic element, n is the number of geographic elements, D is the directionality, and S is the dispersion.
3.2. Land Use Prediction Based on FLUS Model
The FLUS model consists of a metacellular automaton module (CA) based on a self-fit inertia mechanism and a neural network-based suitability probability calculation module (BP-ANN) [19]. Additionally, taking into account the actual situation of Urumqi city and the availability of data, the topographic factor was selected as one of the essential contributors to land use change in the BP-ANN module, so 30 m resolution DEM data were selected to calculate the elevation and slope as the primary influencing factor of land use change [51]; the development of the urban transportation system has a certain “pull” effect on urban expansion [52,53], so when selecting factors influencing traffic accessibility, the distance to the district center, the distance to general roads, the distance to major roads, and the distance to highways were calculated as accessibility factors using the Euclidean distance tool in ArcGIS software. Neural network training was set to 2% by default, and the training samples were sampled using the random sampling mode (the number of training hidden layers was set to 12) to complete neural network training and obtain suitability probability maps.
In the CA module, multi-category land use results data are used as the original input data, and the target number of future changes for each land use type is preset (this study uses the Markov prediction model to determine the number of each land use type) [54]; the ease of interconversion between different land use types was then determined by referring to previous relevant studies [55,56] (1 indicates free transformation, 0 indicates no transformation is allowed), and finally, according to the water source protection policy, the wide water surface and reservoir were set as limitation areas for the interconversion of land use types in Urumqi. After several experiments, the number of simulation iterations was finally set to 300, of which the optimum was reached at the 210th simulation iteration, and the domain size was determined to be 3 × 3 to implement the simulation of future land use changes in Urumqi.
3.3. Construction of Landscape Ecological Network
In this study, we use the results of landscape ecological risk in Urumqi in 2020 as the base data for building ecological networks, firstly, the identification of ecological sources in the study area, and then the selection of suitable corridors to build the network, which is ecologically important for the propagation and protection of ecological flows.
Combining the local environmental and ecological landscape of the region, the core areas were analyzed separately using Conefor software, and 10 patches with high dPC values were identified as ecological source sites. The ecological network of the study area was composed of “source sites” and “corridors”, and the MCR model can be applied to identify the ecological corridors between the source sites in the study area. The core area is identified through the MSPA method, and the ecological source areas are determined. The minimum cost distance between the source areas is calculated using the ecological source areas and the integrated resistance surface, the minimum cost path from the source area to the target patches is calculated using the cost distance tool, and the interaction strength between the patches is analyzed quantitatively. The MCR model is as follows [18,57]:
In Equation (5), Aij represents the distance from the ecological source j to the spatial unit i; Bi represents the ecological resistance coefficient of the landscape i; fmin represents the positive correlation between minimum cumulative resistance and ecological processes.
4. Results and Analysis
4.1. Spatial and Temporal Changes in Land Use
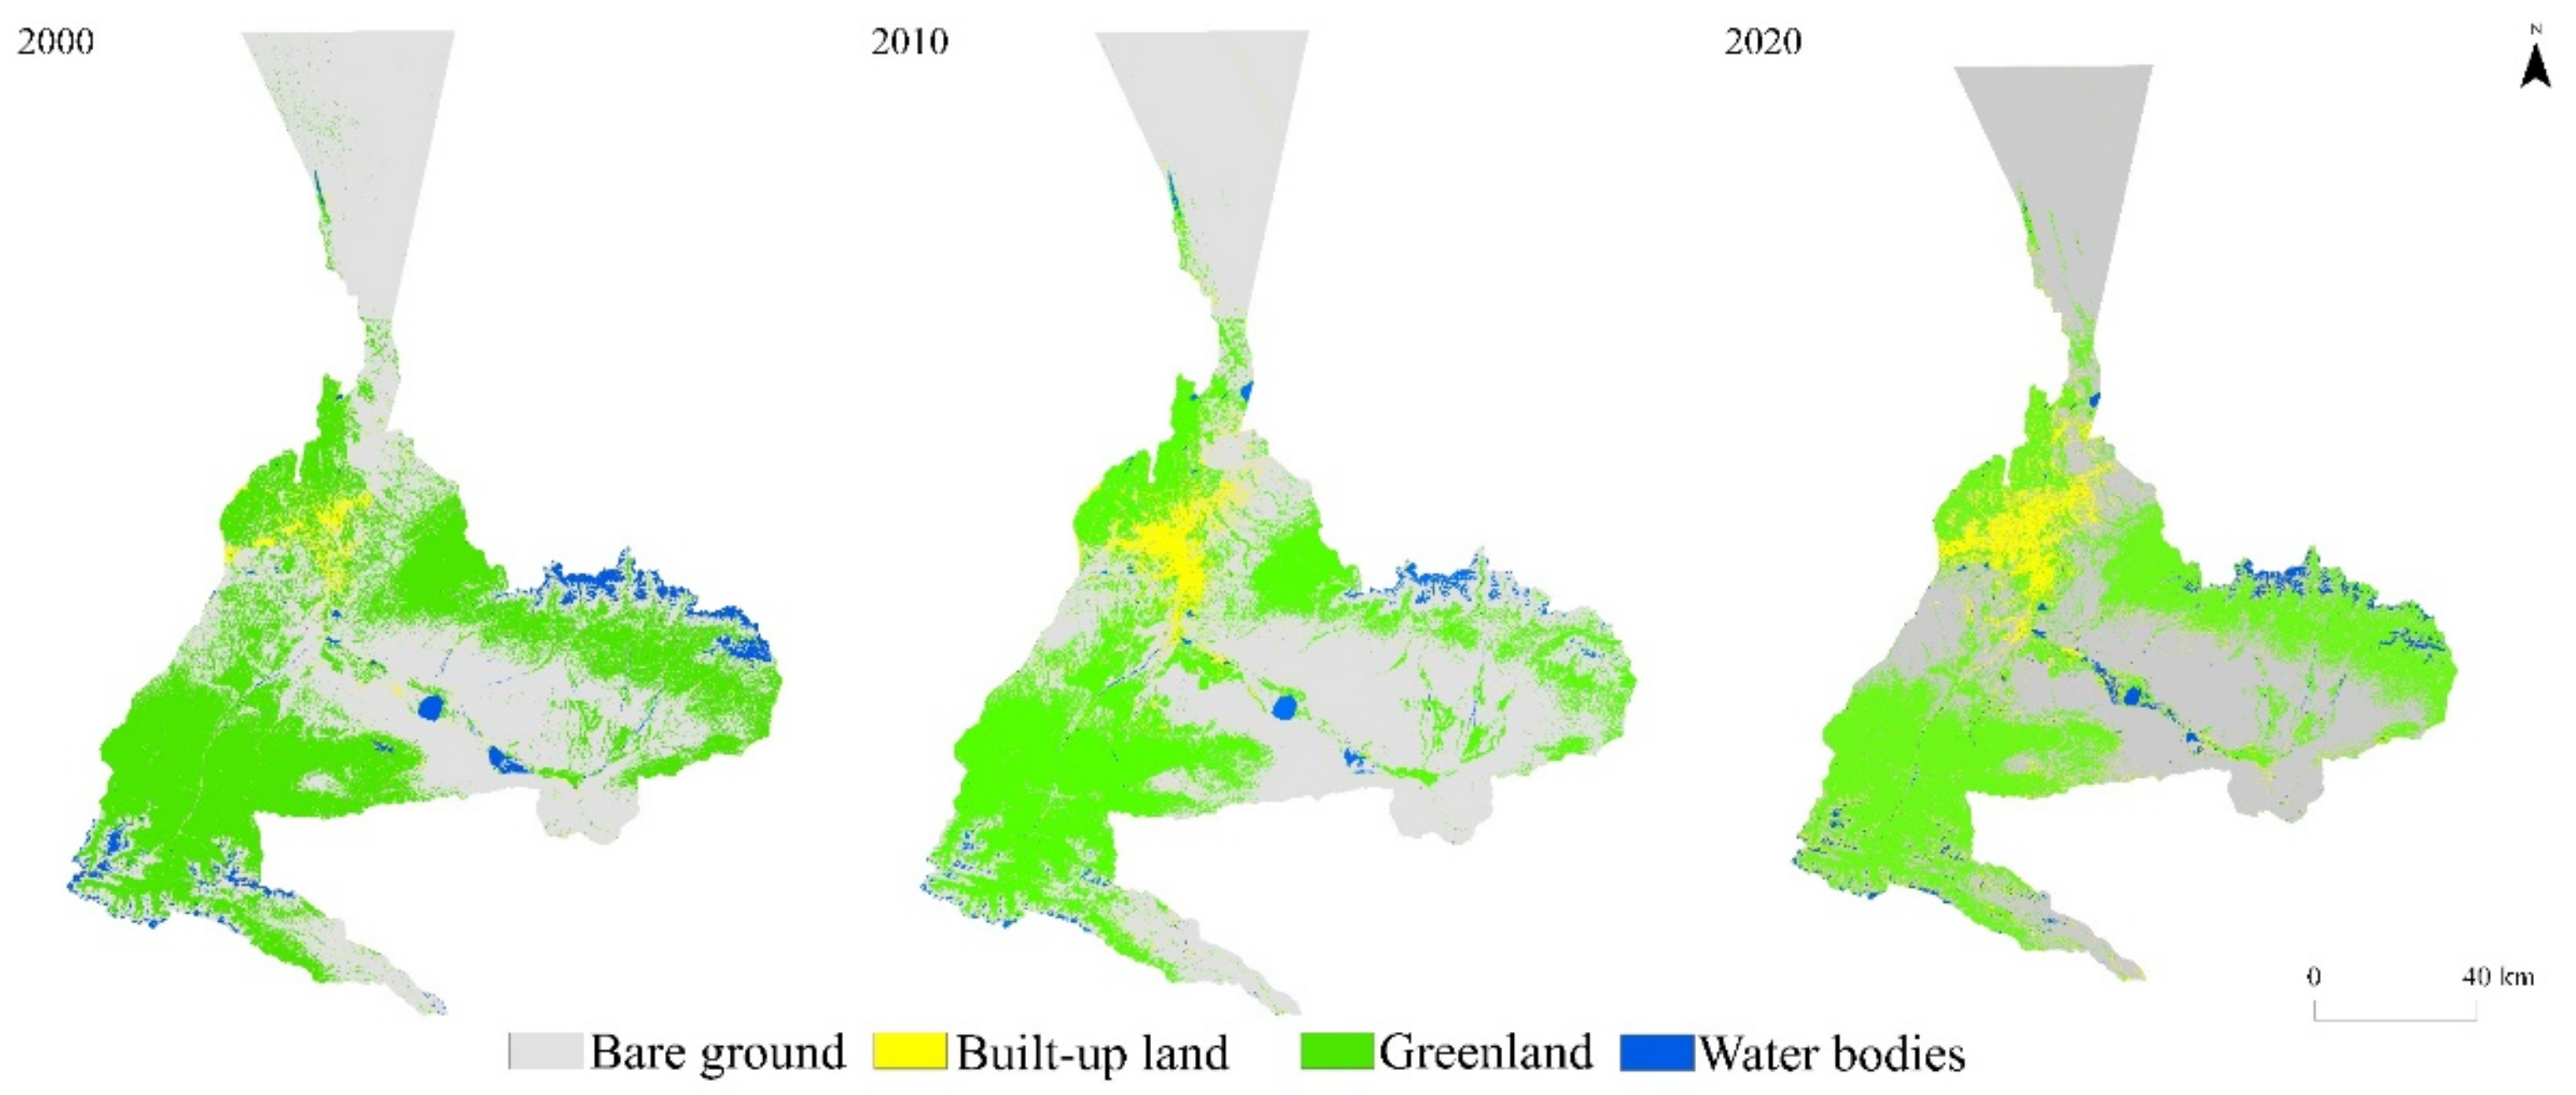
In accordance with the classification results of the remote sensing images and the area and change rate statistics of each land use type in the past 20 years (Figure 3 and Table 5), it can be seen that, since 2000, the area of bare land has gradually decreased; the area of built-up areas has expanded exponentially; the area of green land shows certain fluctuations, the trend of falling first and then rising; and the area of water bodies shows an overall increasing trend, but the proportion of the whole land use type is around 3.00%, and the area change is not too obvious.
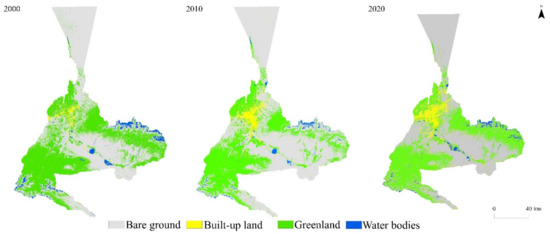
Figure 3.
Land cover/land use distributions of Urumqi in 2000, 2010, and 2020.

Table 5.
Characteristics of land use area in Urumqi in different periods.
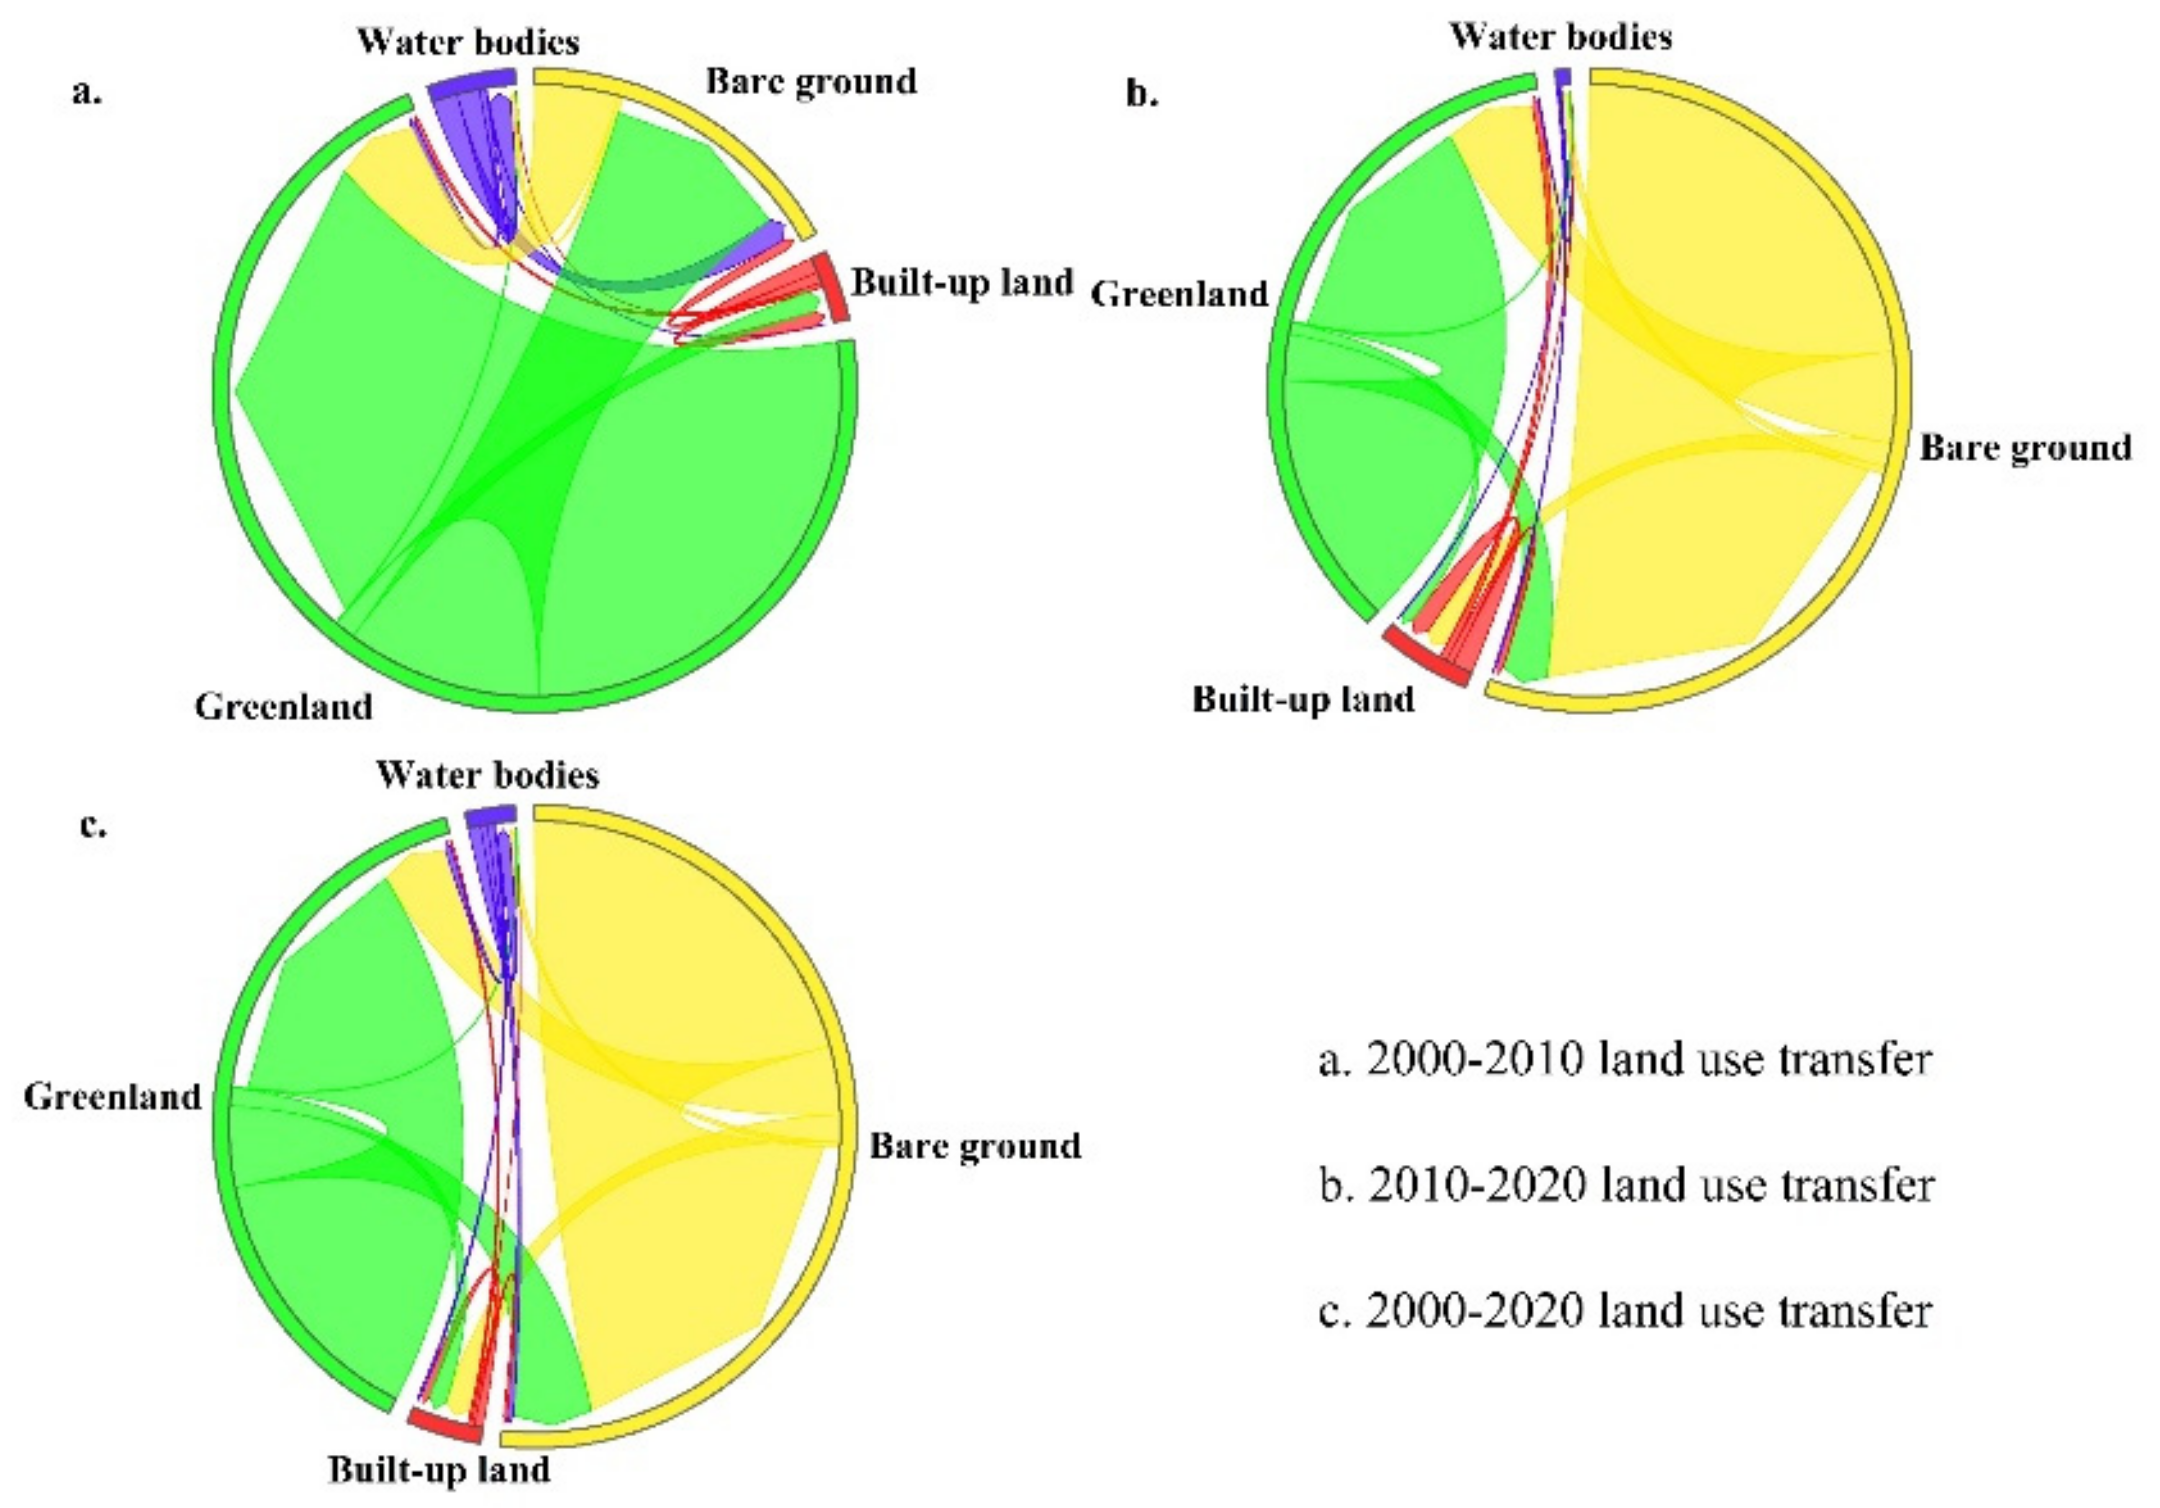
In this paper, the transfer matrix (Figure 4) is applied to analyze the process of convergence at the interface between land cover/land use types in Urumqi city from 2000 to 2020. Throughout the study period, all land use types underwent a certain degree of interconversion, with the conversion of bare land, green land, and built-up land being more obvious, with the order of the size of the transferred area being bare land > green land > water bodies. The accelerated urbanization process has led to a sudden increase in the built-up area, resulting in the conversion of large areas of arable land by encroachments into built-up land. With the intensification of land use activities, some green land, forest land, and bare land areas within the city are also gradually converted into built-up land, resulting in the transfer of 48.75 km2 of bare land and 38.82 km2 of green land. This is closely related to the “greening of barren hills” project that has been implemented in Urumqi in recent years, which has generated remarkable growth in green areas in many areas of Urumqi [58].
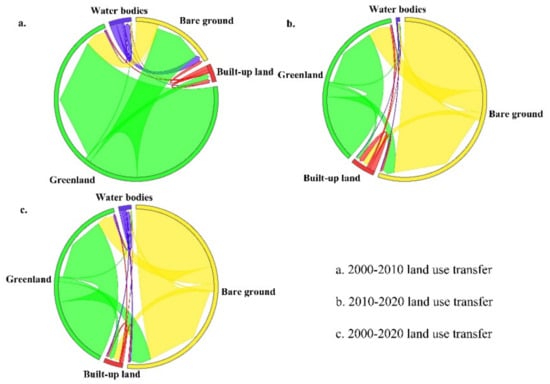
Figure 4.
Transfer matrix of land types in Urumqi from 2000 to 2020 (Note: Red: Built-up land; Yellow: Bare land; Blue: Water bodies; Green: Green land).
4.2. Future Land Use Forecast of Urumqi City Based on FLUS Model
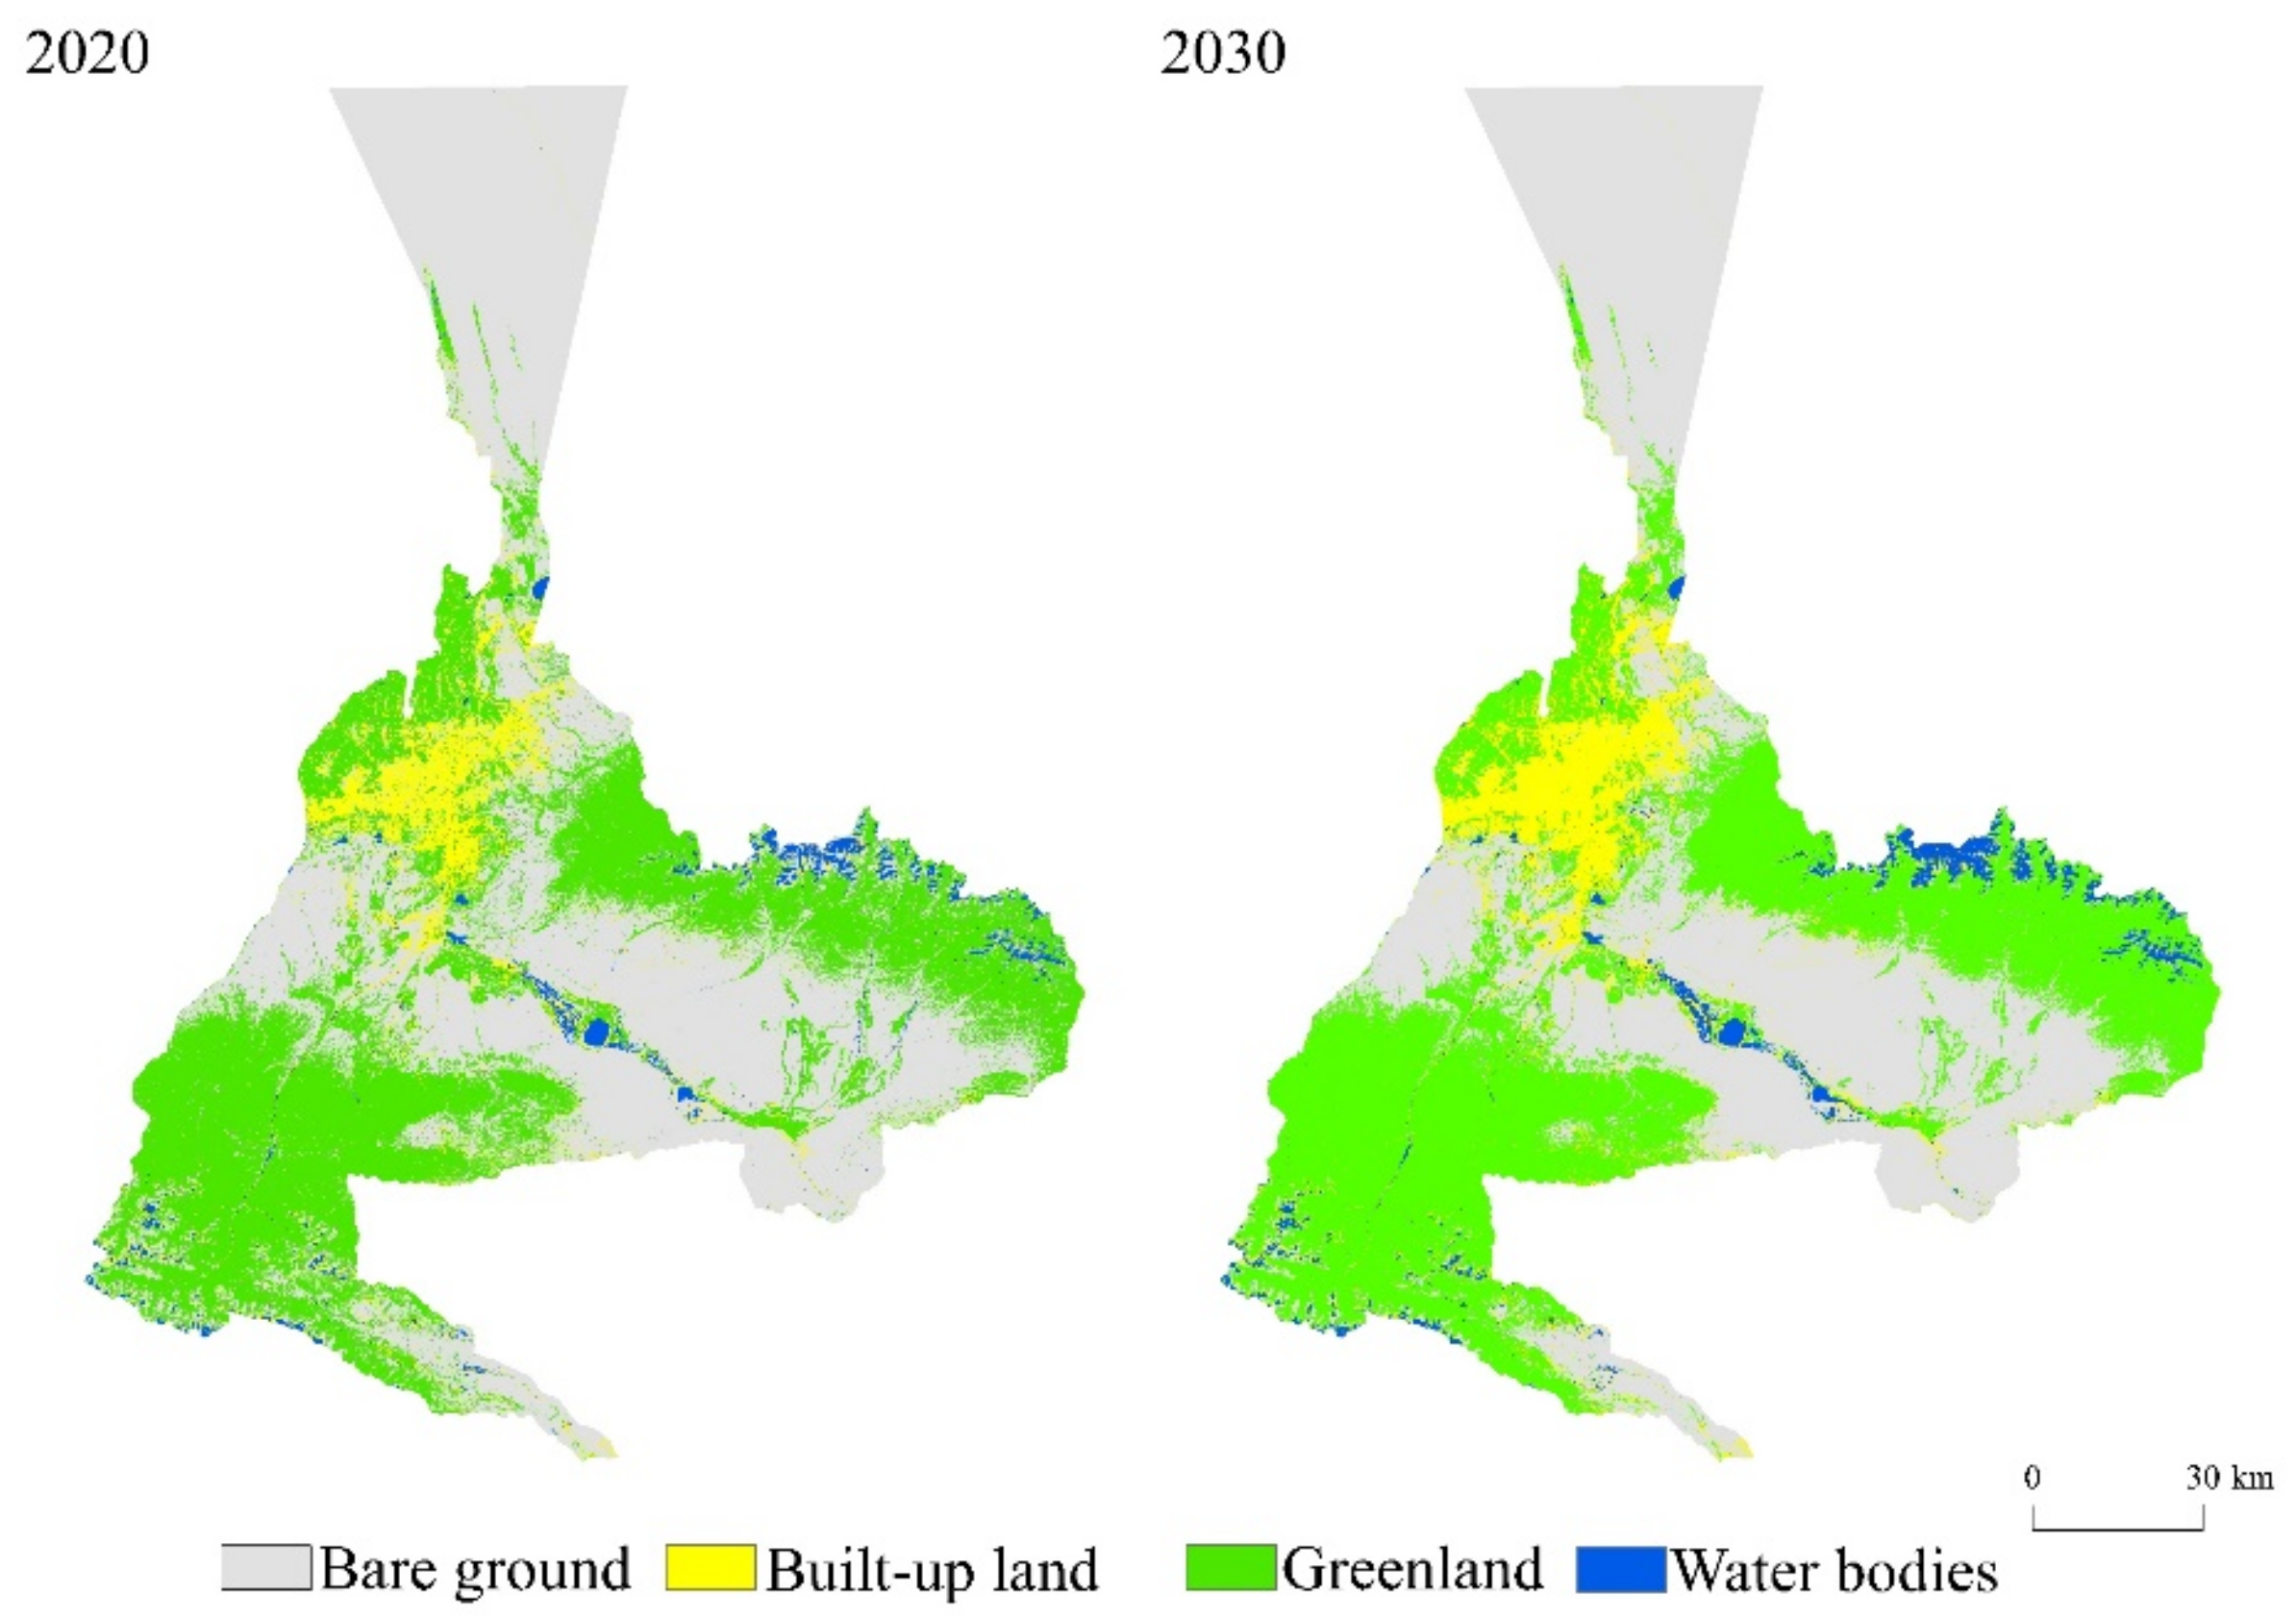
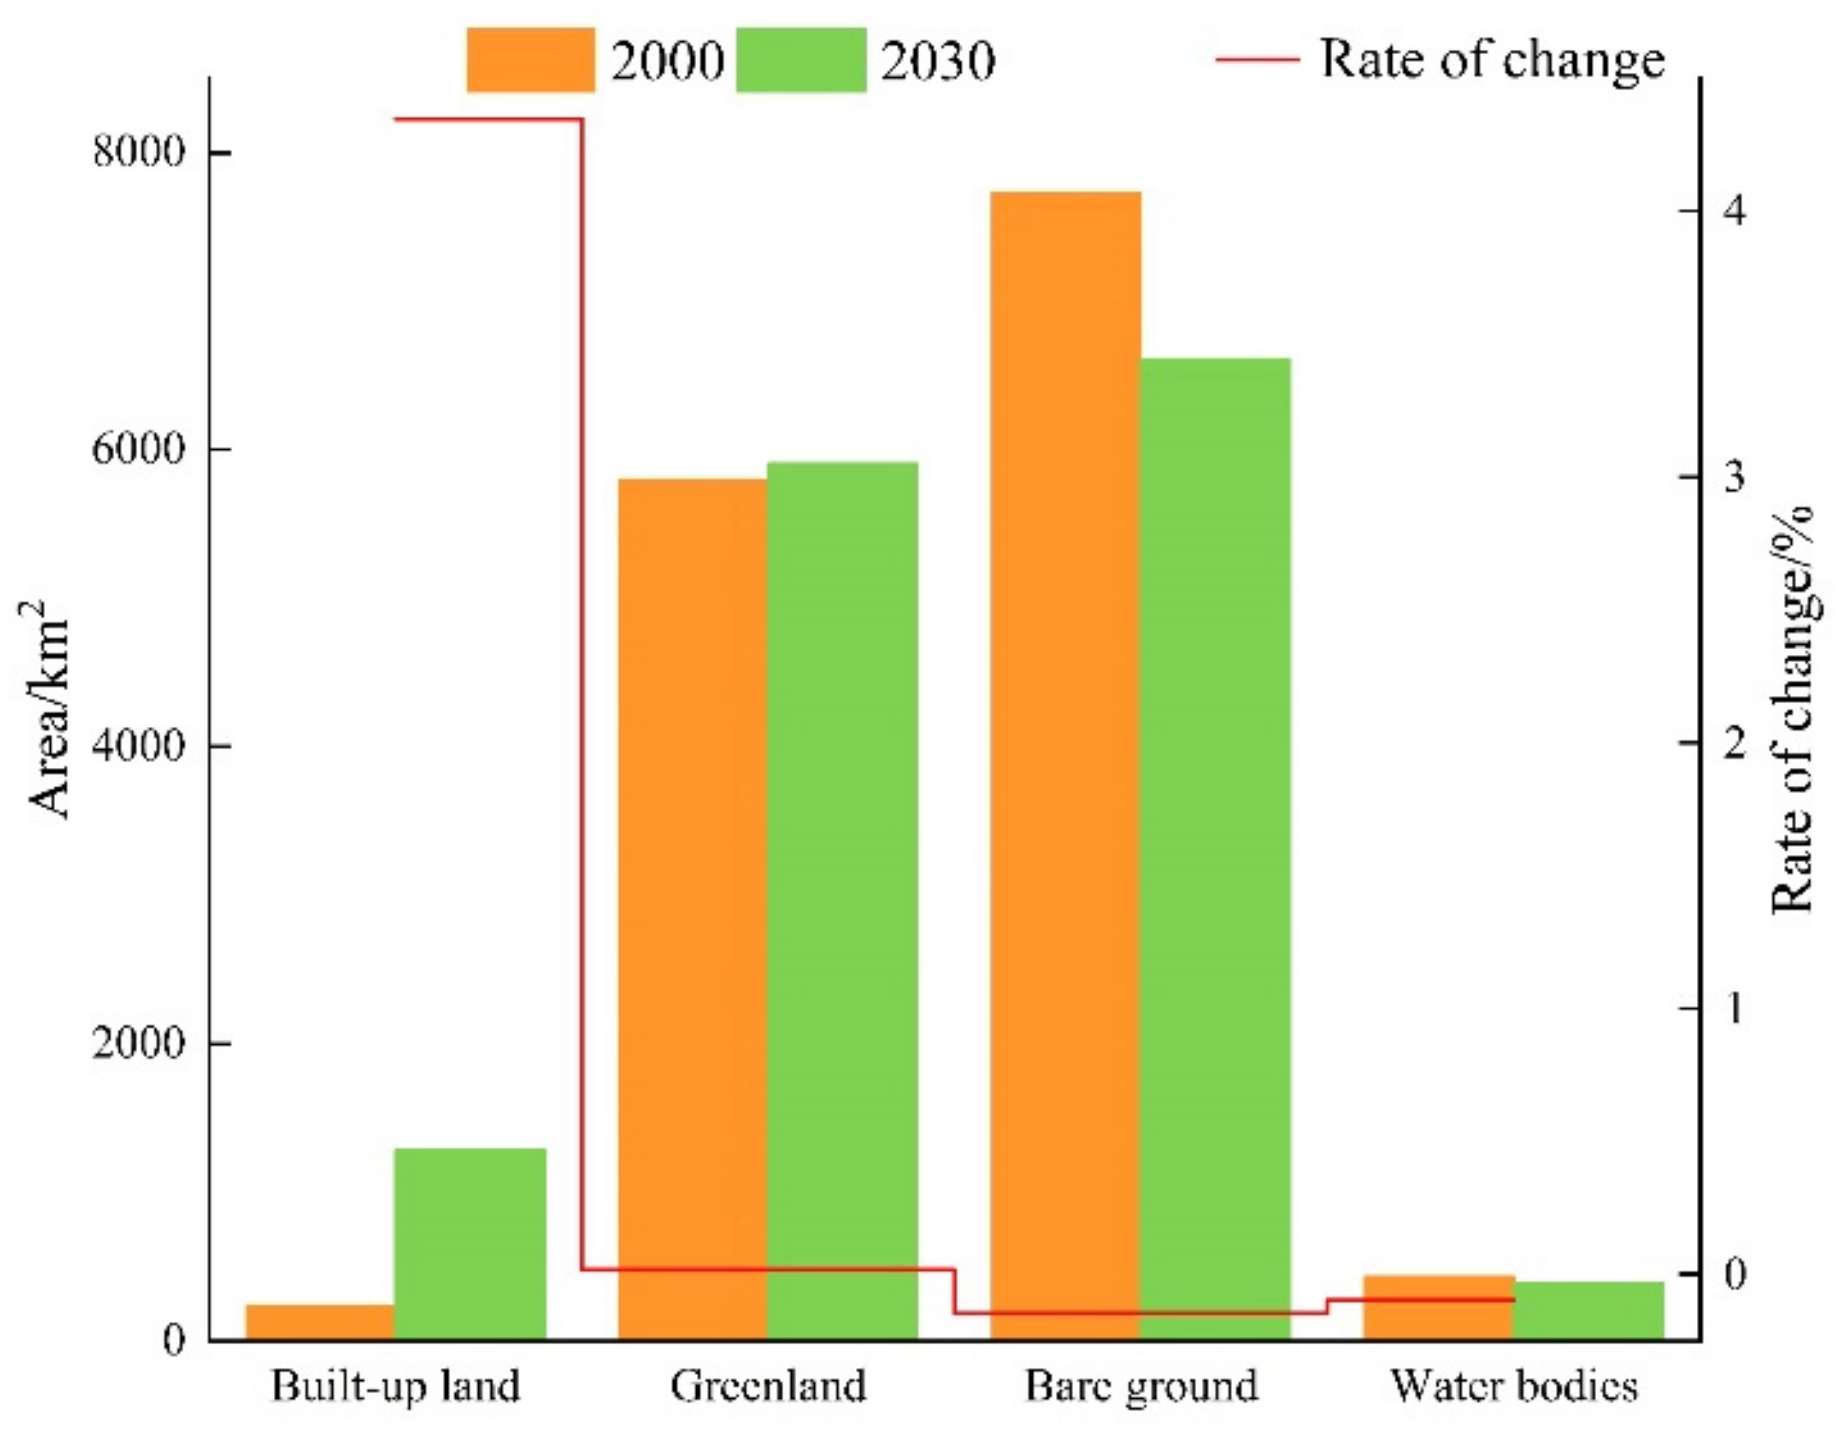
In this paper, we use Landsat 5 TM remote sensing images from 2010 as the base data source, land use data obtained by the random forest classification algorithm, and a land use suitability conversion layer obtained by DEM data and other socio-economic data to predict the land use types in 2020 (Figure 5) and verify the accuracy of the prediction results with the current land use results in 2020. The results showed that the Kappa coefficient reached 0.86 in 210 iterations, which satisfied the validity and accuracy verifications of the model. From 2000 to 2030, the built-up area of Urumqi city increases significantly, with most of this growth mainly being concentrated in the main urban area, and it also grows to the inner and peripheral areas of the city; the green area increases slightly, the area of bare land and water bodies decreases gradually, and the urbanization process is obvious. In accordance with the map of land use types changes in Urumqi from 2000 to 2030 (Figure 6), it can be seen that urban built-up land increases the most: its area increases more than 4 times, followed by a small increase of 1.86% in the area of green areas, and the area of water bodies and bare land shows a decreasing trend, decreasing by 9.53% and 14.44%, respectively.
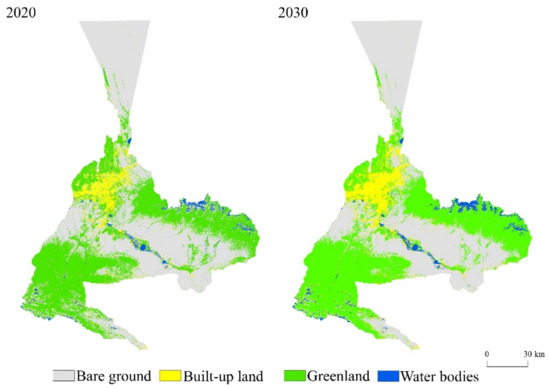
Figure 5.
Simulation results depicting land use in Urumqi City in 2020 and 2030 by FLUS.
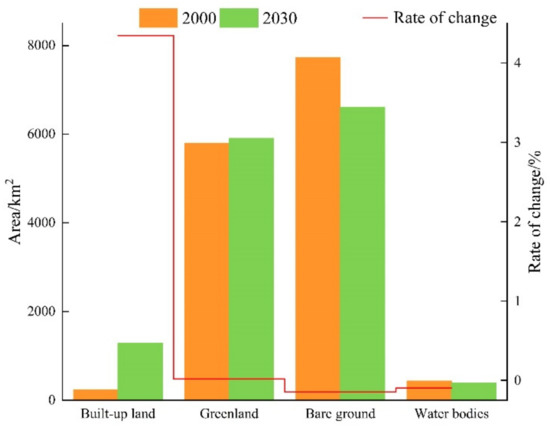
Figure 6.
Change map of land use types in Urumqi from 2000 to 2030.
4.3. Landscape Pattern Index Analysis
4.3.1. Analysis of Traditional Landscape Fragmentation and Diversity
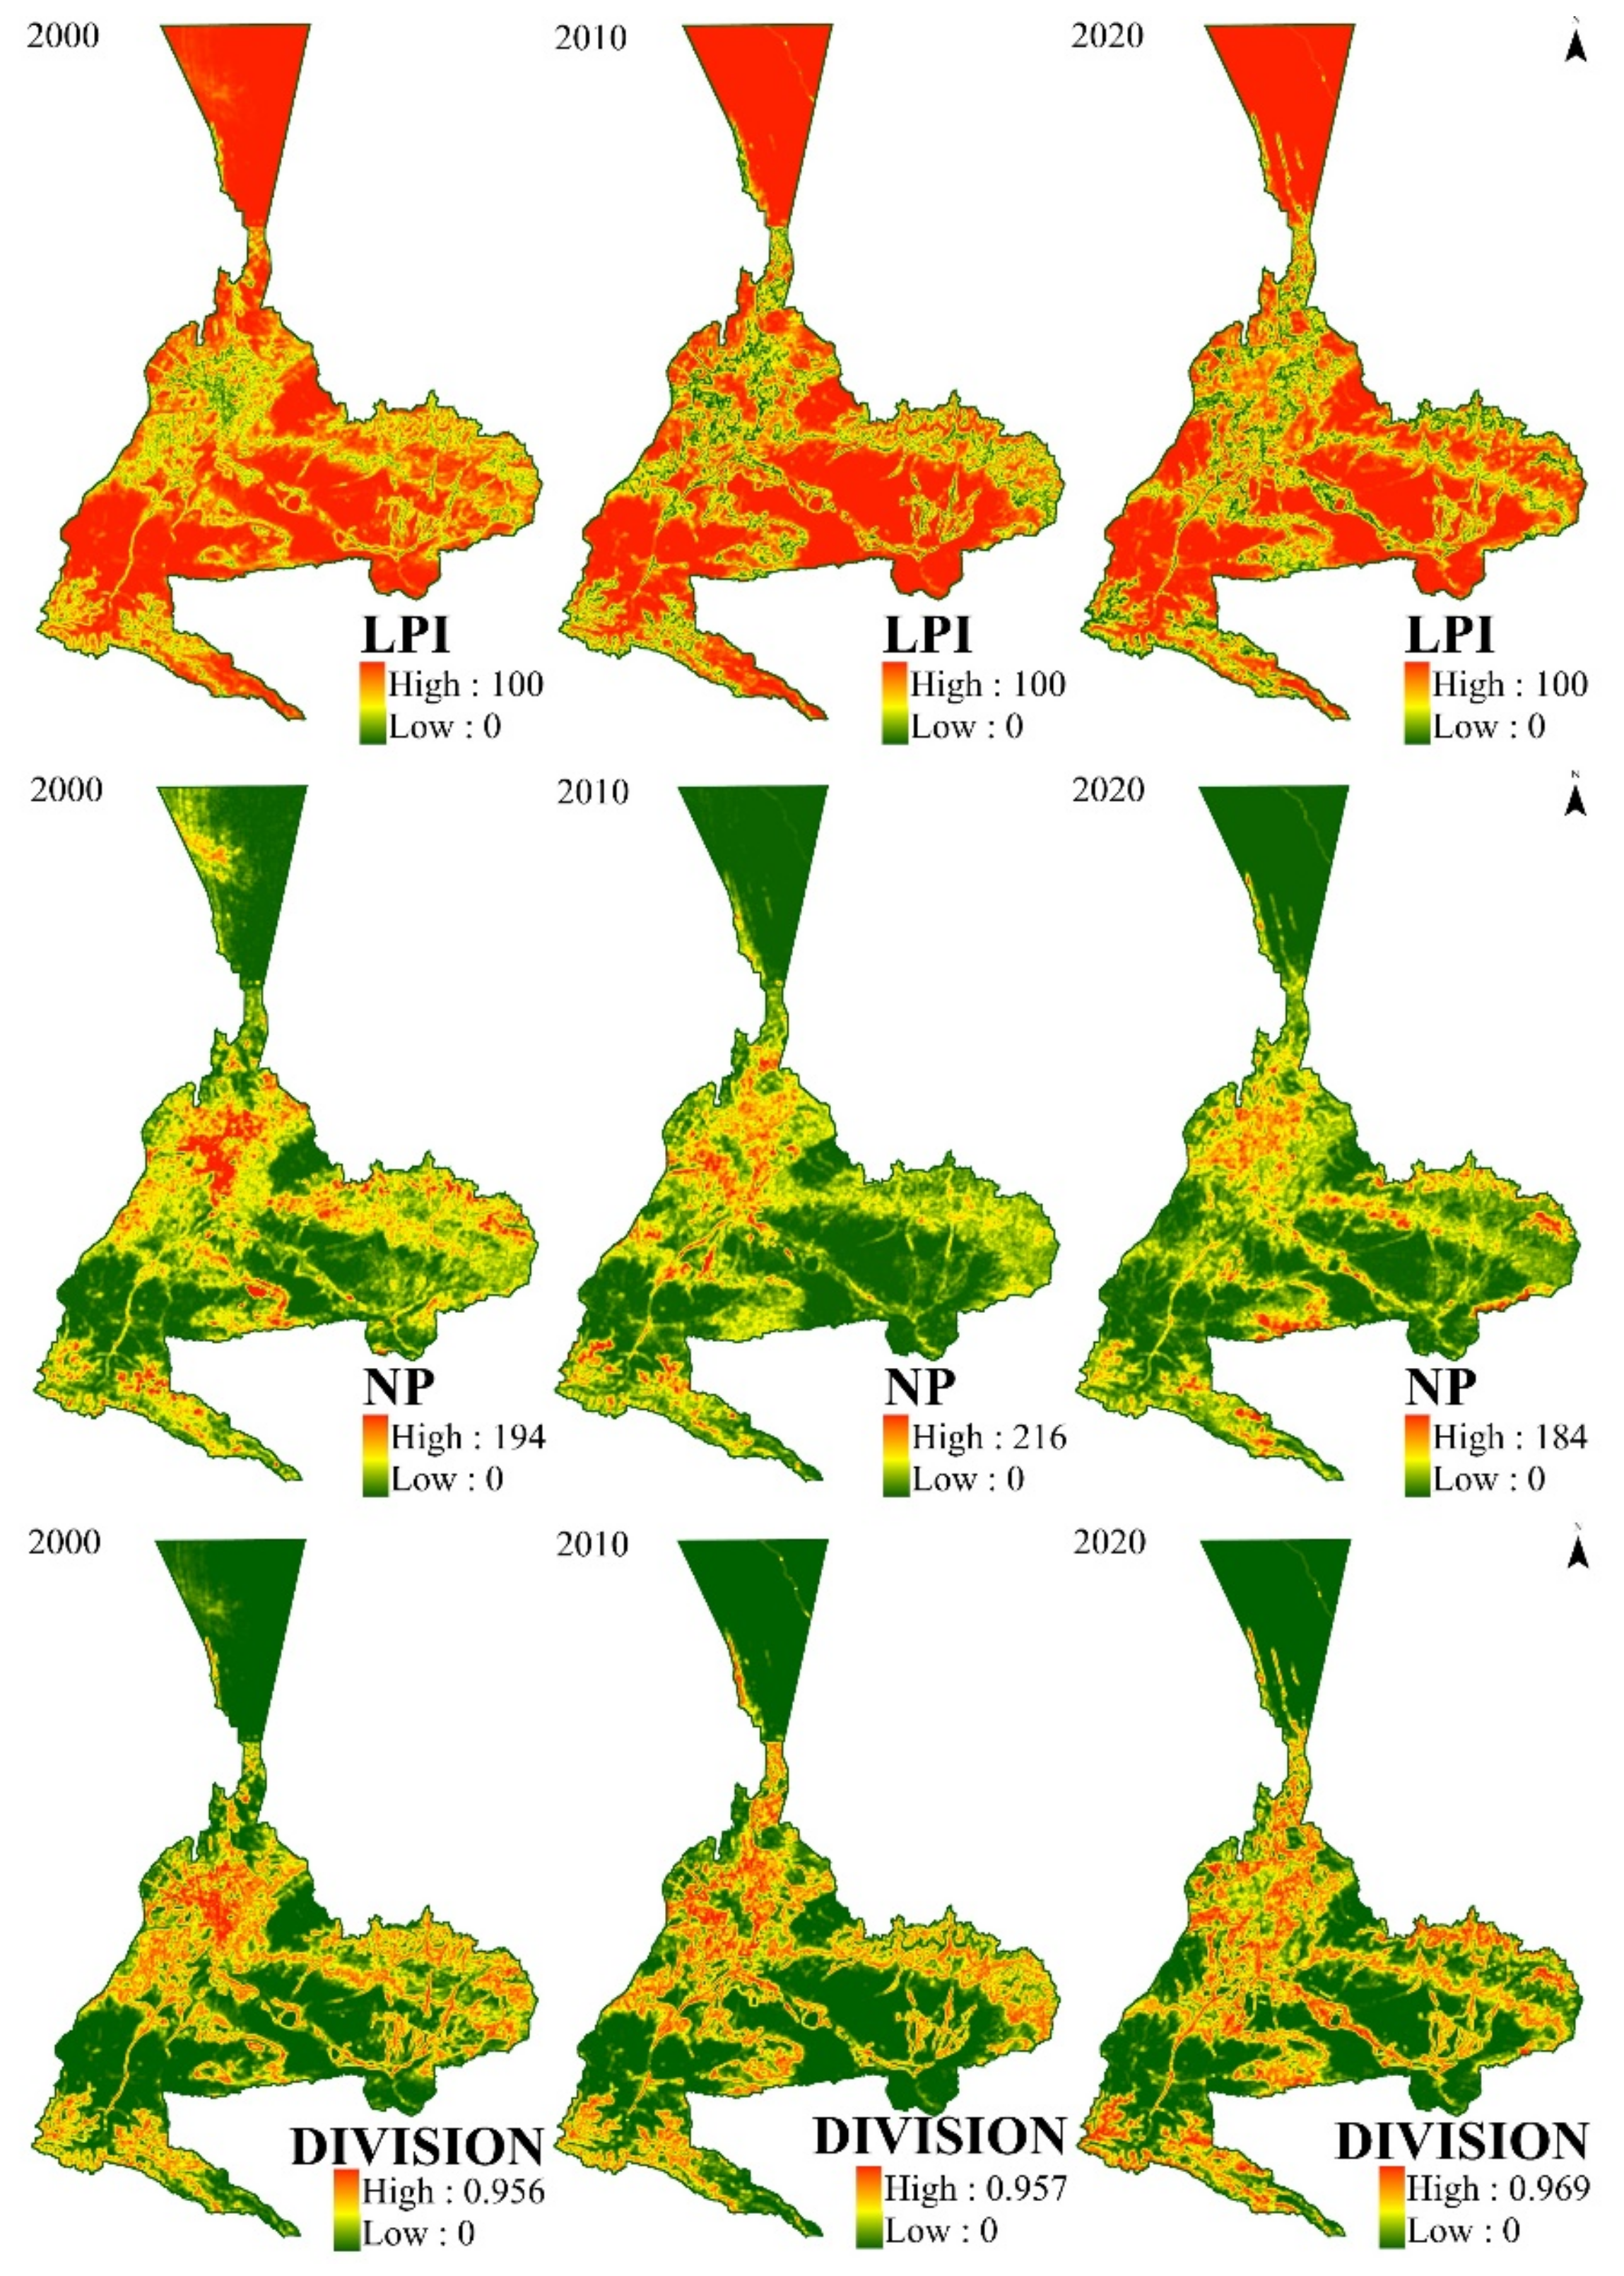
The spatial allocation of landscape pattern fragmentation in Urumqi from 2000 to 2020 is displayed in Figure 7: the spatial distribution trends of the LPI and NP are opposite and have a strong negative correlation, whereas the distribution trends of the DIVISION and the NP are roughly similar, better reflecting the landscape fragmentation status in Urumqi. During the 20-year period, the LPI index declined, then slightly increased, and the NP index increased and then decreased slightly, indicating that the landscape fragmentation process in Urumqi slowed down and tended to consolidate. Spatially, the landscape fragmentation in Urumqi city shows a “mononuclear” distribution centered in the main urban area and decreasing distribution to the east and west, with a higher maximum patch index and a smaller number of patches, and less landscape separation in the main urban area. The degree of landscape fragmentation increases gradually from the outside to the inside because of the early onset and rapid development of urban developments in the city center, the relatively flat terrain, large arable land area, the small number of patches, and the relatively high degree of landscape fragmentation. In terms of the natural environment, Urumqi is surrounded by mountains on three sides, and the main urban area is relatively flat. This topography leads to the extension of the main urban area from south to north alongside the river, and to the east and west in the northern plain, which intensifies the fragmentation of high-value areas to the outside.
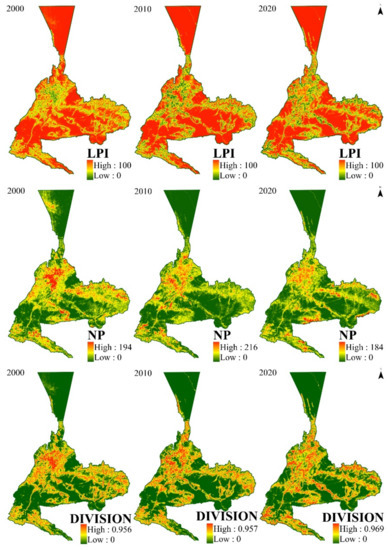
Figure 7.
Spatial distribution map of landscape fragmentation in Urumqi in different periods.
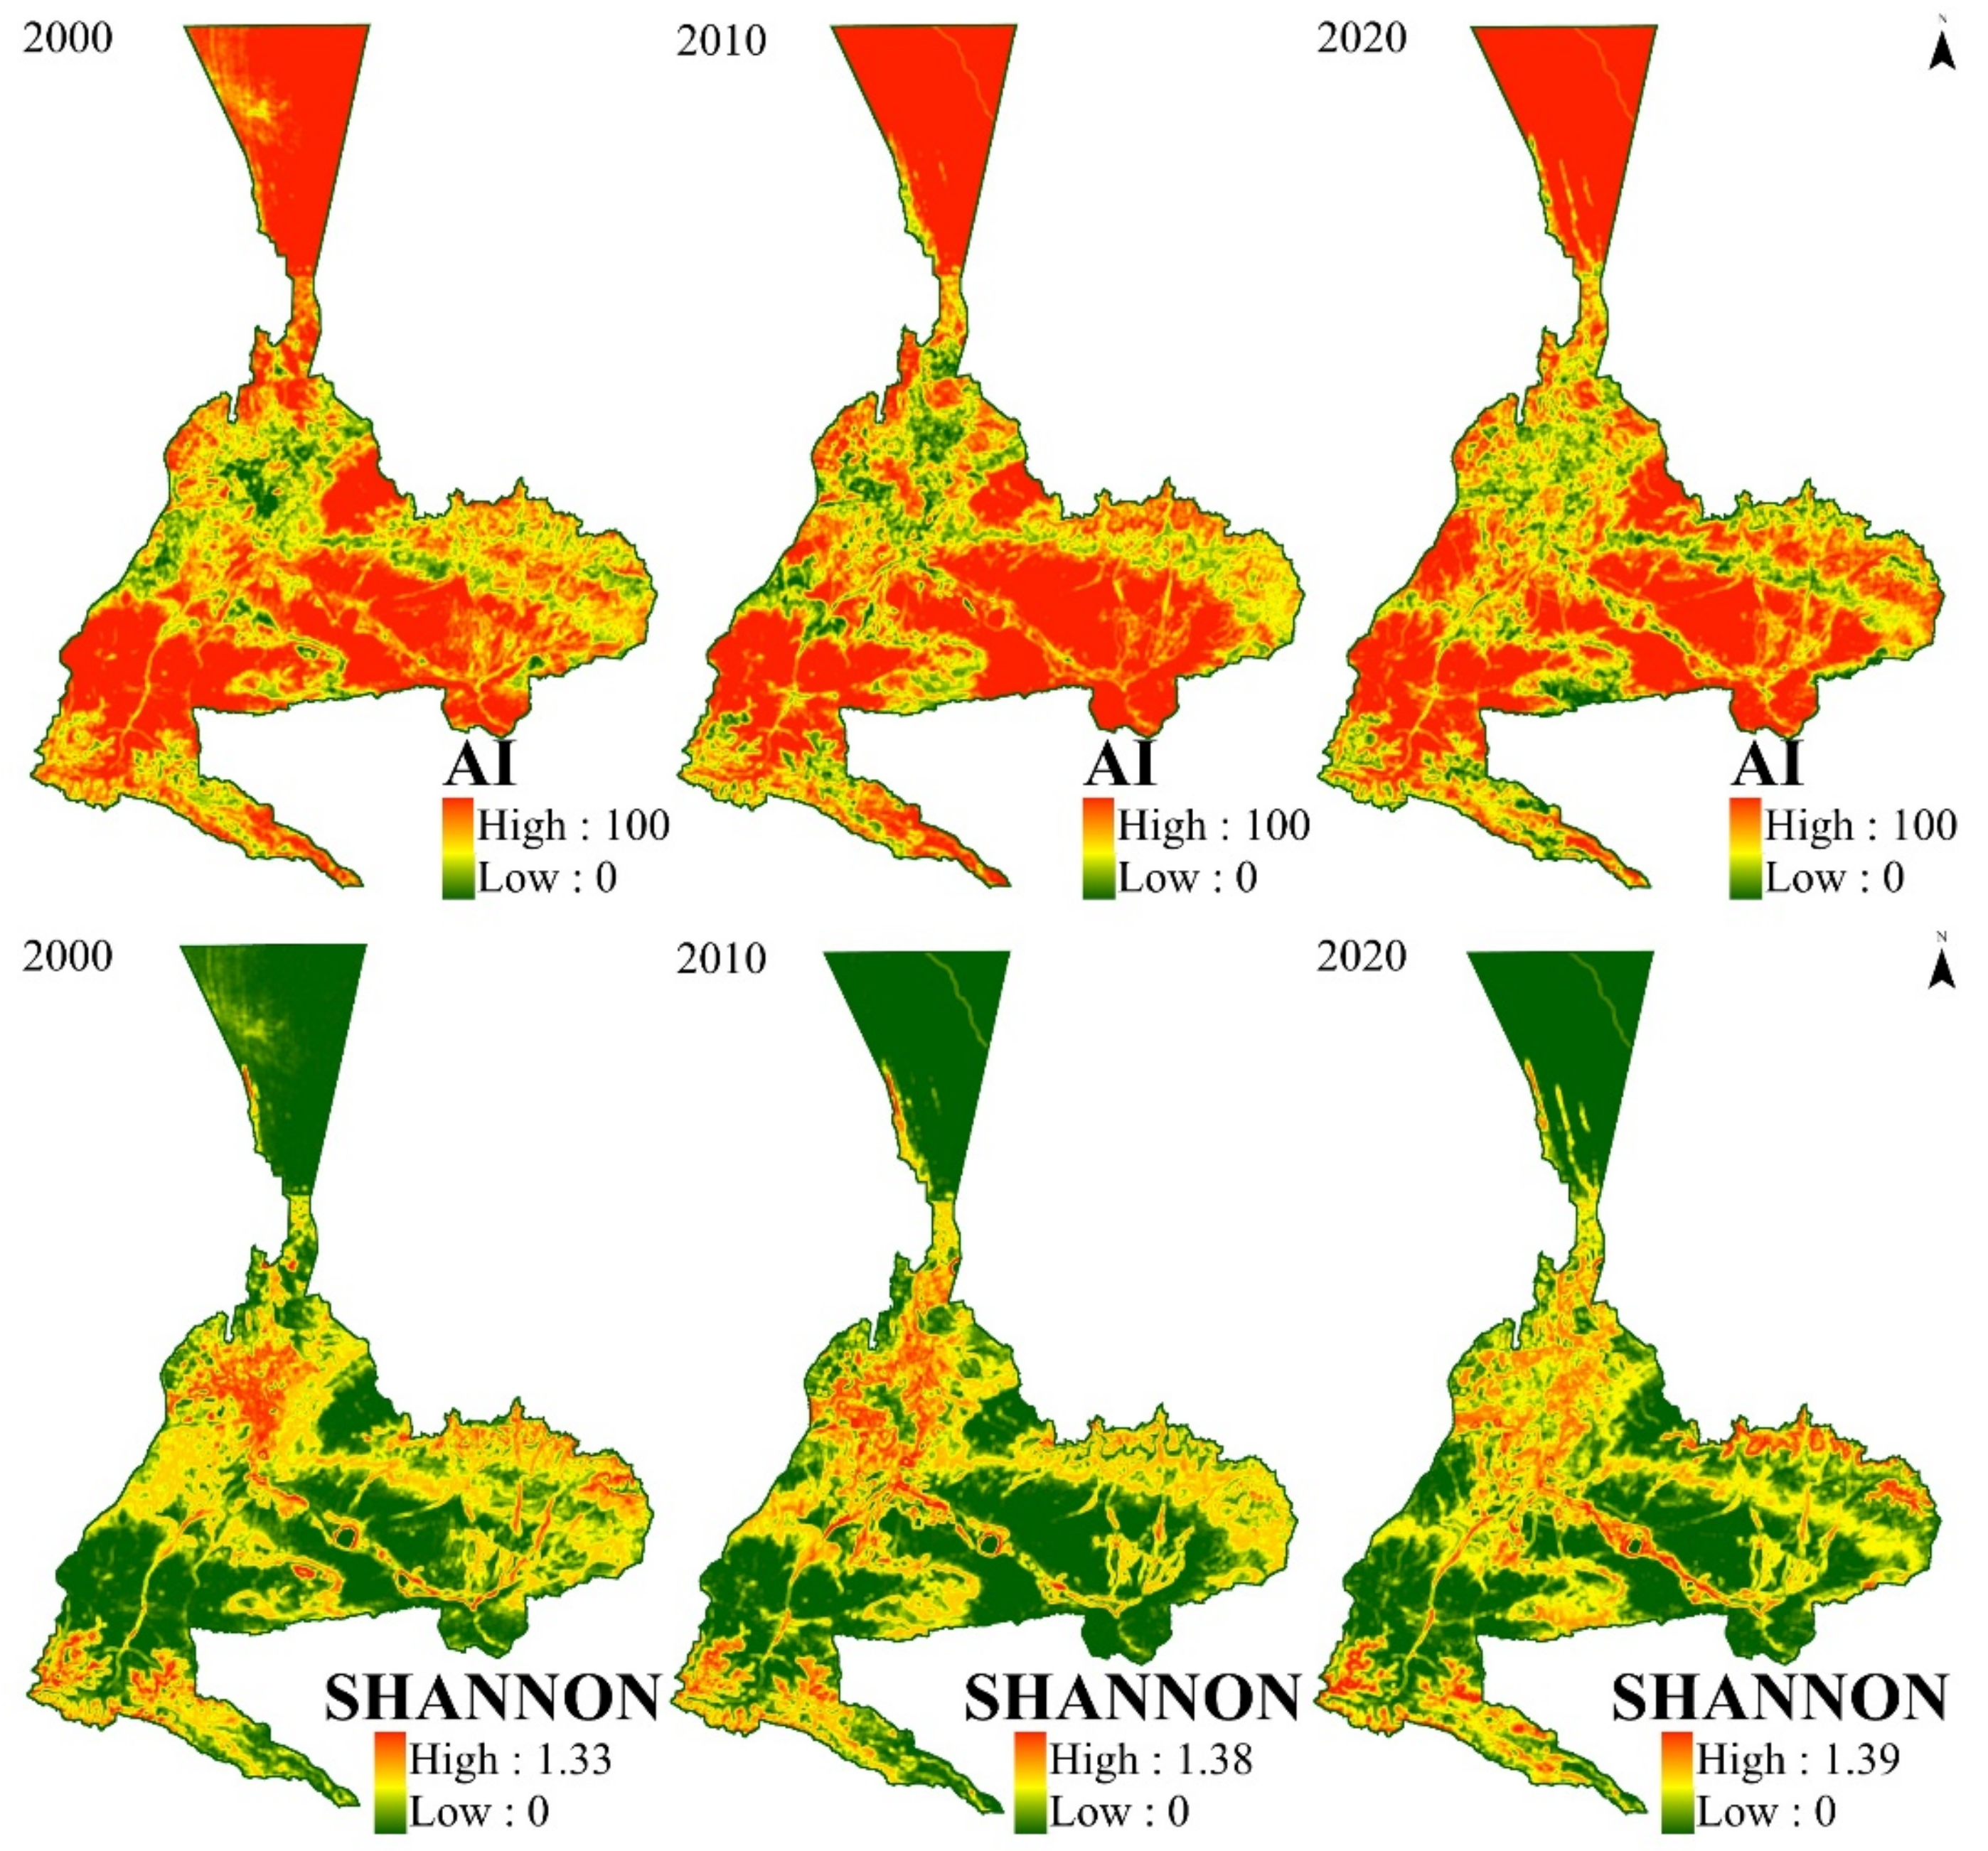
The distribution of landscape diversity in Urumqi from 2000 to 2020 is shown in Figure 8: it can be seen that the landscape diversity is characterized by higher diversity in the main urban area and lower diversity in the peripheral areas, and there is a clear trend of expansion. The range of the Shannon index shows that the inner city gradually increases and moves towards the suburbs, and the high values appear at the intersection of the inner city and the suburbs, indicating that the area of the built-up area increased, the degree of diversity in the built-up area of Urumqi and the surrounding areas showed a continuously increasing trend, and the range and value of Shannon increased during this 20-year period. This indicates that landscape fragmentation and heterogeneity further increased, whereas AI gradually changed from having low to high values in the main urban area, indicating that landscape diversity increased within the city and that the landscape types gradually began to be concentrated in the continuous part of the city and spread to the peripheral areas of the city, which indicates that the city is expanding outward. Additionally, the absolute high values of AI appear in the north and south regions of the city, which is a typical feature, as Urumqi is an oasis city, and the expansion of the city relies on the oasis, which is surrounded by the Gobi and desert transition zone, so the AI in this region is high.
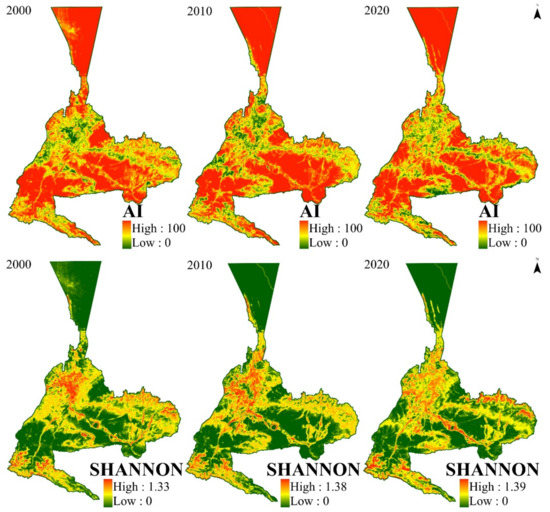
Figure 8.
Spatial distribution of landscape diversity in Urumqi in different periods.
4.3.2. Analysis of Future Landscape Fragmentation and Diversity
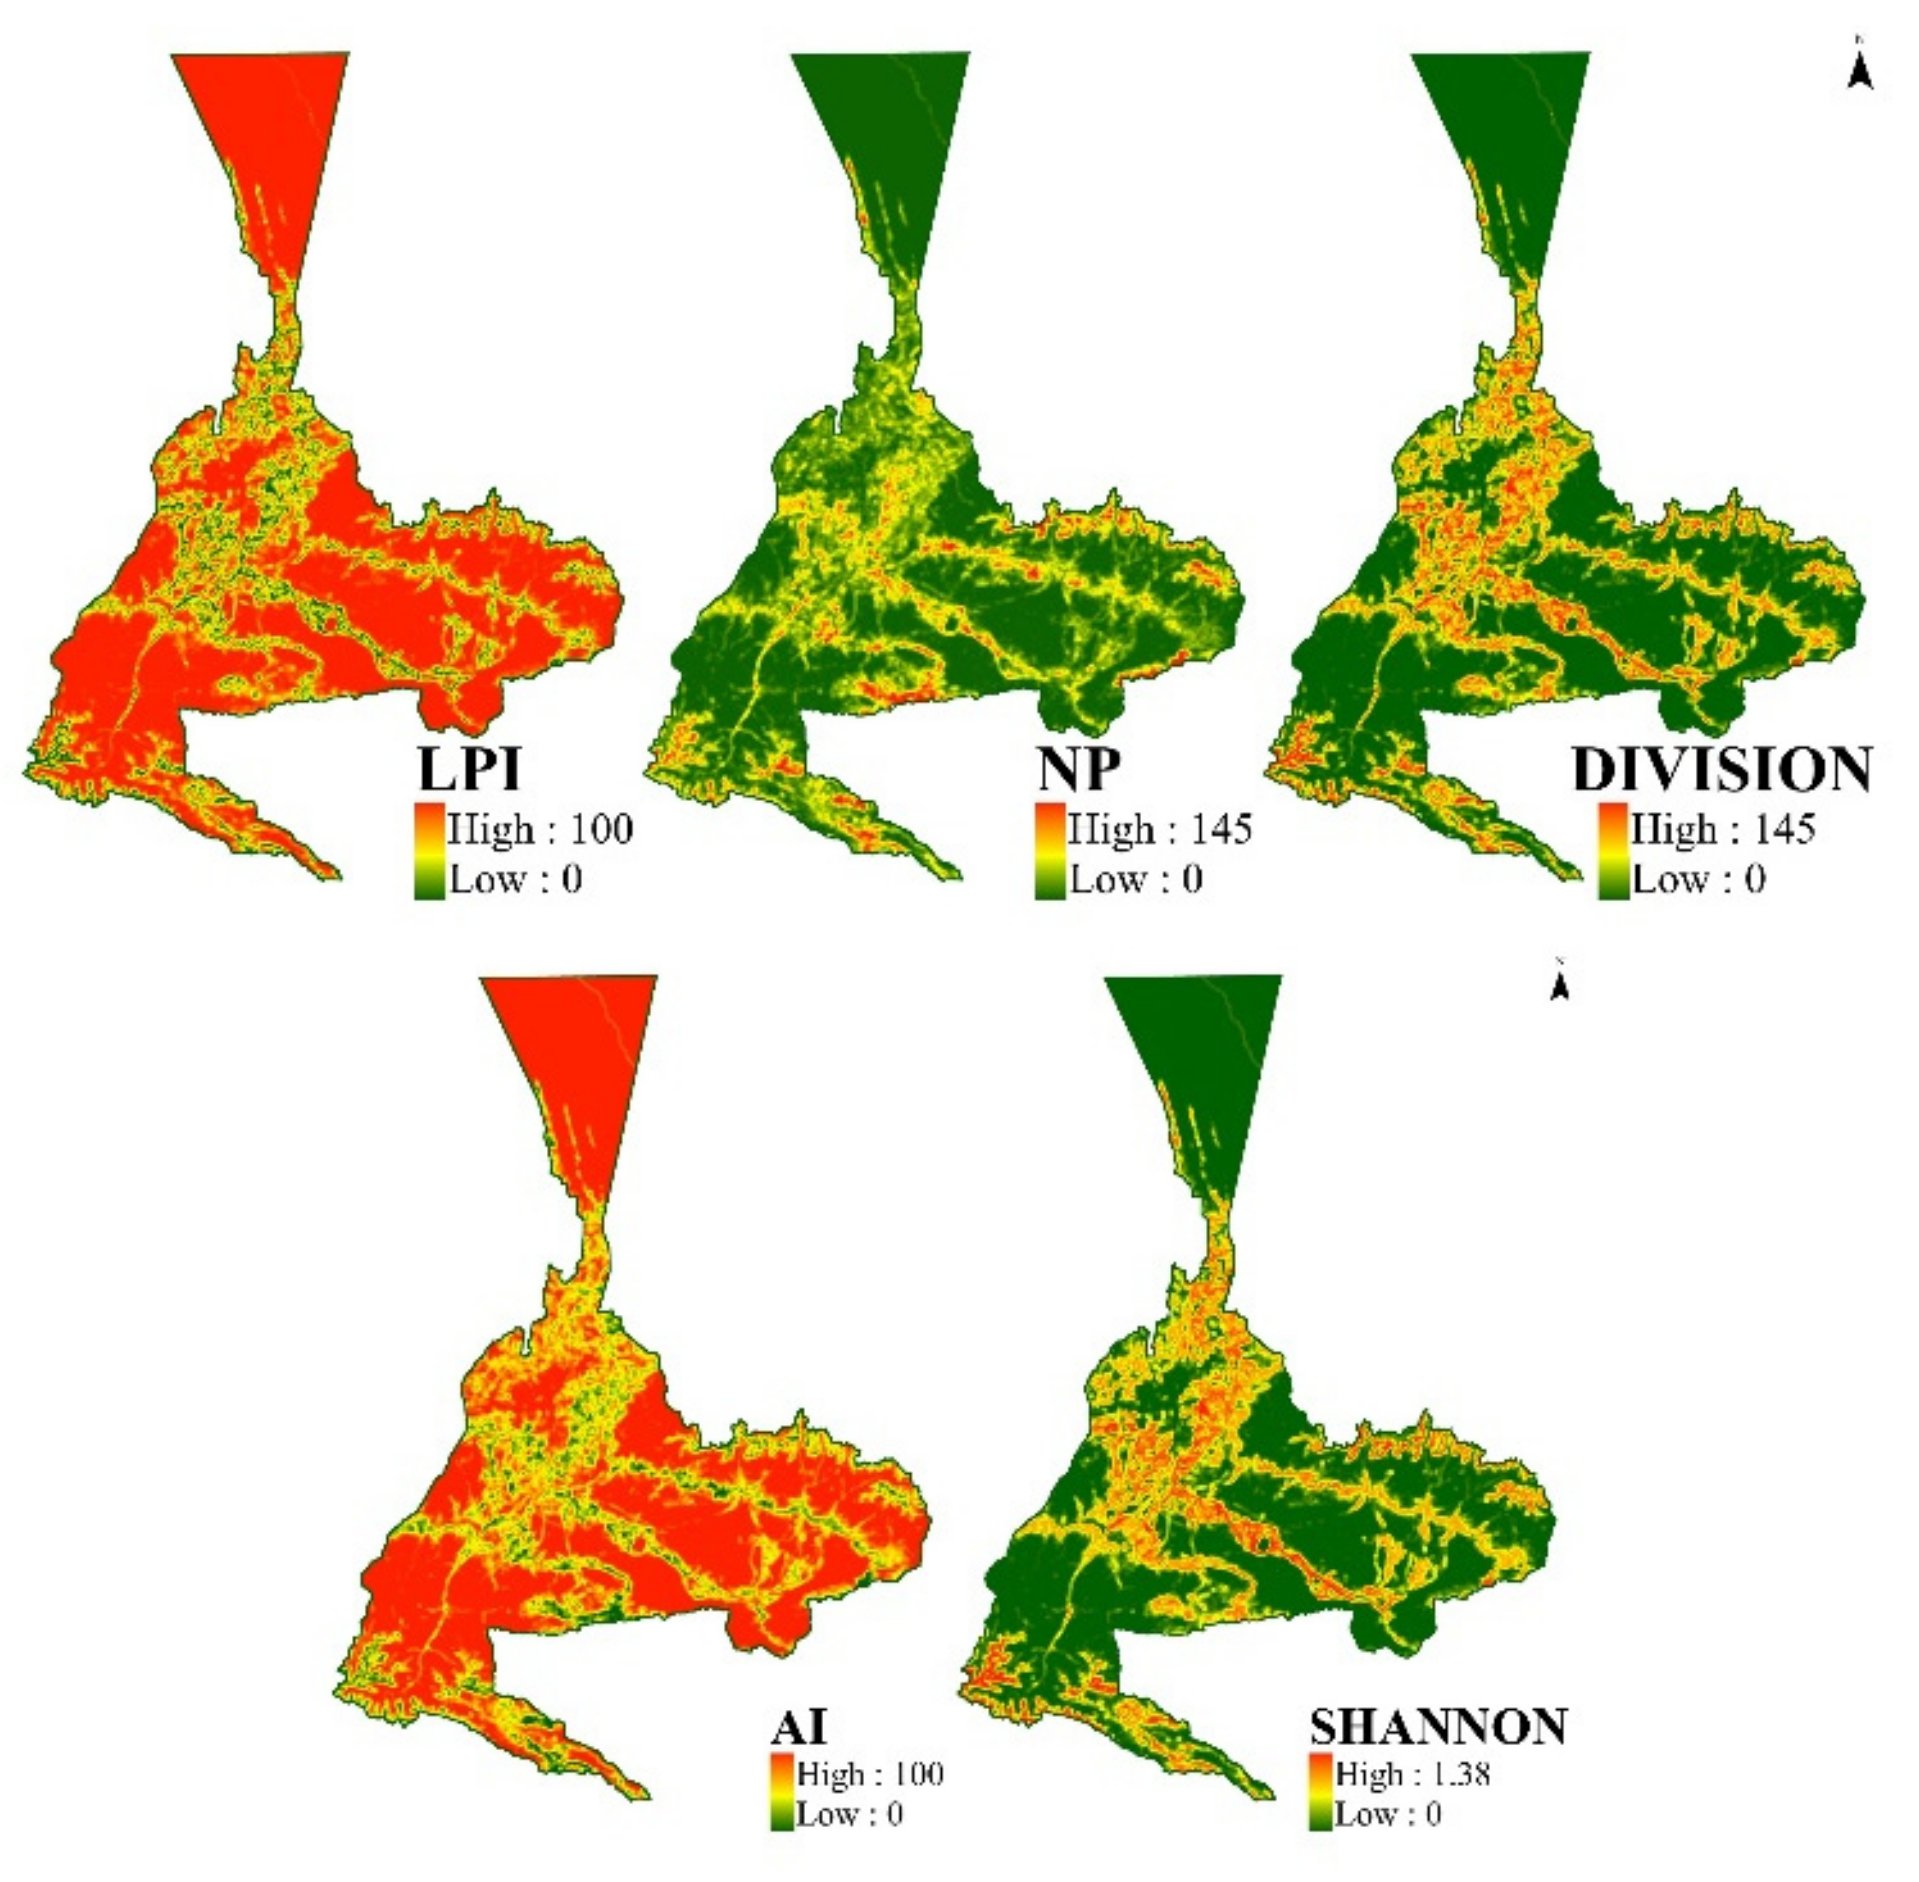
According to the spatial distribution map of landscape fragmentation and the spatial distribution map of landscape diversity in Urumqi in 2030 (Figure 9), a large area with a high LPI value appears in the main urban area, the maximum value of NP decreases to 145, the maximum value of DIVISION decreases to 0.947, and the maximum value of SHANNON increases to 1.38, indicating that the landscape diversity becomes an increasing trend. In terms of spatial distribution, the degree of fragmentation decreases from the center of the main city to both sides. It can be seen that the landscape in the main urban area of Urumqi gradually tends to be integrated, showing an obvious “T”-shaped distribution, indicating that the urbanization process of Urumqi will be smooth in the future, the area of urban built-up land will gradually increase, and the adjacent heterogeneity between the types in the main urban area will decrease. Although the landscape types in the main urban area tend to be integrated, the degree of fragmentation in the urban fringe area gradually shows an increasing trend, so ecological protection during the later development of the urban fringe area should be strengthened.
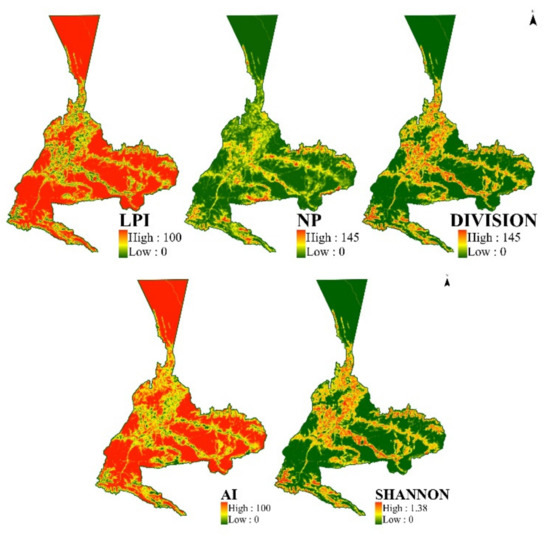
Figure 9.
Spatial distribution of landscape fragmentation and diversity in Urumqi in 2030.
4.4. Ecological Network Construction Based on Landscape Ecological Risk
4.4.1. Temporal Change of Landscape Ecological Risk
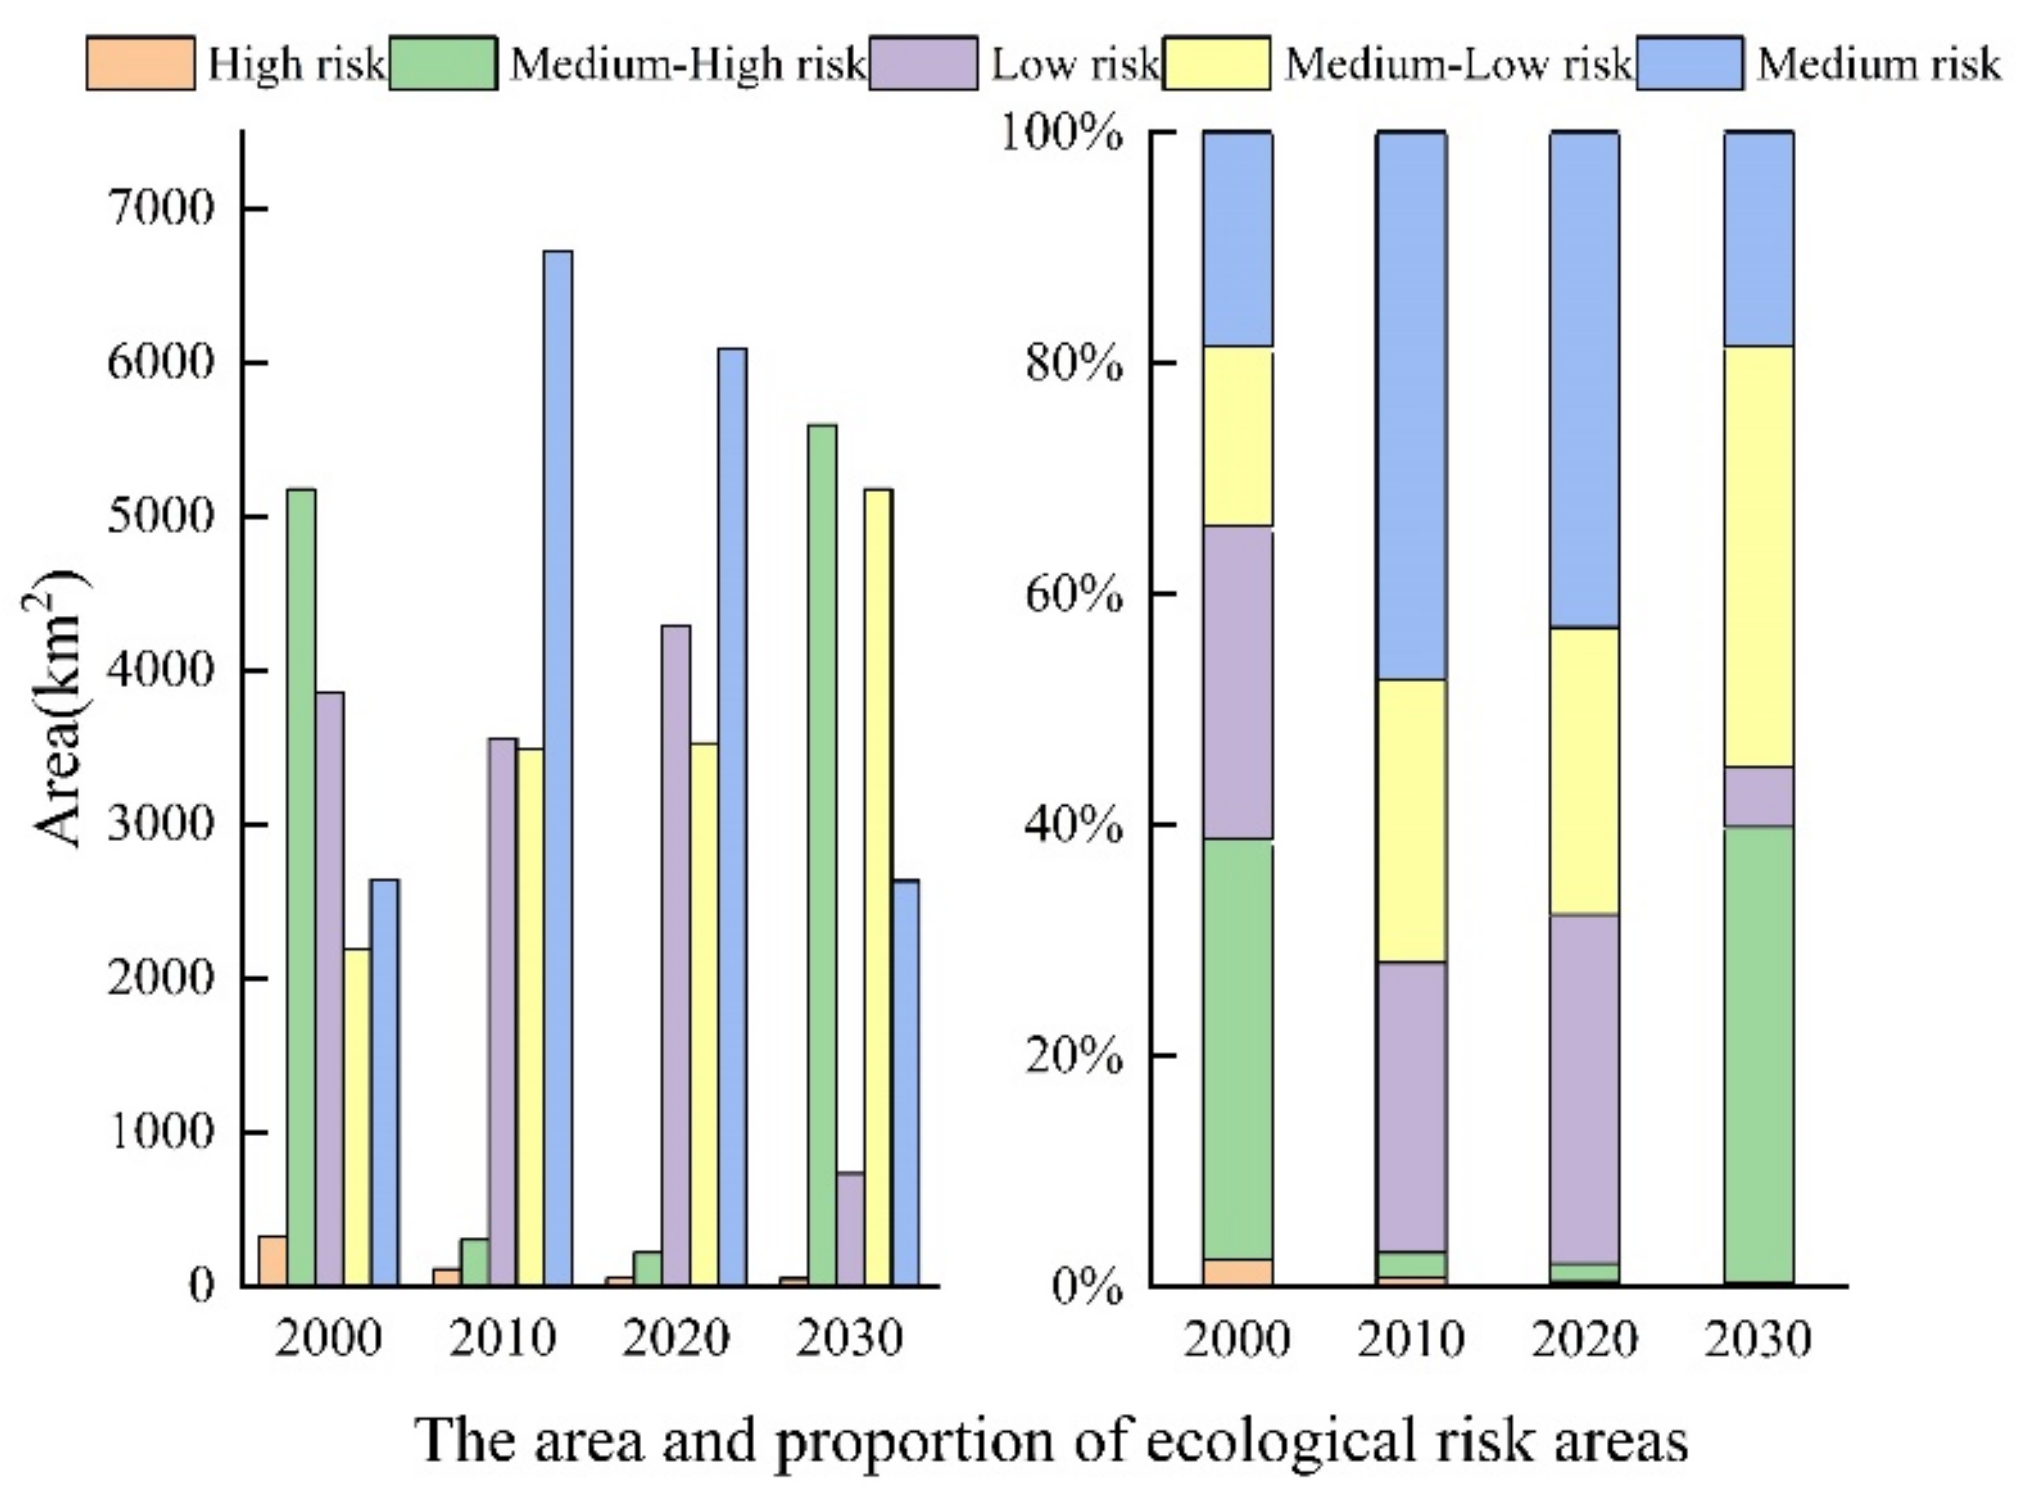
The statistical results of the areas with various levels of ecological risk from 2000 to 2030 are shown in Figure 10. We achieved spatial interpolation using the traditional ordinary kriging method, and considering the practical conditions of the study area, five types of areas were divided in accordance with the landscape ecological risk level in dependence on the natural breakpoint method: low-risk areas (ERI ≤ 0.18), medium-low-risk areas (0.18 < ERI ≤ 0.29), medium-risk areas (0.29 < ERI ≤ 0.39), medium-high-risk areas (0.39 < ERI ≤ 0.50), and high-risk areas (ERI > 0.50).
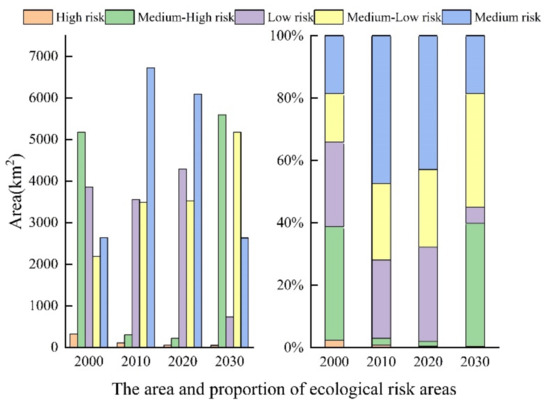
Figure 10.
The area and proportion of ecological risk areas of different levels from 2000 to 2020 and the simulation results in 2030.
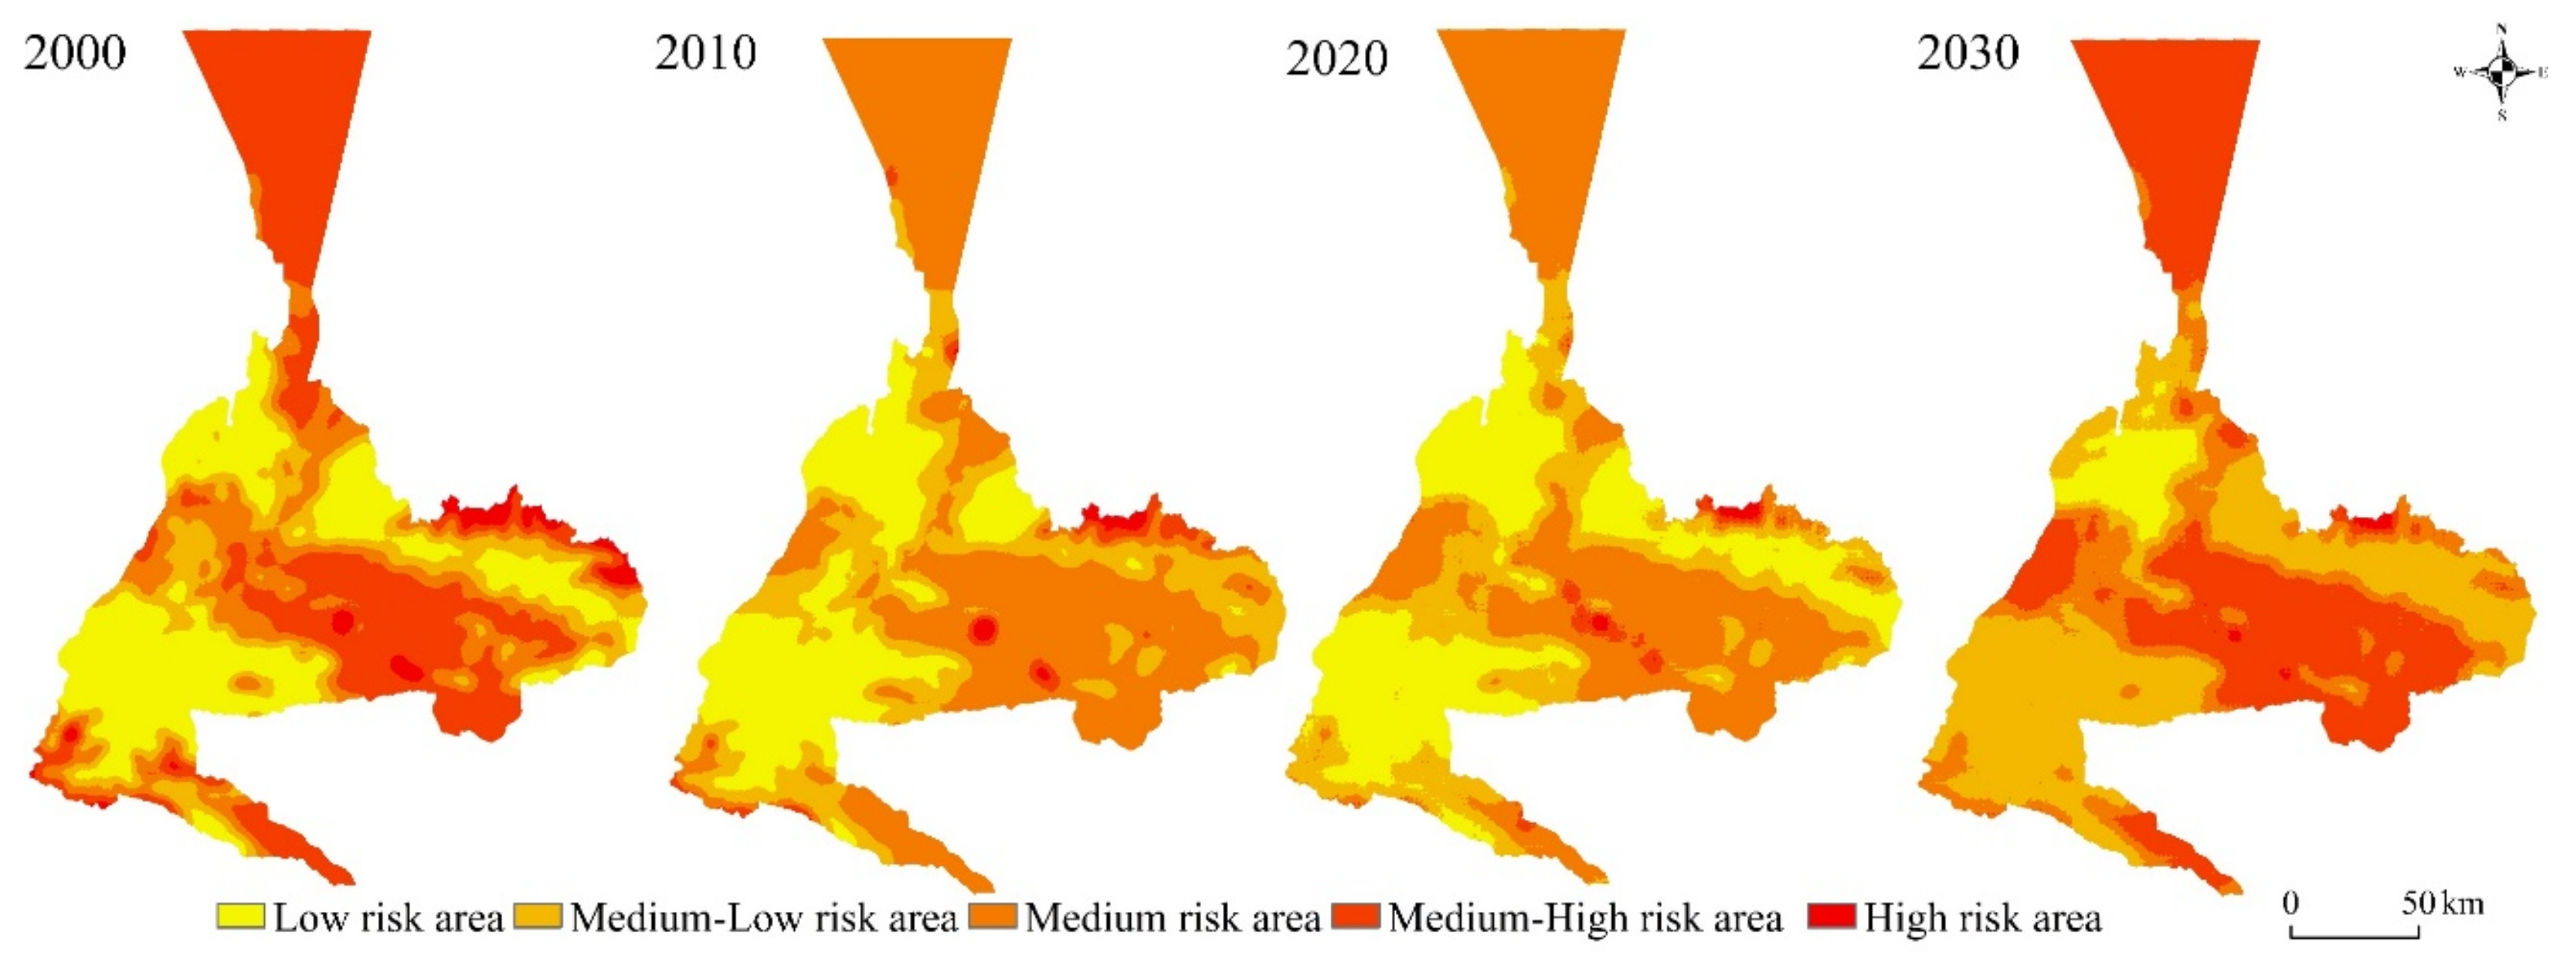
In general, the distribution of landscape ecological risk has obvious regional characteristics and is relatively stable, which is related to the fragmentation of the landscape pattern and the layout of diversity. High-risk areas are heavily distributed in the bare land area of Urumqi city, and the risk level gradually increases from west to east with sparse vegetation. The low-risk areas are located primarily in the main urban area of Urumqi, and the landscape ecological risk in the central area is smaller, mostly comprising urban living space, with complete, concentrated, and expanding patch patterns, and a small amount of distribution in Urumqi County and in the Dabancheng District. The medium-risk areas are all concentrated around the low-risk areas, which are mainly arable single-type land, woodland, and grassland areas that have a concentrated and continuous distribution, so the ecological risk value of these areas is low (Figure 11).
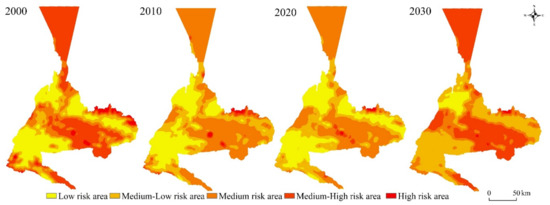
Figure 11.
Spatial distribution of landscape ecological risks in Urumqi from 2000 to 2020 and the forecast results for 2030.
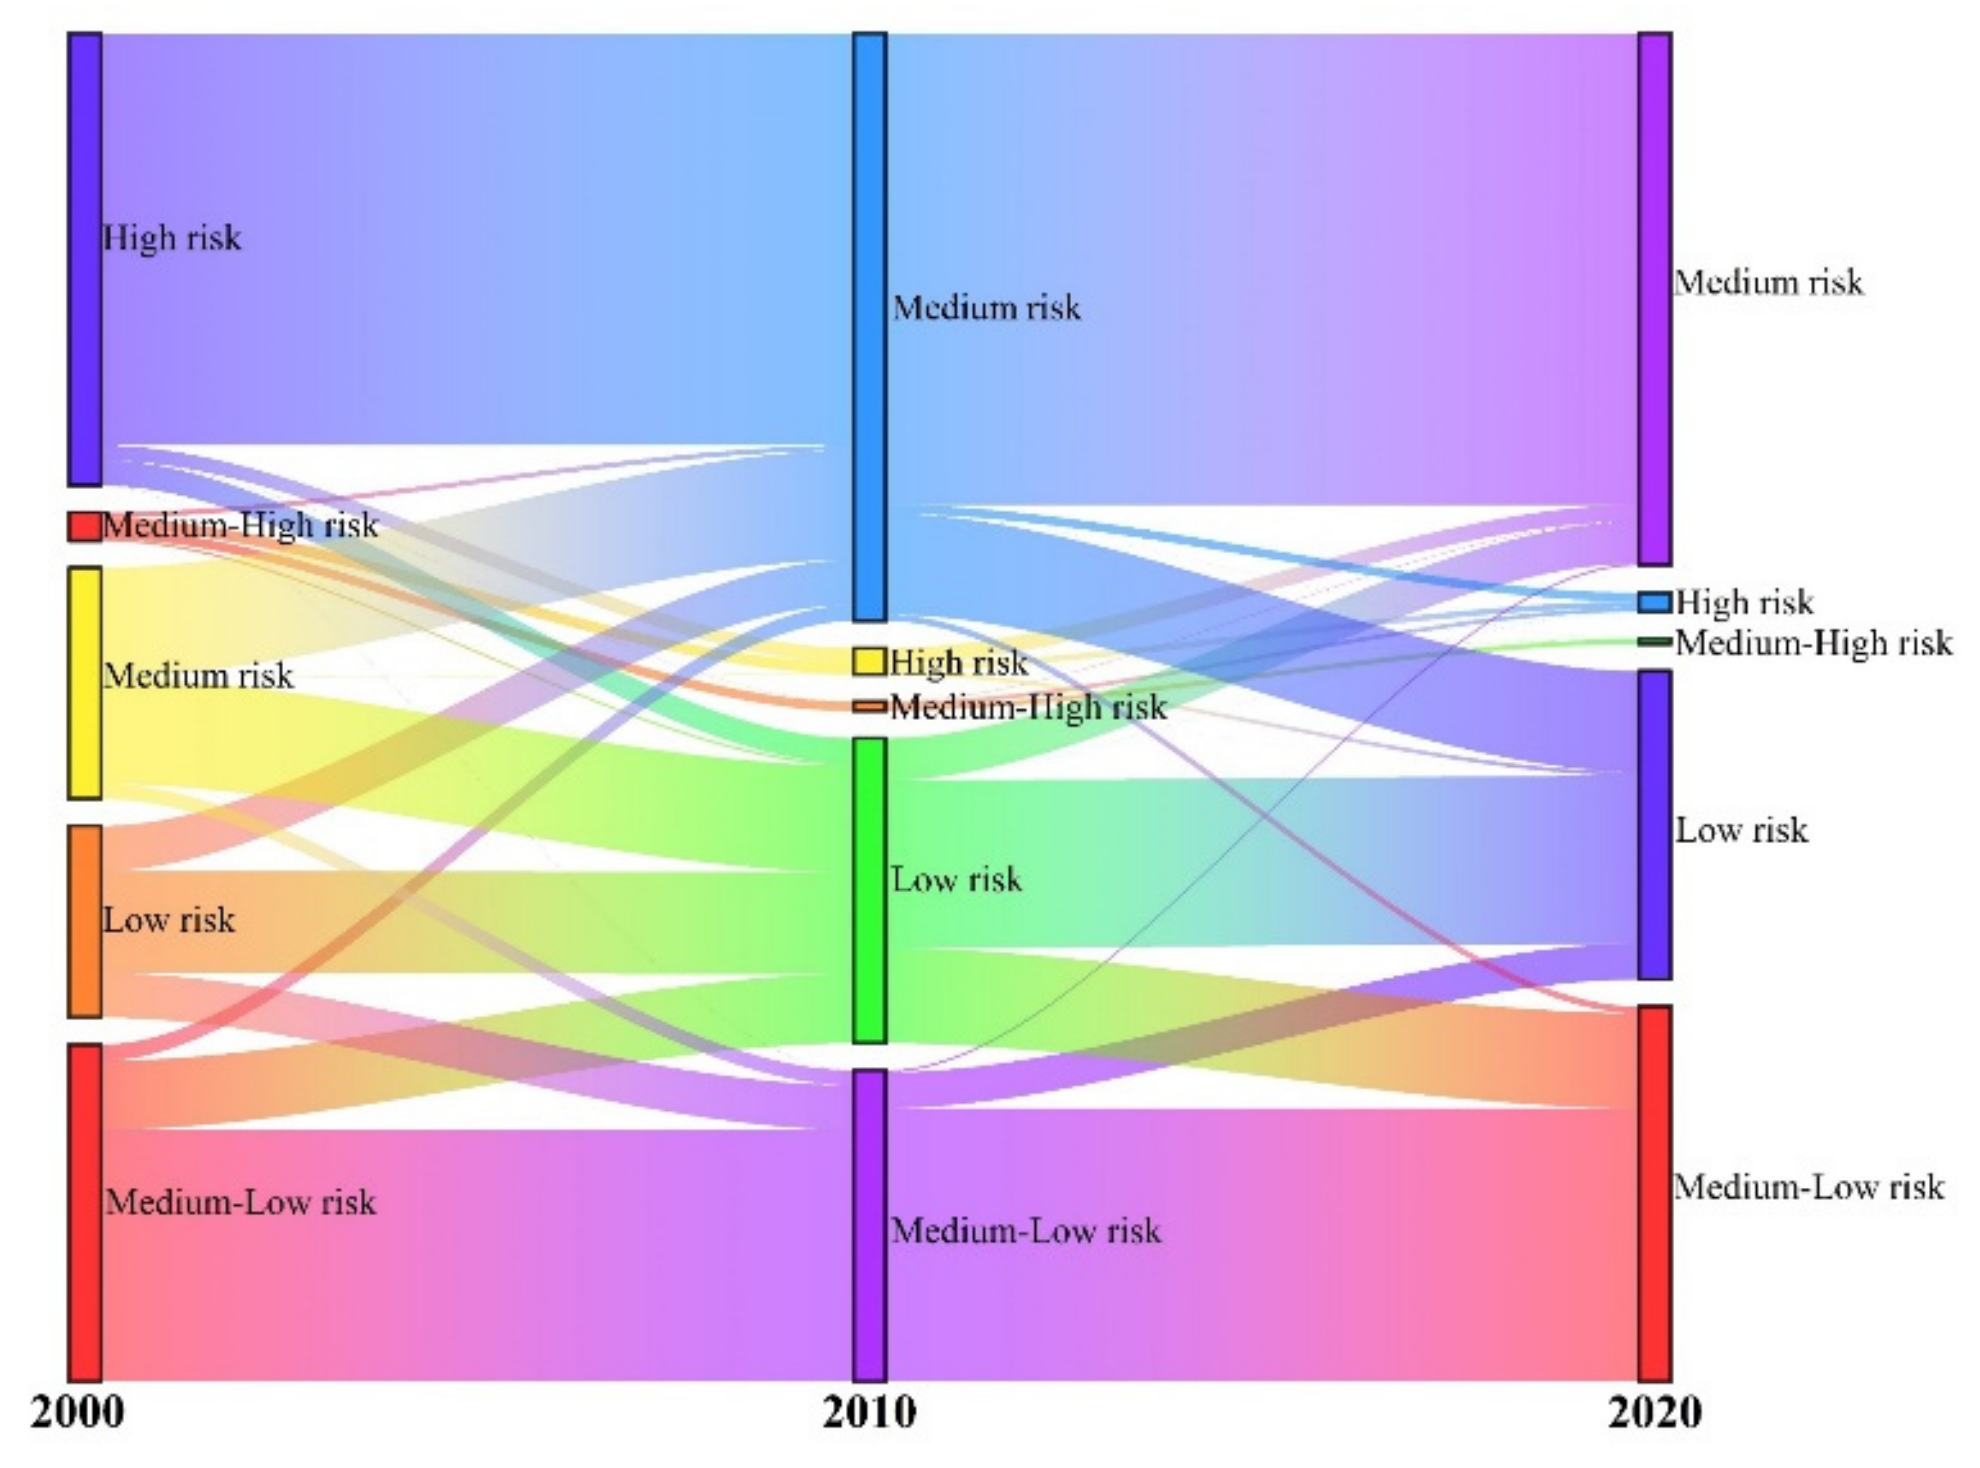
From 2000 to 2020, the area of different levels of risk zones changed in the field of research, but the spatial differentiation of various levels of ecological risk did not change significantly. The distribution of ecological risk zones at all levels (Figure 12) shows that the proportion of high-risk and medium-high-risk zones decreased to 0.42% and 1.55%, and these zones shrunk inward and decreased in area. The percentage of low-risk and medium-risk areas increased, with high-risk areas flowing to medium-risk areas and low-risk areas flowing to medium-low-risk areas. These areas were influenced by external activities and the landscape distribution tended to be concentrated or dispersed, leading to different degrees of decrease in the ecological risk values.
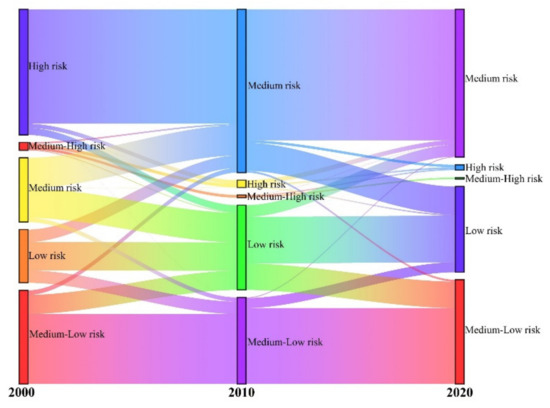
Figure 12.
Sankey diagram of landscape ecological risk transfer matrix.
4.4.2. Ecological Risk Centroid and Standard Deviation Ellipse Analysis
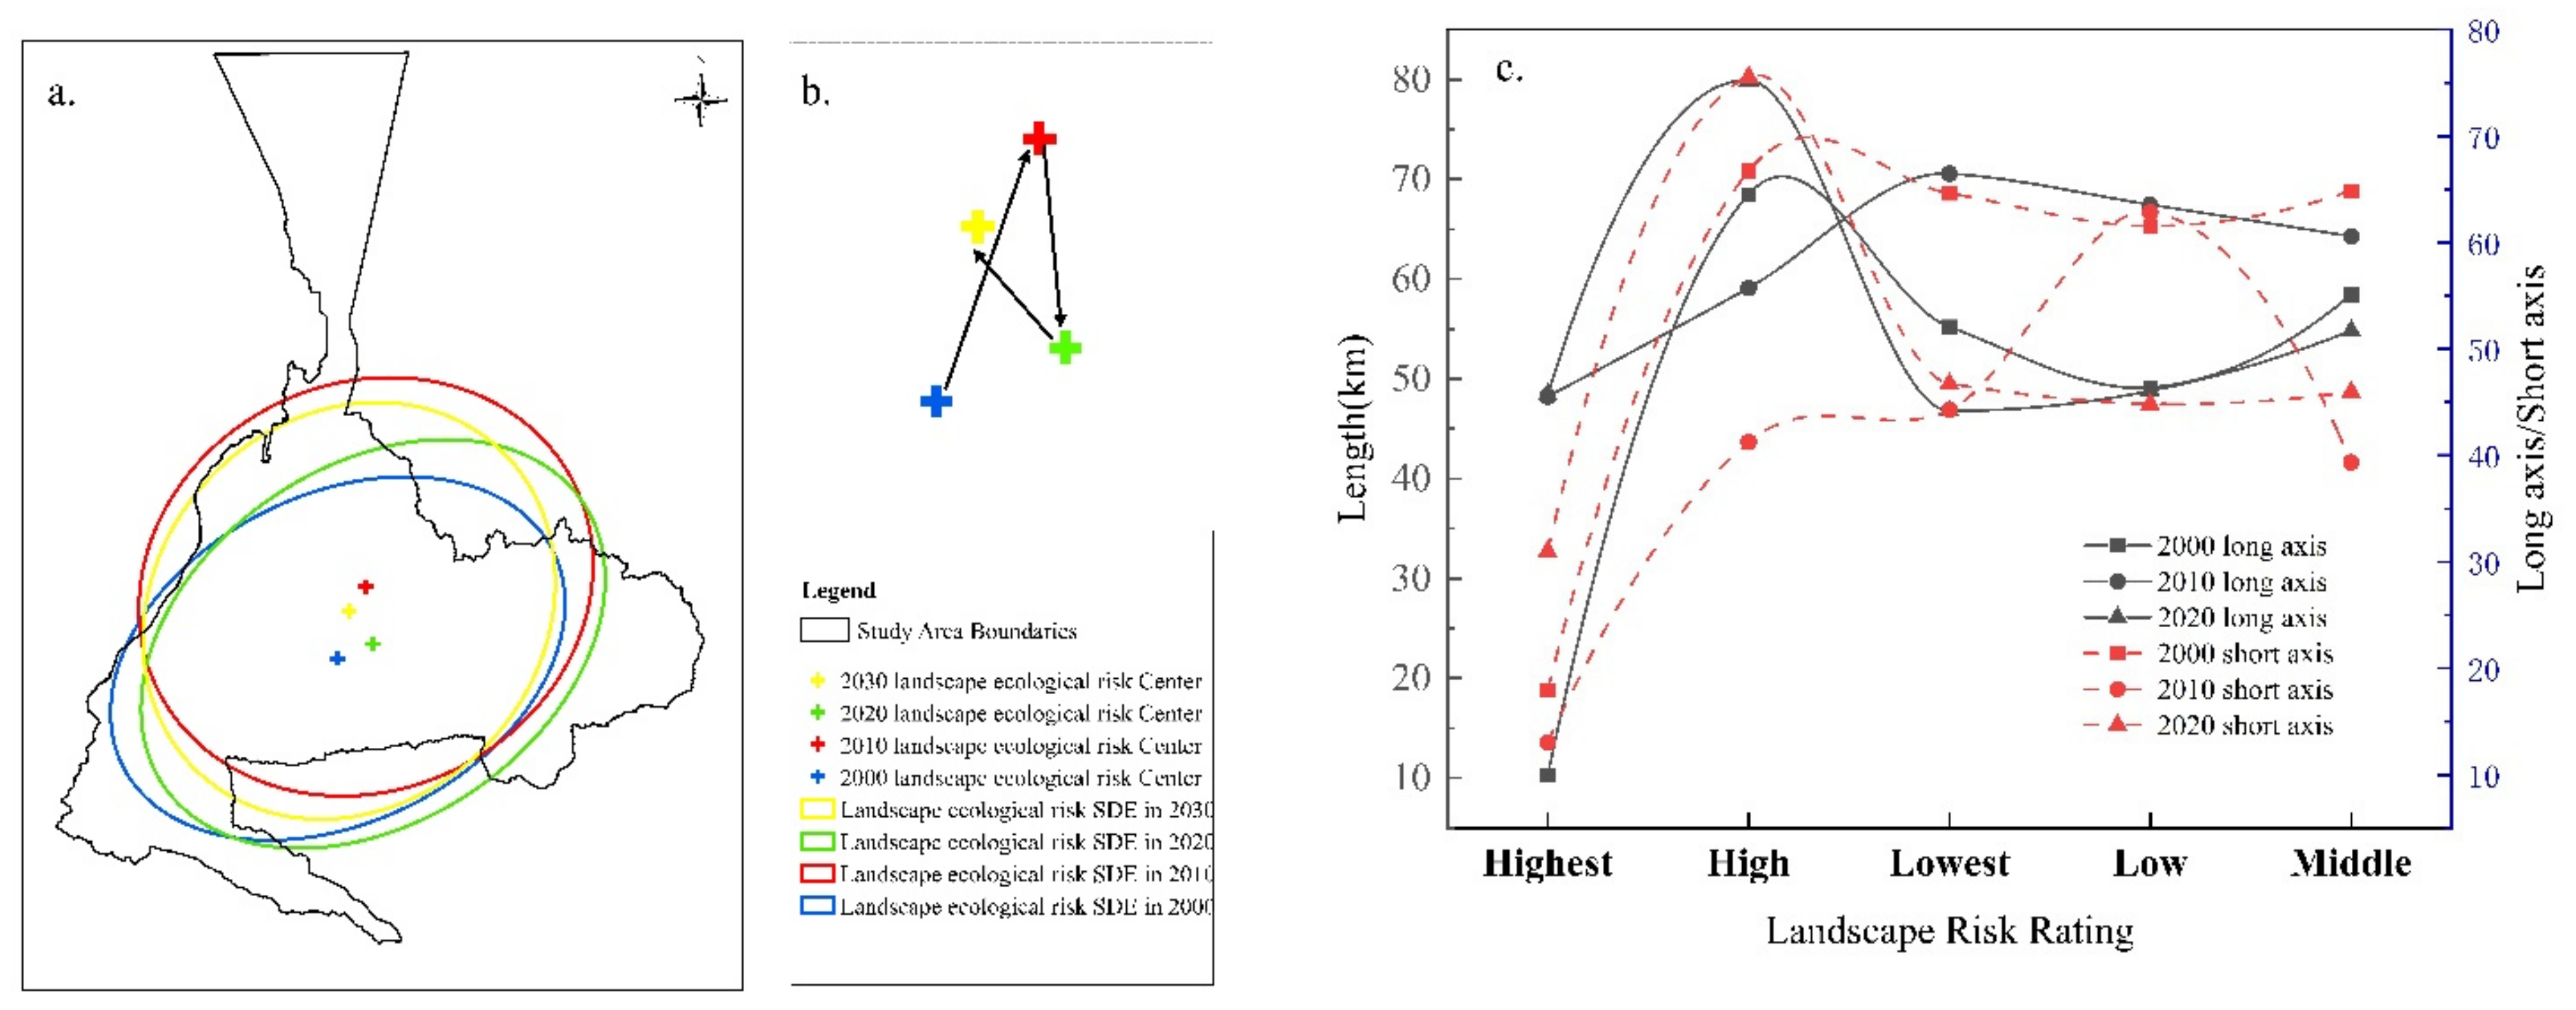
We also examined how the centroid of ecological risk in the Urumqi landscape shifts and evolves (Figure 13a,b). From 2000 to the projected year 2030, the centroid generally tends to move northward in a triangular pattern. Further statistical analysis (Figure 13c) shows that the lengths of the long and short axes of the standard deviation ellipse for each ecological risk class vary. The long axis reflects the direction of data distribution, which, in the case of this study, indicates that the trend of expansion in the east–west direction is increasing gradually, with the exception of the high- and medium-risk of landscape ecology; the short axis reflects the extent of the data distribution, which indicates that the distribution of the lowest-risk area has remained relatively stable in terms of expansion trends and dispersion in the north–south direction over the past 20 years, whereas a gradual increase can be observed in the high-risk areas in terms of expansion and dispersion in the north–south direction.
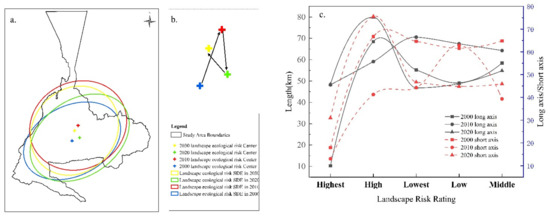
Figure 13.
Migration of the center of gravity in Urumqi from 2000 to 2030 (a,b) and standard deviation ellipse parameter information; changes in the long and short axes of the standard deviation ellipse (c).
4.4.3. Construction of Landscape Ecological Network
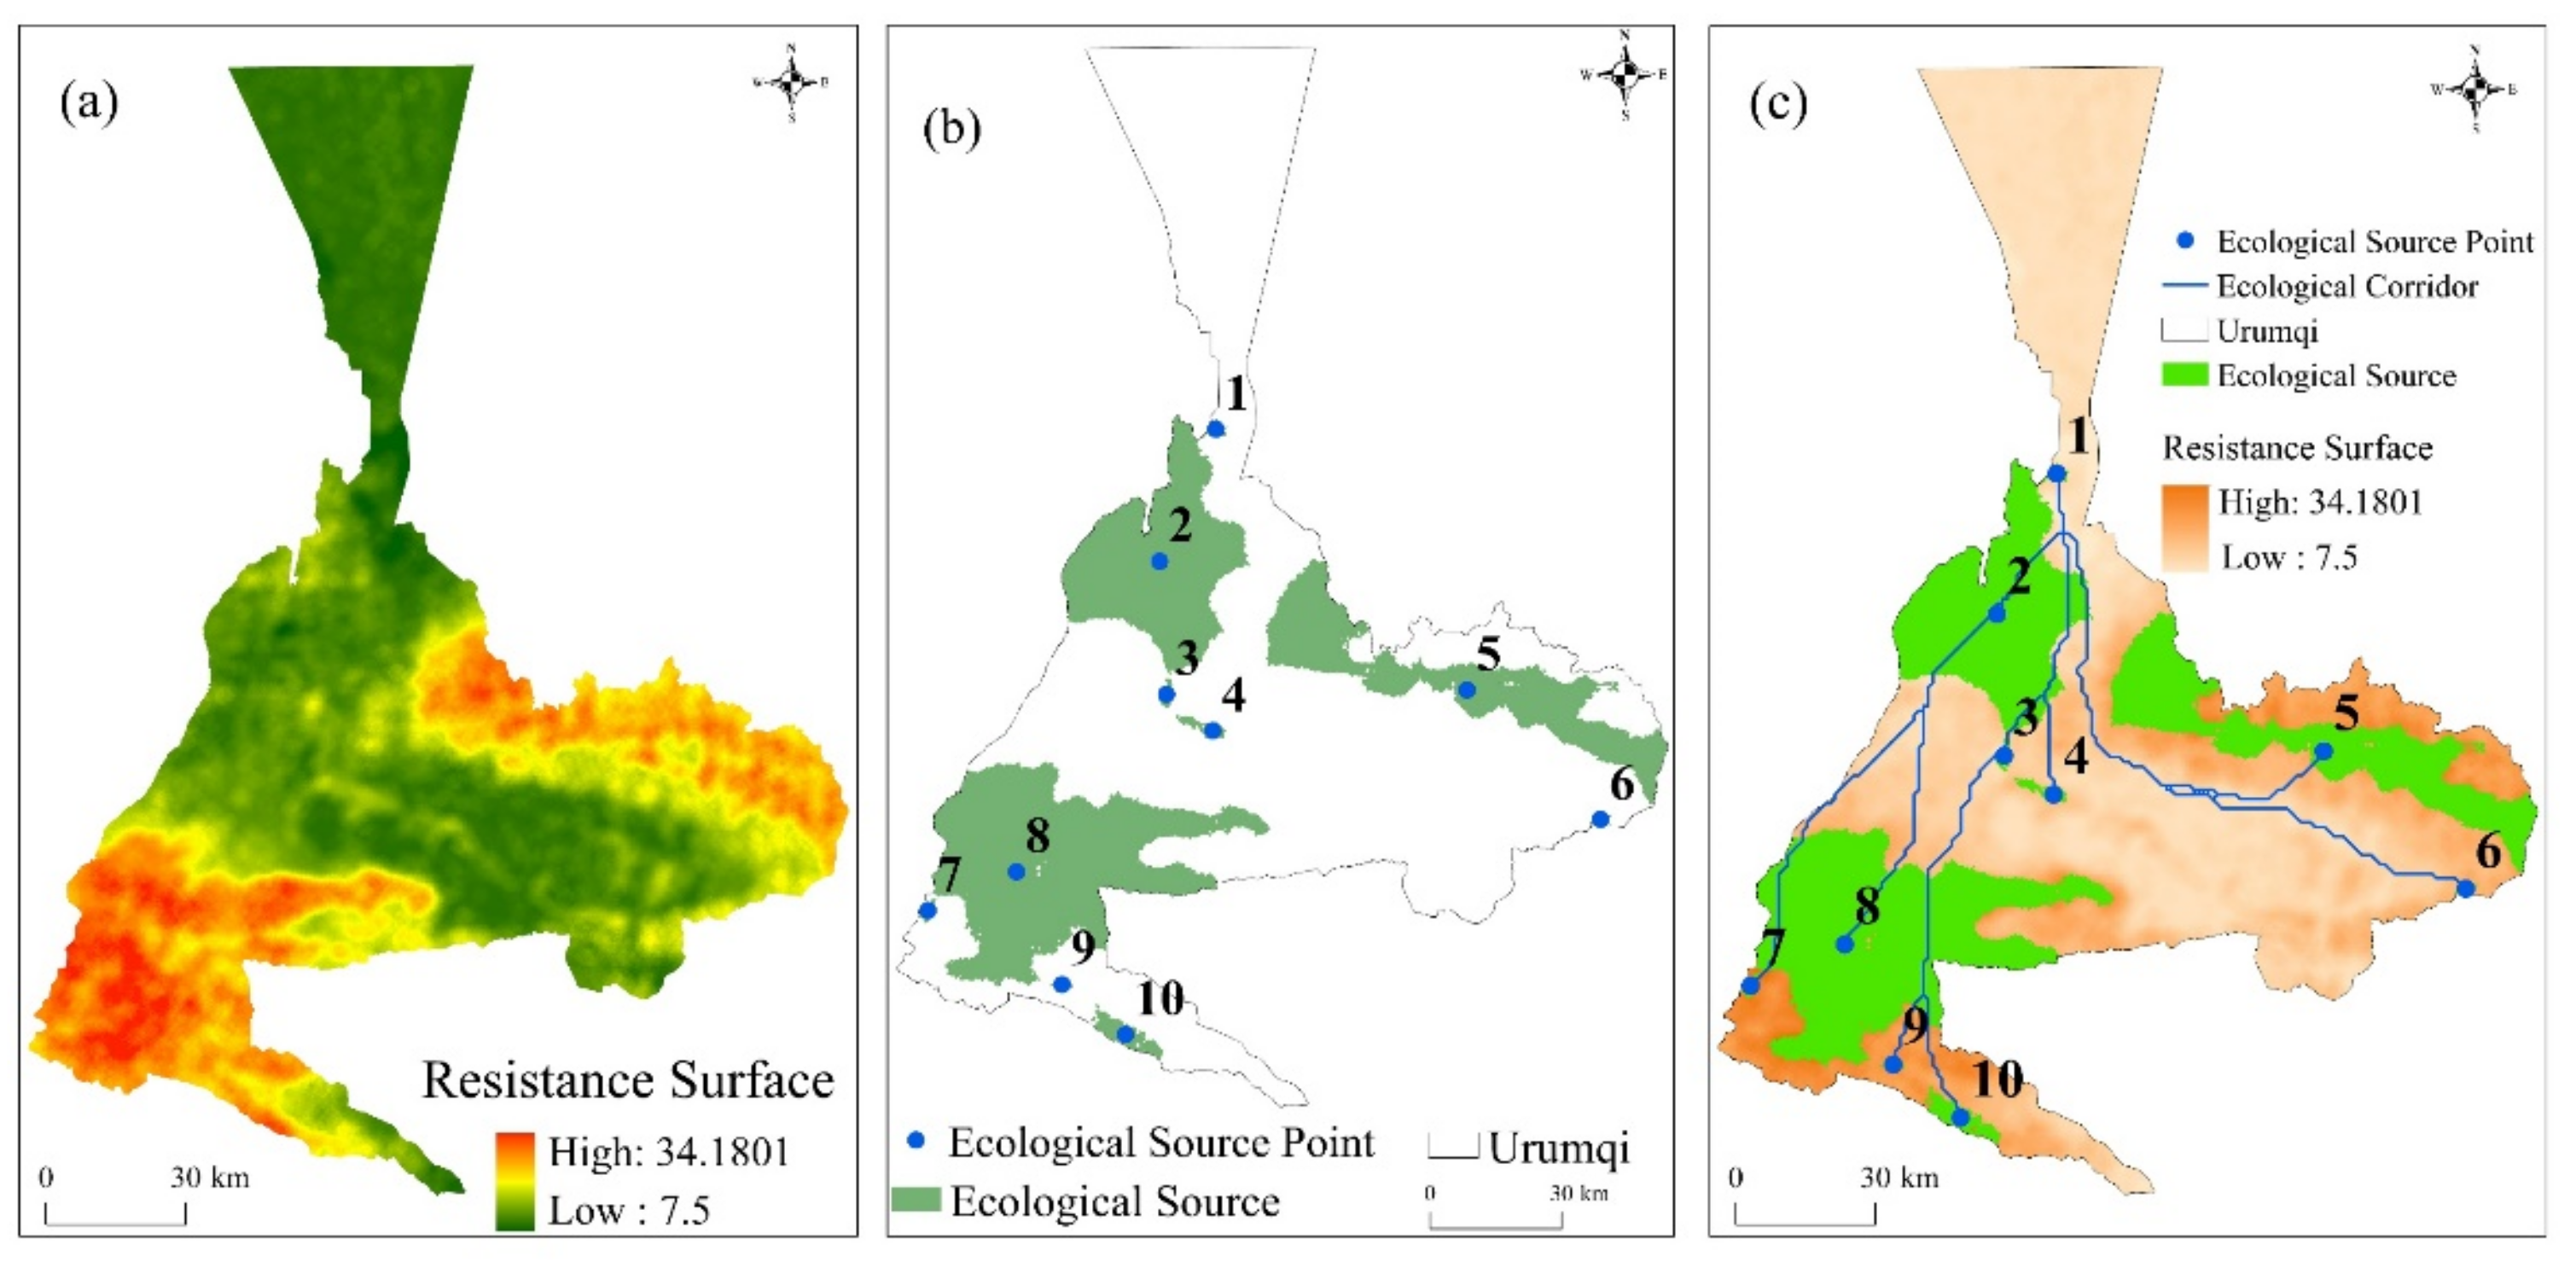
Before extracting ecological sources to construct ecological networks, it is necessary to extract the resistance surface of the study area, and this paper refers to previous studies on the construction of resistance surfaces in different landscapes: on the foundation of the minimum cumulative resistance model, based on the principles of selectivity and quantification, the resistance coefficient is determined using principal component analysis, which makes the evaluation results more objective compared with previous studies than those that used expert scoring methods or methods that have been referred to in the relevant literature to determine the resistance coefficient [59]. Taking 2020 as an example, standardized DEM, slope, land use data, annual average temperature, annual average precipitation, NDVI, data compression, and dimensionality reduction calculations were performed using principal component analysis, and finally, the loadings and cumulative contribution matrix of each principal component were obtained. As summarized in Table 6, the cumulative contribution rate of PC1, PC2, and PC3 reached 72.3% in 2020, indicating that the first three principal components concentrated on the original six indicators, so it is reasonable to use the first three principal components to construct the resistance system in the study area (Figure 14a).

Table 6.
Matrix of principal component loading and cumulative contribution rate in 2020.
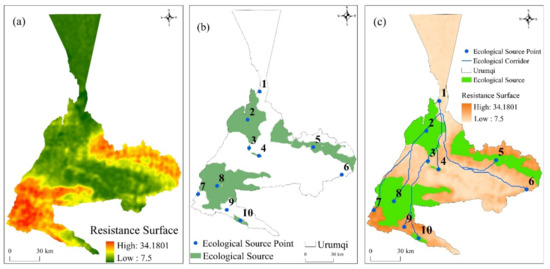
Figure 14.
Ecological resistance surface in the study area (a); schematic diagram of ecological source-point distribution (b); schematic diagram of ecological corridor (c).
Then, the ecological source sites were extracted, the corridors were generated, the calculation and selection of the dPC index for the study area were completed by Conefor software, 10 ecological sources were identified (Figure 14b), and the minimum path between adjacent ecological source sites is then calculated by the MCR model, that is, the corridor (Figure 14c). Together, these ecological sources and corridors constitute the existing ecological network of the study area.
The MCR model was combined with a gravity model to identify general corridors in the study area that are major species migration corridors between ecological sources. Within the study area, they are found in the southwestern, middle, and eastern districts of the research region, which have large vegetation areas, especially in the southwestern part of Urumqi County, where the good geography provides sufficient sunlight and water for its plants and is suitable for species to survive. As can be seen from the above map, there are no ecological sources or corridors in the northern and southeastern districts of the study region. This is because of the special geographical location and climatic conditions in the northern districts of the study area, such as its large desert and wasteland areas in the north and hills and mountains in the southeast. These factors result in there being no corridor distribution.
5. Discussion
5.1. Spatial and Temporal Evolution of Ecological Risk Based on Land Use
The conclusions of the land use study presented in this paper are largely consistent with those of other domestic researchers in Urumqi city, and the distinctive feature of land use change is the continuous extension of built-up land [60,61], but there are some differences. First, similar studies tend to start with 1995 as the base year [58], which may lead to differences in the characteristics of land use change and the evolution of ecological risks. The second difference is related to the differences in the division of the study area because Urumqi city was divided into Miquan city in the north before being merged into the current Midong District in 2007, so some of the scholars who have studied the characteristics of land use in space and on time in Urumqi have only studied the main city [62].
When comparing the allocation and percentage of each ecological risk class in the same study area [63], obvious consistency was observed in terms of the evolution patterns of LER, which was mainly reflected in the following: the dominant type is high-risk and medium-high-risk areas, which are widely distributed in the northern desert zone and the mountainous areas without vegetation cover in the south, but the area of high-risk areas demonstrates a decreasing trend year by year. Comparing the ecological risk evolution patterns in the neighboring region of Xinjiang Kizilsu Kyrgyz Autonomous Prefecture [64], it was found that the low- and medium-risk areas were more dispersed and showed a weak increasing trend in the area, whereas the high-risk areas were more compactly dispersed, similar to the ecological risk evolution pattern in Urumqi. However, compared with the landscape ecological risk in the neighboring region of Xinjiang Yili River Valley [65], we observed that the distribution trend of the two is opposite, with the Yili River Valley region being dominated by medium-low-risk and low-risk areas, with high-risk areas constantly flowing to medium-low-risk areas, probably because the Yili River Valley region is lying in the western side of the Tianshan Mountains, is surrounded by mountains on three sides, and is influenced by geomorphology. The watershed is rich in precipitation, forming a unique “wet island” climate in the northwest arid and semi-arid region [66], which is completely different from the natural environment of Urumqi and Kizilsu Kyrgyz Autonomous Prefecture. These two regions are lying in the middle of the Tianshan Mountains and the southwestern part of the Tianshan Mountains, where the Kizilsu Kyrgyz Autonomous Prefecture also borders the northern slope of the Kunlun Mountains at the northwestern edge of the Taklamakan Desert, where there is little rainfall and sporadic distribution of natural vegetation, thus leading to an opposite pattern of ecological risk evolution. Moreover, Xinjiang is the largest province in China in terms of area, and the Tianshan Mountains stretch across the central part of Xinjiang, dividing Xinjiang into two halves in the north and south, with the Tarim Basin in the south and the Junggar Basin in the north, and the precipitation varies greatly across the region, thus leading to huge differences in the natural environment across Xinjiang and, therefore, to obvious differences in ecological risk evaluation results across the region.
5.2. Landscape Ecological Network Construction
In terms of ecological network construction, other studies have found that the main factors affecting the integrated regional resistance are natural influences, human activity influences, and topographic influences, a result that coincides with the spatial characteristics of oasis cities in arid regions [67,68]. When comparing the results of the present research to those of other scholars, the ecological security pattern of Urumqi city is basically consistent [69], but there are also methodological differences: first, the source data for ecological network construction are mostly analyzed and constructed based on land use data, and the specialist scoring method is used to determine the magnitude of the resistance value [70], but the effectiveness of constructing ecological networks based on ecological risk as source data has also been verified [71]. Second, in recent years, scholars have also used nighttime light data [72], the topographic position index [73], and geohazard sensitivity [74] to correct the integrated resistance surface to make the evaluation results more objective, and in the future, this study will consider using other data to correct the integrated resistance surfaces.
5.3. Limitations and Future Work
This paper uses the MCR model to construct a network on account of LER in Urumqi using a 20-year database, which has the following shortcomings: firstly, we have only briefly performed an analysis of the spatiotemporal evolutionary pattern and predicted the future evolution trend for landscape ecological risk but did not analyze the complex driving force behind it. Secondly, due to the small number of corridors, this paper did not distinguish corridors and protection priorities. If the number of constructed ecological corridors is large and the corridor system is complex, it is necessary to classify the corridors. In the future, the specific grading of corridors will be carried out with reference to corridor length and connectivity, or a gravity-based model of the interaction matrix between ecological sources will be constructed to realize the grading of ecological corridors according to the magnitude of this strength. The effective grading and optimization of ecological corridors need to be further considered in the future.
6. Conclusions
To sum up, this study analyzed the land use evolution of Urumqi city over 20 years using remote sensing images from 2000 to 2020 combined with the random forest algorithm. A quantitative analysis of the substitution and mutual transformation processes was carried out to explore the law of land use change and the spatial special features of the landscape pattern in Urumqi, and the FLUS model was adopted to predict future land use change trends. We also divided the ecological risk districts and constructed the ecological risk index to reveal the ecological risk of Urumqi. The spatial and temporal characteristics are consistent with the ecological environment of the region, indicating that on a short time scale, the mapping of human activities can be expressed in landscape patterns in the ecological environment. It is feasible and reasonable.
We established an ecological network based on LER, used principal component analysis to identify the comprehensive resistance surface of the study area, used morphological spatial pattern analysis (MSPA) and landscape connectivity to identify ecological sources in central urban areas, and identified ecological sources in built-up areas through a comprehensive evaluation. Based on the MCR model, gravity model, and other methods to construct and superimpose the ecological network of the central urban area and the built-up area, we were able to identify key connecting corridors and nodes with the aim of coordinating ecological protection and urban development in national land space planning and urban development and to construct the central urban area of Urumqi while providing scientifically sound references.
Author Contributions
Writing—original draft preparation, Y.Z.; Methodology, H.L.; software, R.R.; funding acquisition, A.K. All authors have read and agreed to the published version of the manuscript.
Funding
This research was funded by The Third Xinjiang Scientific Expedition Program, grant number NO. 2021xjkk0905.
Institutional Review Board Statement
Not applicable.
Informed Consent Statement
Not applicable.
Data Availability Statement
The data in this study can be availed in the article.
Acknowledgments
We thank the two anonymous reviewers for their very constructive comments and suggestions, which have contributed to the improvement of the original manuscript. We also thank the editorial staff.
Conflicts of Interest
The authors declare no conflict of interest.
References
- Chen, H.; Fleskens, L.; Schild, J.; Moolenaar, S.; Wang, F.; Ritsema, C. Impacts of large-scale landscape restoration on spatio-temporal dynamics of ecosystem services in the Chinese Loess Plateau. Landsc. Ecol. 2022, 37, 329–346. [Google Scholar] [CrossRef]
- Barbati, A.; Corona, P.; Salvati, L.; Gasparella, L. Natural forest expansion into suburban countryside: Gained ground for a green infrastructure? Urban For. Urban Green. 2013, 12, 36–43. [Google Scholar] [CrossRef] [Green Version]
- Sinha, S.; Chakraborty, S.; Goswami, S. Ecological footprint: An indicator of environmental sustainability of a surface coal mine. Environ. Dev. Sustain. 2017, 19, 807–824. [Google Scholar] [CrossRef]
- Mooney, H.A.; Duraiappah, A.; Larigauderie, A. Evolution of natural and social science interactions in global change research programs. Proc. Natl. Acad. Sci. USA 2013, 110, 3665–3672. [Google Scholar] [CrossRef] [Green Version]
- Peng, J.; Zong, M.; Hu, Y.; Liu, Y.; Wu, J. Assessing Landscape Ecological Risk in a Mining City: A Case Study in Liaoyuan City, China. Sustainability 2015, 7, 8312–8334. [Google Scholar] [CrossRef] [Green Version]
- Gong, J.; Cao, E.; Xie, Y.; Xu, C.; Li, H.; Yan, L. Integrating ecosystem services and landscape ecological risk into adaptive management: Insights from a western mountain-basin area, China. J. Environ. Manag. 2021, 281, 111817. [Google Scholar] [CrossRef]
- Xue, L.; Zhu, B.; Wu, Y.; Wei, G.; Liao, S.; Yang, C.; Wang, J.; Zhang, H.; Ren, L.; Han, Q. Dynamic projection of ecological risk in the Manas River basin based on terrain gradients. Sci. Total Environ. 2019, 653, 283–293. [Google Scholar] [CrossRef]
- Ai, J.; Yu, K.; Zeng, Z.; Yang, L.; Liu, Y.; Liu, J. Assessing the dynamic landscape ecological risk and its driving forces in an island city based on optimal spatial scales: Haitan Island, China. Ecol. Indic. 2022, 137, 108771. [Google Scholar] [CrossRef]
- Li, W.; Wang, Y.; Xie, S.; Sun, R.; Cheng, X. Impacts of landscape multifunctionality change on landscape ecological risk in a megacity, China: A case study of Beijing. Ecol. Indic. 2020, 117, 106681. [Google Scholar] [CrossRef]
- Liu, S.L.; Cui, B.; Dong, S.; Yang, Z.; Yang, M.; Holt, K. Evaluating the influence of road networks on landscape and regional ecological risk—A case study in Lancang River Valley of Southwest China. Ecol. Eng. 2008, 34, 91–99. [Google Scholar] [CrossRef]
- Wei, S.; Pan, J.; Liu, X.J.H.; Journal, E.R.A.A.I. Landscape ecological safety assessment and landscape pattern optimization in arid inland river basin: Take Ganzhou District as an example. Hum. Ecol. Risk Assess. Int. J. 2020, 26, 782–806. [Google Scholar] [CrossRef]
- Feng, R.; Wang, F.; Wang, K. Spatial-temporal patterns and influencing factors of ecological land degradation-restoration in Guangdong-Hong Kong-Macao Greater Bay Area. Sci. Total Environ. 2021, 794, 148671. [Google Scholar] [CrossRef]
- Chen, L.D.; Li, X.Z.; Fu, B.J.; Xiao, D.N.; Zhao, W.W. Development history and future research priorities of landscape ecology in China. Acta Ecol. Sin. 2014, 34, 3129–3141. [Google Scholar]
- Xu, W.; Wang, J.; Zhang, M.; Li, S. Construction of landscape ecological network based on landscape ecological risk assessment in a large-scale opencast coal mine area. J. Clean. Prod. 2021, 286, 125523. [Google Scholar] [CrossRef]
- Knaapen, J.P.; Scheffer, M.; Harms, B. Estimating habitat isolation in landscape planning. Landsc. Urban Plann. 1992, 23, 1–16. [Google Scholar] [CrossRef]
- Qiu, S.; Wang, Y.; Wang, P.; Lin, C. Construction of urban ecological security pattern and construction land development based on MCR Model. Trans. Chin. Soc. Agric. Eng. 2018, 34, 257–265. [Google Scholar]
- Cui, X.; Deng, W.; Yang, J.; Huang, W.; De Vries, W.T. Construction and optimization of ecological security patterns based on social equity perspective: A case study in Wuhan, China. Ecol. Indic. 2022, 136, 108714. [Google Scholar] [CrossRef]
- Ding, M.; Liu, W.; Xiao, L.; Zhong, F.; Lu, N.; Zhang, J.; Zhang, Z.; Xu, X.; Wang, K. Construction and optimization strategy of ecological security pattern in a rapidly urbanizing region: A case study in central-south China. Ecol. Indic. 2022, 136, 108604. [Google Scholar] [CrossRef]
- Liu, X.; Liang, X.; Li, X.; Xu, X.; Ou, J.; Chen, Y.; Li, S.; Wang, S.; Pei, F. A future land use simulation model (FLUS) for simulating multiple land use scenarios by coupling human and natural effects. Landsc. Urban Plan. 2017, 168, 94–116. [Google Scholar] [CrossRef]
- Li, X.; Chen, G.; Liu, X.; Liang, X.; Wang, S.; Chen, Y.; Pei, F.; Xu, X. A New Global Land-Use and Land-Cover Change Product at a 1-km Resolution for 2010 to 2100 Based on Human–Environment Interactions. Ann. Am. Assoc. Geogr. 2017, 107, 1040–1059. [Google Scholar] [CrossRef]
- Liu, X.; Li, X.; Ai, B.; Tao, H.; Wu, S.; Liu, T. Multi-agent systems for simulating and planning land use development. Acta Geogr. Sin. 2006, 61, 1101–1112. [Google Scholar]
- Wang, Z.; Zhang, K.; Ding, Z. Delineation of Urban Growth Boundary based on Improved FLUS Model Considering Dynamic Data. J. Geo-Inf. Sci. 2020, 22, 2326–2337. [Google Scholar]
- Zhao, X.; Peng, J.D.; Fan, Z.Y.; Yang, C.; Yang, H. Land use simulation and urban growth boundaries delineation in Wuhan metropolitan area based on FLUS model and “Dual Environment Evaluation”. J. Geo-Inf. Sci 2020, 22, 2212–2226. [Google Scholar]
- Zheng, J. Atmospheric environmental quality assessment for Urumqi with analytical hier-archy process model. J. Arid Land Resour. Environ. 2013, 27, 148–153. [Google Scholar]
- Breiman, L. Random Forests. Mach. Learn. 2001, 45, 5–32. [Google Scholar] [CrossRef] [Green Version]
- Wu, H.; Lin, A.; Xing, X.; Song, D.; Li, Y. Identifying core driving factors of urban land use change from global land cover products and POI data using the random forest method. Int. J. Appl. Earth Obs. Geoinform. 2021, 103, 102475. [Google Scholar] [CrossRef]
- Wang, S.; Chen, X.; Duan, H.; Zhou, K.; Alixir, K. Study on Response of Land Surface Temperature to Land Use and Land Cover Change Using Remote Sensing Data: A case on Urumqi, China. J. Desert Res. 2012, 32, 878–884. [Google Scholar]
- Sexton, J.O.; Urban, D.L.; Donohue, M.J.; Song, C. Long-term land cover dynamics by multi-temporal classification across the Landsat-5 record. Remote Sens. Environ. 2013, 128, 246–258. [Google Scholar] [CrossRef]
- Janssen, L.L.; Vanderwel, F.J. Accuracy assessment of satellite derived land-cover data: A review. Photogramm. Eng. Remote Sens. 1994, 60, 410–432. [Google Scholar]
- Zhao, Y. Principles and Methods of Remote Sensing Application Analysis; Science Press: Beijing, China, 2003. [Google Scholar]
- Gao, J.; Gong, J.; Yang, J.; Li, J.; Li, S. Measuring Spatial Connectivity between patches of the heat source and sink (SCSS): A new index to quantify the heterogeneity impacts of landscape patterns on land surface temperature. Landsc. Urban Plan. 2022, 217, 104260. [Google Scholar] [CrossRef]
- Huang, X.; Wang, H.; Shan, L.; Xiao, F. Constructing and optimizing urban ecological network in the context of rapid urbanization for improving landscape connectivity. Ecol. Indic. 2021, 132, 108319. [Google Scholar] [CrossRef]
- Yang, X.; Zheng, X.Q.; Chen, R. A land use change model: Integrating landscape pattern indexes and Markov-CA. Ecol. Model. 2014, 283, 1–7. [Google Scholar] [CrossRef]
- Guo, S.; Wu, C.; Wang, Y.; Qiu, G.; Zhu, D.; Niu, Q.; Qin, L. Threshold effect of ecosystem services in response to climate change, human activity and landscape pattern in the upper and middle Yellow River of China. Ecol. Indic. 2022, 136, 108603. [Google Scholar] [CrossRef]
- Hou, L.; Wu, F.; Xie, X. The spatial characteristics and relationships between landscape pattern and ecosystem service value along an urban-rural gradient in Xi’an city, China. Ecol. Indic. 2020, 108, 105720. [Google Scholar] [CrossRef]
- Wang, H.; Liu, X.; Zhao, C.; Chang, Y.; Liu, Y.; Zang, F. Spatial-temporal pattern analysis of landscape ecological risk assessment based on land use/land cover change in Baishuijiang National nature reserve in Gansu Province, China. Ecol. Indic. 2021, 124, 107454. [Google Scholar] [CrossRef]
- Zhang, Y.; Li, Y.; Lv, J.; Wang, J.; Wu, Y. Scenario simulation of ecological risk based on land use/cover change—A case study of the Jinghe county, China. Ecol. Indic. 2021, 131, 108176. [Google Scholar] [CrossRef]
- Xie, H.L. Regional Eco-Risk Analysis Based on Landscape Structure and Spatial Statistics. Acta Ecol. Sin. 2008, 10, 5020–5026. [Google Scholar]
- Zhang, X.; Shi, P.; Luo, J.; Liu, H.; Wei, W. The ecological risk assessment of arid inland river basin at the landscape scale: A case study on Shiyang River Basin. J. Nat. Resour. 2014, 29, 410–419. [Google Scholar]
- Zhang, W.; Chang, W.J.; Zhu, Z.C.; Hui, Z. Landscape ecological risk assessment of Chinese coastal cities based on land use change. Appl. Geogr. 2020, 117, 102174. [Google Scholar] [CrossRef]
- Wang, J.; Bai, W.; Tian, G. Spatiotemporal characteristics of landscape ecological risks on the Tibetan Plateau. Resour. Sci. 2020, 42, 1739–1749. [Google Scholar] [CrossRef]
- Li, X.; Li, J. Analysis on regional landscape ecological risk based on GIS—A case study along the lower reaches of the Weihe River. Arid Zone Res. 2008, 25, 899–903. [Google Scholar]
- Peng, J.; Wang, Y.; Zhang, Y.; Wu, J.; Li, W.; Li, Y. Evaluating the effectiveness of landscape metrics in quantifying spatial patterns. Ecol. Indic. 2010, 10, 217–223. [Google Scholar] [CrossRef]
- Gong, J.; Zhao, C.; Xie, Y.; Gao, Y. Ecological risk assessment and its management of Bailongjiang watershed, southern Gansu based on landscape pattern. Ying Yong Sheng Tai Xue Bao 2014, 25, 2041–2048. [Google Scholar]
- Li, S.; Zhao, Y.; Xiao, W.; Zhang, H. Spatial and temporal differentiation of landscape ecological quality in Chaohu river basin. Trans. Chin. Soc. Agric. Mach. 2020, 51, 203–213. [Google Scholar]
- Jin, X.; Jin, Y.; Mao, X. Ecological risk assessment of cities on the Tibetan Plateau based on land use/land cover changes—Case study of Delingha City. Ecol. Indic. 2019, 101, 185–191. [Google Scholar] [CrossRef]
- Huang, X. Introduction to Geographic Information Systems (Revised Edition); Higher Education Press: Beijing, China, 2001. [Google Scholar]
- Zhang, X.; Dong, T.; Du, H. Optimization of landscape pattern in Fujiang River Basin based on landscape ecological risk assessment. Acta Ecol. Sin. 2021, 41, 3940–3951. [Google Scholar]
- Zuo, Z.; Guo, H.; Cheng, J.; Li, Y. How to achieve new progress in ecological civilization construction?–Based on cloud model and coupling coordination degree model. Ecol. Indic. 2021, 127, 107789. [Google Scholar] [CrossRef]
- Zhang, X.; Zhang, B.; Yao, Y.; Wang, J.; Yu, F.; Liu, J.; Li, J. Dynamics and climatic drivers of evergreen vegetation in the Qinling-Daba Mountains of China. Ecol. Indic. 2022, 136, 108625. [Google Scholar] [CrossRef]
- Gong, J.; Chen, Y.; Zhang, Z. Regional Land Use Change and Its Driving Forces Analysis Based on Multinomial Logistic Regression. Hubei Agric. Sci. 2016, 55, 4545–4550. [Google Scholar]
- Wang, X.W.; Wang, S.J.; Song, Y.; Feng, Z. Changchun land use spatio-temporal variation under the transportation elements’ driving. Econ. Geogr. 2015, 35, 155–161. [Google Scholar]
- Yang, Y.; Alimujiang, k. Relationship between regional transportation advantage and development of reginal economy in Xinjiang under the background of the national strategy of the Belt and Road. Arid Land Geogr. 2017, 40, 680–691. [Google Scholar]
- Shu, B.R.; Li, Y.L.; Qu, Y.; Mei, Y.; Yong, X. Urban Land Expansion Characteristics and Its Forces under Different Stages of Economic Development: A Case Study of Taicang City. Econ. Geogr. 2013, 33, 155–162. [Google Scholar]
- Guo, H.; Cai, Y.; Yang, Z.; Zhu, Z.; Ouyang, Y. Dynamic simulation of coastal wetlands for Guangdong-Hong Kong-Macao Greater Bay area based on multi-temporal Landsat images and FLUS model. Ecol. Indic. 2021, 125, 107559. [Google Scholar] [CrossRef]
- Liang, X.; Liu, X.; Li, X.; Chen, Y.; Tian, H.; Yao, Y. Delineating multi-scenario urban growth boundaries with a CA-based FLUS model and morphological method. Landsc. Urban Plan. 2018, 177, 47–63. [Google Scholar] [CrossRef]
- Dai, L.; Liu, Y.; Luo, X. Integrating the MCR and DOI models to construct an ecological security network for the urban agglomeration around Poyang Lake, China. Sci. Total Environ. 2021, 754, 141868. [Google Scholar] [CrossRef]
- Maimaitijiang, M.; Alimujiang, K. Spatial-temporal change of Urumqi urban land use and land cover based on grid cell approach. Trans. Chin. Soc. Agric. Eng. 2018, 34, 210–216. [Google Scholar]
- Fan, C.; Wang, Z.; Tang, N. Construction of ecological network in downtown of Guiyang city based on morphologically spatial pattern and spatially principal component analysis. Acta Ecol. Sin. 2022, 42. [Google Scholar] [CrossRef]
- Zhang, Q.; Shao, Z.; Lin, J.; Meng, L. Transformation of land use function in Urumqi and its ecological service value from the perspective of“production-ecological-living space”. Environ. Poll. Contr. 2022, 44, 218–224, 229. [Google Scholar]
- Zhao, Y.; Alimujiang, K.; Gao, P.; Liang, H. Quantitative analysis of urban expansion and response factors in Urumqi City based on random forest algorithm and geographical detector. Arid Land Geogr. 2021, 44, 1729–1739. [Google Scholar]
- Zhao, H.; Alimujiang, K. Study on the relationship between thermal environment and underlying surface in the main urban area of Ürümqi. Sci. Surv. Mapp. 2021, 46, 179–187. [Google Scholar]
- Wang, J.; Wu, Z. Evolution on patterns and risk assessment of productive-living-ecological space in Urumqi city during 2000–2018. Bull. Soil Water Conserv. 2021, 41, 318–326, 335. [Google Scholar]
- Jin, M.; Xu, L.; Xu, Q. FLUS-Markov model-based multiscenario evaluation and prediction of the landscape ecological risk in Kezhou, South Xinjiang. Arid Zone Res. 2021, 38, 1793–1804. [Google Scholar]
- Yan, Y.; Yang, L.; Wang, W.; Fang, H.; Zhuang, Q. Analysis of spatial-temporal variation of landscape ecological risk and itsterrain gradient in Ili valley. Ecol. Sci. 2020, 39, 125–136. [Google Scholar]
- Wang, Y.; Ding, J.; Li, X.; Zhang, J.; Ma, G. Impact of LUCC on ecosystem services values in the Yili River Basin based on an intensity analysis model. Acta Ecol. Sin. 2022, 42, 3106–3118. [Google Scholar]
- Wu, Z.; Lei, S.; Yan, Q.; Bian, Z.; Lu, Q. Landscape ecological network construction controlling surface coal mining effect on landscape ecology: A case study of a mining city in semi-arid steppe. Ecol. Indic. 2021, 133, 108403. [Google Scholar] [CrossRef]
- Pan, N.; Du, Q.; Guan, Q.; Tan, Z.; Sun, Y.; Wang, Q. Ecological security assessment and pattern construction in arid and semi-arid areas: A case study of the Hexi Region, NW China. Ecol. Indic. 2022, 138, 108797. [Google Scholar] [CrossRef]
- Halimulati, A.; Alimujiang, K.; Zubaidan, A. Construction and optimization of Urumqi ecological network based on the morphological spatial pattern analysis and MCR model. Sci. Soil Water Conserv. 2021, 19, 106–114. [Google Scholar]
- Zhang, R.; Zhang, L.; Zhong, Q.; Zhang, Q.; Ji, Y.; Song, P.; Wang, Q. An optimized evaluation method of an urban ecological network: The case of the Minhang District of Shanghai. Urban For. Urban Green. 2021, 62, 127158. [Google Scholar] [CrossRef]
- Pei, Y.; Sun, Y.; Yu, Q.; Ma, J.; Wang, H.; Yue, D. Optimization of ecological spatial network in typical mining areas of the Yellow River Basin:Take Ordos and Yulin areas of the Yellow River Basin as examples. J. China Coal Soc. 2021, 46, 1541–1554. [Google Scholar]
- Du, T.F.; Qi, W.; Zhu, X.C.; Wang, X.; Zhang, Y.; Zhang, L. Precise identification and control method of natural resources space based on ecological security pattern in mountainous hilly area. J. Nat. Resourc. 2020, 35, 1190–1200. [Google Scholar]
- Su, C.; Dong, J.; Ma, Z.; Qiao, N.; Peng, J. Identifying priority areas for ecological protection and restoration of mountains-rivers-forests-farmlands-lakes-grasslands based on ecological security patterns: A case study in Huaying Mountain, Sichuan Province. Acta Ecol. Sin. 2019, 39, 8948–8956. [Google Scholar]
- Peng, J.; Li, H.; Liu, Y.; Hu, Y.; Yang, Y. Identification and optimization of ecological security pattern in Xiong’an New Area. Acta Geogr. Sin. 2018, 73, 701–710. [Google Scholar]
Publisher’s Note: MDPI stays neutral with regard to jurisdictional claims in published maps and institutional affiliations. |
© 2022 by the authors. Licensee MDPI, Basel, Switzerland. This article is an open access article distributed under the terms and conditions of the Creative Commons Attribution (CC BY) license (https://creativecommons.org/licenses/by/4.0/).

