Article

Behavior of Polish Consumers in Relation to Meals Ordered in Food Service Establishments in the Context of Plate Waste

by
Marzena Tomaszewska
1,
Beata Bilska
1,* and
Danuta Kołożyn-Krajewska
1,2
1
Department of Food Gastronomy and Food Hygiene, Institute of Human Nutrition Sciences, Warsaw University of Life Sciences (SGGW-WULS), 159C Nowoursynowska St., 02-776 Warsaw, Poland
2
Polish Food Technologists’ Society, 166 Nowoursynowska St., 02-787 Warsaw, Poland
*
Author to whom correspondence should be addressed.
Sustainability 2022, 14(13), 8153; https://doi.org/10.3390/su14138153
Submission received: 10 June 2022 / Revised: 27 June 2022 / Accepted: 29 June 2022 / Published: 4 July 2022
(This article belongs to the Special Issue Sustainable Food Waste Management in Foodservice Establishments)

Abstract

:
In the food service industry, food is wasted at every stage of the process. A significant part of food wastage is the so-called plate waste, i.e., food left by the consumer on the plate. The purpose of this research was to analyze the behavior of Polish consumers in relation to meals ordered in food establishments. The following issues were taken into account: leaving an unfinished meal on a plate and reasons for it, taking an unfinished meal home, and ordering half portions. The study was conducted on a representative group of 1115 adult Polish citizens using the CAPI method. Segmentation (cluster analysis) of respondents differing in their behavior in relation to ordered meals was carried out. It turned out that about 53% of Polish citizens do not use food services at all. Men with secondary and higher levels of education and other sources of income (cluster C) less frequently declared leaving unfinished meals on a plate and taking an unfinished meal home, especially in canteens, compared to other clusters. Few respondents declared buying half portions. Excessively large portions and inadequate taste of dishes were indicated by almost 50% of respondents as the main reasons for the generation of plate waste. Measures should be promoted to encourage consumers and food service providers to reduce the generation of plate waste.

1. Introduction

The food service industry in Poland and around the world has grown rapidly in recent years, which is related to the increasing willingness of consumers to pay for food services. According to data of the Polish Central Statistical Office [1], in 2014–2019, revenues from food service activities increased by over 80%. This rate was halted by the COVID-19 pandemic [2]. However, it should be assumed that after the end of the pandemic, the situation in the food service market will stabilize and return to the dynamic pre-2020 development. The perspectives for developing food service businesses in Poland until 2035 are promising [3]. Rapid economic growth can affect consumption levels, purchasing power, and eating patterns [4]. Moreover, due to the changes in lifestyle caused by high professional workload and participation in various leisure activities, people are deviating from traditional home eating. Spending on eating out and hotels, especially in households of one or two persons, is steadily growing [3]. Considering the projected growth of the food service industry and the shift in consumption from homes to food service establishments, the volume of generated and food waste is expected to increase in this sector [5,6,7,8]. The food service industry will face many challenges, including United Nations Sustainable Development Goals (UNSDG) [9]. Therefore, it is essential to understand the basic risk factors affecting food waste generation in the food service industry and to identify preventive measures that will reduce the amount of such wasted food.
As such, the question of the amount of food waste in the food service industry arises. The report “Preparatory study on food waste across EU 27” [10], which was developed mainly on the basis of Eurostat data and other national sources considering expert assessment, shows that in the year 2006, 27 countries of the EU wasted 89.3 million tons of food. The data in this report and other publications [11,12] indicated households as the most responsible for food waste. As a link in the food chain, the food service industry is responsible for about 12–14% of food waste, i.e., 10.5–12.3 million tons of food [10,11]. Recent surveys conducted in Poland have proven that over 4.8 million tons of food are wasted in Poland every year. The results obtained indicate that the most significant amount of food (60%) is wasted by consumers in households. According to the estimates, the Polish food service industry was responsible for 1.17% of food waste in the entire food chain. However, the authors of the surveys emphasized that in some links of the food chain, such as the transport or food service industry, the estimates may be incomplete, due to problems with collecting primary data [13]. Filimonau and De Coteau [14] emphasized that despite the large scale of food waste in the food services sector, this problem still draws little and insufficient attention from researchers.
Studies show that the problem of food waste in the food service industry is a global one and affects the whole world [15,16,17,18]. Cerrah and Yigitoglu [19] emphasized that food establishments cannot survive without creating food waste, and it can be generated at every step, from product receipt to consumption. Both Polish [20,21] and international publications show that in the food service industry, including hospital catering [22,23,24,25] or school canteens [26], a significant part of food wasted is the so-called plate waste, i.e., food not eaten by the consumer and left on the plate (consumption waste). Tomaszewska et al. [20] estimated that in the four Polish hotels investigated, on average, 72.55% of food wasted came from the serving department, i.e., the dining room buffet or as plate waste, weighed in the dishwashing room. A significant share of this value (48.82%) was constituted by plate waste left by consumers on their plates, and 23.73% was food left/not consumed by hotel guests on the breakfast buffet in the dining room. In the investigated facilities, an average of 0.046 kg was wasted from each breakfast portion offered to guests in the form of plate waste, which constituted 5.8% of its mass. The data on the food waste reported is inconsistent. Lonska et al. [27] revealed that the average weight of plate waste per schoolchild reached 0.178 kg, and the total weight of plate waste accounted for 28.75% of the total weight of food served. Some studies by other authors indicate a lower or higher share of plate waste in the structure of food waste. For example, Papargyropoulou et al. [28] showed that customer plate waste constituted 23–35% of the total. In contrast, Eriksson et al. [23] estimated that food waste consisted of 42% plate waste in Swedish hospitals, and Razalli [29] in Malaysian hospitals assessed the mean percentage of overall plate waste at 47.5%. Plate waste left by customers at the restaurants surveyed by Silvennoinen et al. [30] ranged from 4% to 8%. The mass of plate waste generated is correlated with the type of food service provided. For example, the largest share of plate waste is observed after meals served at a self-service buffet compared to waiter service [31].
However, these are usually observations made in the food service establishments or reported by the employees. It is essential to learn the opinion of consumers at different types of food service establishments on the reasons for generating plate waste. To plan appropriate measures, it is also important to define the profile of consumers who are most likely to use food service establishments.
To fill this gap, a consumer survey was planned to determine: (1) the frequency of using food service establishments, (2) the reasons for plate waste, and (3) the handling of unfinished meals. The authors believe that the results of this study provide an excellent foundation for further analysis in this field.
The following research hypotheses were formulated in this work:
Hypothesis 1 (H1):
Polish consumers still relatively and rarely use food service establishments, and this frequency is primarily determined by the respondents’ professional activity and education level.
Hypothesis 2 (H2):
The frequency of leaving plate waste varies according to the type of food service establishment used by the respondents.
Hypothesis 3a (H3a):
Individual characteristics of the respondents regarding professional activity, age, and level of education significantly affect the their behavior in terms of plate waste.
Hypothesis 3b (H3b):
Professionally active and educated respondents less often leave and take plate waste home.
Hypothesis 4a (H4a):
Respondents leave unfinished meals in food service establishments due to overly large portions.
Hypothesis 4b (H4b):
The reasons for leaving unfinished meals in food service establishments also depend on the individual characteristics of the respondents.

2. Materials and Methods

2.1. Data Collection
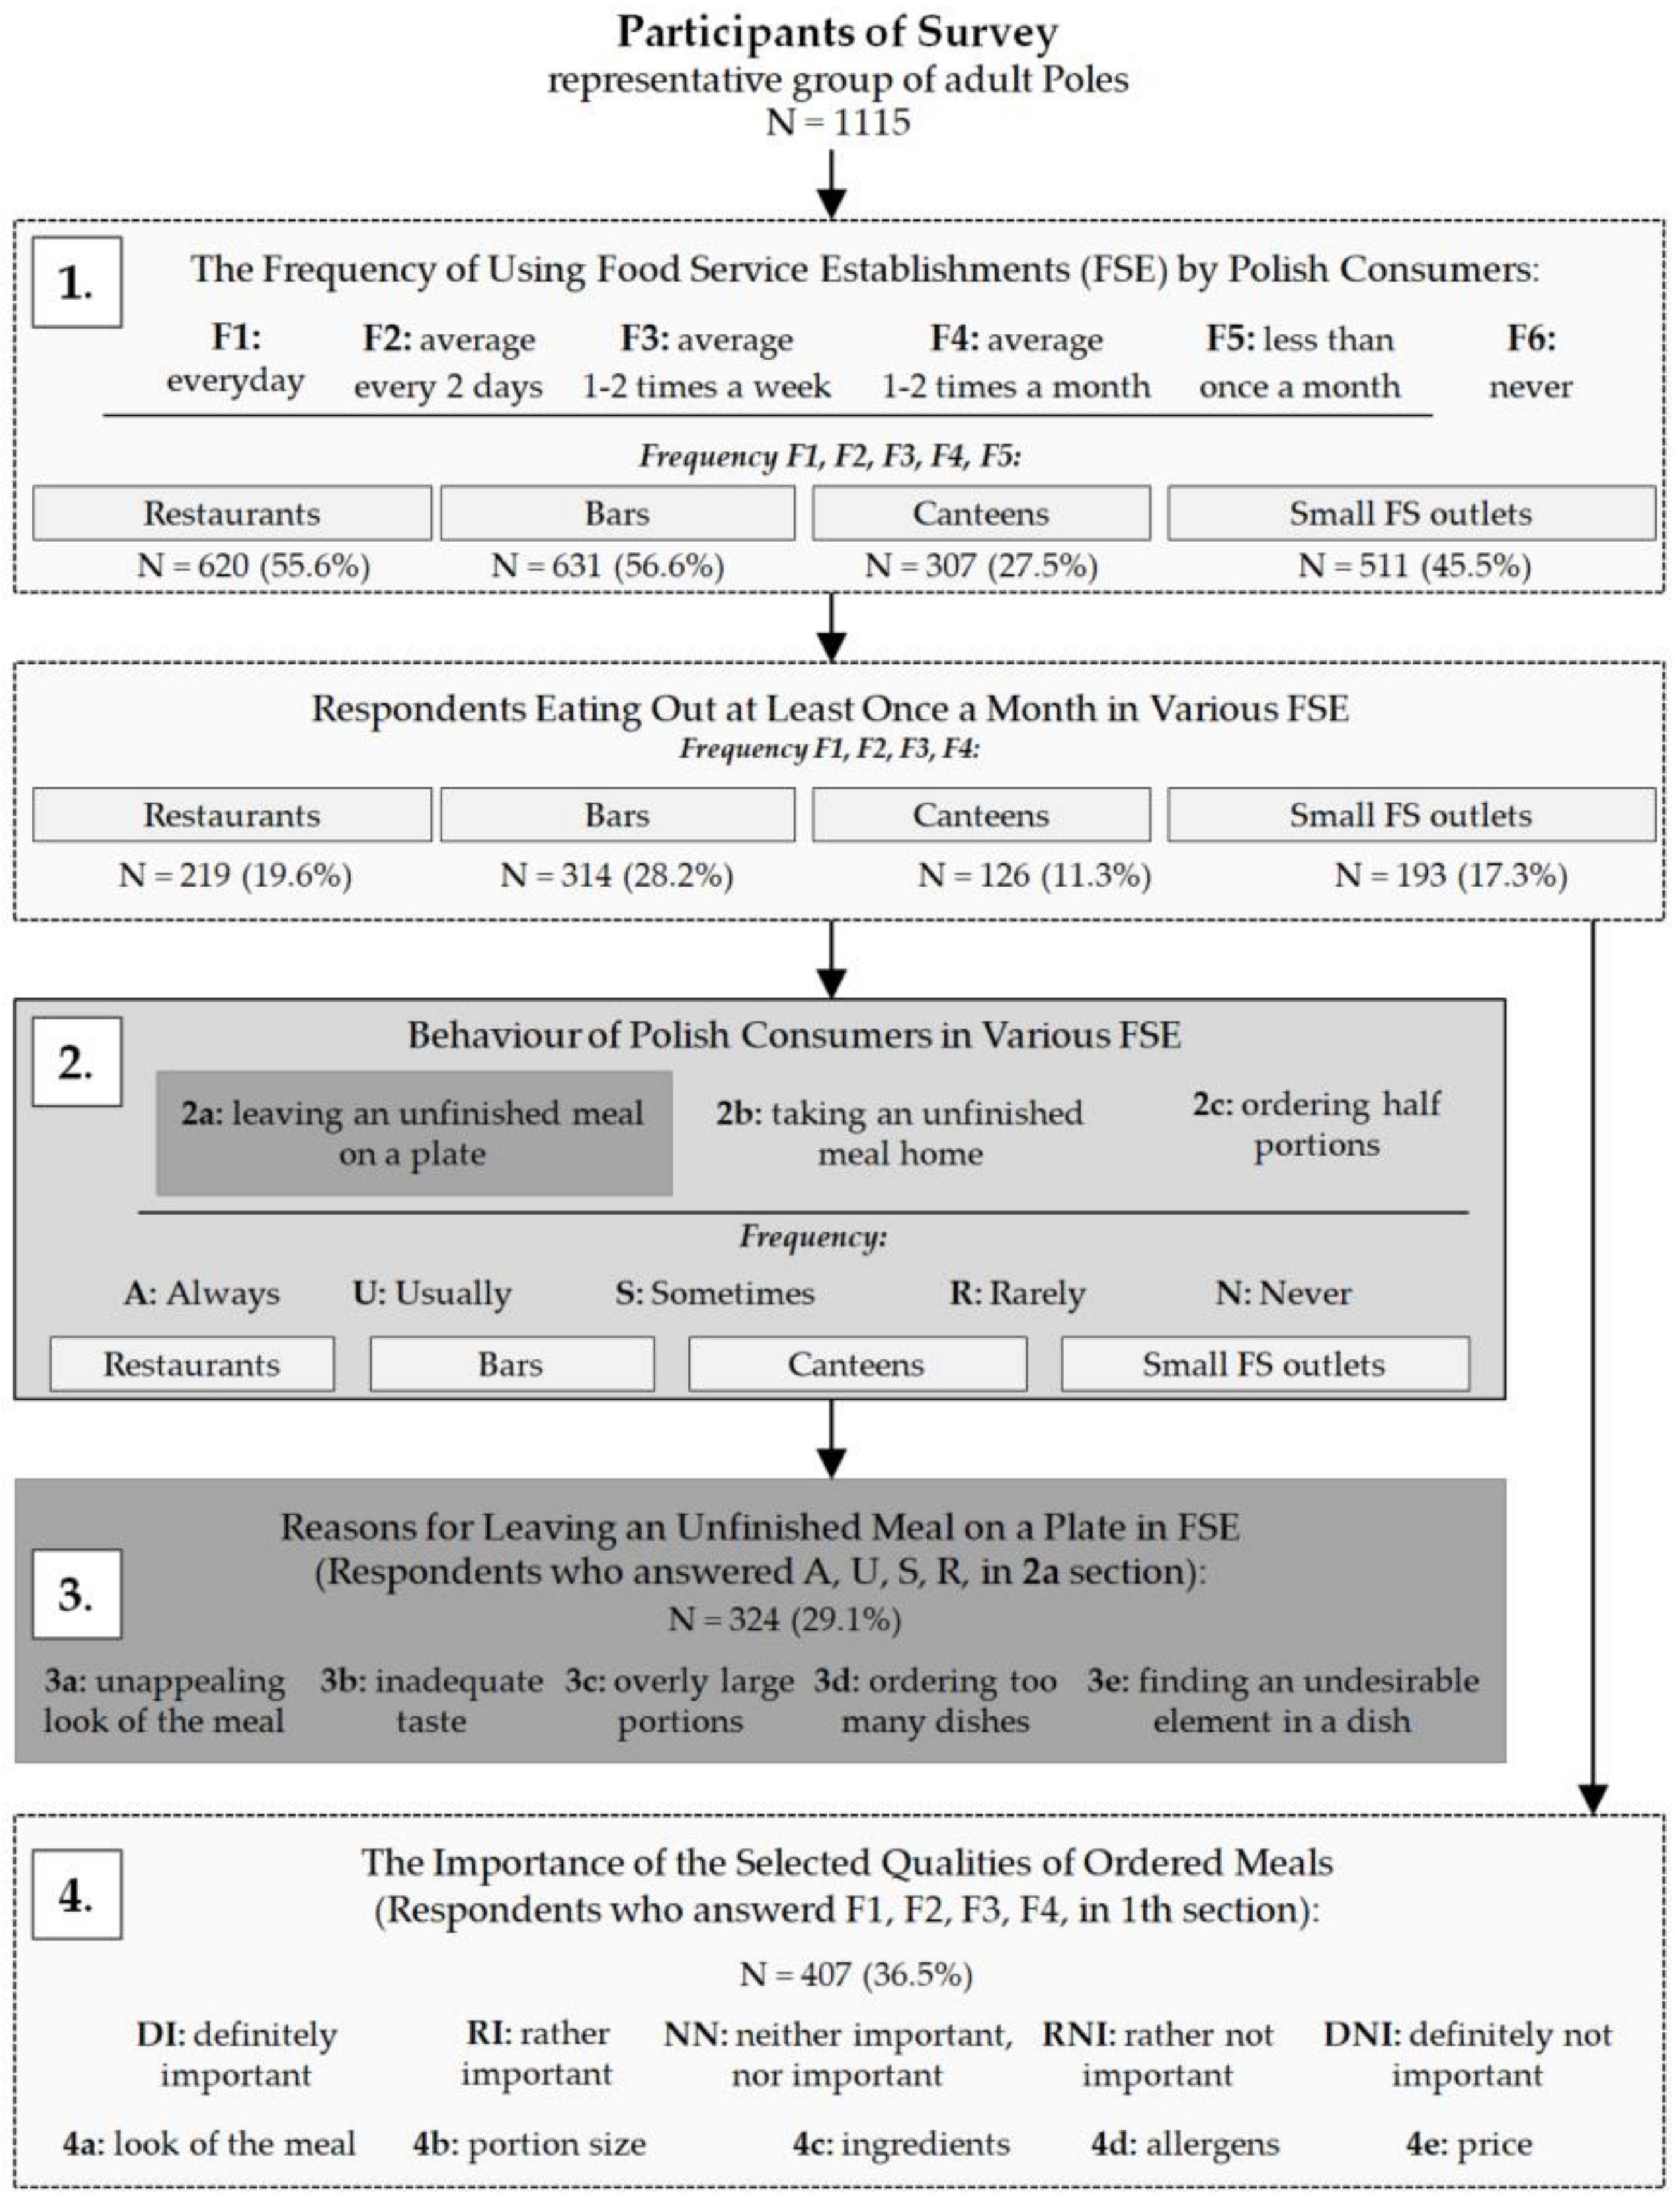
The survey was conducted in February and March 2019 on a nationwide random quota-based group of 1115 adult respondents. The sample was selected from the National Official Register of the Territorial Division (TERYT) kept by the Central Statistical Office. It was a representative sample of the general population of adult Poles (aged 18+) in terms of gender, age, and size of place of residence.
In the first phase of the sample selection, territorial stratification of the population was made, taking into account 16 voivodeships and 6 city-size classes, i.e., (1) villages, (2) cities of up to 50,000, (3) cities from 50,000 to 100,000, (4) cities from 100,000 to 200,000, (5) cities from 200,000 to 500,000, and (6) cities of over 500,000 residents. Then, the appropriate number of cities was randomly selected from the six classes of cities.
In the second phase of the sample selection (after territorial stratification), the required number of addresses was randomly selected in the selected cities and municipalities. In the last sample-selection phase, demographic characteristics (gender and age) were matched for each city class, taking into account the voivodeship. The respondents were selected using the so-called random-route method—a fixed address path with a randomized starting point. The interviewer went to the starting address, and if it was impossible to interview the respondent at the randomly selected starting address, he proceeded to the next designated household. This kind of sample-selection procedure ensures that any research is representative and the structure of the sample in terms of gender, age, place of residence, or voivodeship does not differ significantly from the entire population.
The survey was conducted using the CAPI (computer-assisted personal interview) method. The results of the interviews were analyzed. The interviews were verified using the CATI (computer-assisted telephone interviewing) method. The purpose of the follow-up interview was to confirm the interview and the verity of the respondent’s selection.
Before the actual research, a pilot study was carried out involving 30 respondents. All concerns/problems raised by the respondents were discussed and addressed in the questionnaire. Trained interviewers conducted the interview with the use of the revised questionnaire.
Table 1 presents the sociodemographic characteristics of the respondents. A comparable number of men and women took part in the actual study. Respondents aged 35–44 were the smallest group in terms of age. On the other hand, people aged 45–59 and over 60 accounted for slightly more than half of the studied population. People with secondary education were the largest group of respondents. Fewer than one in five respondents declared having higher education. A majority of the respondents were employed or self-employed.

2.2. Questionnaire

The questionnaire consisted of two parts. The first part contained 6 questions regarding the frequency of using food services, taking into account the type of establishment (restaurants, bars, canteens, small food service outlets) (question 1), the frequency of particular actions regarding ordered meals for each of the four types of establishments (questions 2–4), reasons for not eating the whole meal (question 5), and the significance of the selected characteristics of the ordered meals (question 6). Responses to the question about the frequency of using food services were: every day (F1), average every 2 days (F2), average 1–2 times a week (F3), average 1–2 times a month (F4), less than once a month (F5), and never (F6). In the questions concerning the behavior with regard to the ordered meals, a 5-point scale was used with the extreme choices “always” and “never,” whereas in the question concerning the significance of individual characteristics of the ordered meals, a “definitely important” to ”definitely not important” scale was used. In the case of question 6, multiple-choice answers were offered.
Four types of food service establishments were considered in the study, in line with the classification adopted by the Central Statistical Office, i.e., restaurants, bars, canteens, and small food service outlets. According to the Central Statistical Office (GUS) definition [32]: (1) a restaurant is a food service establishment available to the general public, with full waiter service, offering a wide and varied range of dishes and drinks, served to consumers according to a menu; (2) a bar is a food service establishment operating similarly to a restaurant, with an assortment limited to popular dishes and goods; (3) a canteen is a mass food service establishment that provides certain groups of consumers with meals (mainly lunch), but also breakfast and dinner; (4) a small food service outlet is a food service establishment offering limited services, such as fish and chips, a pump room, ice cream parlour, cinema, and stadium food court, etc.
All respondents answered the question about the frequency of using food services, depending on the type of establishment (N = 1115). However, to obtain reliable data for further analyses, respondents who did not use the food service industry at all or used them occasionally, i.e., less frequently than once a month, were excluded from the subsequent part of the study.
The arrangement of questions with the percentage of respondents answering subsequent questions and the adopted method of labeling questions and answers used in discussing the results are presented in Figure 1.
The second section of the questionnaire contained questions concerning the respondents’ demographic information, i.e., gender, age, and place of residence, which characterized those surveyed.

2.3. Statistical Analysis

For the interpretation of significant statistical correlations, in the case of questions based on quantitative and qualitative scales, the values of the percentage of responses of a given category of answers and a comparison of the respondent segments were used.
Moreover, to check the correlation between the frequency of leaving unfinished meals (2a) and reasons for doing so (3a–e), Spearman coefficients of correlation were calculated [33].
The additional purpose of the analysis was the segmentation of respondents differing in their behavior toward meals ordered in food service establishments in the context of plate waste. For this purpose, a multivariate cluster analysis method was used. Cluster analysis uses a group of multivariate techniques whose primary purpose is to group objects [34]. Its aim is to divide a set of data into groups of similar characteristics [35]. Ward’s hierarchical method was used to create clusters with Euclidean distances [36]. Homogeneous clusters of respondents were determined based on the average level of the arithmetic mean value and the fraction index values. The clusters were determined based on distances of bonding from the bonding stages. Four clusters were determined. The cluster analysis was supplemented with examination of the significant differences between the average level of each element (constituting the multidimensional criterion of cluster formation) in selected clusters. The null hypothesis of equality of the mean value/fraction index (calculated for each cluster) was verified with the Fisher–Snedecor test, while the post hoc analysis was performed with the least significant difference (LSD) test. This enabled the identification of homogeneous groups of arithmetic means. This verification was performed at a significance level of α = 0.05.
All tests were done using Statistica software version 12.1 PL (StatSoft, Cracow, Poland).

3. Results

3.1. Frequency of Using Food Services by Polish Consumers

Results regarding the frequency of using four types of food service establishments by Polish consumers are presented in Table 2. It turned out that about half of Polish citizens do not use food services at all (F6: 43.41–72.47%) and about one-third do so less than once a month (F5: 16.23–35.96%). Consumers indicated canteens as food service establishments that they did not use (three-fourths of indications). The use of restaurants, bars, canteens, and small food service outlets at least once or twice per month (F4) was declared by 12.91%, 18.30%, 4.74%, 9.78% of the respondents, respectively. Analyzing the percentage of people using food services at least once or twice a week (F3), it was found that Polish consumers most often use bars on a weekly basis (8.2%). Only 0.27% of respondents declared that they used the services of restaurants, bars, or small food service outlets every day, and a little more, 0.81%, said they used the canteens.

3.2. Behavior of Polish Consumers in Relation to Ordered Meals

When analyzing the behavior of Polish consumers in terms of the meals ordered, the following issues were taken into account: leaving an unfinished meal on a plate (2a), taking an unfinished meal home (2b), and ordering half portions (2c). The results regarding the frequency of the behaviors above are presented in Table 3.
It was found that more than half of the respondents using food services at least once a month (F1–F4) declared that they “rarely” (R) or “never” (N) left an unfinished meal on a plate. This answer was given by 62.10% of the consumers eating out in bars, 54.40% eating out in small food service outlets, and 51% eating out in restaurants and canteens. On the other hand, 12.69% of canteen customers, 10.96% of restaurant customers, 9.84% of small food service outlet customers, and 5.74% of bar customers reported that they “always” (A) and “usually” (U) left their meal unfinished. Approximately 1/3 of the respondents, regardless of the type of food service establishment, declared that they “sometimes” (S) left their meal unfinished.
It was found that consumers were even less likely to take an unfinished meal home than to leave it on a plate (Table 3). Most often, the answer “rarely” and “never” was given by customers of bars (70.06%), followed by small food service outlets (67.87%), canteens (63.49%), and restaurants (58.90%). Approximately 1/5 of the respondents who ate out in bars, canteens, and small food service outlets and 1/3 who ate out in restaurants did it “sometimes.” Only 1/6 of canteen customers declared that they “always” or “usually” took their unfinished meals home. The percentages were even lower for customers of restaurants and small food service outlets (1 in 10 respondents) and bars (7.32%).
Since most of the respondents who eat out in food service establishments at least once a month happened to leave an unfinished meal, although with varying frequency (“always”–“rarely”), they were asked about ordering half portions. It was found that this practice was never (“N”) or rarely (“R”) used. This answer was given by: 77.07% of the consumers eating out in bars, 68.91% eating out in small food service outlets, 64.84% eating out in restaurants, and 63.49% eating out in canteens (Table 3). Almost 13% of canteen customers, 9.85% of small food service outlets customers, 8.22% of restaurant customers, and 5.73% of bar customers declared ordering half portions with the frequency of “always” (A) and “usually” (U). Approximately 1/4 of the respondents, regardless of the type of food service establishment, declared ordering half portions “sometimes” (S).

3.3. Reasons for Leaving Unfinished Meals in Food Service Establishments

Respondents who declared that they “always”, “usually”, “sometimes”, and “rarely” left unfinished meals in restaurants, bars, canteens, or small food service outlets were asked about the reasons for such behavior. Almost half of the respondents stated that it was due to overly large portions and inadequate taste (Table 4). About 1/5 of the consumers stated that they did not finish their meal in a food service establishment because they found an undesirable element in a dish or ordered too many dishes. About 1/6 of the respondents indicated an unappealing look as the reason for the unfinished meal.
Calculated Spearman correlation coefficients showed that Polish respondents reporting an increasing frequency of leaving unfinished meals in bars and small food service outlets often pointed to unappealing looks as a reason (Table 5). Although a weak correlation, it was nonetheless a significant one. There was no correlation between the declared frequency of leaving unfinished meals and the other reasons for this phenomenon, including overly large portions of meals.

3.4. Significance of the Characteristics of Ordered Meals in the Opinion of the Respondents

In the opinion of the respondents in the study, price and portion size were definitely/rather important (DI/RI) aspects (almost 85% of responses) (Table 6). The ingredients and look of the meal turned out to be slightly less important for consumers (about 80% of answers). Allergen content was indicated as the least important aspect of the meal.

3.5. Sociodemographic Characteristics of Isolated Clusters

Following the answers provided by the respondents and their analysis, four clusters were identified. The characteristics of the selected clusters are presented in Table 7. It was found that 9.9% of respondents were not classified in any of the four identified clusters. The largest cluster was B, composed mainly of young men with secondary education and a part of the labor force. In cluster A, the majority were women aged 45–59 with secondary, elementary, and vocational education who were also a part of the labor force (employed and self-employed). The smallest was cluster C, which consisted only of men aged, mainly over 60 years old with high education and unemployed. The last cluster, D, however, consisted mainly of older females with a low level of education and unemployed.

3.6. Elements of Behavioral Characteristics of the Identified Clusters

Based on an analysis of the clusters, it was found that the four clusters (A, B, C, and D) did not differ significantly in responses on such issues as frequency of using the canteens (1: canteens), leaving unfinished meals in food service establishments because of their unappealing look (3a), overly large portions (3c), finding an undesirable element in a dish (3e), or importance of meal qualities, such as portion size (4b), ingredients (4c), or allergens (4d) (Table 8).
However, it was found that the four clusters differed significantly in 19 of the 26 analyzed situations (Table 8).
Persons classified in the largest cluster, B, i.e., mainly young men (up to 34 years old) with secondary education and working professionally, often responded similarly to those in cluster A, i.e., mostly women between 45 and 59 years old with elementary and secondary education and also a part of the labor force (Table 9). These clusters showed a similar frequency of eating out in restaurants, bars, and small food service outlets. It was noted that clusters B and A (as well as cluster C) had lower averages for this part of the questionnaire (No. 1) than respondents classified in cluster D, i.e., mainly older women (up to 60 years old) with a low level of education and low professional activity. This indicates that the respondents classified in this group, i.e., employed persons (clusters A and B), more often use the services of restaurants, bars, and small food service outlets than older respondents with a low level of professional activity. It was noted that most respondents from cluster D did not use food services at all (arithmetic mean about 5.5).
In the second section of the questionnaire (2a–c), persons classified in cluster C, i.e., only educated men with other sources of income more often than other clusters (A, B, D) declared that they ”rarely”/”never” left an unfinished meal on a plate in four food service establishments (arithmetic mean from 4.32 to 4.70), so they “rarely”/”never” took an unfinished meal from a restaurant or canteen home, and they “never” (arithmetic mean from 4.68 to 5.00) ordered half portions of meals in the types of food service establishments analyzed (Table 8). Additionally, in the case of issues raised in this part of the questionnaire, respondents from clusters B and A responded similarly (thus creating a homogeneous group). Compared to cluster C, they more often declared leaving an unfinished meal on a plate, regardless of the type of food service establishment (2a), or taking an unfinished meal home in the case of restaurants, bars, and small food service outlets (2b) or ordering half portions in restaurants, bars, and small food service outlets (2c). Taking into account the arithmetic mean, in the second part of the questionnaire, it was noted that uneducated older respondents with a low level of professional activity from cluster D declared most often leaving an unfinished meal on the plate, taking an unfinished meal home, and ordering half portions, regardless of the type of food service establishment.
In the third section of the questionnaire (3a–e), concerning the reasons for not eating the whole meal in food service establishments, it was noticed that uneducated older respondents with other sources of income (cluster D) more rarely, compared to other clusters, indicated inadequate taste as a reason for leaving an unfinished meal on the plate. The persons included in this cluster, as rarely as the respondents in clusters A and C, declared that the unfinished meal resulted from ordering too many dishes (3d). This reason, i.e., ordering many dishes, was more often declared by professionally active young men (cluster B).
Based on the values presented in the last section of Table 8 (4a–e), it can be seen that the percentage of respondents who considered the look of the meal (4a) and price (4e) an essential factor of the ordered dishes in clusters A, B, C was lower than cluster D.

4. Discussion

It was found that the proportion of respondents using food services regularly in the period just before the COVID-19 pandemic was small. Only about 11% of respondents declared eating out in various food service establishments once or twice a month (most preferred bars), about 6% once or twice a week, and only about 1.5% every 2 days. Therefore, the first part of hypothesis 1, concerning the rare use of food service establishments by Polish consumers, was confirmed. In the report “HoReCa market in Poland in 2019,” 45% of respondents declared eating out in 2018 much more often than the previous year, and 42% noted no change in this regard [37]. In another study carried out in Poland during the SARS-CoV-2 pandemic [38], the majority of respondents (95%) indicated that before the pandemic, they usually used food services once a month, once every 2–3 months, or rarely. It should be noted that although the survey included 1021 adult respondents, the sample was not representative of Poland, and the survey was conducted online. The authors’ research conducted on a representative sample was the first of its kind in Poland. On the other hand, Trafialek et al. [35] reported that a comparable percentage (less than 50%) of Polish and Lithuanian respondents (600 participants each) declared using food services less frequently than once a week. Compared to the United Kingdom, according to a survey conducted in the first half of 2020, i.e., during the COVID-19 pandemic, slightly over 45% of respondents declared that they ate out in restaurants at least once a month [39], and an even greater percentage (55%) ate out in quick-service restaurants offering such food as burgers or pizza [39]. Also, studies conducted in India indicated that 4 out of 10 respondents ate out more than four times a month [40]. In the United States, more than 50% of adult consumers reported eating out three or more times a week [41]. Such consumption patterns are common in high-income societies and cities, especially in Western Europe, the US, and Australia [42].
Furthermore, the second part of hypothesis 1, regarding the influence of professional activity and level of education on the frequency of using food service establishments, was confirmed. It was found that respondents from cluster A (professionally active, mainly women), cluster B (professionally active, particularly men up to 44 years old), and cluster C (educated men, mostly over 44 years old with other sources of income) more often used the services of restaurants, bars, and small food service outlets than respondents from cluster D (uneducated older respondents with other sources of income). Czarniecka-Skubina et al. [38] found that use varied based on education level. People with primary and vocational education chose fast food establishments significantly more often. People with secondary education usually choose pizzerias, kebab establishments, cafés, and bars. On the other hand, people with higher education chose canteens and restaurants significantly more often. The gender of the Polish respondents did not matter in this regard.
It was found that more than half of respondents using food services at least once a month declared that they “rarely” or “never” left an unfinished meal on a plate. About 1 in 10 respondents “always” and “usually” left their meal unfinished on a plate, regardless of the type of food service establishment. Therefore, hypothesis H2, concerning the frequency of leaving plate waste according to the type of food establishment, was not confirmed. It should be assumed that the frequency of leaving unfinished meals on the plate is similar, but varies in amount. Compared to waiter service, the largest share of plate waste is observed after meals served at a self-service buffet [31].
Many studies [42,43,44,45] have shown that younger consumers waste significantly more food than other age-groups. In the case of leaving plate waste in food service establishments, the group of respondents who declared that they “sometimes” (mean = 3.1) left unfinished meals was cluster D, mainly consisting of uneducated older women (above 60 years old) with other sources of income. Respondents from cluster B, dominated by young consumers (18–34 years old), mainly men, declared much less frequency of leaving food on plates, i.e., “rarely” (mean = 3.7). In a study conducted by Cerrah and Yigitoglu [19] in Turkey, it was also found that participants in the 26–35 age-group left significantly less plate waste than those in the 36–45 age-group. Melbye et al. [46] found a negative correlation between age and plate waste. Therefore, in the case of food on plates in food service establishments, it can be assumed that younger consumers left less plate waste than older ones.
However, considering all four clusters (A, B, C, D) in terms of leaving food on the plate, it can be stated that much more impact on this issue was exerted by level of education and respondents’ gender. Men primarily aged 60 + with a high level of education and unemployed (cluster C) were the respondents that declared the lowest frequency of leaving plate waste in every type of food establishment (mean = 4.5). Therefore, hypotheses H3a and H3b were confirmed. Numerous studies have confirmed that women generate more plate waste than men [19,47,48]. Research by Cerrah and Yigitoglu [19] suggested that women cannot consume as much food as men, due to their physical structure. On the other hand, observations of Secondi et al. [49] showed that women appear to be more aware of food wasting than men.
A study by Lorenz et al. [50] suggested that leaving unfinished meals is generally determined by situational variables and behavioral intentions. With regard to situational factors, taste perception plays a vital role in leaving unfinished food on a plate. Behavioral intentions are largely determined by the individual’s standards and attitudes that determine consumers’ intentions regarding food-waste prevention. According to Siriexs et al. [51], doggy bags are a useful tool for increasing food-waste awareness. The present study showed that few respondents took their unfinished meals with them. This behavior was more common among older women with elementary education (cluster D). Mirosa et al. [52] stated that taking leftovers from food service establishments is a product of various barriers and benefits that influence consumer behavior. As practical and moral reasons, Hamerman et al. [53] listed the suitability of leftovers for consumption and care for the natural environment. One of the barriers could be the feeling of shame associated with asking for the possibility of taking the unfinished meal home [51]. As noted by several researchers, an important aspect in taking leftovers home turned out to be the company with whom the meal is consumed. If the consumer eats a dish with people they are trying to impress, they assume that taking an unfinished meal home is embarrassing and violates social norms [53,54,55]. On the other hand, if the dish is eaten with people with whom the consumer feels comfortable, they would gladly take the unfinished meal home [53].
Almost half of the respondents indicated huge portions and inadequate dish taste as reasons for not finishing the food. A small percentage of respondents indicated other reasons, such as unappealing look of the meal, ordering too many dishes, or finding undesirable elements in a dish. Therefore, hypothesis H4a was confirmed. However, it should be noted that the answers provided were differentiated among four clusters only in the case of inadequate taste and ordering too many dishes. Hence, the H4b hypothesis H4b was partially supported. It was noticed that uneducated older respondents (mainly women) with other sources of income (cluster D) more rarely indicated inadequate taste as a reason for leaving unfinished meals on plates than other clusters.
As noted by many researchers, the quality of meals served in food service establishments is the most critical factor determining consumer satisfaction [56,57,58,59,60]. According to survey results, one significant cause of food waste in food service establishments was inadequate taste, which was below the consumers’ expectations. This observation was confirmed by many other studies [50,61,62]. Customers are often unaware of food ingredients, which can lead to ordering dishes that will be left unfinished. One of the methods of minimizing this may be advising customers on the ingredients, unusual foods, or offering a tasting menu [63]. Another solution might be to introduce some flexibility in the menu, allowing customers to combine main courses with different side dishes [64].
Overly large portions of dishes were not differentiated among the four clusters. Many authors have stressed that one of the key factors determining food waste in the food service industry is the excess in portions compared to consumer preferences [10,65,66,67,68,69], and recommended reducing them [66,67,68,69] or offering varied portion sizes [70]. Meanwhile, in the United States, portion sizes have grown over time, with restaurants and other food-selling services promoting large portions as a selling feature, even though many customers leave part of their meal uneaten [71]. At the same time, it was found that ordering half portions is a rare or nonexistent behavior.
In the opinion of respondents participating in the study, the most important aspect of a meal was the price, which has been confirmed in many studies [72,73,74,75,76].

Limitations, Further Research, and Practical Implications

One of the limitations of this study is that the respondents declared the behavior related to leaving plate waste in food service establishments, which means that it may be subjective. In particular, the frequency of leaving unfinished meals might have been misjudged by the respondents. In the future, a different additional measurement method should be used to confront the respondents’ declarations with their actual behavior. Future research should be designed to allow respondents to learn the motivations for preventing food waste in food service establishments and understand their reluctance to take plate waste home. This publication provides new practical lessons for both restaurant management and consumers. Managers can improve their understanding of why and how often consumers leave unfinished meals, which will allow them to design their menus better. On the other hand, consumers can expand their knowledge on the subject and change their behavior to prevent food waste in the food service industry.

5. Conclusions

This is the first study to explore the behavior of Polish consumers in terms of meals ordered in different types of food service establishments in the context of plate waste. It was found that a small part of Polish society uses food services regularly. It was identified that young and middle-aged professionally active respondents (cluster A and B) and well-educated, older men (cluster C) more often used the services of restaurants, bars, and small food service outlets than older respondents, especially women, with a low level of professional activity (cluster D).
The problem of leaving plate waste was nevertheless confirmed in this study, although to a small extent. It was noted that young and middle-aged professionally active respondents declared leaving unfinished meals on the plate more often than well-educated, older men. At the same time, it is worrying that only a few Polish respondents declared taking unfinished meals home. Therefore, much more attention should be paid to initiatives aimed at both owners and managers of food service establishments and consumers, especially professionally active respondents, to promote taking unfinished meals home. Considering the material in which unfinished meals are most often packed, i.e., disposable plastic containers, it should also be possible for the consumers to take unfinished meals home in their containers (reusable glass or plastic containers). Considering the growing interest in environmental protection among Polish society, it seems to be a valid proposition worth promoting.
Although almost half of the respondents stated that they left unfinished meals in food service establishments due to overly large portions and inadequate taste, calculated coefficient correlations showed that respondents reporting an increasing frequency of leaving unfinished meals in bars and small food service outlets more often pointed to an unappealing appearance as a reason for this. It is a piece of valuable information for owners and managers of food service establishments. On the one hand, it is essential to train employees of food service establishments to improve their qualifications, and on the other hand, it would be a good idea to present the dish, for example, as a photo in the menu card.
It turned out that ordering half portions is also a rare practice among Polish respondents. This could result from the organization of production or the sales system, but also consumers’ attitudes. Bearing in mind the reduction in plate waste, this aspect should also be taken into account, especially since meal price is one of the most important aspects of meals ordered in food service establishments.
As noted in the Introduction, perspectives on developing food service businesses in Poland are very promising. The sector’s share of generated food waste is expected to increase. Taking into consideration the Sustainable Development Goals (SDG), it is imperative to implement preventive measures as soon as possible. Further research is needed to evaluate other aspects of generated plate waste in food service establishments.

Author Contributions

Conceptualization, M.T. and B.B.; methodology, B.B. and M.T., validation, D.K.-K., M.T. and B.B.; formal analysis, M.T. and B.B.; data curation, B.B. and M.T.; writing—original draft preparation, M.T.; writing—review and editing, M.T. and B.B.; supervision, D.K.-K. All authors have read and agreed to the published version of the manuscript.

Funding

This publication was developed under a contract with the National Center for Research and Development No. Gospostrateg1/385753/1/NCBR/2018 for carrying out and funding of a project implemented as part of the “The social and economic development of Poland in the conditions of globalizing markets—GOSPOSTRATEG” program called “Developing a system for monitoring wasted food and an effective program to rationalize losses and reduce food wastage” (acronym PROM).

Institutional Review Board Statement

Not applicable.

Informed Consent Statement

Not applicable.

Data Availability Statement

Not applicable.

Conflicts of Interest

The authors declare no conflict of interest. The funders had no role in the design of the study, the collection, analyses, or interpretation of data, the writing of the manuscript, or in the decision to publish the results.

References

  1. GUS. 2021 Przychody z Działalności Gastronomicznej. Available online: https://bdl.stat.gov.pl/BDL/dane/podgrup/tablica (accessed on 25 October 2021).
  2. Tarnawa, Ł.; Peterlik, M. Raport Branżowy. Analizy Sektorowe. 12 Kwietnia 2021. Działalność Usługowa Związana z Wyżywieniem (PKD 56). Available online: https://www.bosbank.pl/__data/assets/pdf_file/0028/34957/BOSBank_Restauracje_2021.04.pdf (accessed on 25 October 2021).
  3. Gheribi, E. Perspektywy rozwoju przedsiębiorstw gastronomicznych na polskim rynku. Studia Ekonomiczne. Zesz. Nauk. Uniw. Ekon. Katowicach 2018, 255, 102–112. [Google Scholar]
  4. Zang, J.; Luo, B.; Wang, Y.; Zhu, Z.; Wang, Z.; He, X.; Wang, W.; Guo, Y.; Chen, X.; Wang, C.; et al. Eating Out-of-Home in Adult Residents in Shanghai and the Nutritional Differences among Dining Places. Nutrients 2018, 10, 951. [Google Scholar] [CrossRef] [Green Version]
  5. Pirani, S.I.; Arafat, H.A. Reduction of food waste generation in the hospitality industry. J. Clean. Prod. 2016, 132, 129–145. [Google Scholar] [CrossRef]
  6. Goh, E.; Jie, F. To waste or not to waste: Exploring motivational factors of Generation Z hospitality employees towards food wastage in the hospitality industry. Int. J. Hosp. Manag. 2019, 80, 126–135. [Google Scholar] [CrossRef]
  7. Consumi. Coldiretti, 6 Italiani Su 10 Tagliano Sprechi Nel 2016. Available online: https://www.coldiretti.it/economia/consumi-coldiretti-6-italiani-su-10-tagliano-sprechi-nel-2016 (accessed on 25 October 2021).
  8. Lang, L.; Wang, Y.; Chen, X.; Zhang, Z.; Yang, N.; Xue, B.; Han, W. Awareness of food waste recycling in restaurants: Evidence from China. Resour. Conserv. Recycl. 2020, 161, 104949. [Google Scholar] [CrossRef]
  9. United Nations (UN). Transforming Our World: The 2030 Agenda for Sustainable Development. Available online: https://sustainabledevelopment.un.org/content/documents/21252030%20Agenda%20for%20Sustainable%20Development%20web.pdf (accessed on 27 May 2022).
  10. Monier, V.; Mudgal, S.; Escalon, V.; O’Connor, C.; Gibon, T.; Anderson, G.; Morton, G. Preparatory Study on Food Waste Across EU 27. Final Report; BIO Intelligence Service: Brussels, Belgium, 2010; Available online: https://ec.europa.eu/environment/eussd/pdf/bio_foodwaste_report.pdf (accessed on 25 August 2021).
  11. Stenmarck, Å.; Jensen, C.; Quested, T.; Moates, G. Estimates of European Food Waste Levels; Report of the Project FUSIONS Granted by the European Commission (FP7); IVL Swedish Environmental Research Institute: Stockholm, Sweden, 2016; Available online: https://www.eu-fusions.org/phocadownload/Publications/Estimates%20of%20European%20food%20waste%20levels.pdf (accessed on 5 May 2021).
  12. Parfitt, J.; Barthel, M.; Macnaughton, S. Food waste within food supply chains: Quantification and potential for change to 2050. Phil. Trans. R. Soc. B 2010, 365, 3065–3081. [Google Scholar] [CrossRef] [Green Version]
  13. Łaba, S.; Bilska, B.; Tomaszewska, M.; Łaba, R.; Szczepański, K.; Tul-Krzyszczuk, A.; Kosicka-Gębska, M.; Kołożyn-Krajewska, D. Próba oszacowania strat i marnotrawstwa żywności w Polsce. Przemysł Spożywczy 2020, 74, 10–18. [Google Scholar] [CrossRef]
  14. Filimonau, V.; De Coteau, D.A. Food waste management in hospitality operations: A critical review. Tour. Manag. 2019, 71, 234–245. [Google Scholar] [CrossRef]
  15. Okazaki, W.; Turn, S.; Flachsbart, P. Characterization of food waste generators: A Hawaii case study. Waste Manag. 2008, 28, 2483–2494. [Google Scholar] [CrossRef]
  16. Papargyropoulou, E.; Wright, N.; Lozano, R.; Steinberger, J.; Padfield, R.; Ujang, Z. Conceptual framework for the study of food waste generation and prevention in the hospitality sector. Waste Manag. 2016, 49, 326–336. [Google Scholar] [CrossRef]
  17. Erdogan, N.; Baris, E. Environmental protection programs and conservation practices of hotels in Ankara, Turkey. Tour. Manag. 2007, 28, 604–614. [Google Scholar] [CrossRef]
  18. Grandhi, B.; Singh, J.A. What a waste! A study of food wastage behaviour in Singapore. J. Food Prod. Mark. 2016, 22, 471–485. [Google Scholar] [CrossRef]
  19. Cerrah, S.; Yigitoglu, V. Determining the effective factors on restaurant customers’ plate waste. Int. J. Gastron. Food. Sci. 2022, 27, 100469. [Google Scholar] [CrossRef]
  20. Tomaszewska, M.; Bilska, B.; Kołożyn-Krajewska, D. Estimation of the scale of food waste in hotel food service—A case study. Sustainability 2021, 13, 421. [Google Scholar] [CrossRef]
  21. Tomaszewska, M.; Bilska, B.; Kołożyn-Krajewska, D. Food waste in catering establishments—An analysis of causes and consequences. Eur. J. Sustain. Dev. 2021, 10, 365–375. [Google Scholar] [CrossRef]
  22. Williams, P.G.; Walton, K. Plate waste in hospitals and strategies for change. e-SPEN Eur. e-J. Clin. Nutr. Metab. 2011, 6, 235–241. [Google Scholar] [CrossRef] [Green Version]
  23. Eriksson, M.; Malefors, C.; Bergström, P.; Eriksson, E.; Persson Osowski, C. Quantities and Quantification Methodologies of Food Waste in Swedish Hospitals. Sustainability 2020, 12, 3116. [Google Scholar] [CrossRef] [Green Version]
  24. Dias-Ferreira, C.; Santos, T.; Oliveira, V. Hospital food waste and environmental and economic indicators—A Portuguese case study. Waste Manag. 2015, 46, 146–154. [Google Scholar] [CrossRef]
  25. Barrington, V.; Maunder, K.; Kelaart, A. Engaging the patient: Improving dietary intake and meal experience through bedside terminal meal ordering for oncology patients. J. Hum. Nutr. Diet. 2018, 31, 803–809. [Google Scholar] [CrossRef]
  26. Favuzzi, N.; Trerotoli, P.; Forte, M.G.; Bartolomeo, N.; Serio, G.; Lagravinese, D.; Vino, F. Evaluation of an Alimentary Education Intervention on School Canteen Waste at a Primary School in Bari, Italy. Int. J. Environ. Res. Public Health 2020, 17, 2558. [Google Scholar] [CrossRef] [Green Version]
  27. Lonska, J.; Zvaigzne, A.; Kotane, I.; Silicka, I.; Litavniece, L.; Kodors, S.; Deksne, J.; Vonoga, A. Plate Waste in School Catering in Rezekne, Latvia. Sustainability 2022, 14, 4046. [Google Scholar] [CrossRef]
  28. Papargyropoulou, E.; Steinberger, J.K.; Wright, N.G.; Lozano, F.J.; Padfield, R.; Ujang, Z. Patterns and Causes of Food Waste in the Hospitality and Food Service Sector: Food Waste Prevention Insights from Malaysia. Sustainability 2019, 11, 6016. [Google Scholar] [CrossRef] [Green Version]
  29. Razalli, N.H.; Cheah, C.F.; Mohammad, N.M.A.; Manaf, Z.A. Plate waste study among hospitalised patients receiving texture-modified diet. Nutr. Res. Pract. 2021, 15, 655–671. [Google Scholar] [CrossRef]
  30. Silvennoinen, K.; Katajajuuri, J.M.; Hartikainen, H.; Jalkanen, L.; Koivupuro, H.K.; Reinikainen, A. Food waste volume and composition in the finnish supply chain: Special focus on food, service sector. In Proceedings of the Fourth International Symposium on Energy from Biomass and Waste, Venice, Italy, 12–15 November 2012. [Google Scholar]
  31. Priefer, C.; Jörissen, J.; Bräutigam, K.R. Food waste prevention in Europe—A cause-driven approach to identify the most relevant leverage points for action. Resour. Conserv. Recycl. 2016, 109, 155–165. [Google Scholar] [CrossRef]
  32. GUS. 2021 Pojęcia Stosowane w Statystyce Publicznej. Available online: https://bdl.stat.gov.pl/BDL/metadane/metryka/1476 (accessed on 25 October 2021).
  33. Sobczyk, M. Statystyka; Wydawnictwo Naukowe PWN: Warsaw, Poland, 2022. [Google Scholar]
  34. Hennig, C.; Meila, M.; Murtagh, F.; Rocci, R. Handbook of Cluster Analysis; CRC Press: Boca Raton, FL, USA, 2015. [Google Scholar]
  35. Trafialek, J.; Czarniecka-Skubina, E.; Kulaitiené, J.; Vaitkevičiene, N. Restaurant’s Multidimensional Evaluation Concerning Food Quality, Service, and Sustainable Practices: A Cross-National Case Study of Poland and Lithuania. Sustainability 2020, 12, 234. [Google Scholar] [CrossRef] [Green Version]
  36. Stanisz, A. Przystępny Kurs Statystyki z Wykorzystaniem Programu STATISTICA PL na Przykładach z Medycyny.T.3; Statsoft: Cracow, Poland, 2007. [Google Scholar]
  37. Szałas, K.; Hossa Trwa. Raport 2019—Rynek Gastronomiczny w Polsce. Nowości Gastronomiczne i Sweets & Coffee. pp. 5–6. Available online: https://issuu.com/brogmarketing/docs/rynek_gastronomiczny_w_polsce_-_rap_564b9e2fb2165e (accessed on 25 October 2021).
  38. Czarniecka-Skubina, E.; Pielak, M.; Sałek, P.; Głuchowski, A.; Kobus-Cisowska, J.; Owczarek, T. Use of Food Services by Consumers in the SARS-CoV-2 Pandemic. How the Eating Habits of Consumers Changed in View of the New Disease Risk Factors? Nutrients 2021, 13, 2760. [Google Scholar] [CrossRef]
  39. Lock, S. Frequency of Eating at Restaurants with Table Service in the UK 2020, by Age Group. How often Do You Eat at a Restaurant with Table Service? Available online: https://www.statista.com/statistics/1135418/eating-at-full-service-restaurants-frequency-by-age-united-kingdom/#statisticContainer (accessed on 25 October 2021).
  40. Khan, W.; Ansari, S.A.; Siddiquei, M.I. Determinants of consumers frequency of eating out: Implication for the restaurant business in India. Int. J. Serv. Econ. Manag. 2021, in press. [Google Scholar] [CrossRef]
  41. Kant, A.K.; Whitley, M.I.; Graubard, B.I. Away from home meals: Associations with biomarkers of chronic disease and dietary intake in American adults, NHANES 2005–2010. Int. J. Obes. 2015, 39, 820–827. [Google Scholar] [CrossRef] [Green Version]
  42. Janssen, H.G.; Davies, I.G.; Richardson, L.D.; Stevenson, L. Determinants of takeaway and fast food consumption: A narrative review. Nutr. Res. Rev. 2018, 31, 16–34. [Google Scholar] [CrossRef]
  43. Jörissen, J.; Priefer, C.; Bräutigam, K.-R. Food Waste Generation at Household Level: Results of a Survey among Employees of Two European Research Centers in Italy and Germany. Sustainability 2015, 7, 2695–2715. [Google Scholar] [CrossRef] [Green Version]
  44. Stancu, V.; Haugaard, P.; Lähteenmäki, L. Determinants of consumer food waste behaviour: Two routes to food waste. Appetite 2016, 96, 7–17. [Google Scholar] [CrossRef] [PubMed]
  45. Hanssena, O.J.; Syversen, F.; Stø, E. Edible food waste from Norwegian households—Detailed food waste composition analysis among households in two different regions in Norway. Resour. Conserv. Recycl. 2016, 109, 146–154. [Google Scholar] [CrossRef]
  46. Melbye, E.L.; Onozaka, Y.; Hansen, H. Throwing it all away: Exploring affluent consumers’ attitudes toward wasting edible food. J. Food Prod. Market. 2017, 23, 416–429. [Google Scholar] [CrossRef]
  47. Ilyasov, A.; Tekin, Ö.A. The food waste in five-star hotels: A study on Turkish guests attitudes. J. Tour. Gastron. 2017, 3, 13–31. [Google Scholar]
  48. Kuo, C.; Shih, Y. Gender differences in the effects of education and coercion on reducing buffet plate waste. J. Foodserv. Bus. Res. 2016, 19, 223–235. [Google Scholar] [CrossRef]
  49. Secondi, L.; Principato, L.; Laureti, T. Household food waste behaviour in EU-27 countries: A multilevel analysis. Food Policy 2015, 56, 25–40. [Google Scholar] [CrossRef]
  50. Lorenz, B.; Hartmann, M.; Hirsch, S.; Kanz, O.; Langen, N. Determinants of Plate Leftovers in One German Catering Company. Sustainability 2017, 9, 807. [Google Scholar] [CrossRef] [Green Version]
  51. Sirieix, L.; Lãla, J.; Kocmanovã, K. Understanding the antecedents of consumers’ attitudes towards doggy bags in restaurants: Concern about food waste, culture, norms and emotions. J. Retail. Consum. Serv. 2017, 34, 153–158. [Google Scholar] [CrossRef]
  52. Mirosa, M.; Munro, H.; Mangan-Walker, E.; Pearson, D. Reducing waste of food left on plates: Interventions based on means-end chain analysis of customers in foodservice sector. Br. Food J. 2016, 118, 2326–2343. [Google Scholar] [CrossRef]
  53. Hamerman, E.J.; Rudell, F.; Martins, C.M. Factors that predict taking restaurant leftovers: Strategies for reducing food waste. J Consum. Behav. 2018, 17, 94–104. [Google Scholar] [CrossRef]
  54. Dagiliūtė, R.; Musteikytė, A. Food waste generation: Restaurant data and consumer attitudes. Environ. Res. Eng. Manag. 2019, 75, 7–14. [Google Scholar] [CrossRef] [Green Version]
  55. Liao, C.; Hong, J.; Zhao, D.; Zhang, S.; Chen, C. Confucian culture as determinants of consumers’ food leftover generation: Evidence from Chengdu, China. Environ. Sci. Pollut. Res. 2018, 25, 14919–14933. [Google Scholar] [CrossRef]
  56. Alraub, A.S.A.; Alsaleem, A.S.M.; Daoud, A.A. Service quality and its impact on customer satisfaction tourist restaurants (a field study on the tourist restaurants/Amman). Interdiscip. J. Contemp. Res. Bus. 2012, 4, 364–368. [Google Scholar]
  57. Ha, J.; Jang, S.C.S. Effects of service quality and food quality: The moderating role of atmospherics in an ethnic restaurant segment. Int. J. Hosp. Manag. 2010, 29, 520–529. [Google Scholar] [CrossRef]
  58. Ryu, K.; Han, H. Influence of the quality of food, service, and physical environment on customer satisfaction and behavioral intention in quick-casual restaurants: Moderating role of perceived price. J. Hosp. Tour. Res. 2010, 34, 310–329. [Google Scholar] [CrossRef]
  59. Al-Tit, A.A. The Effect of Service and Food Quality on Customer Satisfaction and Hence Customer Retention. Asian Soc. Sci. 2015, 11, 23. [Google Scholar] [CrossRef]
  60. Namkung, Y.; Jang, S. Does food quality really matter in restaurants? Its impact on customer satisfaction and behavioral intentions. J. Hosp. Tour. Res. 2007, 31, 387–410. [Google Scholar] [CrossRef]
  61. Harnack, L.J.; French, S.A.; Oakes, J.M.; Story, M.T.; Jeffery, R.W.; Rydell, S.A. Effects of calorie labeling and value size pricing on fast food meal choices: Results from an experimental trial. Int. J. Behav. Nutr. Phys. Act. 2008, 5, 63. [Google Scholar] [CrossRef] [Green Version]
  62. WRAP. Food Waste in Schools; WRAP: Banbury, UK, 2011. [Google Scholar]
  63. Dolnicar, S.; Juvan, E. Drivers of plate waste: A mini theory of action based on staff observations. Ann. Tour. Res. 2019, 78. [Google Scholar]
  64. Neff, R.A.; Spiker, M.L.; Truant, P.L. Wasted food: US consumers’ reported awareness, attitudes, and behaviors. PLoS ONE 2015, 10, e0127881. [Google Scholar] [CrossRef] [Green Version]
  65. Kallbekken, S.; Saelen, H. Nudging hotel guests to reduce food waste as a win—Win environmental measure. Econ. Lett. 2013, 119, 325–327. [Google Scholar] [CrossRef]
  66. Betz, A.; Buchli, J.; Göbel, C.; Müller, C. Food waste in the Swiss food service industry—Magnitude and potential for reduction. Waste Manag. 2015, 35, 218–226. [Google Scholar] [CrossRef]
  67. Freedman, M.R.; Brochado, C. Reducing portion size reduces food intake and plate waste. Obesity 2010, 18, 1864–1866. [Google Scholar] [CrossRef]
  68. Lorenz, B.A.S.; Hartmann, M.; Langen, N. What makes people leave their food? The interaction of personal and situational factors leading to plate leftovers in canteens. Appetite 2017, 116, 45–56. [Google Scholar] [CrossRef]
  69. WWF. Hotel Kitchen: Fighting Food Waste in Hotels. 2017. Available online: https://www.worldwildlife.org/publications/hotel-kitchen-fighting-food-waste-in-hotels/ (accessed on 25 October 2021).
  70. Berkowitz, S.; Marquart, L.; Mykerezi, E.; Degeneffe, D.; Reicks, M. Reduced-portion entrées in a worksite and restaurant setting: Impact on food consumption and waste. Public Health Nutr. 2016, 19, 3048–3054. [Google Scholar] [CrossRef] [Green Version]
  71. Yahia, E.M.; Mourad, M. Food waste at the consumer level. In Preventing Food Losses and Waste to Achieve Food Security and Sustainability; Yahia, E.M., Ed.; Burleigh Dodds Science Publishing: Cambridge, UK, 2019; p. 10. [Google Scholar]
  72. Iglesias, M.; Guillen, M.J. Perceived quality and price: Their impact on the satisfaction of restaurant customers. Int. J. Contemp. Hosp. Manag. 2004, 16, 373–379. [Google Scholar] [CrossRef]
  73. Ladhari, R.; Brun, I.; Morales, M. Determinants of dining satisfaction and postdining behavioral intentions. Int. J. Hosp. Manag. 2008, 27, 563–573. [Google Scholar] [CrossRef]
  74. Teng, C.C.; Barrows, C.W. Service orientation: Antecedents, outcomes, and implications for hospitality research and practice. Serv. Ind. J. 2009, 29, 1413–1435. [Google Scholar] [CrossRef]
  75. Ha, J.; Jang, S. The effects of dining atmospherics on behavioral intentions through quality perception. J. Serv. Mark. 2012, 26, 204–215. [Google Scholar] [CrossRef]
  76. Cheng, C.C.; Chen, C.T.; Hsu, F.S.; Hu, H.Y. Enhancing service quality improvement strategies of fine-dining restaurants: New insights from integrating a two-phase decision-making model of IPGA and DEMATEL analysis. Int. J. Hosp. Manag. 2012, 31, 1155–1166. [Google Scholar] [CrossRef]
Figure 1. Scheme of questions included in the questionnaire.
Sustainability 14 08153 g001
Table 1. Sociodemographic characteristic of respondents (N = 1115).
VariableCharacteristics (Abbreviation)(N)(%)
GenderFemale (F)57051.1
Male (M)54548.9
Age18-34 years (A18-34)31428.1
35-44 years (A35-44)20818.7
45-59 years (A45-59)30427.3
60 years and above (A≥ 60)28925.9
Educationelementary, vocational (Ee)45040.3
secondary (Es)46842.0
Higher (Eh)19717.7
EmploymentEmployed or self-employed (EES)72064.6
Others (students, unemployed, housewife; pensioner/retiree, farmer) (EO)39535.4
Table 2. Frequency of using the four types of food service establishments by Polish consumers (N = 1115).
Type of
Establishment:
Frequency of Using the Services (%) 1
F1F2F3F4F5F6
Restaurants0.270.815.6512.9135.9644.39
Bars0.271.438.1618.3028.4343.41
Canteens0.811.973.774.7516.2372.47
Small food service outlets0.271.705.569.7828.5254.17
1 F1: everyday; F2: average every 2 days; F3: average 1–2 times a week; F4: average 1–2 times a month; F5: less than once a month; F6: never.
Table 3. Behavior of the respondents in regard to meals ordered, taking into account the type of food service establishment.
Behavior Type of Food Service
Establishment:
Respondents 1Frequency of Indications (%) 2
N%AUSRN
Leave an unfinished meal on a plate (2a)Restaurants2191000.9110.0537.9036.5314.61
Bars3141000.964.7832.1734.7127.39
Canteens1261000.7911.9035.7130.1621.43
Small food service outlets1931002.597.2535.7527.9826.42
Take an unfinished meal home (2b)Restaurants2191000.9110.0530.1421.0037.90
Bars3141001.276.0522.6121.0249.04
Canteens1261001.5914.2920.6321.4342.06
Small food service outlets1931003.116.7422.2824.3543.52
Order half portions (2c)Restaurants2191001.376.8526.9424.2040.64
Bars3141001.274.4617.2019.1157.96
Canteens1261000.0012.7023.8122.2241.27
Small food service outlets1931000.529.3321.2421.2447.67
1 Number of respondents eating out at least once a month in the given type of food service establishments (F1, F2, F3, F4 in Table 2). 2 A: always; U: usually; S: sometimes; R: rarely; N: never.
Table 4. Reasons for leaving unfinished meals in food service establishments (N = 324 *).
No.ReasonRespondents
N%
3aunappealing look5717.59
3binadequate taste15648.15
3coverly large portions16149.69
3dordering too many dishes6118.83
3efinding an undesirable element in a dish6419.75
* Number of respondents declaring leaving an unfinished meal on a plate (Table 3 (2a)) with the frequency always–rarely (A–R).
Table 5. Calculated Spearman rank correlation coefficients (r) between the frequency of leaving unfinished meals (2a) and reasons for doing so (3a–e).
Reasons for Leaving Unfinished MealsSpearman’s Rank Correlation Coefficients
RestaurantsBarsCanteensSmall Food
Service Outlets
3aunappealing look−0.134−0.135 *−0.064−0.219 *
3binadequate taste0.0890.0020.0780.061
3coverly large portions−0.0320.0370.014−0.071
3dordering too many dishes−0.0400.052−0.098−0.089
3efinding an undesirable element in a dish−0.0950.097−0.079−0.066
* p < 0.05.
Table 6. Significance of the characteristics of ordered meals in food service establishments (N = 407) 1.
No.VariableFrequency of Indications (%) 2
DIRINNRNIDNI
4alook of the meal39.0739.8013.026.391.72
4bportion size30.9653.0710.324.910.74
4cingredients40.0540.7913.514.421.23
4dallergens18.4327.0325.8020.648.11
4eprice43.7340.548.115.901.72
1 Number of respondents eating out at least once a month in the given type of food service establishments (F1, F2, F3, F4 in Table 2). 2 DI: definitely important; RI: rather important; NN: neither important nor unimportant; RNI: rather not important; DNI: definitely not important.
Table 7. Characteristics of the clusters.
ClusterN% Share of the Cluster in the Studied PopulationShare in the Cluster (%)
Gender (a)Age (b)Education (c)Employment (d)
A
professionally active, mainly women
32228.9 A18−34:28.9Ee:36.6
F:76.4A35−44:11.2Es:39.8EES:90.4
M:23.6A45−59:59.9Eh:23.6EO:9.6
A≥ 60:0
B
professionally active, mainly young men
36632.8 A18−34:54.1Ee:21.6
F:26A35−44:33.1Es:57.4EES:100
M:74A45−59:12.8Eh:21EO:0
A≥ 60:0
C
educated men with other sources of income
726.5 A18−34:16.7Ee:0
F:0A35−44:23.6Es:43.1EES:23.6
M:100A45−59:19.4Eh:56.9EO:76.4
A≥ 60:40.3
D
non-educated older respondents with other sources of income
24522.0 A18−34:0Ee:78.8
F:62.9A35−44:6.5Es:21.2EES:10.2
M:37.1A45−59:0Eh:0EO:89.8
A≥ 60:93.5
(a) F: female; M: male; (b) A18−34: 18–34 years old; A35−44: 35–44 years old; A45−59: 45–59 years old; A≥ 60: over 60 years old; (c) Ee: elementary, vocational; Es: secondary; Eh: higher; (d) EES: employed or self-employed; EO: others (students, unemployed, housewife; pensioner/retiree, farmer).
Table 8. Average frequency ** or arithmetic mean * for the identified clusters with results of the variance analysis and least significant difference (LSD) test.
No.Question (II)Cluster (I)p-Value
ABCD
Frequency of using the services *
1.Restaurants4.95 a4.94 a5.05 a5.49 b0.025
Bars4.79 a4.66 a4.84 a5.50 b0.022
Canteens5.455.355.435.550.520
Small food service outlets5.06 a5.06 a5.13 a5.51 b0.016
Frequency of leaving unfinished meal on plate *
2a.Restaurants3.43 b3.45 b4.32 c3.00 a0.000
Bars3.81 b3.95 b4.39 c2.88 a0.000
Canteens3.29 a3.74 b4.70 c3.25 a0.000
Small food service outlets3.53 ab3.82 b4.49 c3.27 a0.000
Frequency of taking an unfinished meal home *
2bRestaurants3.81 b3.90 b4.71 c2.92 a0.000
Bars4.07 b4.20 b4.12 b3.03 a0.005
Canteens3.29 a4.19 b5.00 c3.28 a0.000
Small food service outlets3.96 b4.18 b4.23 b3.04 a0.001
Frequency of ordering half portions *
2cRestaurants3.73 b4.11 b4.81 c2.65 a0.000
Bars4.18 b4.40 bc4.75 c2.69 a0.000
Canteens3.50 a4.34 b5.00 c3.21 a0.000
Small food service outlets3.89 ab4.26 bc4.68 c3.45 a0.002
Reasons for not eating the whole meal **
3aUnappealing look of the meal0.170.160.130.140.962
3bInadequate taste0.47 b0.47 b0.64 b0.20 a0.013
3cOverly large portions0.500.480.530.420.770
3dOrdering to many dishes0.15 ab0.24 b0.06 a0.08 a0.024
3eFinding an undesirable element in a dish0.190.240.260.280.876
The importance of the selected qualities *
4aLook of the meal1.92 a1.94 a1.56 a2.81 b0.000
4bPortion size2.021.831.712.030.072
4cIngredients1.941.901.532.200.152
4dAllergens2.692.842.502.630.524
4ePrice1.87 a1.78 a1.52 a2.44 b0.002
(I) Identical letters for arithmetic mean or frequency means that there were no significant differences between the clusters. (II) Direction of the scale: (1) frequency of using the services, from 1 “everyday” to 6 “never”; (2a–c) frequency of behavior from 1—“always” to 5—“never; (4a–e) the importance of the selected qualities from 1 “definitely important” to 5 “definitely not important.”
Table 9. Matrix showing the scale of similarity among the clusters (the cells show the number of cases in which a given cluster formed a homogeneous group with other clusters—LSD test).
Clusters
Clusters ABCD
Ax1695
B16x100
C910x1
D501x
Publisher’s Note: MDPI stays neutral with regard to jurisdictional claims in published maps and institutional affiliations.

