
Study of the Interaction between Yellow River Water and Groundwater in Henan Province, China

 ,
,
Abstract
:1. Introduction
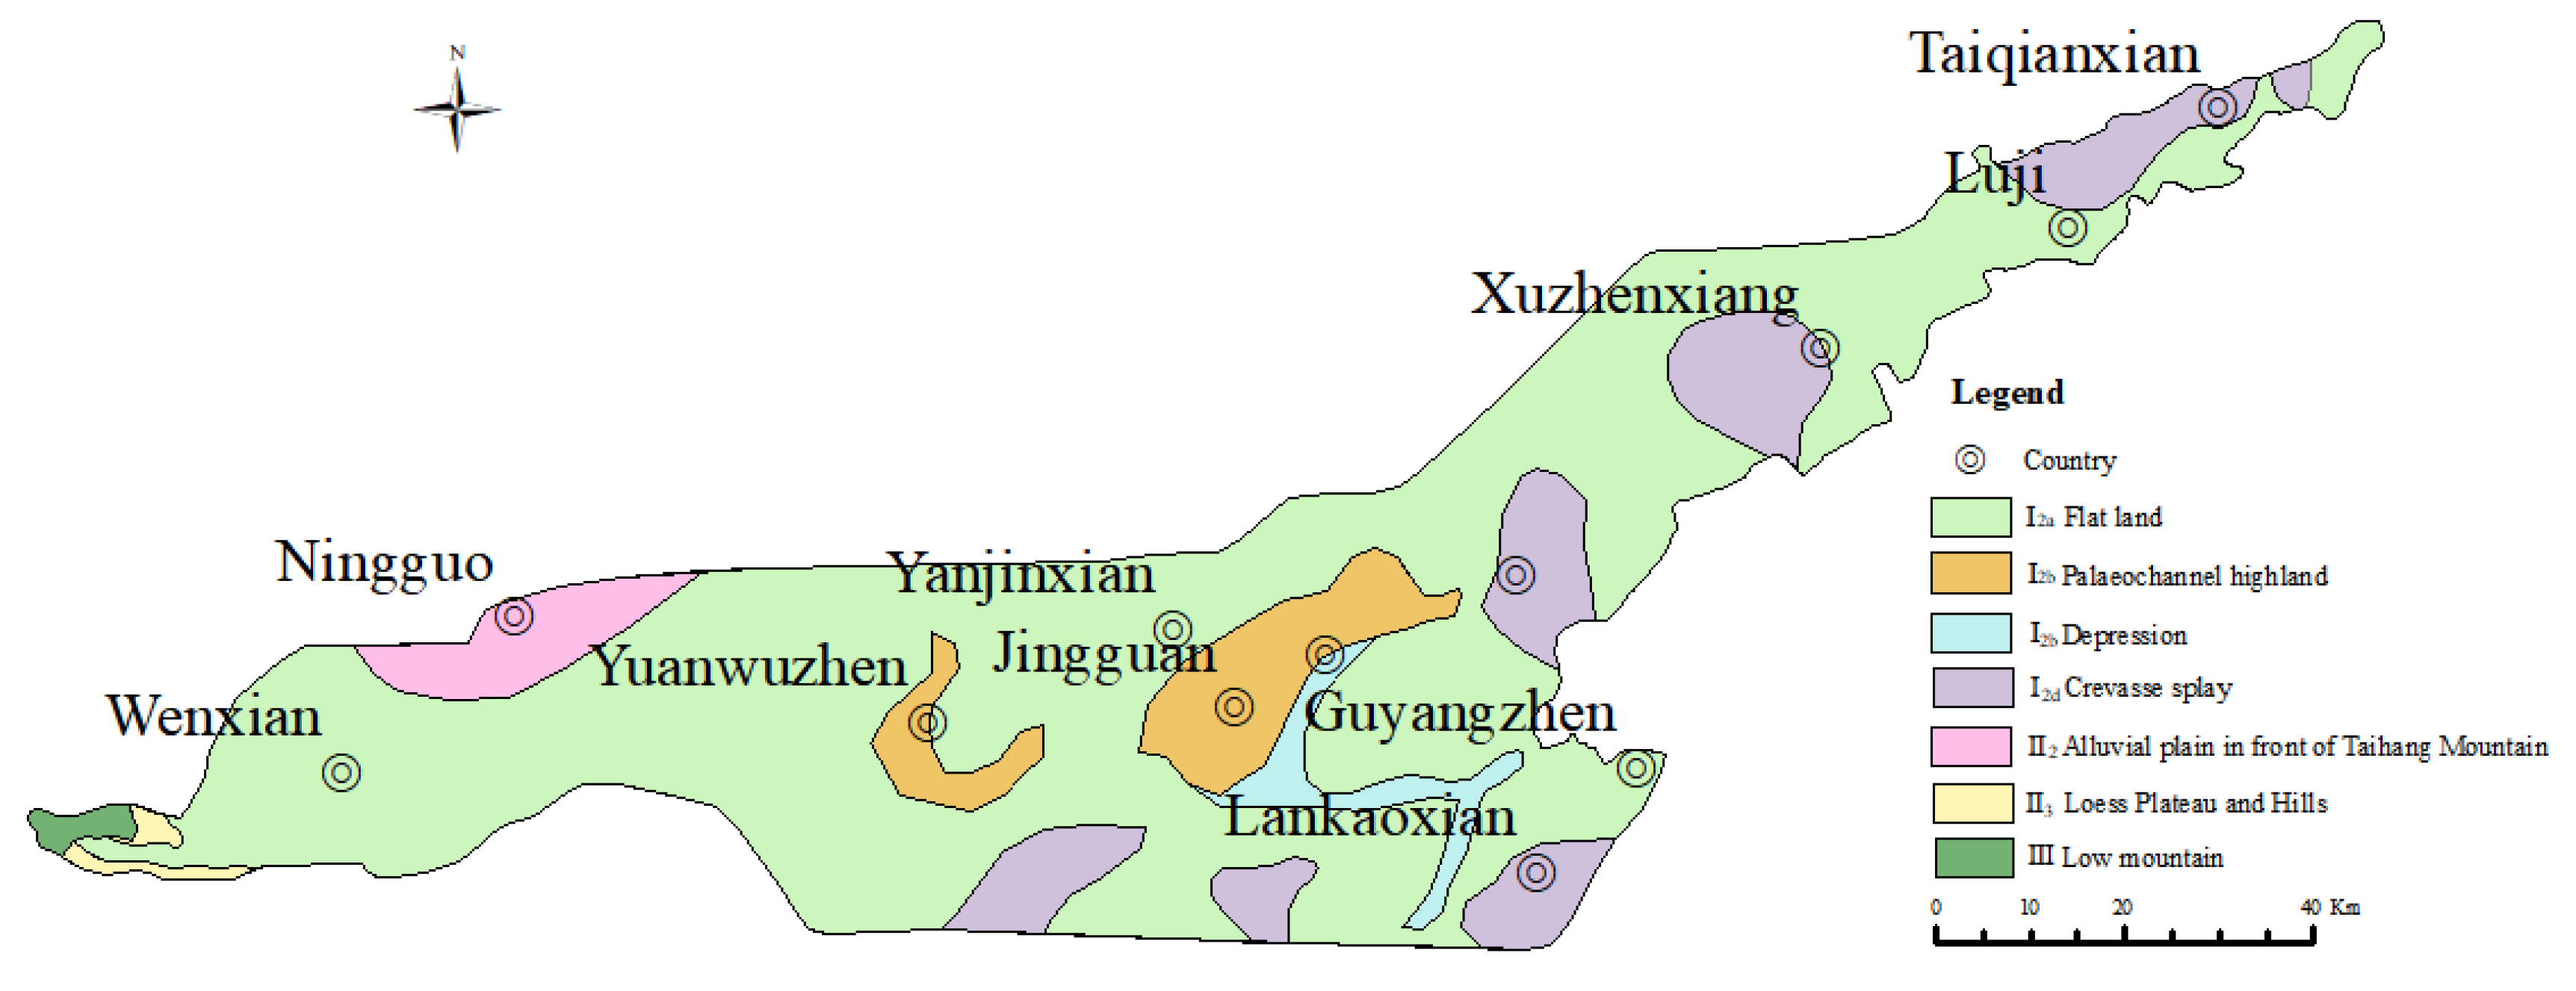
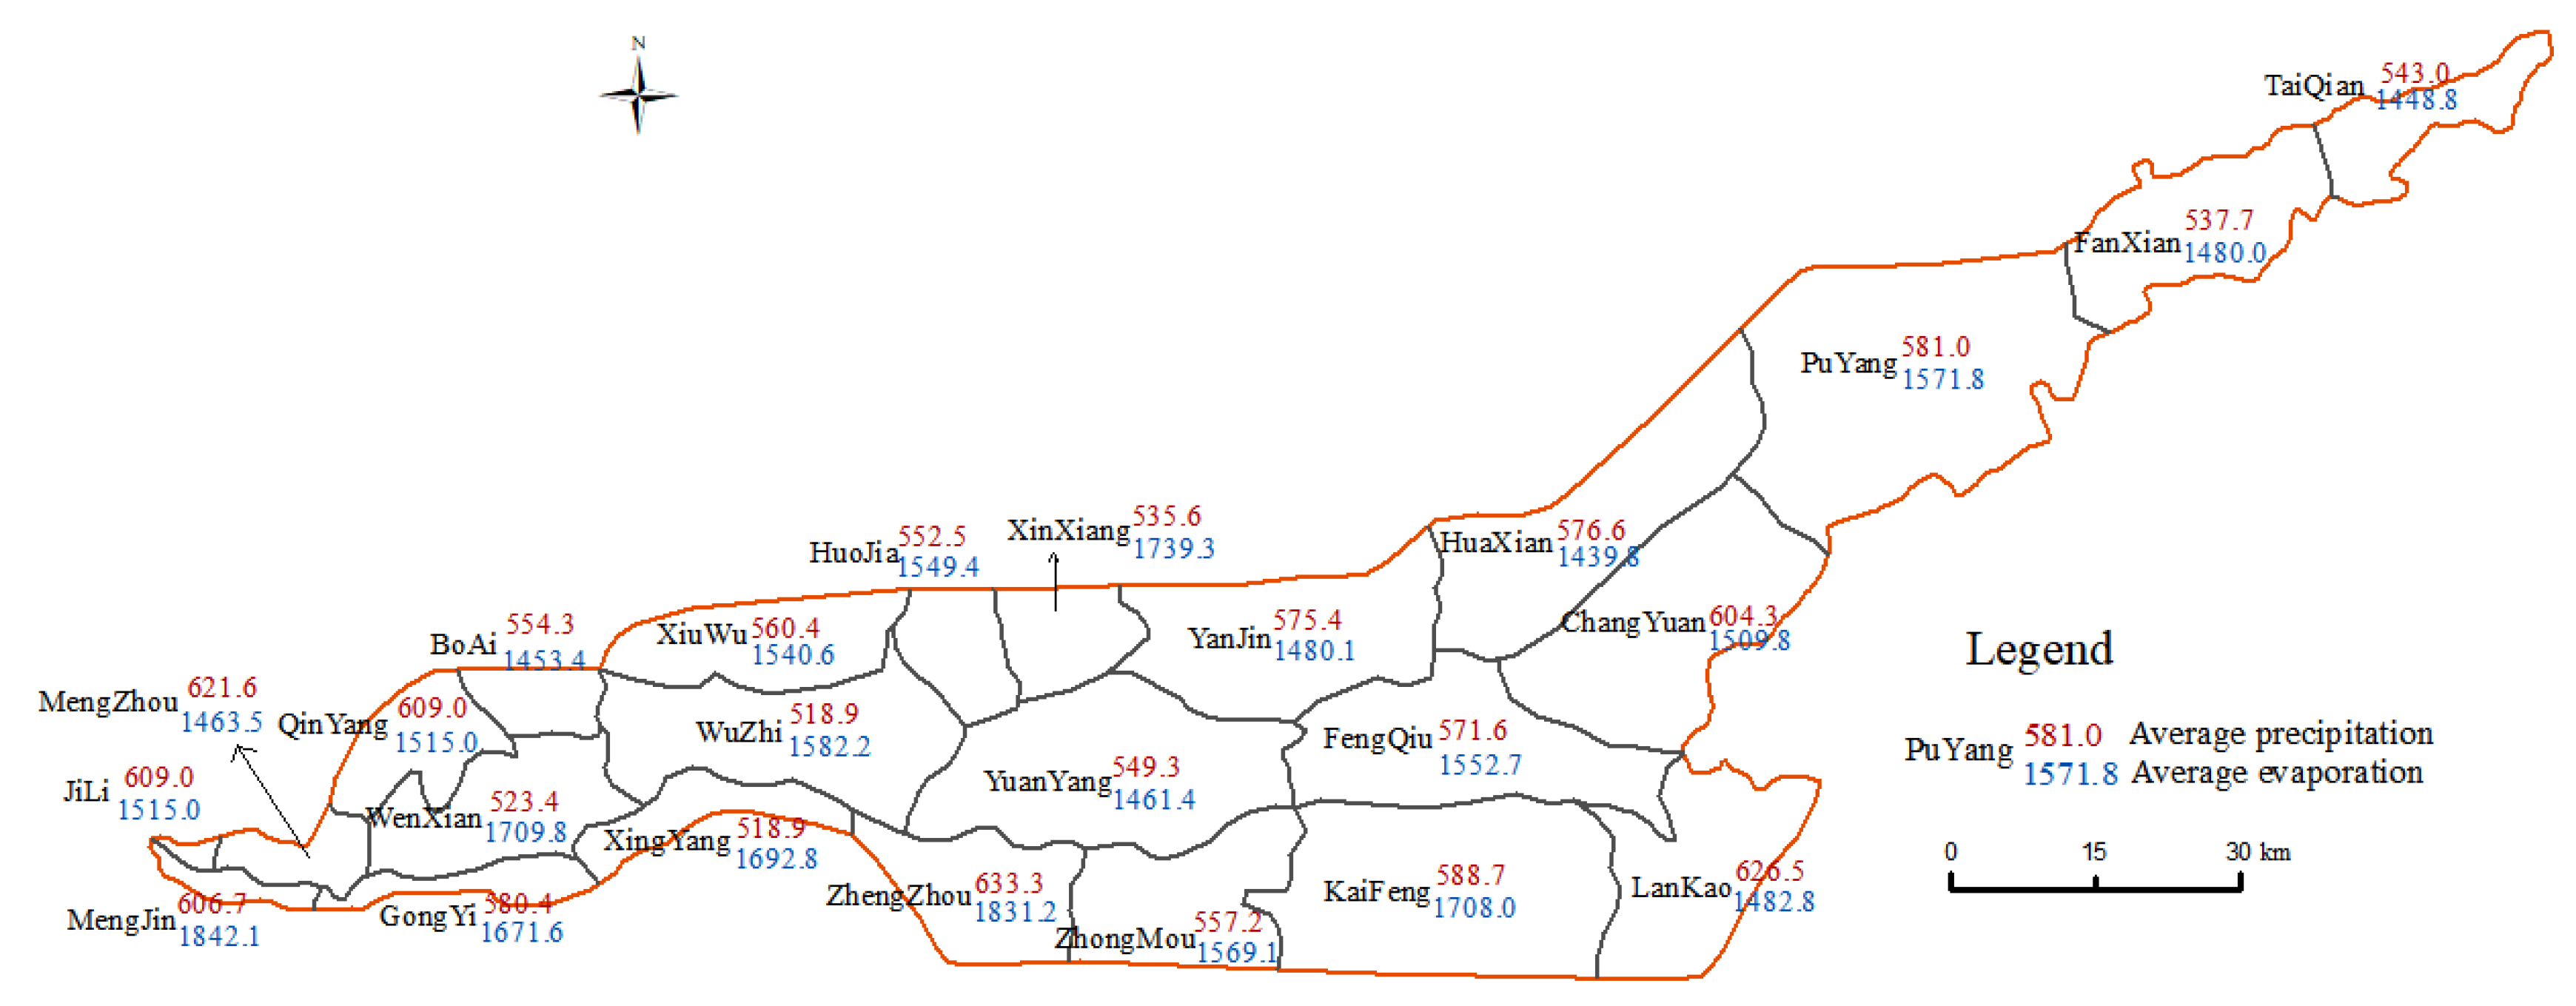
2. Study Area
3. Methods
3.1. Sample Collection and Testing
3.2. Environmental Isotopic Method
3.2.1. D and 18O Isotope Method
3.2.2. Tritium Isotope Method
3.2.3. Hydrochemical Method
3.3. Exchange Capacity of Yellow River Water and Groundwater
3.3.1. 18O Mass-Conservation Model
3.3.2. Darcy’s Law
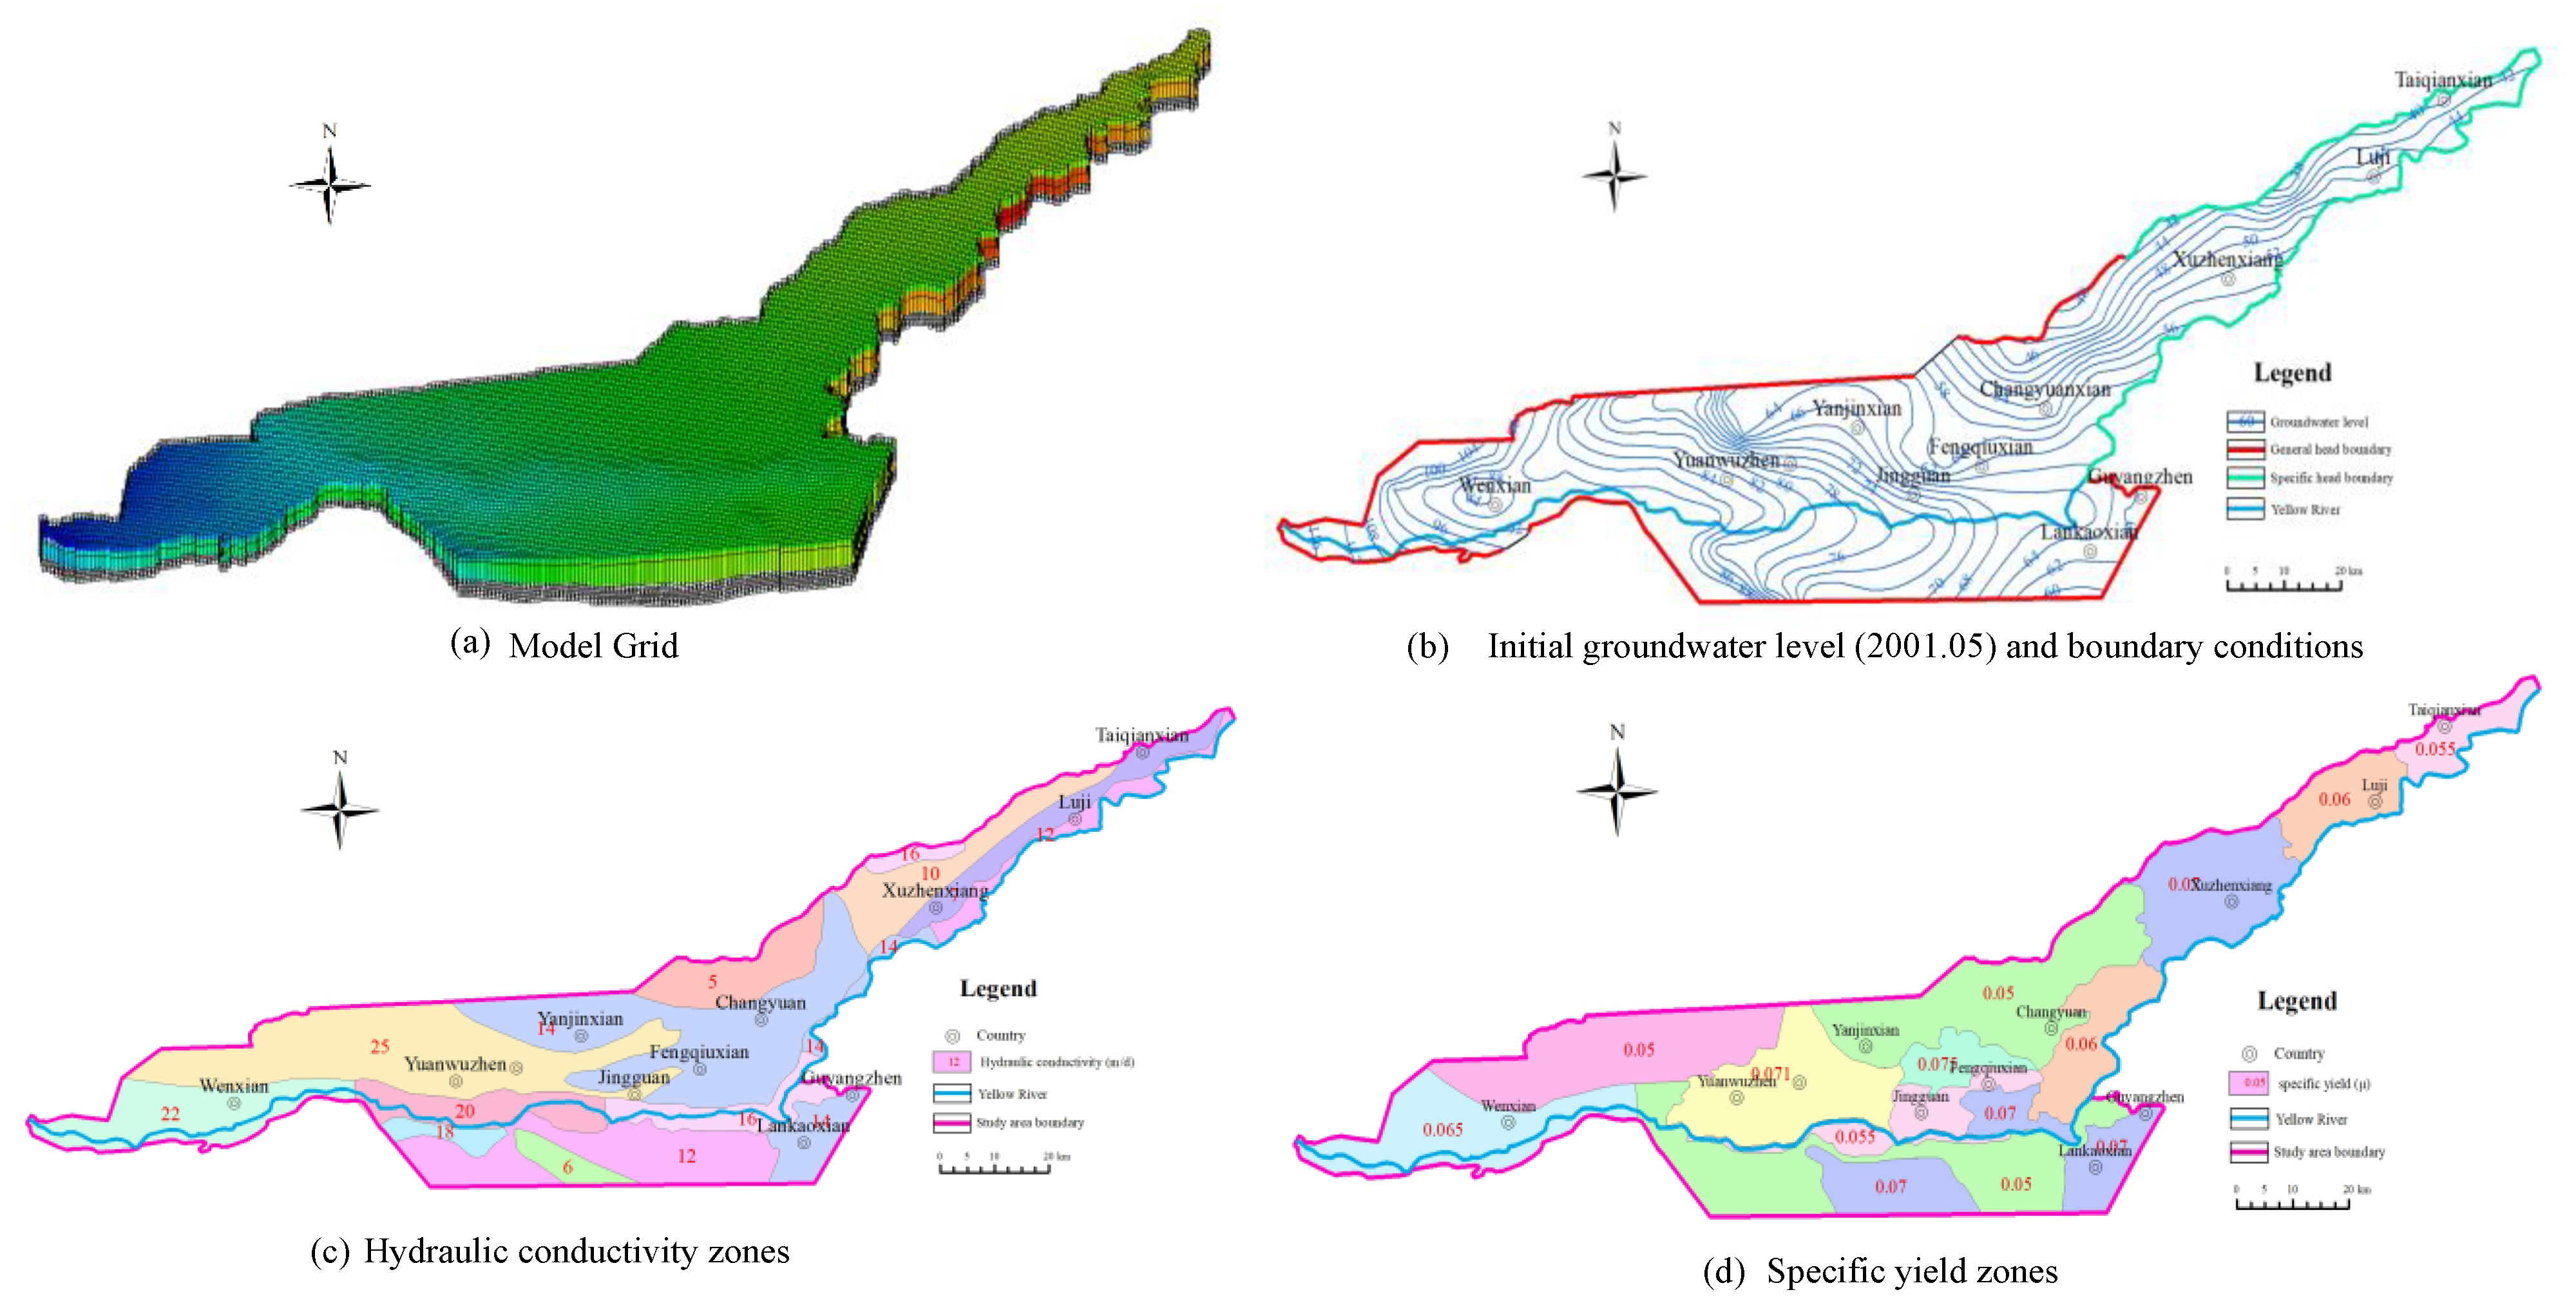
3.4. Groundwater Flow Model
3.4.1. Model Discretization
3.4.2. Boundary Conditions
3.4.3. Parameters
3.4.4. Recharge and Discharge
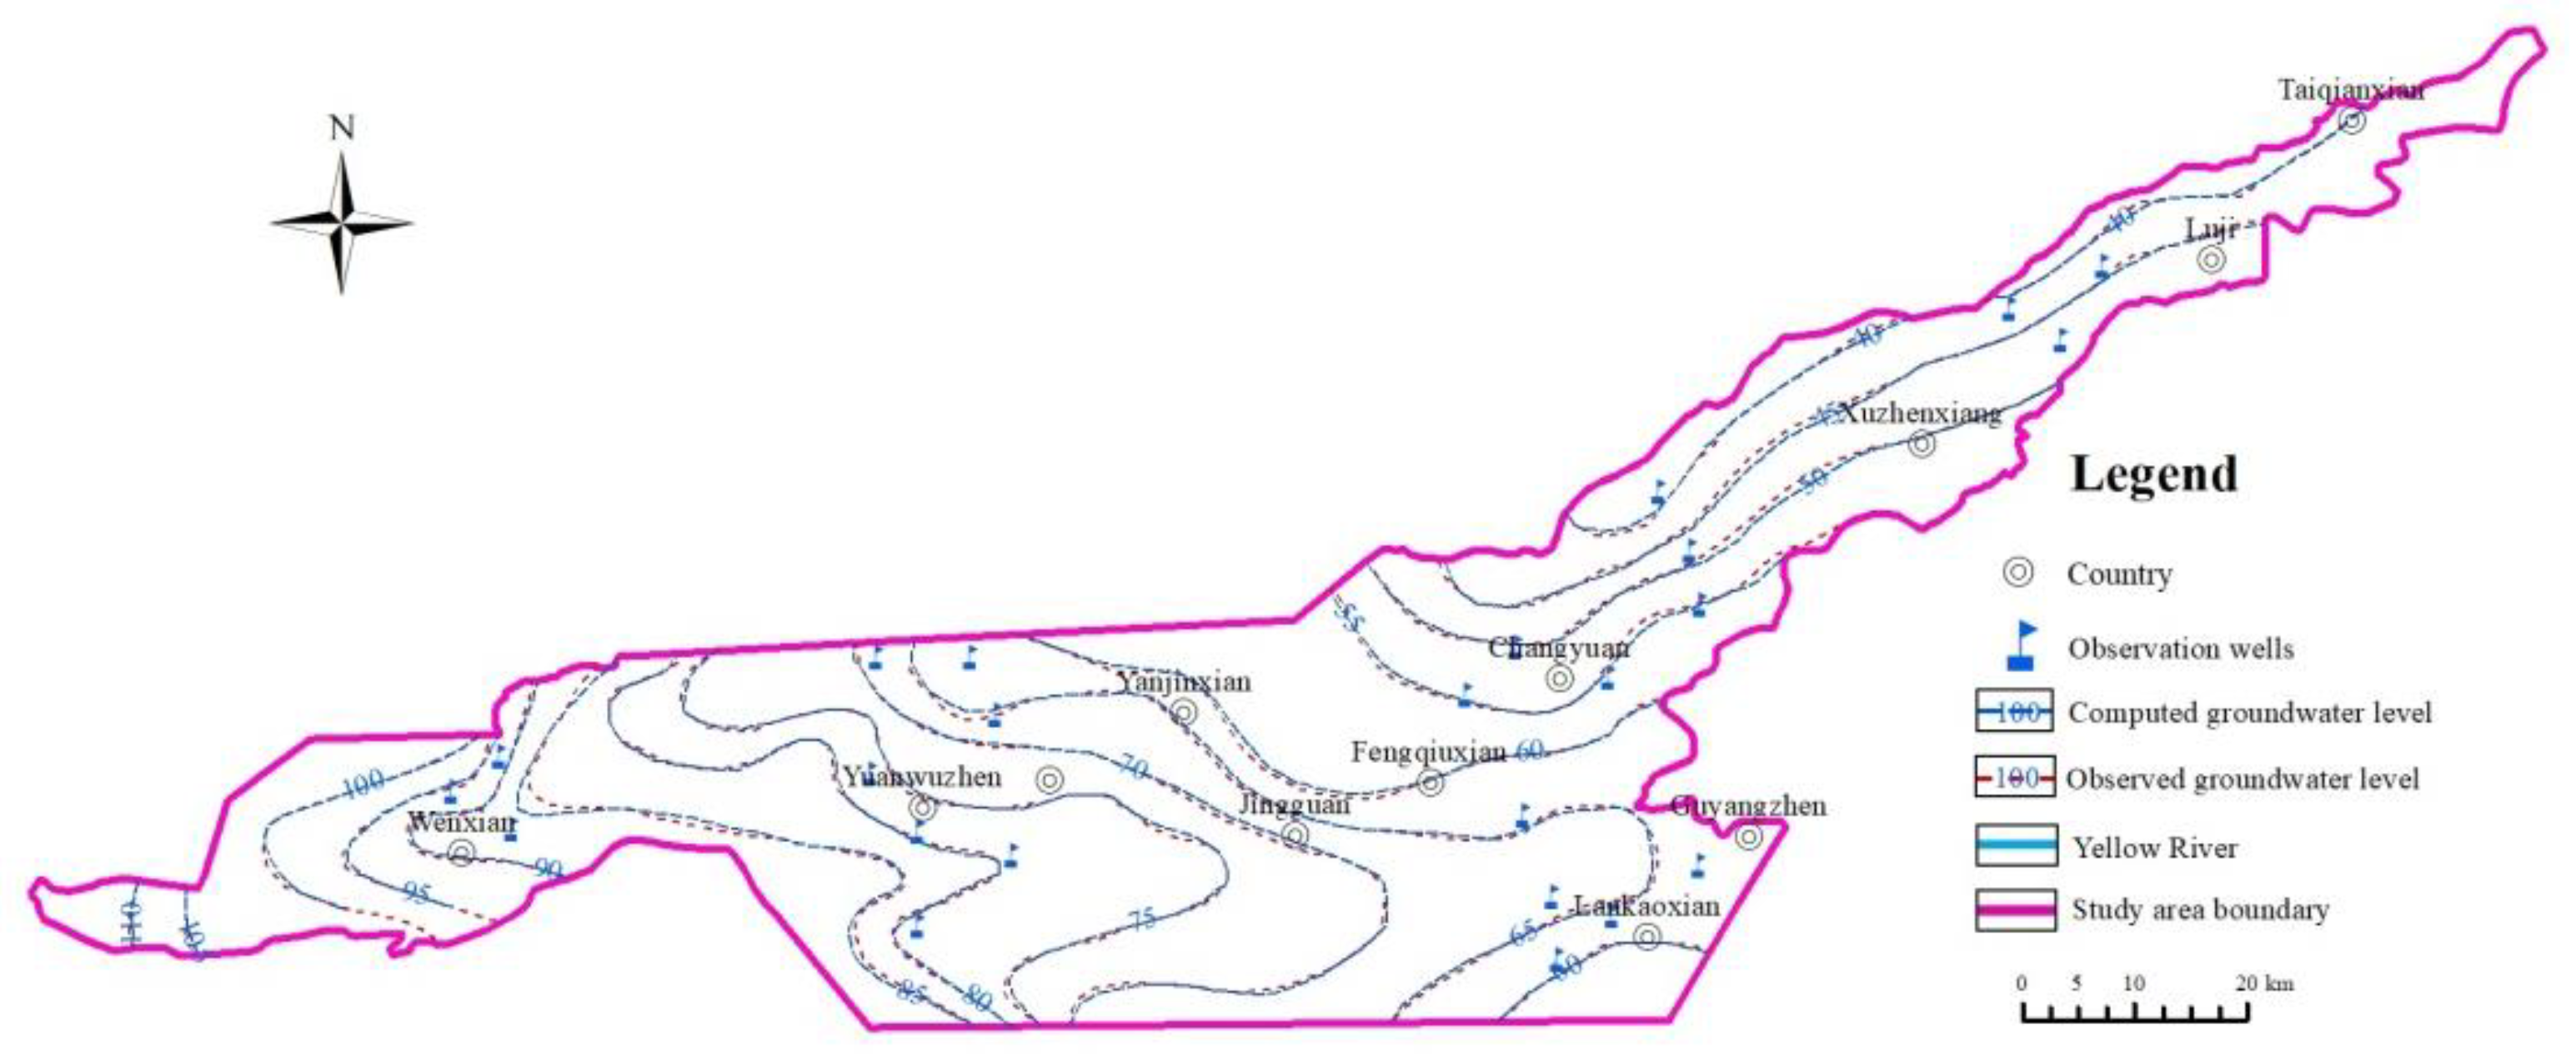
3.4.5. Model Calibration and Sensitivity Analysis
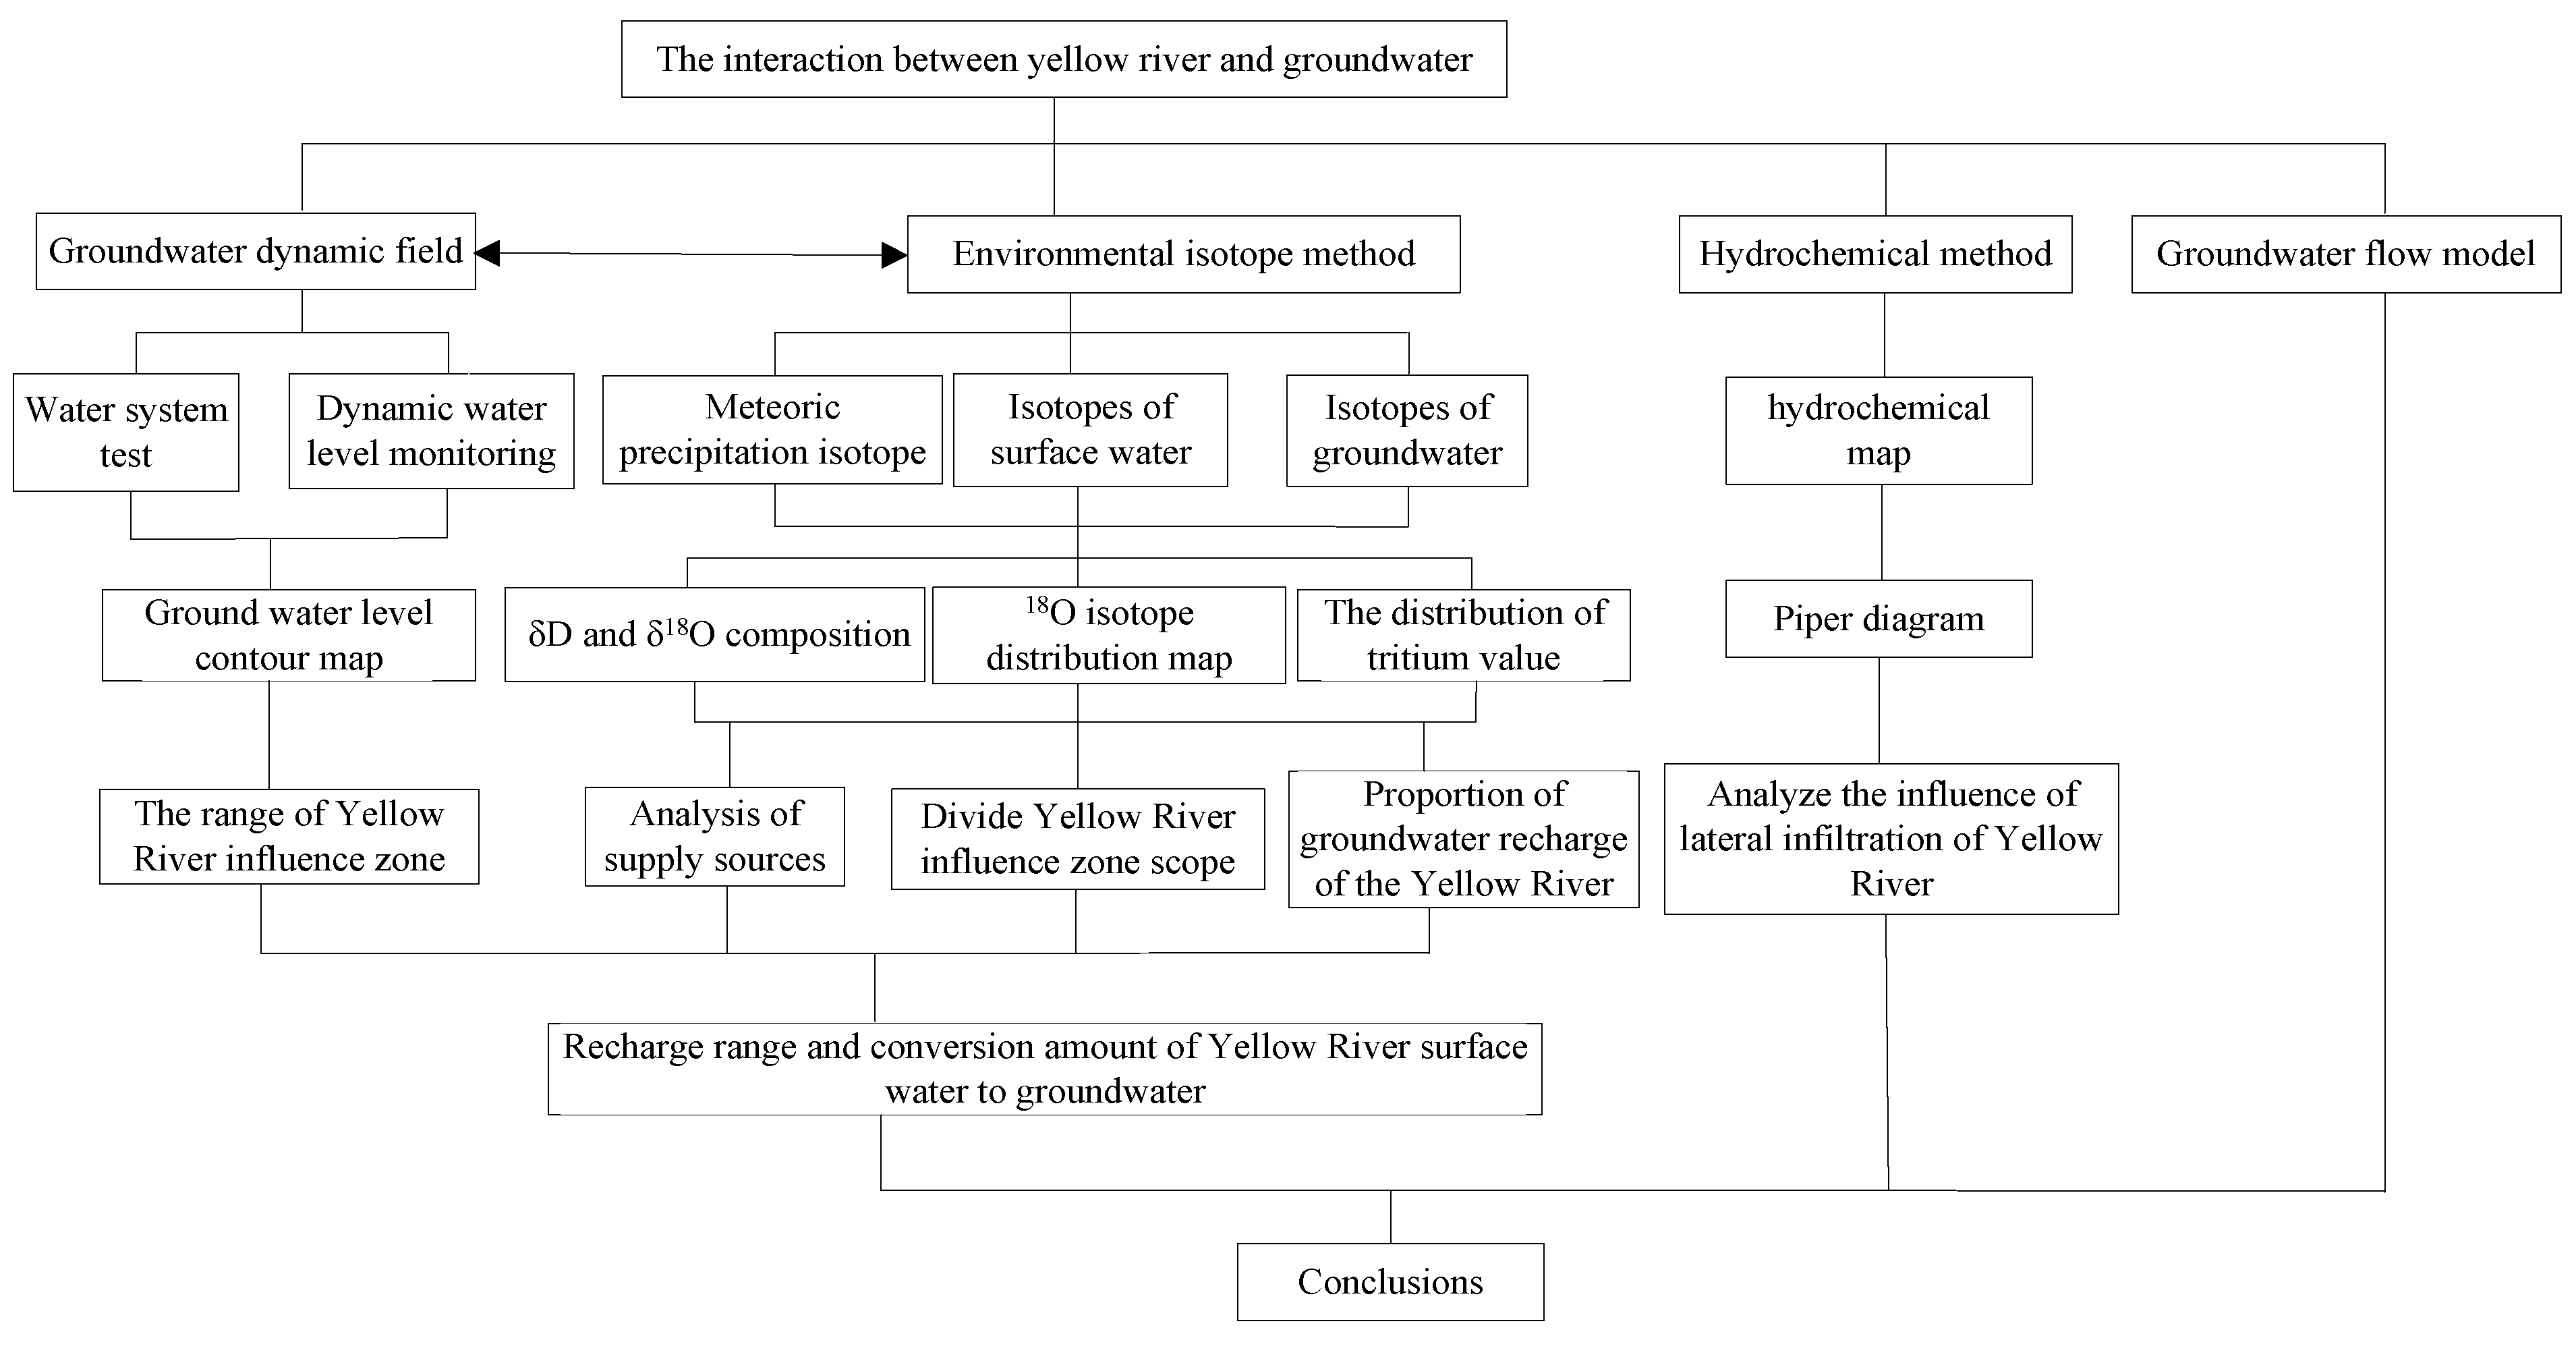
3.5. Technical Procedure
4. Results and Discussion
4.1. Determination of Recharge Rate of Yellow River Lateral Seepage
4.1.1. Recharge Range of Yellow River Lateral Seepage
4.1.2. Recharge Range of Yellow River Lateral Seepage in Typical II Section
- (1)
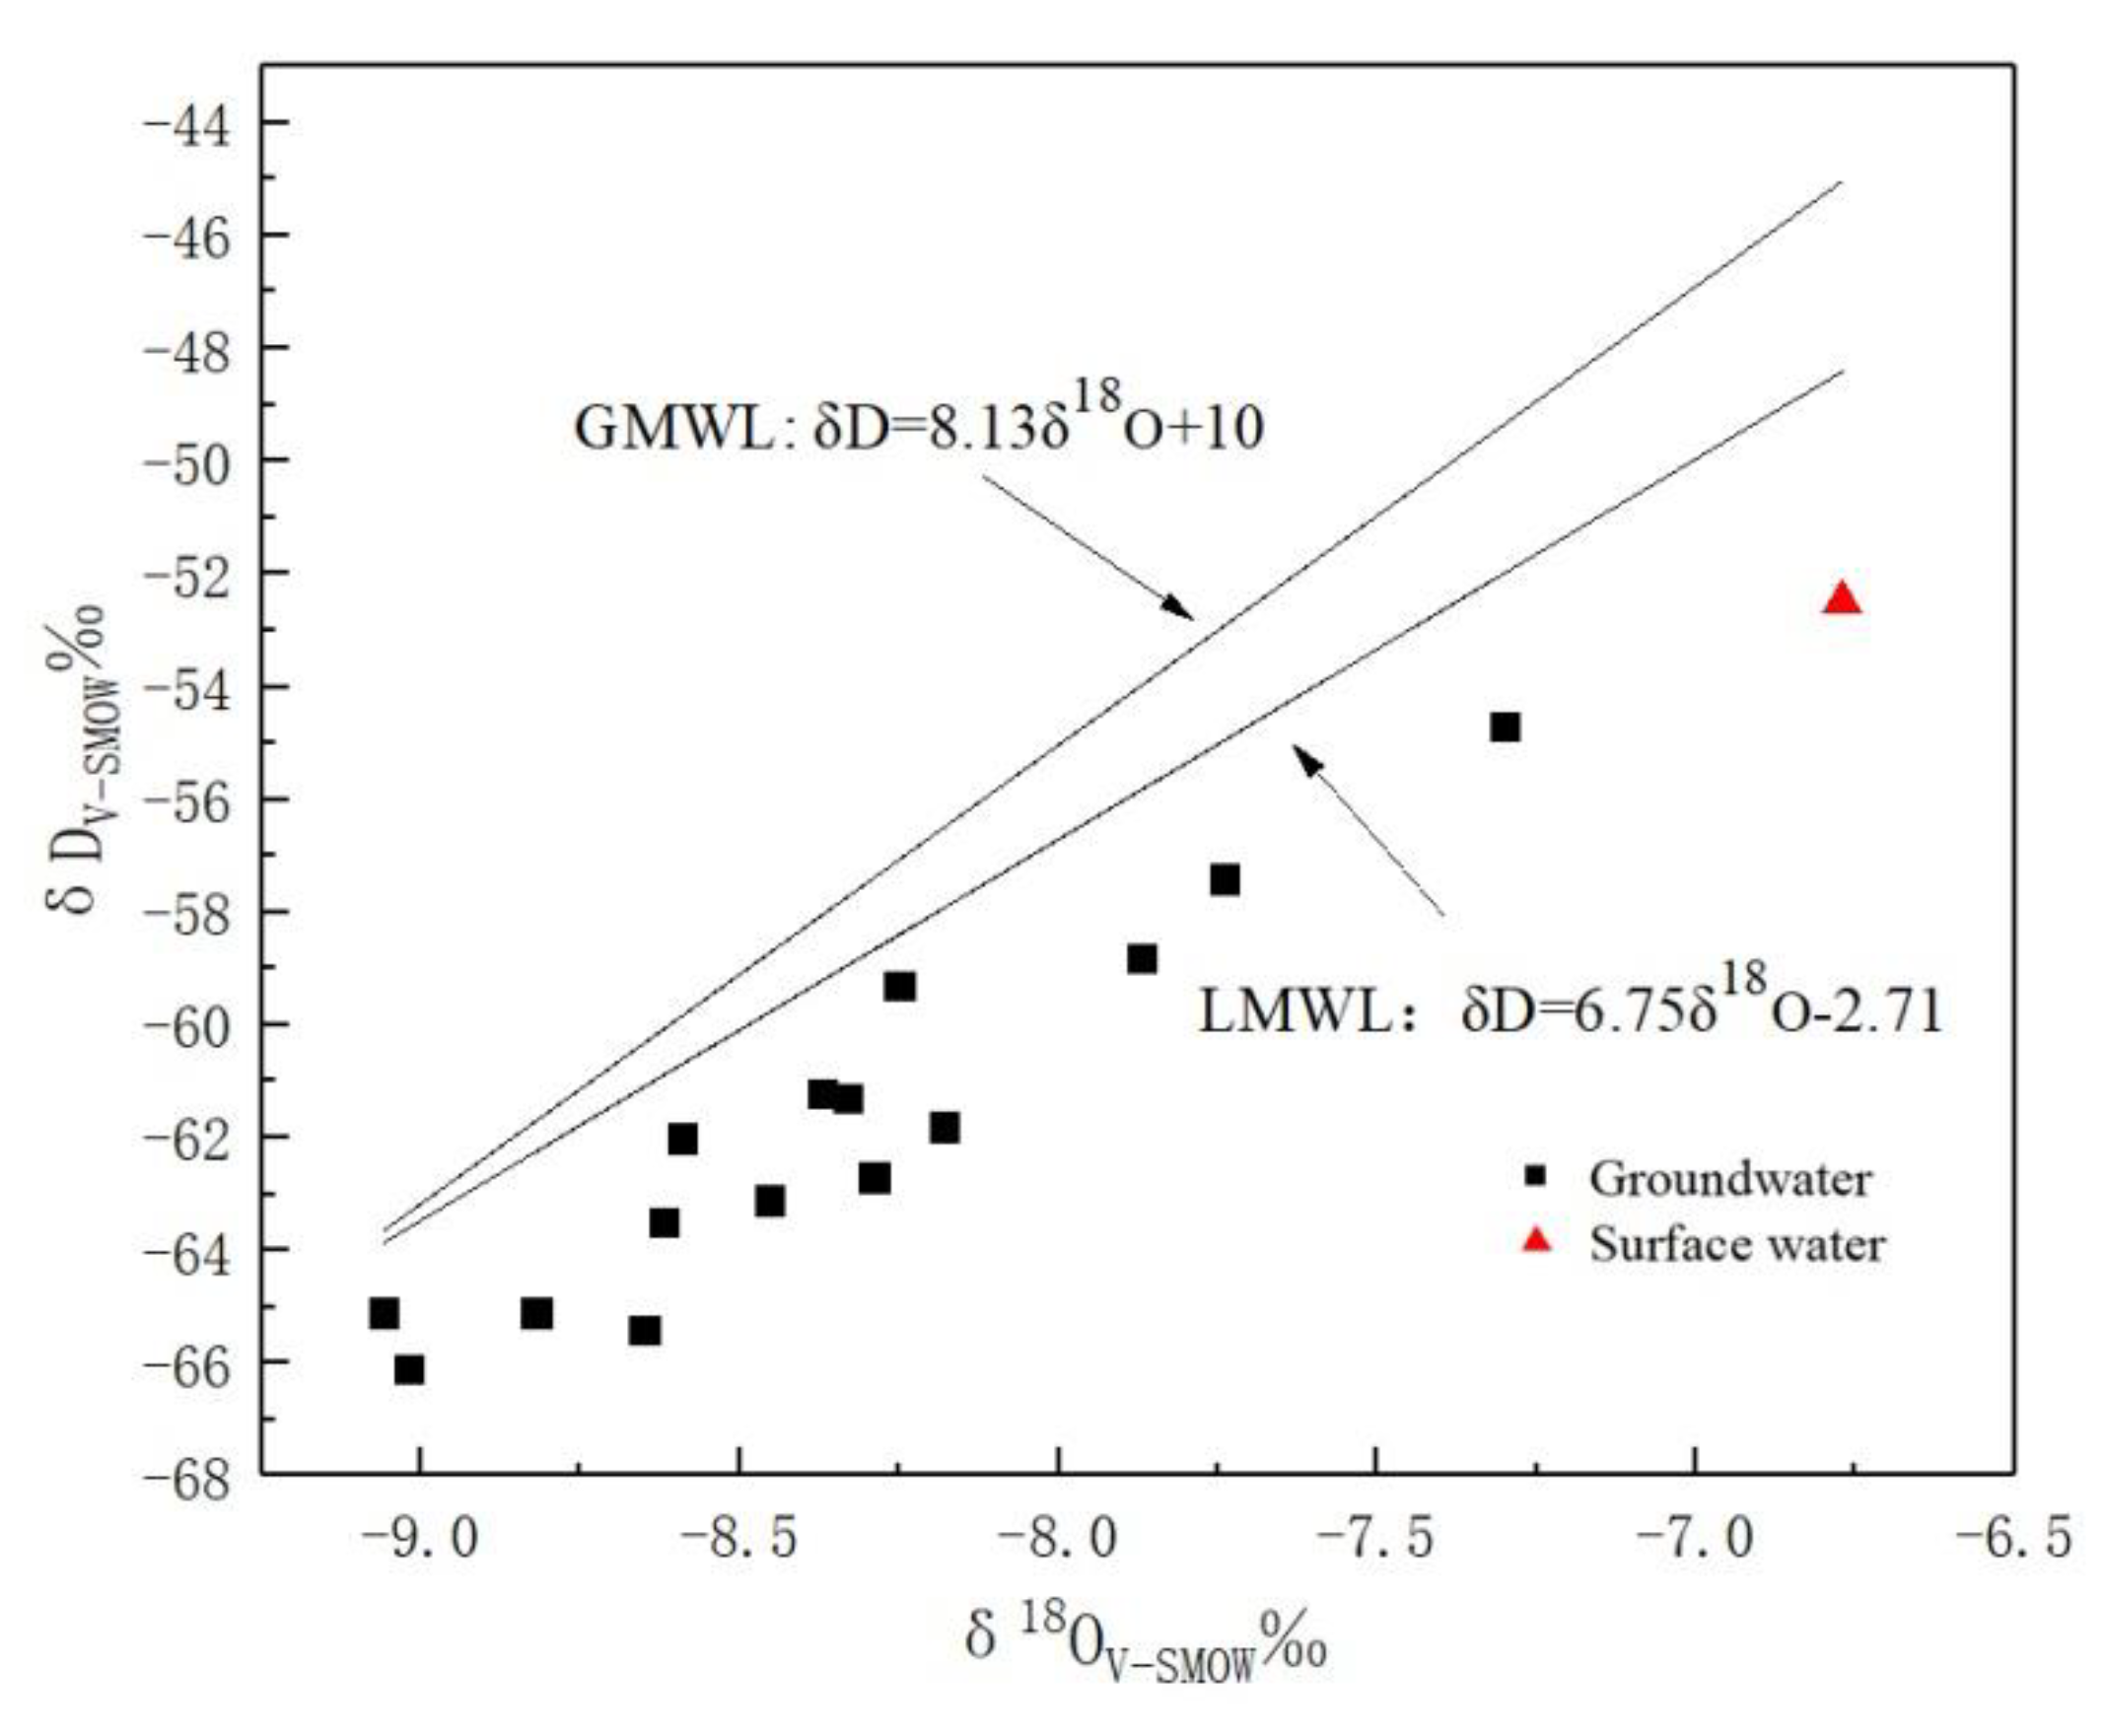
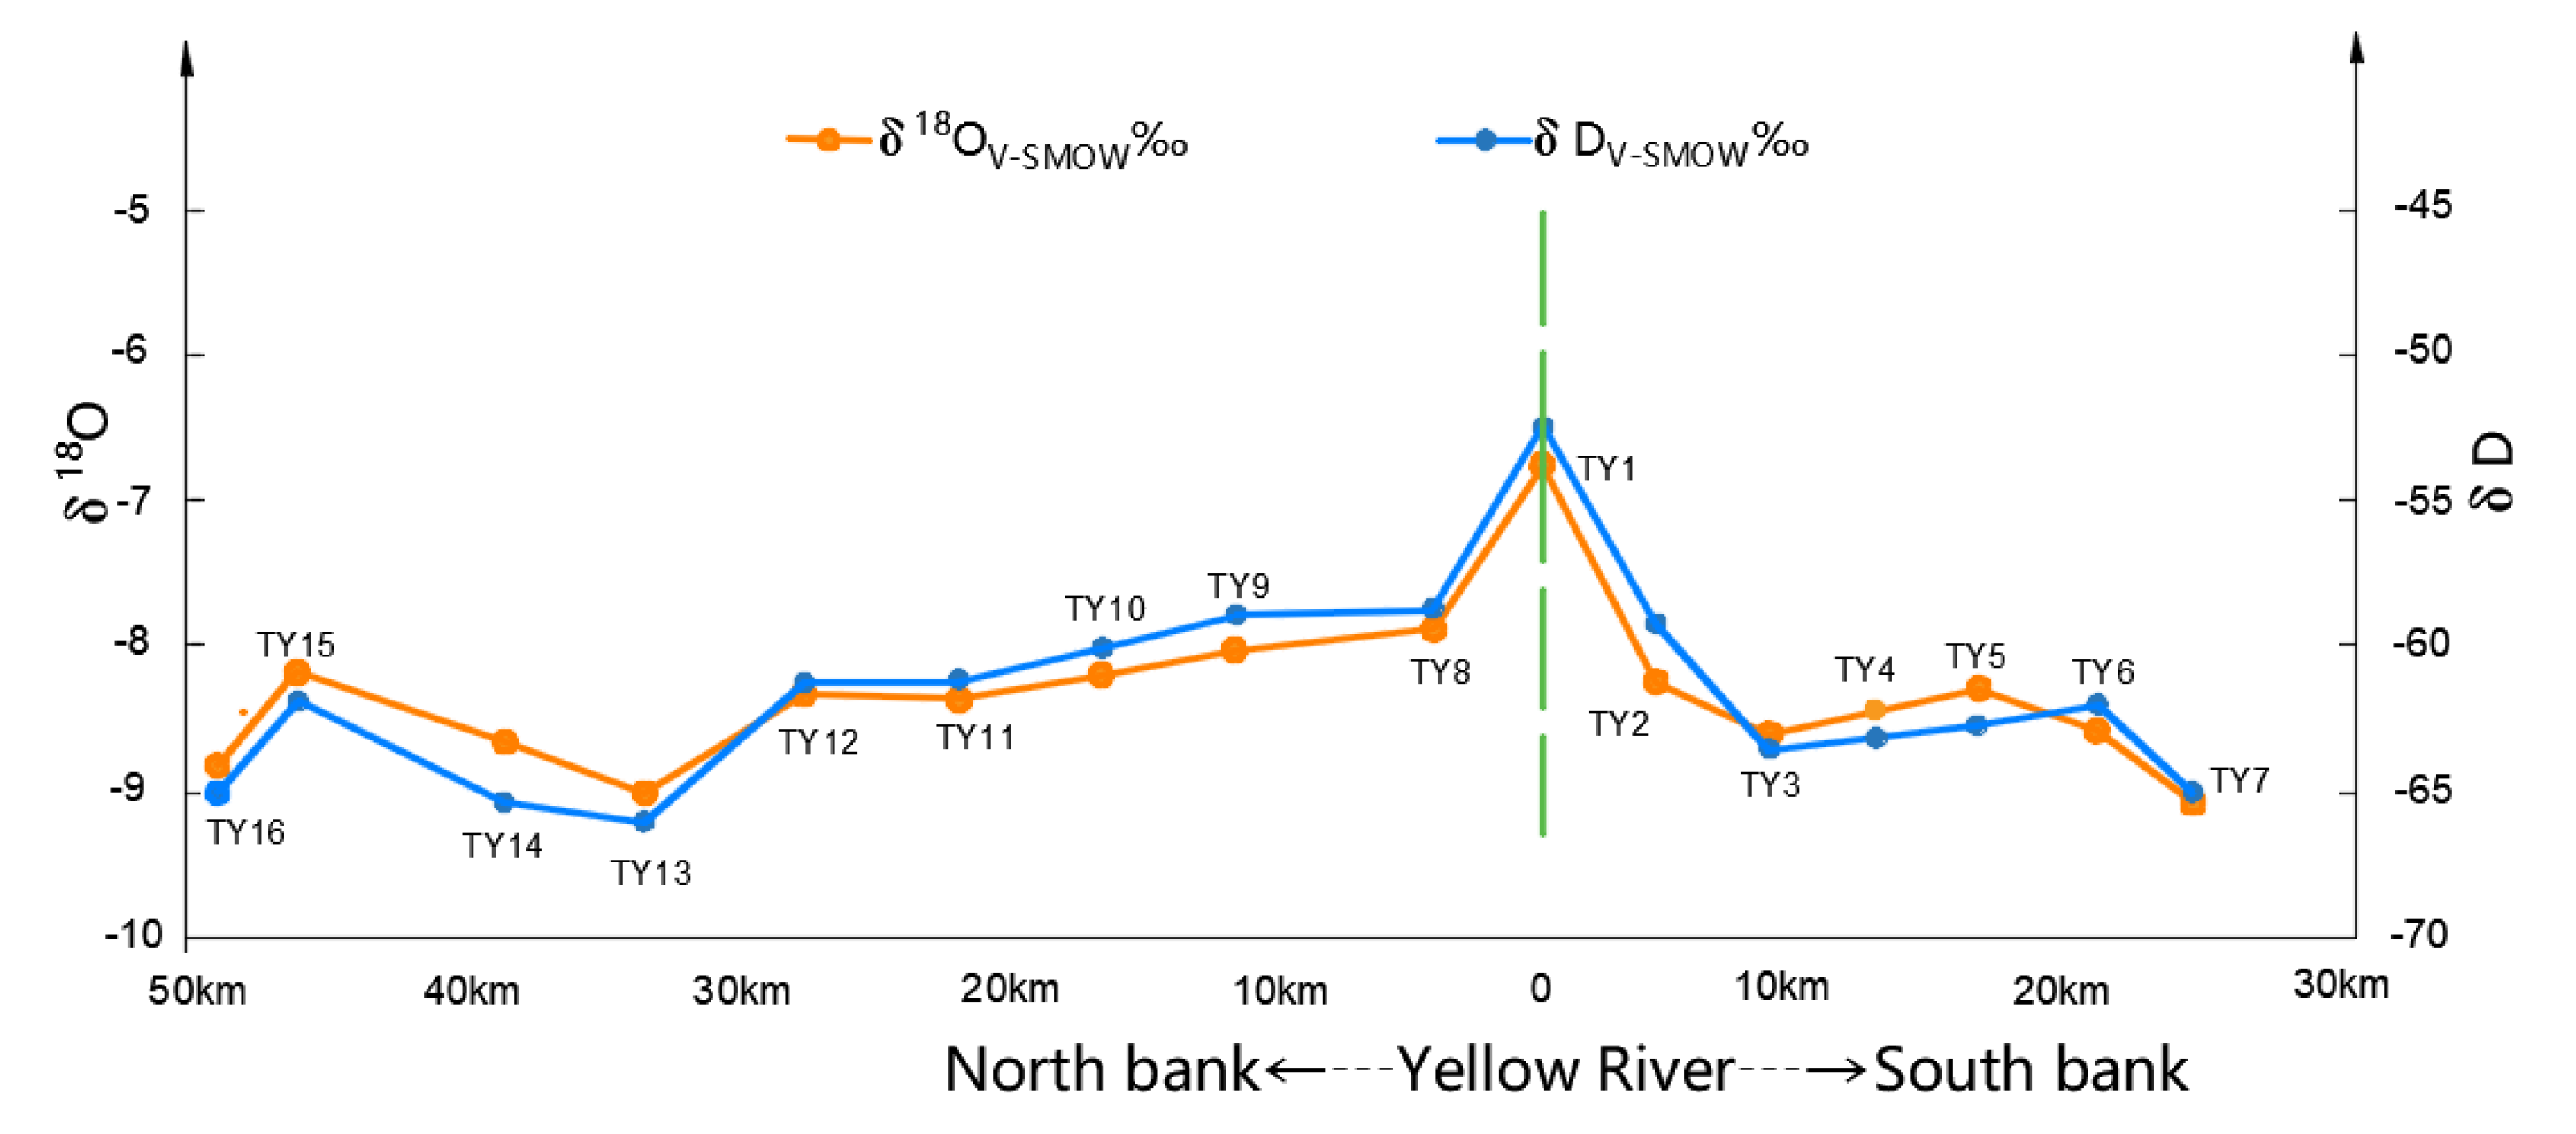
- Determination using 18O stable isotope
- (2)
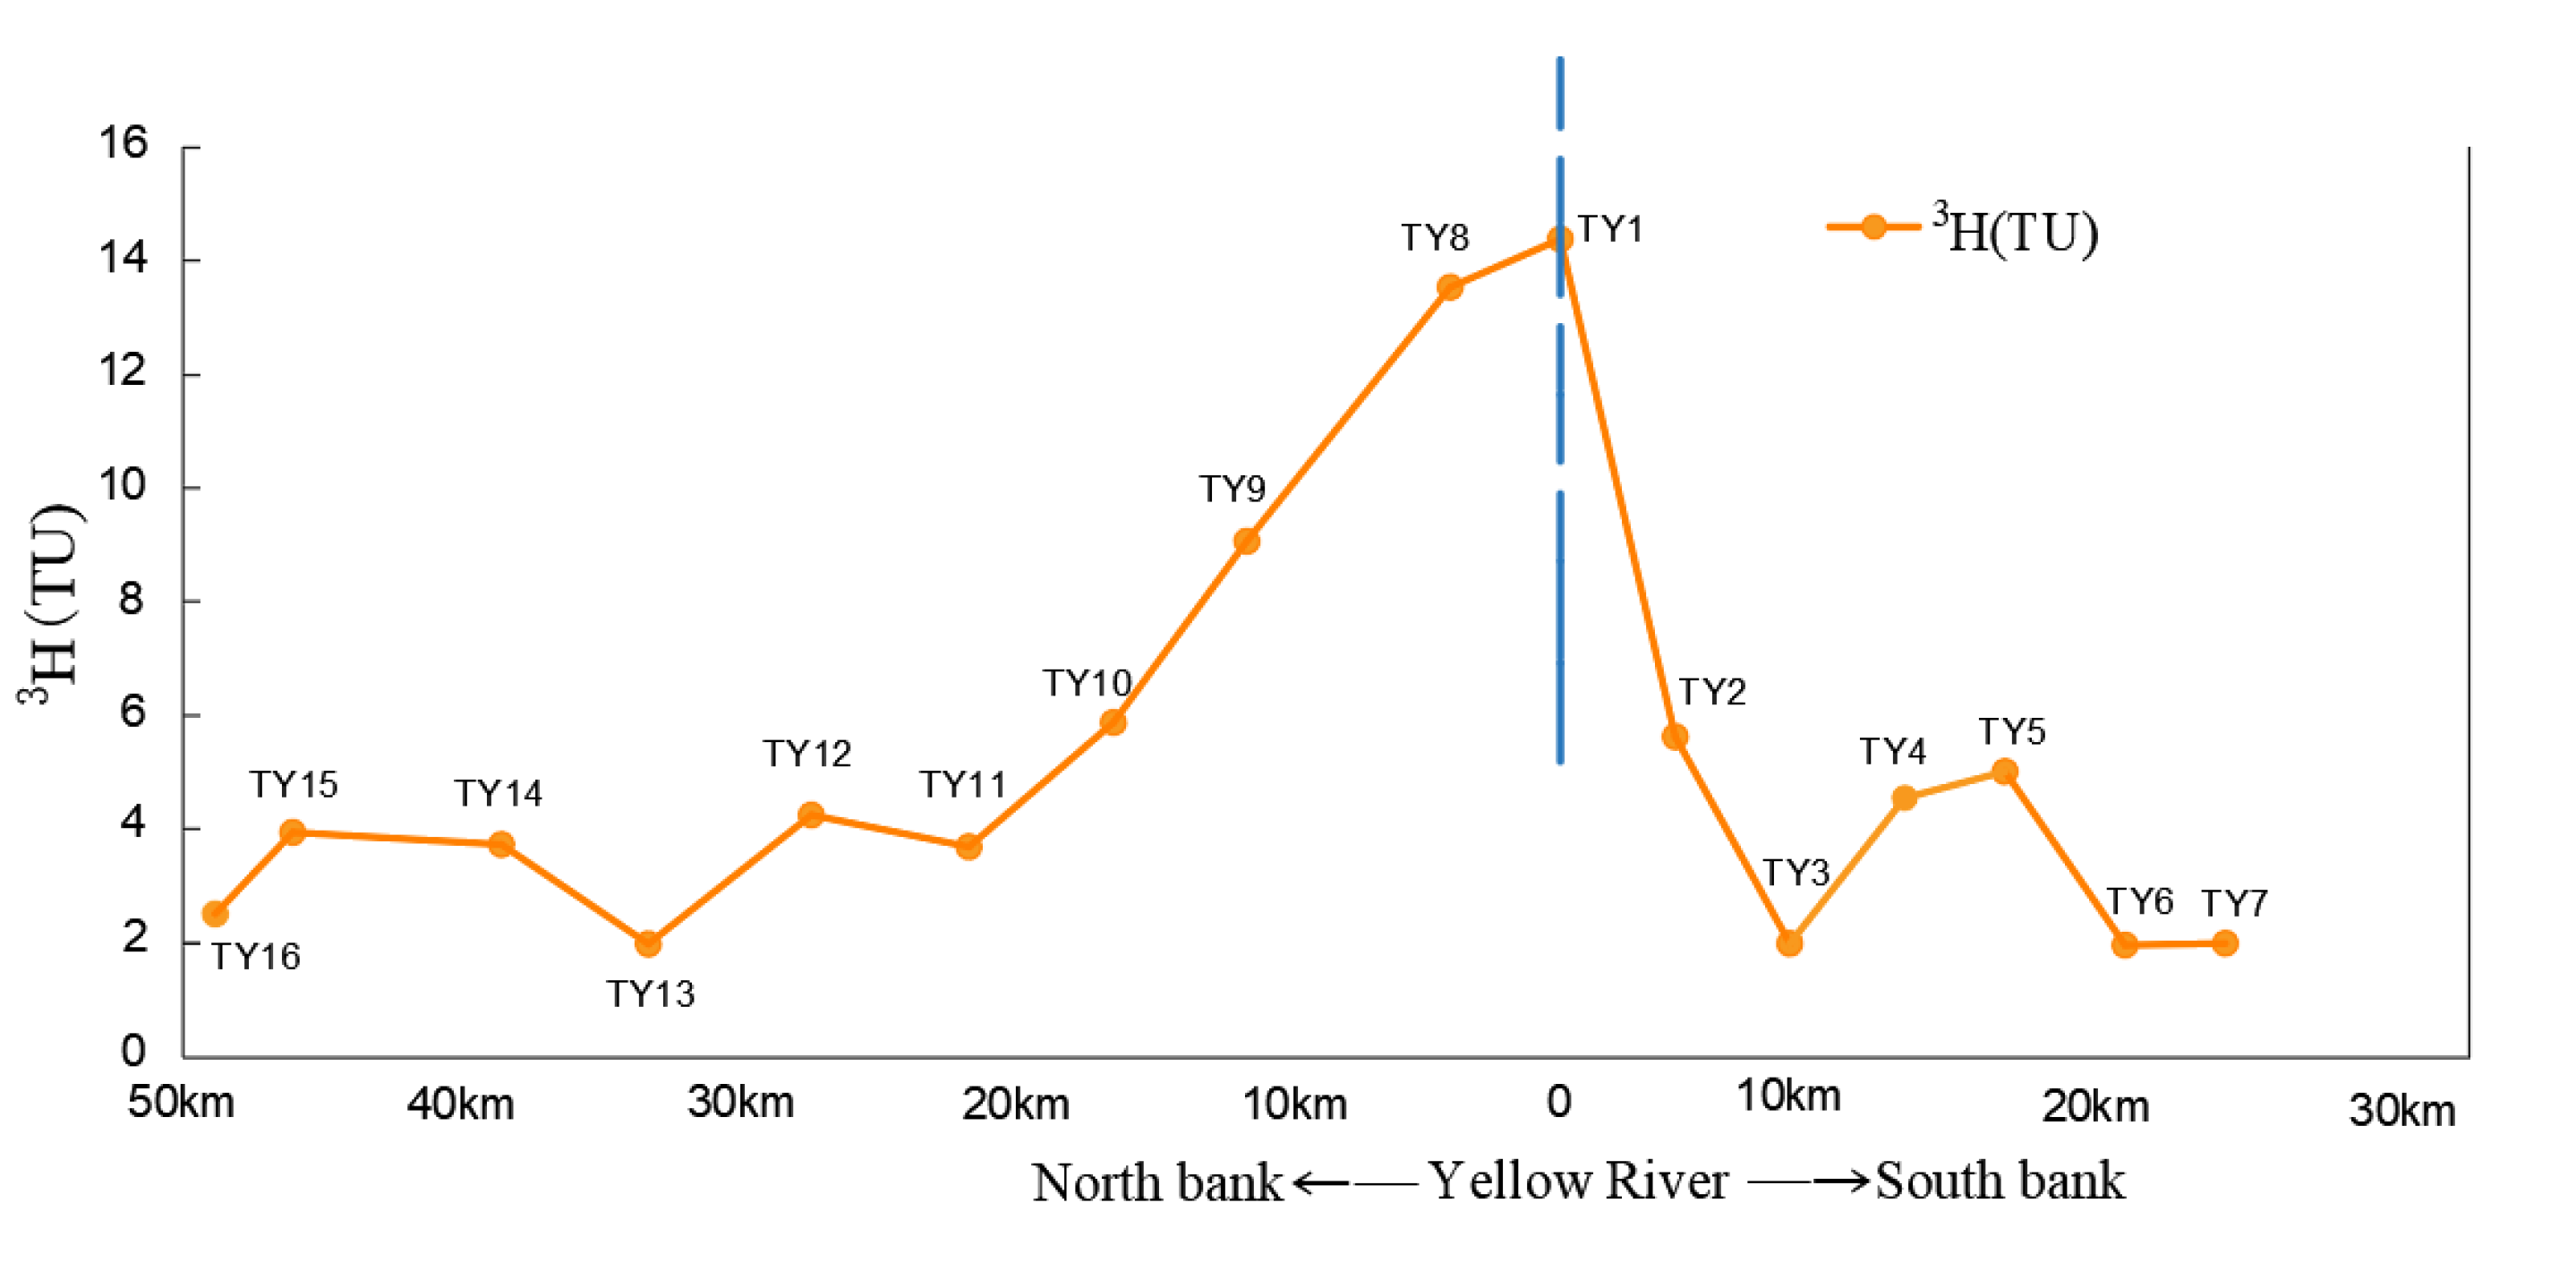
- Determination of 3H radioactive isotopes
4.2. Determination of Lateral Seepage Quantity of the Yellow River on the Typical Sections
4.2.1. Proportion of Groundwater Recharged by Yellow River on the Typical Sections
4.2.2. Lateral Seepage Quantity of the Yellow River on the Typical Sections
4.3. Influence of Yellow River Lateral Seepage on Groundwater Chemistry Composition
4.4. Recharged by Lateral Seepage of the Yellow River by Groundwater Flow Model
5. Conclusions
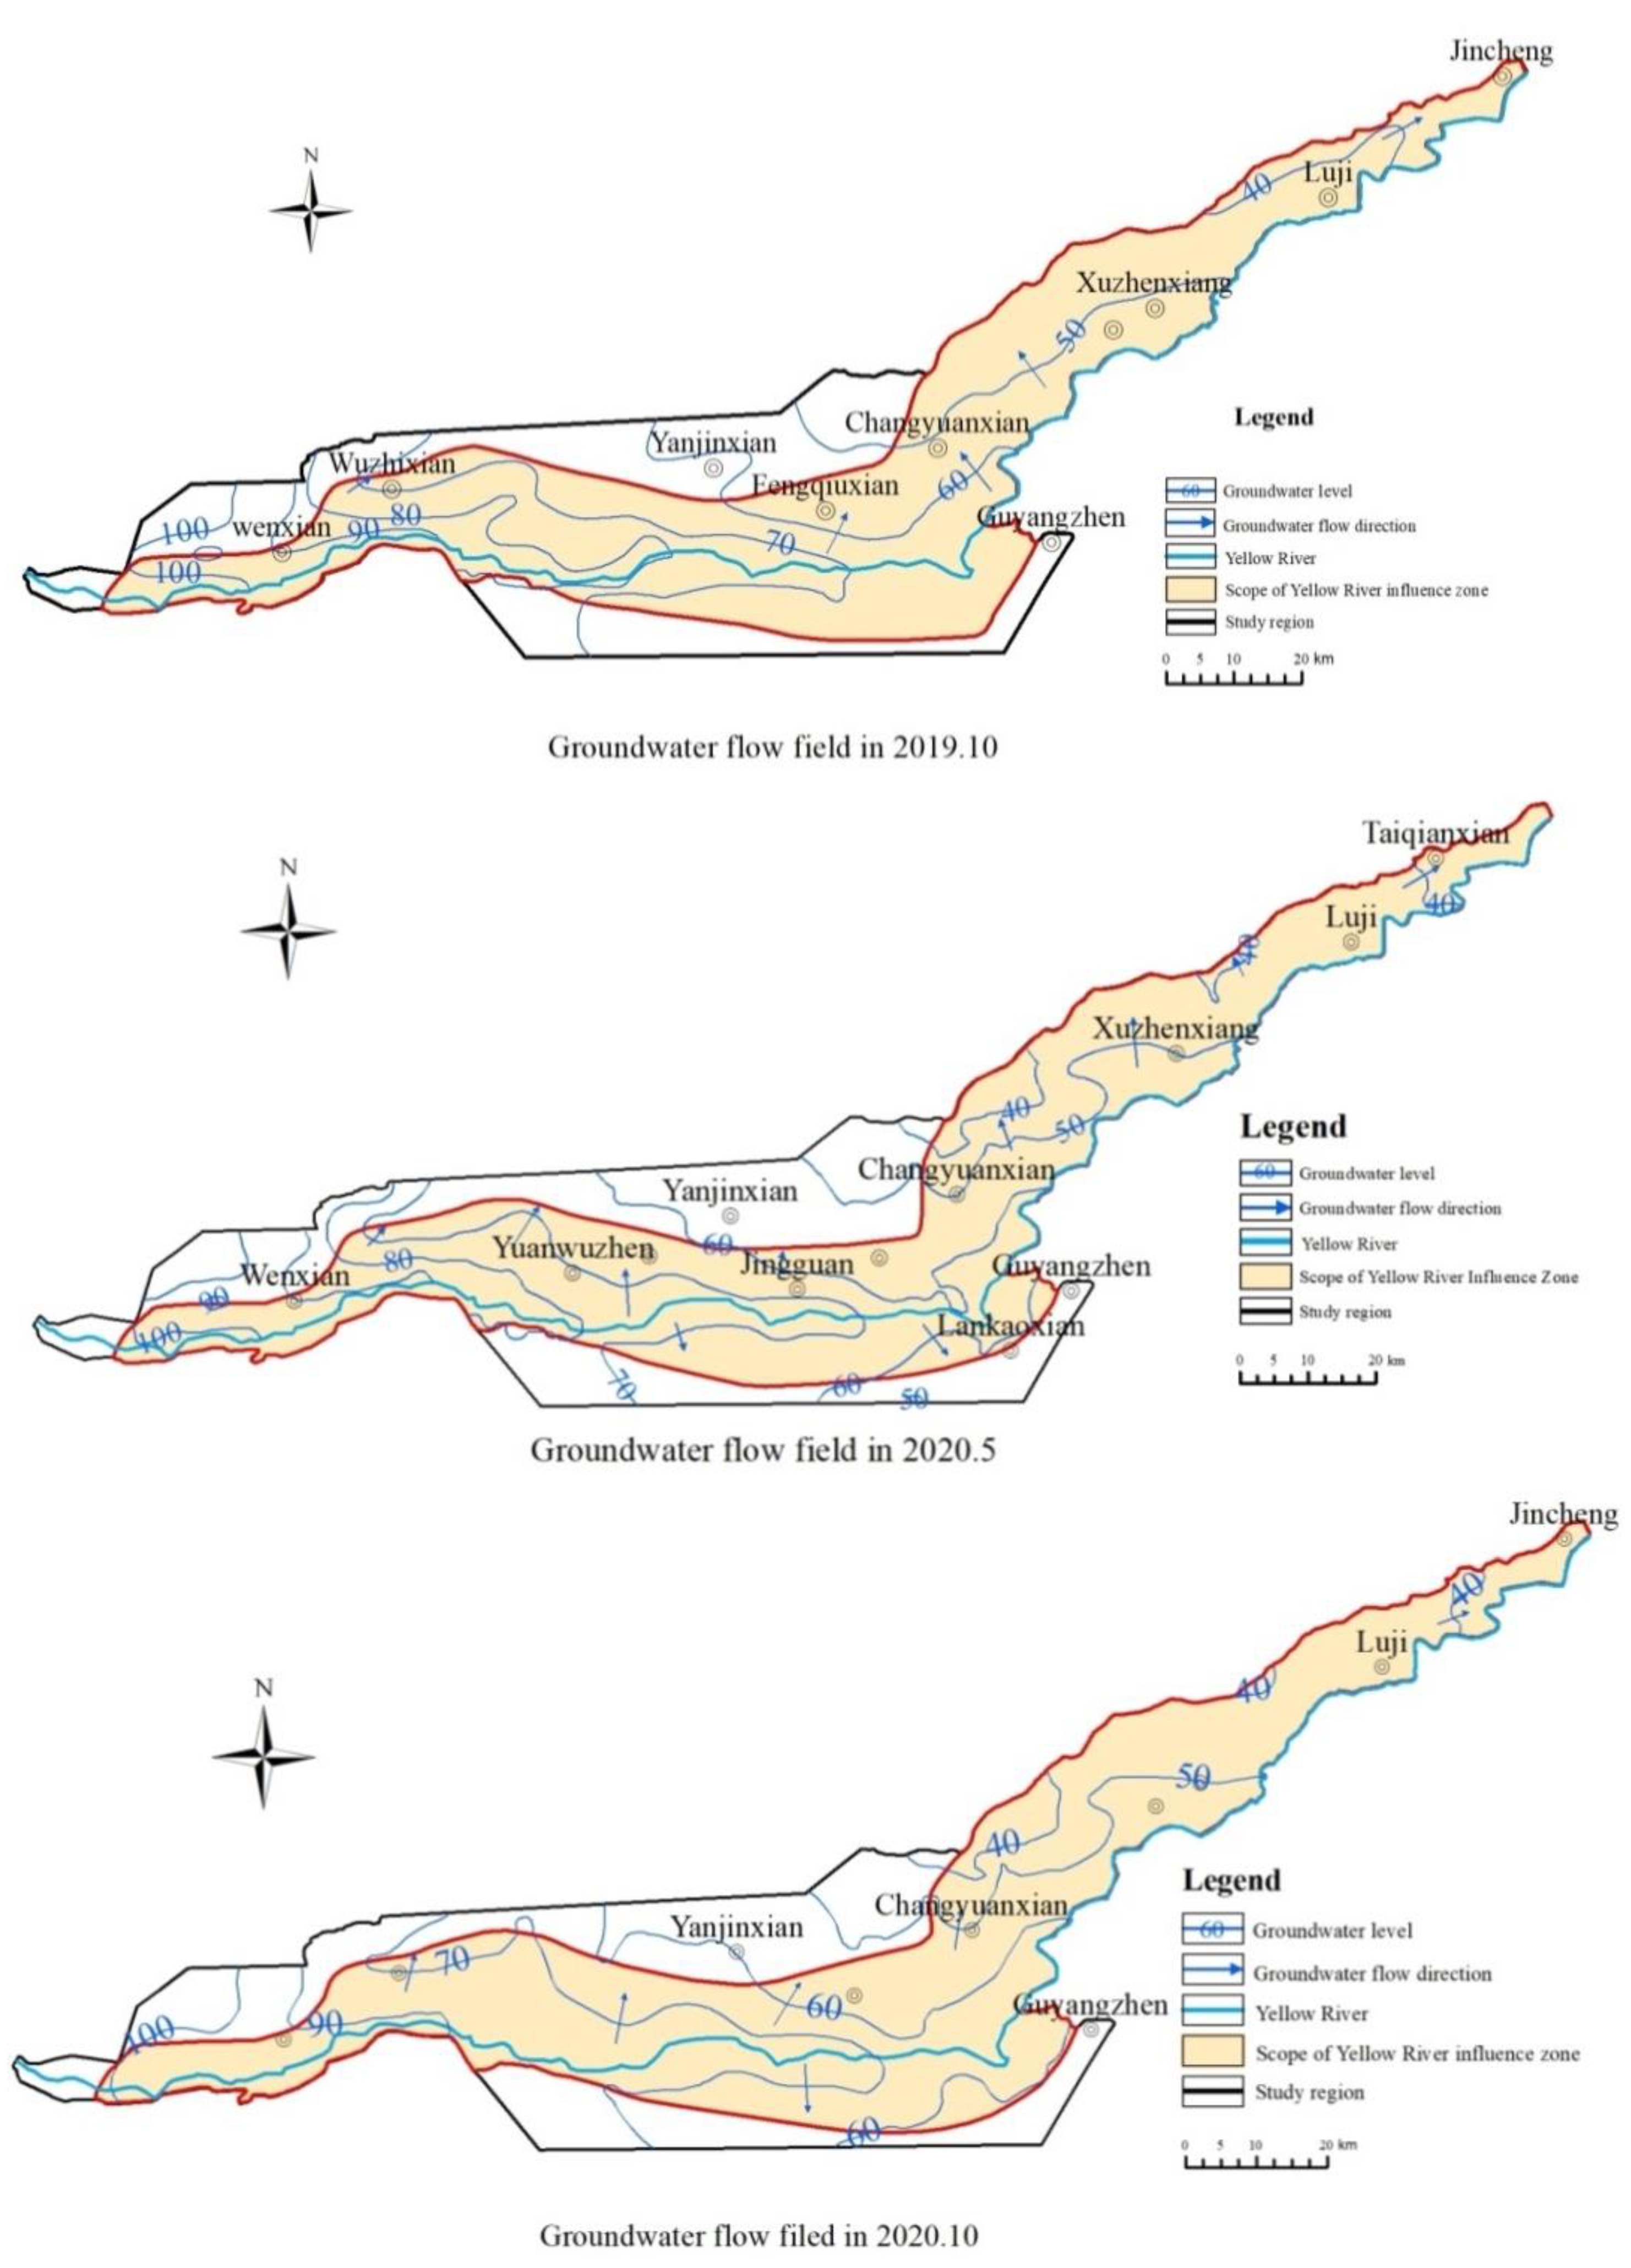
- (1)
- It can be determined by analysing the groundwater flow field maps of October 2019 and May 2020, and October 2020, that the transverse seepage range of the north bank of the Yellow River was larger (approximately 20 km) and that of the south bank was smaller (approximately 10 km).
- (2)
- The main recharge sources of groundwater were atmospheric precipitation and the Yellow River, of which the latter was the main recharge source, accounting for 50.1%.
- (3)
- In Sections 1·4, the lateral seepage amounts in the north bank were 1476.94 m3/a·m, 505.89 m3/a·m, 40.88 m3/a·m, and 65.7 m3/a·m, respectively. The single-width permeability of typical Section 2 was larger upstream than downstream, and larger in the north than in the south.
- (4)
- According to the hydrochemical diagram and Piper diagram of the study area, we can see that the lateral seepage of the Yellow River had a great influence on the hydrochemical types of groundwater. The hydrochemical type changed from single to complex from upstream to downstream, and also from near to far proximity of the Yellow River, with the salinity increasing gradually along those two same lineal spectra.
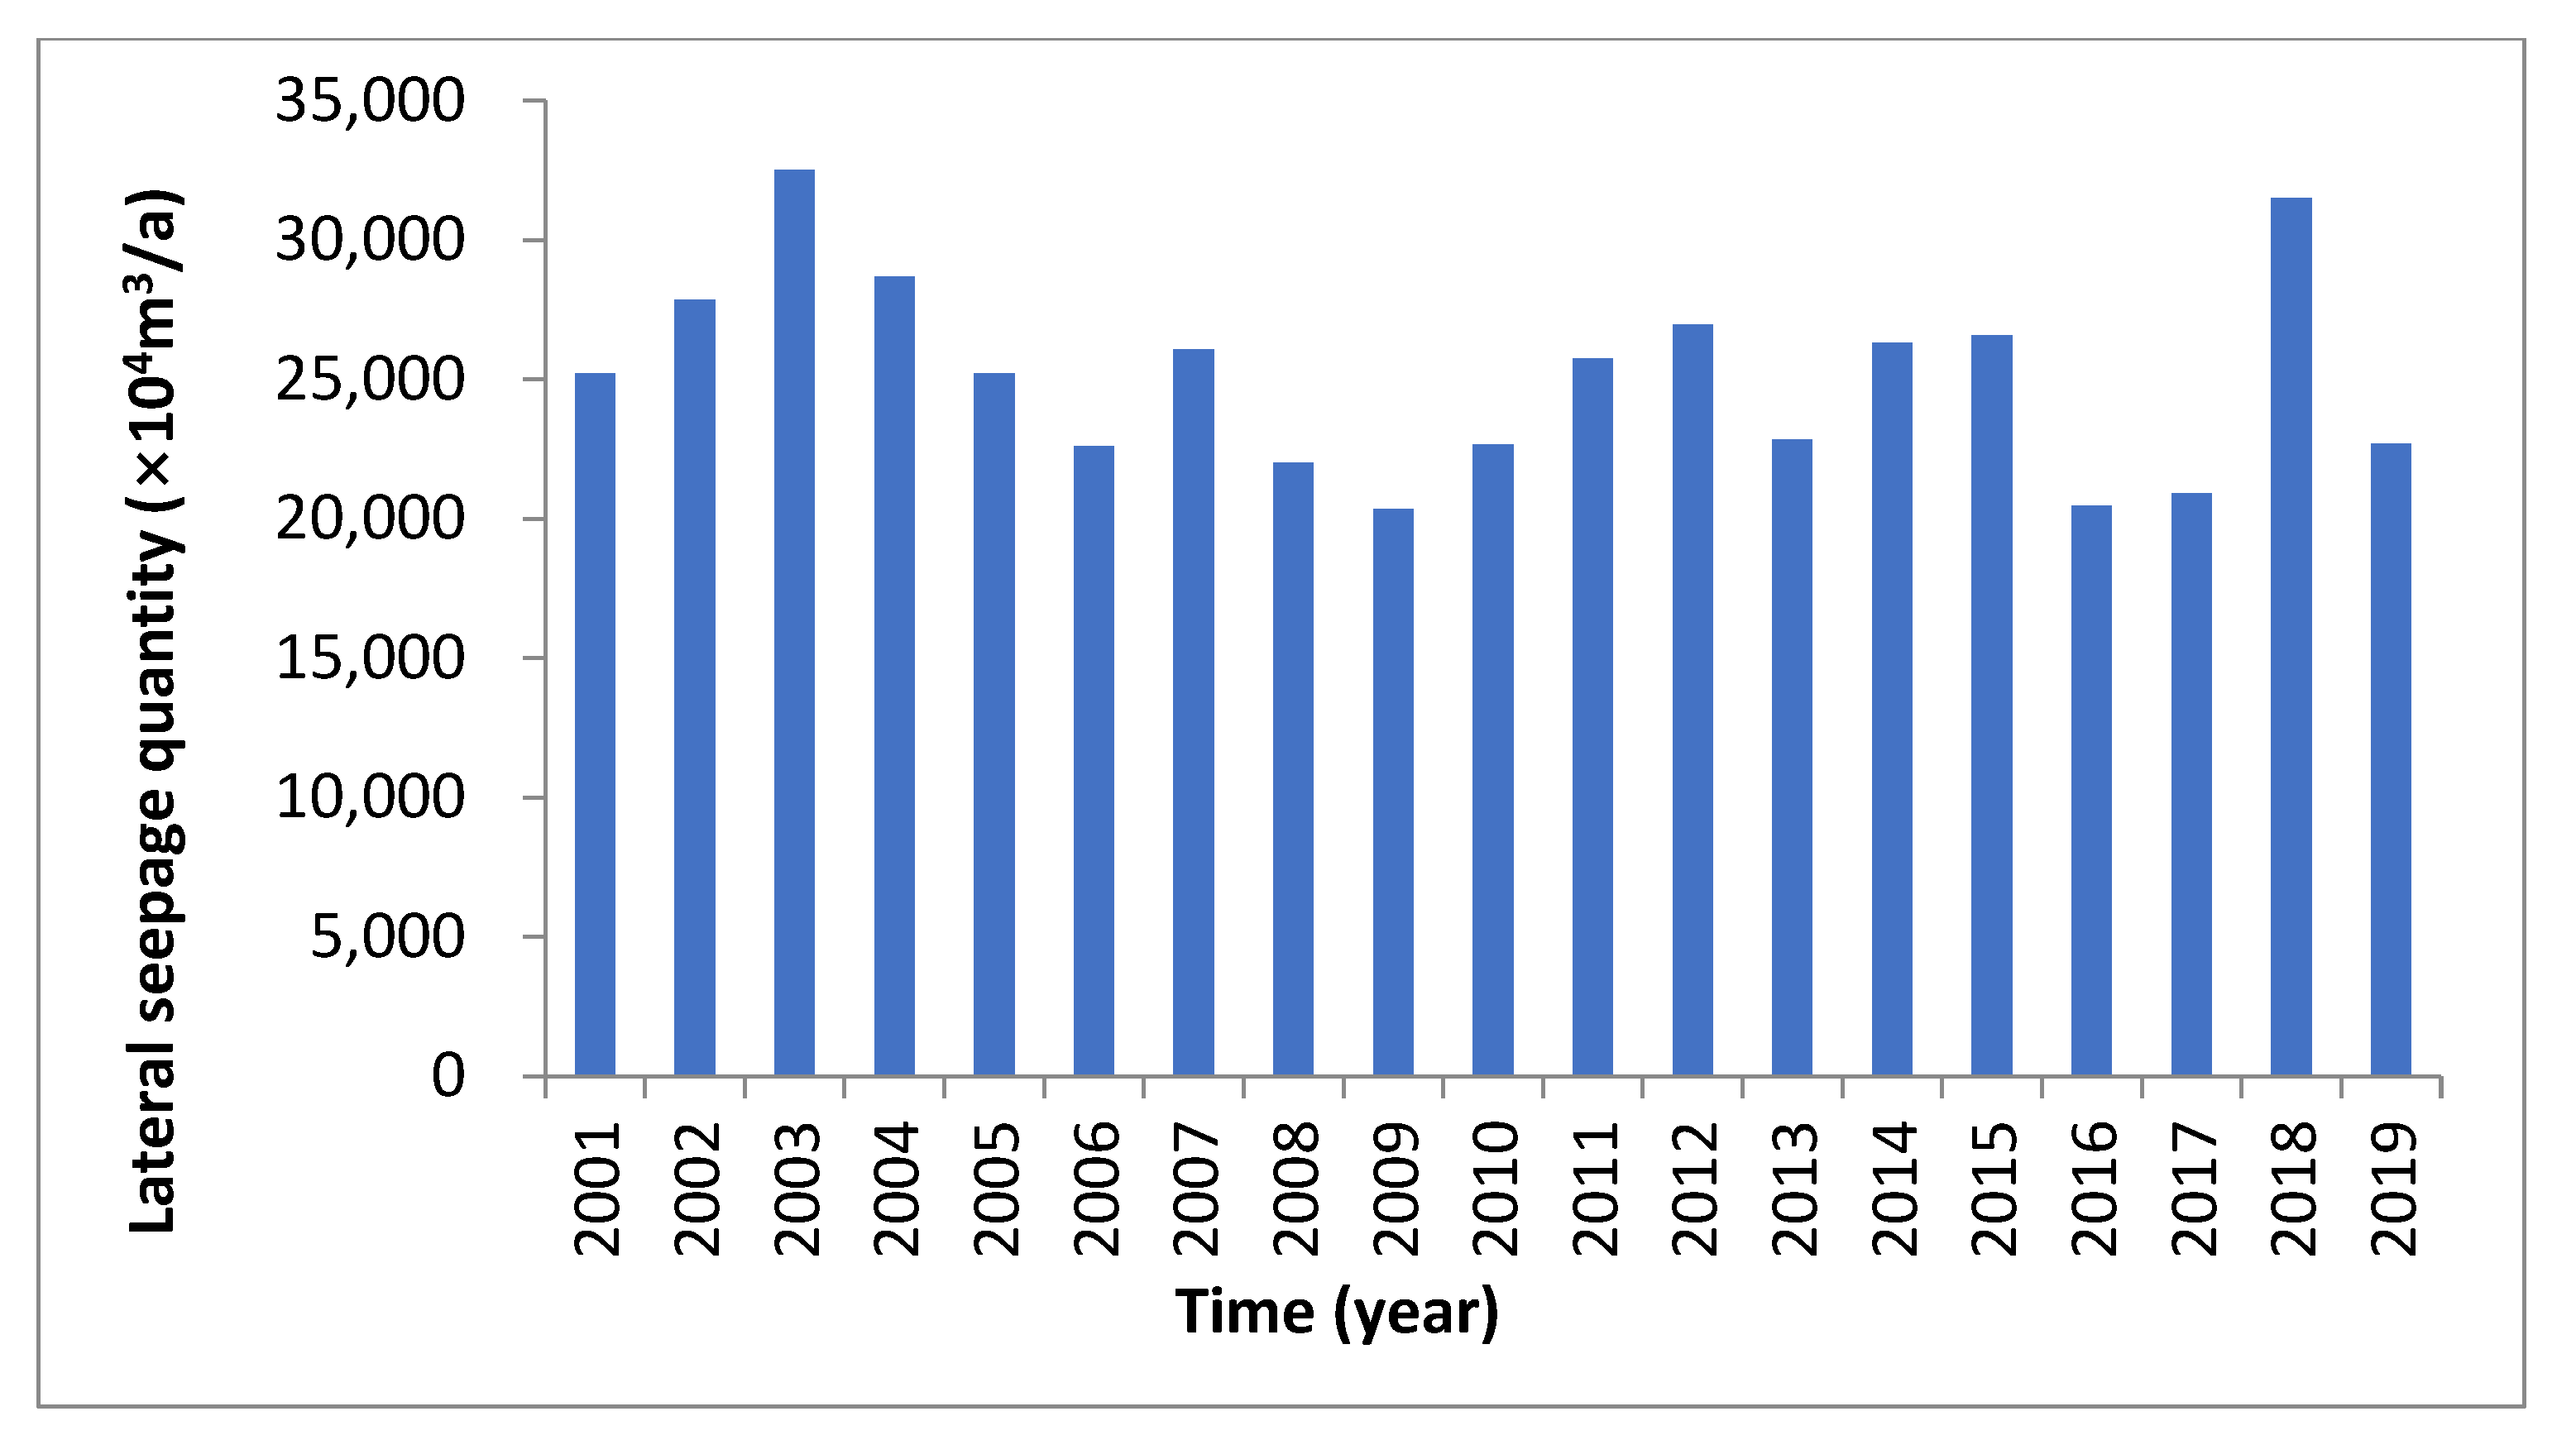
- (5)
- The annual average lateral seepage recharge groundwater quantity of the Yellow River from 2001 to 2019 was 25,114.36 × 104 m3/a.
Author Contributions
Funding
Institutional Review Board Statement
Informed Consent Statement
Data Availability Statement
Conflicts of Interest
References
- Kourgialas, N.N. A critical review of water resources in Greece: The key role of agricultural adaptation to climate-water effects. Sci. Total Environ. 2021, 117, 145857. [Google Scholar] [CrossRef]
- Plattner, G.K. IPCC, 2014: Climate Change 2014: Synthesis Report. Contribution of Working Groups I, II and III to the Fifth Assessment Report of the Intergovernmental Panel on Climate Change. J. Roman. Stud. 2014, 4, 85–88. [Google Scholar]
- Zhang, B.; Song, X.; Zhang, Y.; Han, D.; Tang, C.; Yu, Y.; Ma, Y. Hydrochemical characteristics and water quality assessment of surface water and groundwater in Songnen plain, Northeast China. Water Res. 2012, 46, 2737–2748. [Google Scholar] [CrossRef]
- Yang, N.; Wang, G.; Shi, Z.; Zhao, D.; Jiang, W.; Guo, L.; Liao, F.; Zhou, P. Application of multiple approaches to investigate the hydrochemistry evolution of groundwater in an arid region: Nomhon, Northwestern China. Water 2018, 10, 1667. [Google Scholar] [CrossRef] [Green Version]
- Ali, K.K.; Al-Kubaisi, Q.Y.; Al-Paruany, K.B. Isotopic study of water resources in a semi-arid region, western Iraq. Environ. Earth Sci. 2015, 74, 1671–1686. [Google Scholar] [CrossRef]
- Mo, C.; Ruan, Y.; Xiao, X.; Lan, H.; Jin, J. Impact of climate change and human activities on the baseflow in a typical karst basin, Southwest China. Ecol. Indic. 2021, 126, 107628. [Google Scholar] [CrossRef]
- Kong, F.; Song, J.; Zhang, Y.; Fu, G.; Cheng, D.; Zhang, G.; Xue, Y. Surface Water-Groundwater Interaction in the Guanzhong Section of the Weihe River Basin, China. Groundwater 2018, 57, 647–660. [Google Scholar] [CrossRef]
- Tian, Y.; Zheng, Y.; Zheng, C.; Xiao, H.; Fan, W.; Zou, S.; Wu, B.; Yao, Y.; Zhang, A.; Liu, J. Exploring scale-dependent eco-hydrological responses in a large endorheic river basin through integrated surface water-groundwater modeling. Water Resour. Res. 2015, 51, 4065–4085. [Google Scholar] [CrossRef]
- Zhao, D.; Wang, G.; Liao, F.; Yang, N.; Jiang, W.; Guo, L.; Liu, C.; Shi, Z. Groundwater-surface water interactions derived by hydrochemical and isotopic (222Rn, deuterium, oxygen-18) tracers in the Nomhon area, Qaidam Basin, NW China. J. Hydrol. 2018, 565, 650–661. [Google Scholar] [CrossRef]
- Sterte, E.J.; Johansson, E.; Sjöberg, Y.; Karlsen, R.H.; Laudon, H. Groundwater-surface water interactions across scales in a boreal landscape investigated using a numerical modelling approach. J. Hydrol. 2018, 560, 184–201. [Google Scholar] [CrossRef]
- Yang, J.; Yu, Z.; Yi, P.; Frape, S.K.; Gong, M.; Zhang, Y. Evaluation of surface water and groundwater interactions in the upstream of Kui river and Yunlong lake, Xuzhou, China. J. Hydrol. 2020, 583, 124549. [Google Scholar] [CrossRef]
- Gil-Márquez, J.M.; Andreo, B.; Mudarra, M. Combining hydrodynamics, hydrochemistry, and environmental isotopes to understand the hydrogeological functioning of evaporite-karst springs. An example from southern Spain. J. Hydrol. 2019, 576, 299–314. [Google Scholar] [CrossRef]
- Yang, N.; Zhou, P.; Wang, G.; Zhang, B.; Shi, Z.; Liao, F.; Li, B.; Chen, X.; Guo, L.; Dang, X.; et al. Hydrochemical and isotopic interpretation of interactions between surface water and groundwater in Delingha, Northwest China. J. Hydrol. 2021, 598, 126243. [Google Scholar] [CrossRef]
- Chiogna, G.; Santoni, E.; Camin, F.; Tonon, A.; Majone, B.; Trenti, A.; Bellin, A. Stable isotope characterization of the Vermigliana catchment. J. Hydrol. 2014, 509, 295–305. [Google Scholar] [CrossRef]
- Hu, H.Y.; Xie, Y.Z.; Liu, L. Characteristics Analysis of Hydrogen and Oxygen Isotopes of Rainfall Events in SiheRiver Basin of the Pearl River. China Rural. Water Hydropower 2020, 9, 95–99. (In Chinese) [Google Scholar]
- Yang, Z.; Zhou, Y.; Wenninger, J.; Uhlenbrook, S. A multi-method approach to quantify groundwater/surface water-interactions in the semi-arid Hailiutu River basin, northwest China. Hydrogeol. J. 2014, 22, 527–541. [Google Scholar] [CrossRef]
- Wen, G.; Wang, W.; Duan, L.; Gu, X.; Li, Y.; Zhao, J. Quantitatively evaluating exchanging relationship between river water and groundwater in Bayin River Basin of northwest China using hydrochemistry and stable isotope. Arid Land Geogr. 2018, 41, 734–743. (In Chinese) [Google Scholar]
- Sun, C.; Li, X.; Chen, Y.; Li, W.; Stotler, R.L.; Zhang, Y. Spatial and temporal characteristics of stable isotopes in the Tarim River Basin. Isot. Environ. Health Stud. 2016, 52, 281–297. [Google Scholar] [CrossRef]
- Lin, X.Y.; Liao, Z.S.; Qian, Y.P.; Su, X.S. Baseflow Separation for Groundwater Study in the Yellow River Basin, China. J. Jilin Univ. Earth Sci. Ed. 2009, 39, 959–967. (In Chinese) [Google Scholar] [CrossRef]
- Han, P.; Wang, Y.X.; Li, D.F. Spatial and Temporal Variations of Baseflow and Its Responses to Soil and Water Conservation in Hekouzhen—Longmen Section in the Middle Reaches of the Yellow River. J. Basic Sci. Eng. 2020, 3, 505–521. (In Chinese) [Google Scholar] [CrossRef]
- Shao, J.L.; Cui, Y.L.; Zhao, Y.Z.; He, G.P. Groundwater numerical modeling and its application in affected zone of the down-Yellow River (Henan Section). J. Jilin Univ. Earth Sci. Ed. 2003, 33, 51–55. [Google Scholar]
- Craig, H. Isotopic variation in Meteoric Waters. Science 1961, 133, 1702–1703. [Google Scholar] [CrossRef]
- Fan, B.L.; Zhang, D.; Tao, Z.H.; Zhao, Z.Q. Compositions of hydrogen and oxygen isotope values of Yellow River water and the response to climate change. China Environ. Sci. 2017, 37, 1906–1914. (In Chinese) [Google Scholar]
- Cao, J.F.; Ye, X.Y.; Wang, F.G.; Zhao, L. The division and analysis of groundwater system of the Yellow river watershed in Henan Province. J. Jilin Univ. Earth Sci. Ed. 2002, 32, 251–254. [Google Scholar]


| No. | δDV-SMOW‰ | δ18OV-SMOW‰ | Remark |
|---|---|---|---|
| TY1 | −52.5 | −6.77 | Yellow River |
| TY2 | −59.3 | −8.25 | Groundwater |
| TY3 | −63.5 | −8.78 | |
| TY4 | −63.1 | −8.455 | |
| TY5 | −62.7 | −8.29 | |
| TY6 | −62 | −8.59 | |
| TY7 | −65.1 | −9.06 | |
| TY8 | −58.8 | −7.94 | |
| TY9 | −59.7 | −8.07 | |
| TY10 | −60.4 | −8.29 | |
| TY11 | −61.2 | −8.37 | |
| TY12 | −61.3 | −8.33 | |
| TY13 | −66.1 | −9.02 | |
| TY14 | −65.4 | −8.65 | |
| TY15 | −61.8 | −8.18 | |
| TY16 | −65.1 | −8.82 | |
| Groundwater average | −62.37 | −8.47 |
| No. | TY1 | TY2 | TY3 | TY4 | TY5 | TY6 | TY7 | TY8 |
|---|---|---|---|---|---|---|---|---|
| 3H (TU) | 14.37 | 5.67 | 1.98 | 4.53 | 4.98 | 1.97 | 1.98 | 13.56 |
| No. | TY9 | TY10 | TY11 | TY12 | TY13 | TY14 | TY15 | TY16 |
| 3H (TU) | 9.1 | 5.85 | 3.7 | 4.25 | 1.98 | 3.71 | 3.99 | 2.55 |
| Remark | TY1 was Yellow River, others were groundwater | |||||||
| North Bank | Proportion | South Bank | Proportion |
|---|---|---|---|
| TY8 | 0.404 | TY2 | 0.485 |
| TY9 | 0.438 | TY3 | 0.625 |
| TY10 | 0.496 | ||
| average | 0.446 | average | 0.555 |
| Overall average | 0.501 | ||
| Location | Permeability Coefficient K (m/d) | Average Aquifer Thickness (m) | Hydraulic Gradient (%) | Single-Width Lateral Seepage (m3/a·m) |
|---|---|---|---|---|
| I section of the north | 28.1 | 80 | 0.18 | 1476.94 |
| I section of the south | 22 | 75 | 0.11 | 662.48 |
| II section of the north | 22 | 45 | 0.14 | 505.89 |
| II section of the north | 13 | 48 | 0.18 | 409.97 |
| III section of the north | 14 | 40 | 0.02 | 40.88 |
| IV section of the north | 12 | 25 | 0.06 | 65.7 |
| Budget Items: 104 m3/a | Quantity | Proportion | |
|---|---|---|---|
| Recharge items | Precipitation infiltration recharge | 175,579.86 | 55.70% |
| Yellow River seepage recharge | 25,114.36 | 7.97% | |
| Groundwater lateral runoff recharge | 18,089.94 | 5.74% | |
| Irrigation recharge | 34,528.98 | 10.95% | |
| River seepage recharge | 14,520.88 | 4.61% | |
| Fishpond leakage recharge | 47,365.02 | 15.03% | |
| Total amount | 315,199.04 | / | |
| Discharge items | Domestic exploitation | 28,078.87 | 9.05% |
| Industrial exploitation | 33,258.92 | 10.72% | |
| Agricultural Exploitation | 82,520.3 | 26.59% | |
| Fishpond exploitation | 72,783.14 | 23.45% | |
| Groundwater lateral runoff discharge | 20,005.46 | 6.45% | |
| Evaporative discharge | 73,663.99 | 23.74% | |
| Total amount | 310,310.68 | / | |
| groundwater budget difference | 4888.36 |
Publisher’s Note: MDPI stays neutral with regard to jurisdictional claims in published maps and institutional affiliations. |
© 2022 by the authors. Licensee MDPI, Basel, Switzerland. This article is an open access article distributed under the terms and conditions of the Creative Commons Attribution (CC BY) license (https://creativecommons.org/licenses/by/4.0/).
Share and Cite
Li, X.; Yan, B.; Wang, Y.; Wang, X.; Li, Y.; Gai, J. Study of the Interaction between Yellow River Water and Groundwater in Henan Province, China. Sustainability 2022, 14, 8301. https://doi.org/10.3390/su14148301
Li X, Yan B, Wang Y, Wang X, Li Y, Gai J. Study of the Interaction between Yellow River Water and Groundwater in Henan Province, China. Sustainability. 2022; 14(14):8301. https://doi.org/10.3390/su14148301
Chicago/Turabian StyleLi, Xiaomeng, Baizhong Yan, Yuqing Wang, Xinzhou Wang, Yao Li, and Junbai Gai. 2022. "Study of the Interaction between Yellow River Water and Groundwater in Henan Province, China" Sustainability 14, no. 14: 8301. https://doi.org/10.3390/su14148301
APA StyleLi, X., Yan, B., Wang, Y., Wang, X., Li, Y., & Gai, J. (2022). Study of the Interaction between Yellow River Water and Groundwater in Henan Province, China. Sustainability, 14(14), 8301. https://doi.org/10.3390/su14148301