Article

The Economic Value of Wetlands in Urban Areas: The Benefits in a Developing Country

1
Department of Economics, Pontificia Universidad Javeriana de Cali, Cali 760031, Colombia
2
Department of Applied Economics, School of Economics and Business, Autonomous University of Barcelona (UAB), 08193 Barcelona, Spain
*
Author to whom correspondence should be addressed.
Sustainability 2022, 14(14), 8302; https://doi.org/10.3390/su14148302
Submission received: 18 May 2022 / Revised: 19 June 2022 / Accepted: 30 June 2022 / Published: 7 July 2022

Abstract

:
Urban growth has impacted natural ecosystems such as wetlands. This situation destabilizes the beneficial contributions of nature, generating a socioeconomic effect. There is a need to quantify the benefits of wetlands in developing countries and urban areas, where the growth of cities is fastest. This is the first valuation study of urban and peri-urban wetlands in Colombia. The methodology includes a benefit transfer (BT) method with a geographical information system (GIS) and an exploratory governance analysis. Because there are few studies on the economic valuation of urban wetlands in Latin America, we present a methodology of interest, which can be easily replicated in other cities of this subcontinent. Based on an economic approach, our results find that 76% of the total value of wetlands is provided by ecosystem services (ES) of existence and legacy value, followed by maintenance of the life cycle of migratory species and water supply. Urban areas are identified where users benefit more than areas where the population exerts greater pressure on wetlands. Weak governance is due to the disarticulation between regulation, land-use planning, and the social-ecological system. This research contributes to urban wetland management policies, as well as to sustainable solutions in cities.

1. Introduction

Wetland systems support human livelihoods and are critical to sustainable development [1]. Despite this, 50% of the total area of wetlands in the world has been lost because of agricultural activities, cattle ranching, mining, the growth of cities, and other human actions [1]. As a result of the degradation of wetlands in Colombia, the floods that occurred between 2010 and 2011 affected 31% of the country, generating considerable economic losses [2]. In the Cauca River Valley, 88% of the wetlands were lost, mainly because of drainage activities, land reclamation, river-channel regulation, and pollution [3]. The city of Cali has 61 wetlands within its urban area and 175 peri-urban wetlands, which have been affected by change of use and a deterioration of their ecosystems [4]. As in other regions and countries, the pursuit of short-run human wellbeing has been detrimental to biodiversity [5,6]. With the deterioration of the wetlands in Cali, some ecosystem services (ES) have been lost (e.g., carbon sequestration—thus increasing greenhouse gases). This situation must be quantified because it means that the loss or gain of values will ultimately be reflected in society. Therefore, if the value of the benefits provided by nature is understood, we can move closer to the development of sustainable cities [7].
Although there are some studies, reports, and inventories of wetlands [8] in South America, there are few studies on the economic valuation of wetlands in Colombia [9], none of which are conducted on urban ES valuation. A knowledge gap has therefore been identified regarding the valuation of urban wetlands in developing countries, since most of these have mainly been conducted in Europe, North America, and China [10].
ES valuation research, within the economic approach, recognizes that many of the services provided by nature are not found in the market and, therefore, their benefits have been underestimated, generating uncertainty with regard to their value [11]. In other words, it recognizes a market failure, which arises within the biodiversity field for several reasons: the market cannot make an efficient allocation of resources; there is no clear definition of property rights; and there are externalities that have not been included in economic models [12]. In this research, the benefits provided by wetlands (positive externalities) are determined to construct an estimated value to facilitate their understanding and their contribution to society.
From an institutional perspective, it has been suggested that natural resources should be understood as common-pool resources [13]. In other words, they are rivalrous in terms of consumption because natural resources become depleted. Nor can they be excluded because they are freely accessible to people. There is a need to develop institutional rules within social-ecological systems that allow the development of institutions that achieve optimum levels of cooperation from stakeholders [13].
This work performs a monetary valuation of urban and peri-urban wetlands of Cali from an economic approach with two specific objectives; to determine and value the ES of the wetlands in Cali, and to explore governance characteristics for the management of the wetlands. To carry out the first, we use a benefit transfer (BT) method with a geographical information system (GIS). To the second, we apply the principles of institutional design proposed by Anderies et al. [14].
It should be clarified that primary research is the first-best strategy in project evaluation, but when there are difficulties in carrying this out, as in the case of Cali, the benefit transfer methodology is the second-best alternative to evaluate management and policy impacts [15].
Benefit transfer is understood as the estimation of a value from a study site to be applied to a policy site, where the former has similar characteristics to the latter [16]. GIS is a technique that integrates geographically referenced information [17]. Beyond using a constructive replication of the GIS-supported benefit transfer method to achieve an economic valuation of wetlands in Cali, this research proposes a starting point to apply this methodology in urban wetlands in Latin America.
The results of this study provide a basis for policy implementation in urban wetland management in developing countries. In addition, this research provides information for assessment of land-use change and the impact of climate change on the city, cost-benefit analysis, ecosystem services compensation assessments, and social appropriation of knowledge, among other applications.

2. Materials and Methods

We have based our methodological proposal on Champ et al. [16] and Dupras et al. [18] to create Figure 1. We merged the methodological steps and propose a new step (step 7) in our research:
Step 1: Spatial definition of the study area. First, we worked with the files of the wetland inventory maps provided by the Administrative Department of Environmental Management of Cali (DAGMA) and Spatial Data Infrastructure of Cali (IDESC). Next, the data were obtained in the R programming language with the assigned attributes in terms of wetland type (urban or peri-urban), name, location, and area. Then we proceeded to superimpose the maps of the urban perimeter, comunas (a group of neighborhoods within a city), corregimientos (a territorial area, the jurisdiction of which depends on the municipality), rivers, streams, and wetlands to define the study area set out in Section 2.1.
Step 2: Identification of original research studies. ES that benefit Cali were proposed by Tabares-Mosquera et al. [19]. This, therefore, was our point of reference as established in Section 2.2. ES-estimated values from the study site are taken from Ecosystem Services Valuation Database (ESVD) [20]. ESVD gives the values in USD/ha/year, which were standardized in 2020 in international dollars. This database includes ES from inland wetlands that fall within the Economics of Ecosystems and Biodiversity (TEEB) classification and Common International Classification of Ecosystem Services (CICES) V.5 [21,22]. Therefore, the ESVD is defined as a reliable source for benefit transfer applied to this research. In addition, we have taken into account the study of Dayathilake et al. [23] to refine our valuation of the carbon sequestration service. Last, we differentiate the value per hectare of urban and peri-urban (rural) wetlands, following the study of Chaikumbung et al. [24], who state that urban wetlands are more valuable than rural wetlands. The authors explain these findings both by income differences and by the willingness to pay to protect wetlands among urban and rural inhabitants.
Step 3: Obtaining data from original research studies. The TEEB [21] classification is used as a reference to obtain the estimates of ES values of the study site. To obtain values from studies with similar characteristics to the policy site, the ESVD was filtered in terms of geographic coordinates, selecting those studies located within 23° north latitude and 23° south latitude (Tropical zone between the Tropic of Cancer triangle and Tropic of Capricorn triangle to which the Cali wetlands belong). Next, those values obtained through primary research were selected. Those corresponding to inland wetlands with local study scale located in developing countries were also selected. Moreover, aboveground and belowground carbon stock indicators from Dayathilake et al. [23] were taken and valued. Finally, considering that the coefficient on urban wetlands of meta-regression proposed by Chaikumbung et al. [24] is positive and statistically significant, we have taken into account this coefficient to differentiate the value of urban and peri-urban wetlands in Cali. See Section 2.4.
Steps 4, 5, and 6: Calculate measure of central tendency, transfer the mean value estimate, obtain total value, and spatial analysis of wetland valuation. Once the studies with the best fit for the conditions in Cali had been identified, the mean of the values obtained for each ES was calculated in USD/ha/year. Then we proceeded to calculate the total value of urban and peri-urban wetlands using Equation (3) in this paper. Next, the value of each wetland was calculated, and the maps of comunas and corregimientos were superimposed, obtaining the total valuation by zone. Last, the per capita value was obtained, considering the projected population in 2020. The results are presented in Section 3.
Step 7: Wetland valuation and governance. An exploratory review of the governance system in Cali was taken. The results are presented in Section 3.5, followed in Section 4.3 by the proposal of a link between economic valuation of wetlands in Cali and governance.

2.1. Study Area

This research is located in the Valle del Cauca region in southwestern Colombia, which is one of the most biodiverse countries on Earth (see https://www.un.org/es/cr%C3%B3nica-onu/celebrando-y-salvaguardando-la-biodiversidad-para-evitar-la-siguiente-pandemia (accessed on 12 May 2022) for more information). The River Cauca runs through the region from south to north, where swamps and marshes are common as a result of river flooding. It has fertile land suitable for agriculture, natural pastures, and livestock [25]. Toward the flat region of the valley is Cali, which stands out for its richness in bird species, which include 487 breeding residents, 72 migratory species, and 2 introduced species [26].
The city of Cali extends into 56,168 hectares. This is located at latitude 3°27′26″ N and longitude 76°31′42″ W and lies 1079.5 m above sea level. The average temperature is 24.3 °C, and the average annual relative humidity is 77.2%. By 2020 Cali had a projected population of 2,496,442 inhabitants with a gross density of 44.56 inhabit/ha [27,28]. In 2019, its GDP per capita was USD 6474 (this value is used as a proxy in the absence of municipal accounts, which is reported by the Administrative Department of Planning of the city) (current prices) with a 4.5% share of national GDP. In 2018, the access of the population to outdoor recreational areas was 0.52 m2/inhabitant [27]. This figure is below the recommendations of the World Health Organization (9 m2/inhabitant) [29].
The research area is located within the social-ecological structure of Cali, which was defined by Tabares-Mosquera et al. [19] taking into account land cover as a unit of analysis, as well as the urban-functional and ecological-biophysical factors of the region. Figure 2 shows the study area with 61 urban wetlands and 175 peri-urban wetlands with 33 ha and 217 ha respectively. The urban wetlands of Cali are similar in extension to the London Wetland Centre, UK (42 ha) and Kranji Marshes, Singapore (56.8 ha). The peri-urban wetlands of Cali are similar in extension to the wetlands in Sydney Olympic Park, Australia (175 ha) [30].
The proportion of inland waters in Colombia by thousands of hectares corresponds to 3225 ha (inland wetlands included) compared to 2043 ha in Mexico and 38,648 ha in Latin America and the Caribbean [31].

2.2. Ecosystem Services

Different ES taxonomies have been developed by the scientific community in conjunction with intergovernmental entities such as the Millennium Ecosystem Assessment (MEA), TEEB, European Environment Agency (EEA), and Intergovernmental Science-Policy Platform on Biodiversity and Ecosystem Services (IPBES). The economic valuation of ES of this study is based on TEEB classification with the categories: provisioning, regulatory, cultural, and habitat services [21].
The characterization of ES of the wetlands in Cali is taken from the study by Tabares-Mosquera et al. [19]. This performs a nonmonetary valuation of ES based on a consulting panel of experts regarding the capacity to provide and demand ES within the social-ecological system of the city. The authors propose ES of the CICES V.4.3 classification [32] that are applicable to the land within the area of the city.
Table 1 shows the ES valued. Note that the value estimates used correspond to 11 ES. We did not value other ES proposed by Tabares-Mosquera et al. [19] because of a lack of data. This situation impacts the economic valuation of wetlands in Cali because there are unvalued ES.

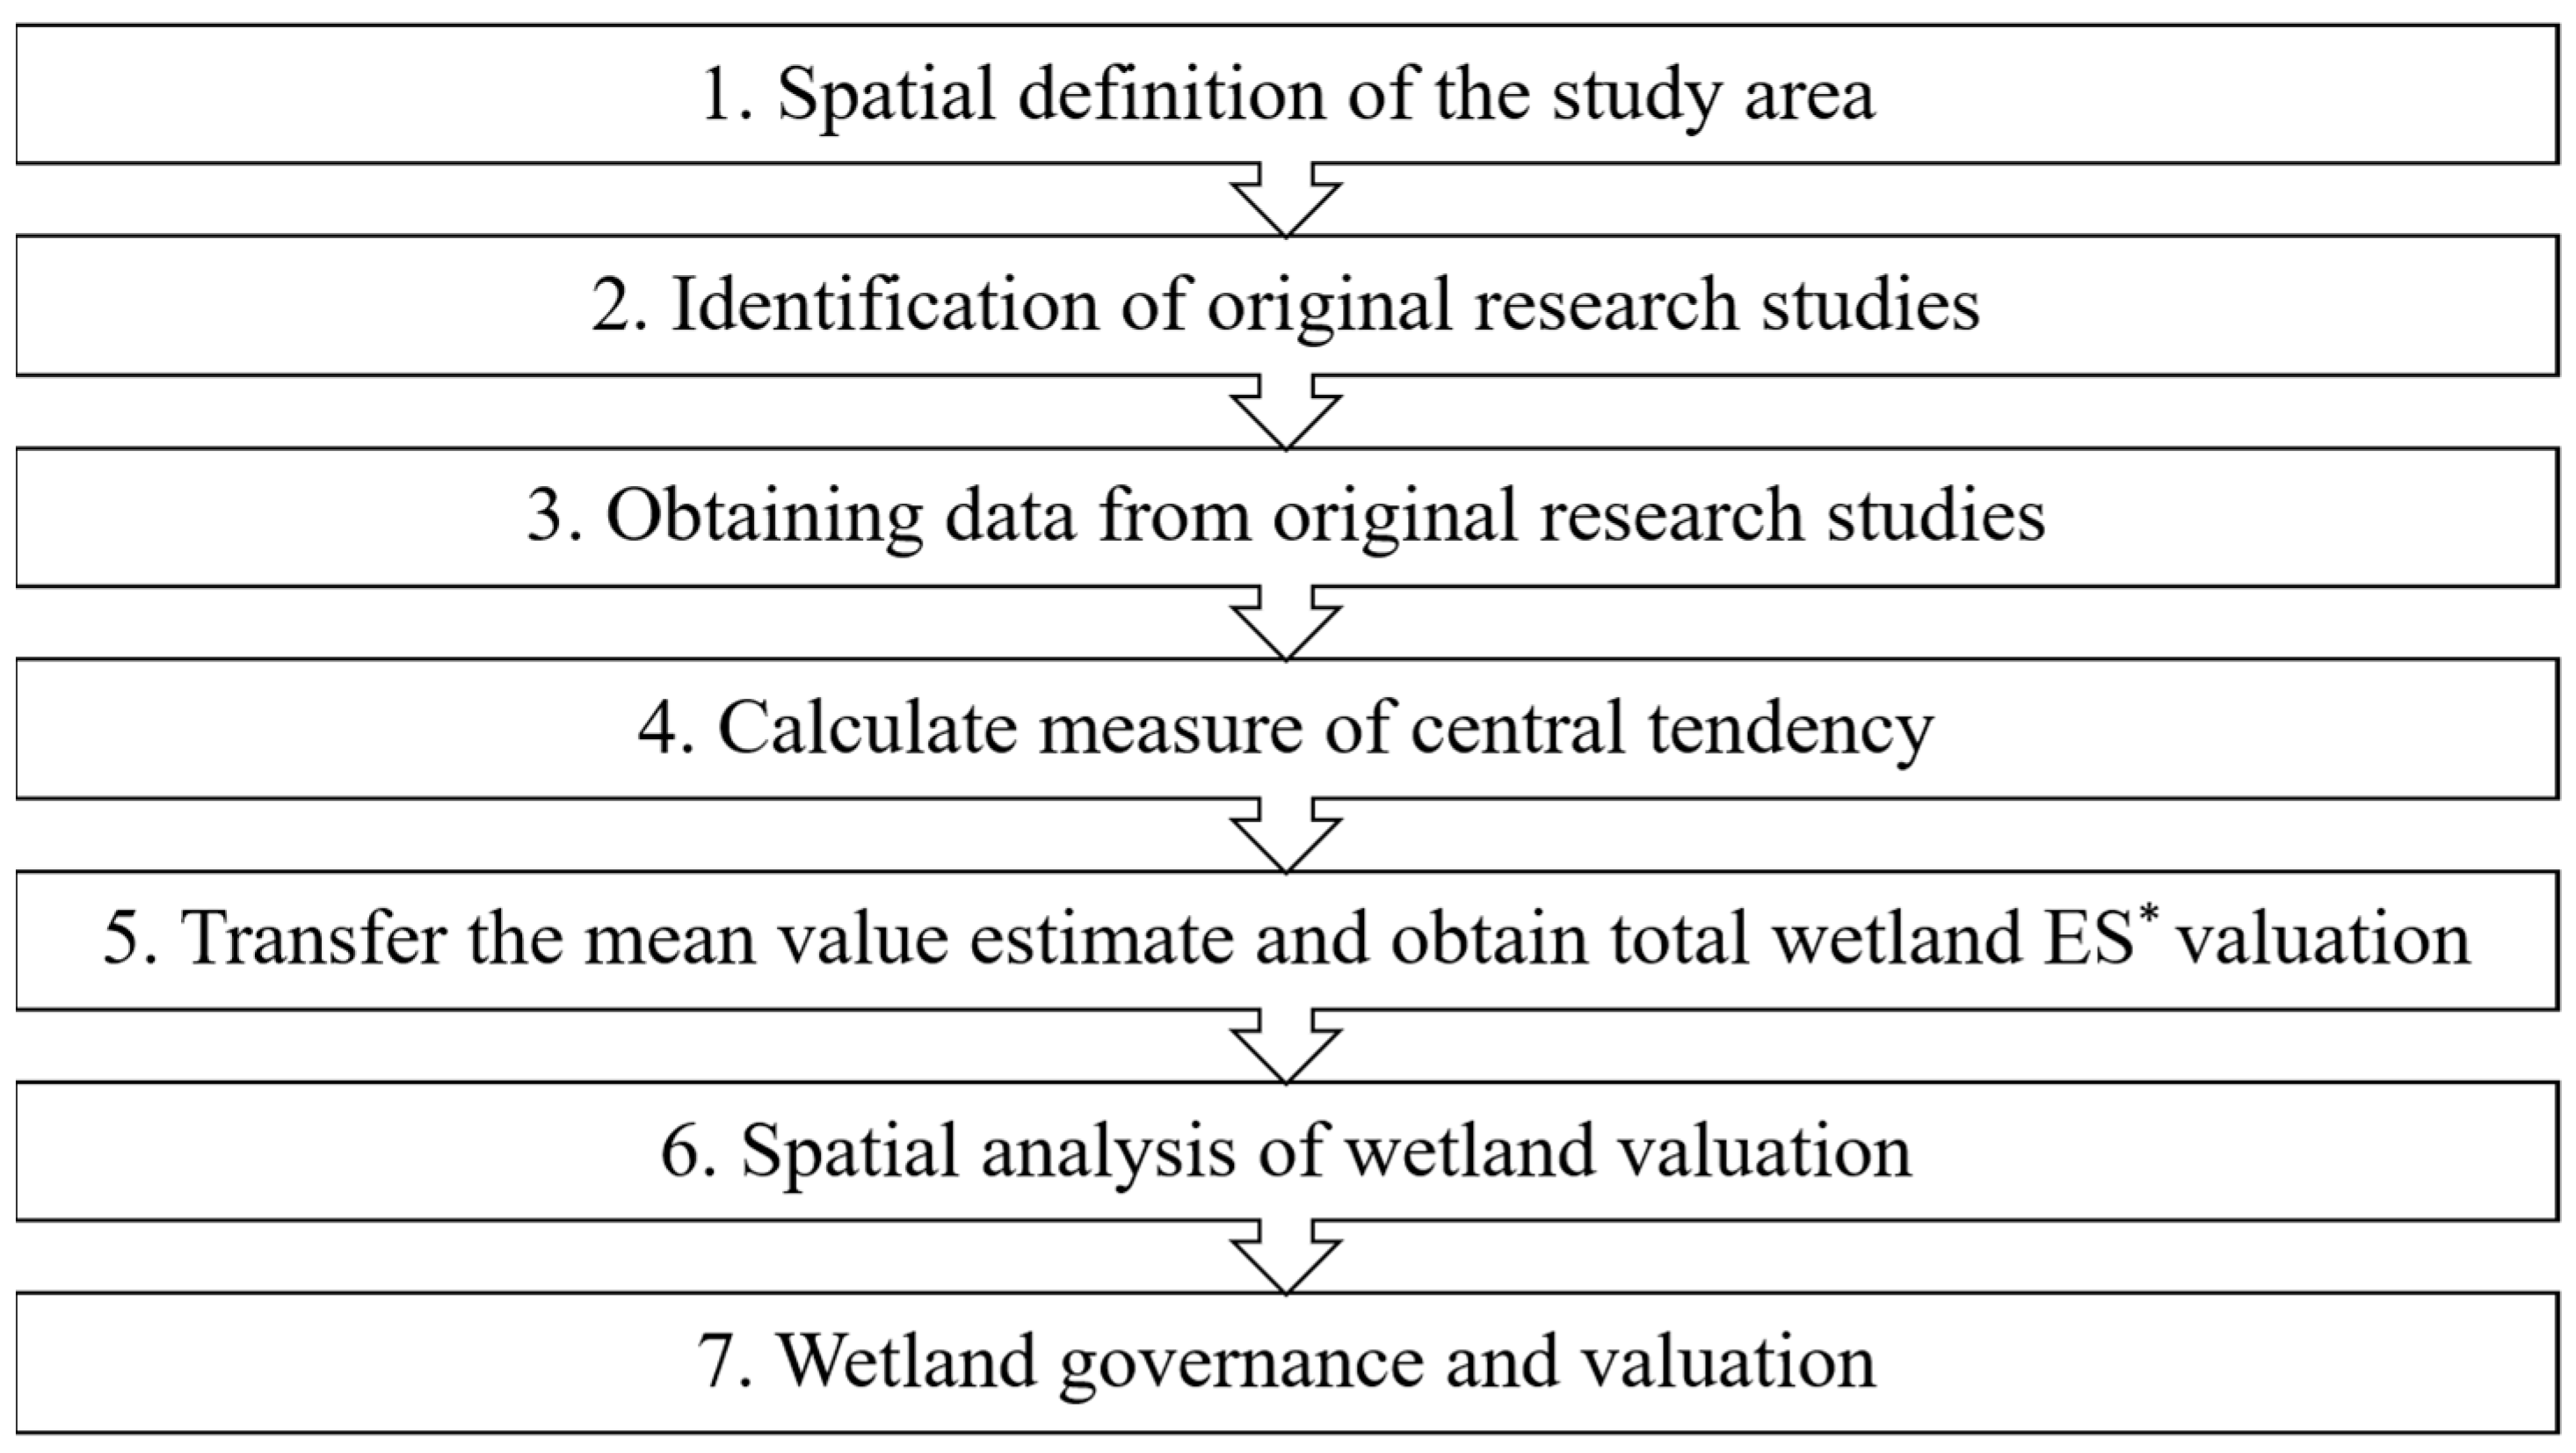
2.3. Benefit Transfer Method

Benefit transfer is the application of values and/or data from one V S j study site to another that has little or no information, known as the V P j policy site [15]. Among the categories of benefit transfer are value transfer, including measure of central tendency, point estimate and administratively approved estimate, and function transfer, including benefit function and meta-regression analysis function [16].
Benefit transfer has been widely applied in the ES valuation literature as a tool to inform policy makers [33,34]. This methodology complemented with GIS is applied in this study to perform a cross-sectional valuation. Benefit transfer with GIS includes bio-geophysical and sociodemographic elements applicable to the policy site; therefore, it is a viable alternative in the valuation of environmental goods and services [35].
To value urban and peri-urban wetlands in Cali, a central tendency is used following the methodology of Champ et al. [16]. This is based on taking the average value from studies of the literature, which can be defined as shown in Equation (1):
V P j | Q P j =   V ¯ S | Q ¯ S
where V P j is the measure needed for the policy site j, given the characteristics of policy site Q P j . V ¯ S is the measure of central tendency of the studies of study site, given the characteristics of the study site Q ¯ S . The unit of measurement of the studies is in this case USD/ha/yr.
If the measure of the central tendency being worked on is the mean as shown in Equation (2), then:
V ¯ S | Q ¯ S = V C k j
where V C k j is the mean value of each ES for the policy site j and category k.
The total ES value of wetlands is calculated following the methodology of Dupras and Alam [36]. This is done by multiplying the total hectares by the mean value of each ES, as shown in Equation (3):
E S V k = j A k × V C k j
where E S V k corresponds to ES value of wetlands for category k (urban or peri-urban), A k hectares of wetlands for category k, and V C k j is the average value of each ES j in the category k.

2.4. Data

The ESVD and Dayathilake et al. [23] provided the original studies presented in Table 2, which served as the basis for the benefit transfer in Cali. There are 29 studies located in 18 developing countries.
Notice that the study site valuations differ widely. Despite their location in developing countries, only two have been performed in Latin America (Mexico and Guatemala). This situation confirms the need to carry out valuations of urban wetlands in South America. Furthermore, these studies are evaluating different kinds of ES. For this reason, the methodology of BT adopted by this research takes into account the mean value of each ES (94 value estimates in our case), as was explained in Section 2.3.
As we have mentioned before, the literature indicates that the economic value of urban wetlands is different from rural wetlands, being that urban wetlands more valuable [24]. This is why we carried out our urban wetland valuation taking into account the estimated coefficient of urban wetlands from meta-regression economic valuation by Chaikumbung et al. [24]. That is 2.531 (statistical significance at the 5% level of subgroup without marine); this coefficient shows that if there are urban wetlands, wetland values increase by approximately 2.531 times. See results in Section 3.1.

3. Results

3.1. Valuation

The benefit transfer method allowed us to obtain the mean for 11 ES and 94 value estimates, whose description was taken from TEEB [21]. Table 3 and Table 4 present the results of the Cali urban and peri-urban wetland valuation, which is USD 8,643,583. On one hand, the total value of urban wetlands is USD 2,388,942 (72,825 USD/ha/year). On the other hand, the total value of peri-urban wetlands is USD 6,254,641 (28,773 USD/ha/year). Urban and peri-urban wetland valuations represent 28% and 72% of total value, respectively. The lower proportion of the value of the former is a consequence of their smaller quantity and extension.
The highest valuations obtained are those of existence and legacy value (40%), maintenance of the life cycle of migratory species (23%), and water supply (13%). The first results can be understood as the heritage of future generations. In line with this, the land-use plan of Cali [38] includes wetlands as conservation and environmental protection areas. The second findings can be interpreted as the evidence of having shelter for animals. This is why bird watching is a common activity in Valle del Cauca (see https://ebird.org/region/CO-VAC?yr=all (accessed on 10 May 2022) for more information). The latter results suggest that wetlands in Cali have the potential to provide water for the inhabitants.
The following services are in lower proportions (24%). These values are understood as the potential to provide natural resources (11%), regulation services (9%), and cultural (4%) services to the city. Addressing regulation services, it should be clarified that carbon sequestration (climate regulation service) represents 3% of total valuation. This finding shows that the more wetlands are lost, the more greenhouse gas emissions increase. Moreover, in 2018, Latin America and the Caribbean reported 32% of greenhouse gas emissions by agriculture [31]. Thus, loss of wetlands and agricultural activities in the Valle del Cauca region are probably responsible for a greater impact of climate change at the local level.
The differential between the value of urban and rural wetlands can be explained by ecosystems found in peri-urban areas, which are subject to greater pressures caused by the occupation of territories by new housing developments, different types of governance, and different preferences between rural and urban inhabitants [39,40,41]. Additionally, perceptions of ES change from being perceived as livelihoods and local cultural amenities, in the case of rural wetlands, to aesthetic and recreational activities in urban areas [42,43].

3.2. Spatial Analysis

The valuation of wetlands in Cali is analyzed by taking into account their distribution by comunas and corregimientos. Figure 3 shows that the highest total value areas are between 445,879 and 3,906,323 USD/year. The lowest total value areas are between 663 and 5809 USD/year. These findings can be interpreted as the more wetlands there are, the more ES are available to Cali. Furthermore, the findings show from which places ES are supplied—in other words, which are the critical ecological zones. For instance, Comuna 22 has 50 urban wetlands and Comuna 13 has the biggest urban wetland in the city; thus, those wetlands have the highest ES valuation. Moreover, those wetlands have a potential to improve the quality life of people and biodiversity by promoting cultural services and shelter for species.
In addition, in Figure 4, we analyze and show the distribution of the value of the wetlands among the population of the comunas, corregimientos, and urban expansion zone. Note that Figure 3 and Figure 4 show a change in the incidence of the value that is due to the number of inhabitants in each zone. For instance, in Figure 4, the incidence of the value of wetlands is higher in Corregimientos La Castilla and Los Andes, owing to its low population density. Moreover, in Comunas 13, 15, and 17, which have the highest population concentrations in the city, the incidence of the value of wetlands is lower. This can be interpreted as the existence of areas where users enjoy greater benefits compared to others, where the population exerts greater pressure on the wetlands. Last, the per capita value of the urban expansion zone is likely to decline if housing projects threaten wetlands.

3.3. Robustness

Based on findings in the literature, which show a negative relationship between wetland value and wetland area [24,44], an additional filter is applied to the data selected. In this way, the wetland area of the source studies is restricted by selecting those smaller than 6000 ha, a dimension that includes two valuations in Latin America [37,45]. Twenty-seven value estimates were obtained, in seven ES, for wetlands located in eight developing countries. We proceeded to carry out benefit transfer as shown in Table 5 and Table 6 and obtained a value of 76,827 USD/ha/year and 30,354 USD/ha/year for urban and peri-urban wetlands, respectively. The results coincide with Chaikumbung et al. [24] and Woodward and Wui [44], where having smaller wetland areas has an increase in valuation. Additionally, the values obtained are similar to the benefit transfer of this research presented in Table 3 and Table 4.

3.4. Legal Framework

There are guidelines that contain the regulations that address the management of wetlands in Cali. First, there is the Convention on Wetlands of International Importance (Ramsar Convention). Colombia committed to the Ramsar Convention through Law 357 in 1997. Nationally, the Political Constitution of Colombia protects natural resources, regulates their exploitation, and creates control agencies. There are policies related to the integrated management of water resources such as the 2002 National Policy for Inland Wetlands. There is also the 2012 National Policy for the Integrated Management of Biodiversity and its Ecosystem Services (PNGIBSE). Regionally, the 2007 Agreement No. 038 of the Regional Autonomous Corporation of Valle del Cauca (CVC) declares the natural wetlands of the Valle del Cauca as a renewable natural resource reserve. Locally, the land-use plan of Cali [38], defines the conservation and environmental protection areas of the city that include water sources, surface streams, and wetlands.
This legal and regulatory framework provides the formal rules governing the management of urban and peri-urban wetlands in a centralized manner. This situation poses challenges to the collective actions that could contribute to wetland management, as well as enhancing the capacity of cities to promote environmental culture, which is the case studied by Nagendra and Ostrom [39] in peri-urban wetlands in Bangalore, India.

3.5. Governance

By reviewing the environmental management plans of wetlands available in Cali, an exploratory review of principles of institutional design proposed by Anderies et al. [14] was undertaken. The analysis shows that governance is weak in Cali; for example, there are issues to be solved in property rights, proportional equivalence in costs and benefits, efficient collective choice agreements, integrated monitoring indicators, and institutions adapted to the needs of users. The existence of regulations covering graduated sanctions, conflict resolution mechanisms, and recognition of organizational rights is highlighted.
Clearly defined boundaries: Twenty-two percent of the city’s urban wetlands are located on private land and 78% on public land. This means that there are users who do not have the right to enjoy the benefits of some wetland ES located on private properties. We are faced here with an unresolved problem of property rights and social justice.
Proportional equivalence between benefits and costs: Thirty-one percent of the urban wetland area is located in Comuna 22 where the socioeconomic level corresponds to the highest in the city. The wetlands in other areas are in poor condition and have a higher incidence of hostile actors such as gangs or criminality [46,47,48]. Despite that the wetlands of the city are protected, 27 are located in the urban expansion zone where housing activity is permitted. That is, these wetlands are in danger of being lost.
Collective choice agreements: There is representation of the population for wetland management. This is the case of the community action boards, local action boards, and committees that represent the community and environmental organizations. On the other hand, a lack of organization among communities occurs in wetland areas where there is limited supply of institutional services, as well as irregular settlements, and marginalization of these ecosystems in urban planning, among others [46,47].
Monitoring: The legal framework corresponds to political-administrative limits that go against the areas of environmental influence [19]. This encompasses areas that go beyond the boundaries of the department of Valle del Cauca. Connections and shared ecological monitoring with other local authorities are needed to carry out actions in regions that share ecological structures.
Gradual sanctions: The legal framework defines the uses of wetlands and water bodies, as well as the consequences of noncompliance [49].
Conflict resolution mechanisms: The legal framework includes instruments for conflict resolution [49].
Minimum recognition of organizational rights: Users have access to existing community action boards, local action boards, and on local and civic organizations. In Comuna 22, an outstanding case is that of water-user associations recognized as social stakeholders of the wetlands [50,51].
Nested enterprises: The institutions are perceived as rigid and often slow to respond, leading to inappropriate policy decisions [46].
In line with this, because of the weak governance that has been found, policy and decision makers in Cali are not well-informed. Insufficient attention is given to the economic valuation of wetlands in Cali as an input in project assessment. Therefore, if the benefits of wetlands are unknown, the cost-benefit analysis would not sufficiently take into account the benefits of biodiversity. For instance, a decision maker who is unaware of the economic value of maintenance of the life cycle of migratory species will not realize that birds will be impacted if a housing project is approved where a wetland exists. Consequently, the economic cost of damage could be higher than the benefits of the construction project.

4. Discussion

4.1. Comparison with Other Research

Table 7 shows the average value per ES of wetlands: developing countries, 236–6620 USD/ha/year/ES; developed countries, 2942–7403 USD/ha/year/ES; and global 2279 USD/ha/year/ES. On one hand, the meta-regressions by He et al. [52] and Chaikumbung et al. [24] show that the value of wetlands in developing countries is lower than in developed countries. This can reflect findings that explain that the value of wetlands is influenced by the level of development of the country, showing a higher value in those countries with higher GDP [24]. On the other hand, in developing countries, the valuation of peri-urban wetlands in Cali presents values lower than those obtained by Ibarra et al. [45] in Mexico City for the urban wetland of Xochimilco. This can be explained by the fact that evidence has been found where urban wetlands have a higher value than rural wetlands. This is due to urban residents having higher incomes than rural inhabitants, in addition to having different preferences. Citizens with higher incomes are also more willing to pay to protect wetlands [40,41]. Furthermore, the valuation of urban wetlands in Cali presents values that are higher than Ibarra et al. [45]. This can be understood by the findings in the literature that show a negative relationship between wetland value per hectare and wetland area [24,44]. Notice that the wetland of Xochimilco in Mexico is larger than the urban wetlands of Cali. At the same time, the value of urban wetlands obtained by Liu et al. [17] is lower than our value of urban wetlands. This can be due to urban wetlands in New Jersey being larger than urban wetlands in Cali.
However, the average value per ES in Cali is higher than Costanza et al. [11]. This can be attributed to the fact that this study performed worldwide valuations that do not report urban wetlands. Finally, the mean value of the studies analyzed by Chaikumbung et al. [24] includes rural and urban wetlands that mostly reflect valuations performed in Southeast Asian countries. They provide values that are very different from those obtained by Ibarra et al. [45] and the benefit transfer performed in Cali.
Regarding our methodological approach, one of the applications of the GIS-supported benefit transfer method in scientific literature consists of the combination of a land cover layer with another that represents the geography, which can be connected with ES facilitating their assessment [17]. In the context of our economic valuation, this methodology permits the analysis of physical and sociodemographic variables, such as the wetlands area and inhabitants around wetlands. As a result, we obtained the value of wetlands by zone, as well as per inhabitant. The first encourages policy makers to achieve policies for peri-urban wetlands (e.g., ecotourism), urban wetlands (e.g., appropriation of knowledge), and comunas of Cali (e.g., improvement of environmental culture). The second can be used as a starting point for payments of ecosystem services in the protection and conservation programs of wetlands.

4.2. Convergent Validity and Transfer Error

The concept of convergent validity has been discussed in the literature in the context of the benefit transfer applied to ES assessment. Thus, validity refers to the degree to which a construct is adequately measured. In this case, the construct refers to the estimate derived from the original study site, which is a proxy for the true value [17]. There are two ways to determine whether the measurements are valid: compare the value transferred with the value of an original study site conducted in the study area and compare two transferred values to determine the variability of the valuations [15]. Since there is no primary valuation study for wetlands in Cali, the second alternative is chosen to identify the convergence between the valuation performed and the benefit transfer calculated from another study with similar characteristics to the research area.
Validity is linked to the error generated during the process of benefit transfer in ES valuations. Plummer [53] identifies generalization error as the main source of errors in this methodology; there are uniformity error, sampling error, and regionalization error. The first occurs when it is assumed that the value of an ES is constant regardless of the land cover being analyzed. The second occurs with the bias in the selection of source studies (since the availability of these studies is sometimes very limited and there are few measurements). The third occurs when small study areas are taken as a reference, which may not be representative for extrapolation to a wider region [54]. Additionally, error measurement involves errors associated with the estimation of values of the source studies, which is linked to the methodology and quality of the study, and those inherent in the transfer process [17,55].
It is therefore necessary to ensure that the information is accurate and valid. Equation (4), proposed by Champ et al. [16], shows one way of measuring the accuracy of benefit transfer in which the error associated with benefit transfer is:
V T i =   V P j   +   σ i j
where V T i corresponds to the transferred value from study site i, V P j is the required value for policy site j, and σ i j is the transfer error. The error is calculated as the difference between the known value and the transferred value, measured in absolute percentage. In Equation (5), established by the same authors, the absolute error is:
% σ i j = | ( ( V T i V P j ) / V P j ) | × 100
As mentioned above, to identify the convergent validity of the benefit transfer of this research, two transferred values are compared to determine the variability of the valuations and the equations described are used to measure the transfer error. First, we selected the study by Ibarra et al. [45] conducted in Mexico City. They performed a monetary valuation of the Xochimilco urban wetland for three ES: waste treatment, climate regulation, and maintenance of the life cycles of migratory species. Second, we proceeded to perform benefit transfer based on the value of 13,796 USD/ha/year from Ibarra et al. [45]. Third, benefit transfer was carried out based on the estimates of ES values selected from our database for the three ES mentioned. Fourth, the variation between the two valuations was identified, finding an absolute error of 34% for peri-urban wetlands and 66% for urban wetlands. This is within the range of 4% to 191% found for wetlands by Morrison and Bennett [56].
Finally, it should be clarified that the uniformity error for this study is limited by taking value estimates from studies originating only from wetlands, so that ES values from other land cover are not involved. With regard to the sampling error, study selection bias has been declared because benefit transfer methodology requires obtaining studies with context characteristics similar to those in the policy site, which in this study are wetlands located in tropical zones in developing countries and continental areas. The regionalization error is dealt with by taking into account that the source studies include inland wetlands at a local level, but with a larger extension than the Cali wetlands. Therefore, it is expected that characteristics of small contexts will not be reflected in the value of the wetlands of the city. On the other hand, the error of the source studies is reduced because we worked with an ESVD database that has a peer review process, as well as published papers.

4.3. Economic Valuation and Governance

The economic valuation and governance system in Cali can be interpreted through the frameworks for integrated assessment and valuation of ecosystem services [57] and social-ecological systems [58]. The first framework takes into account ES that provide benefits to society (e.g., wetlands offer ES to Cali), as well as actors who assign economic, sociocultural, and ecological values to the ES. The second considers unit resources (e.g., a wetland), system resources (e.g., urban wetlands), governance systems, and actors. All of these interact with action situations that produce social and ecological outcomes (e.g., sustainable development and conservation policies of wetlands).
The above indicates that in the case of Cali, economic valuation is an input that interacts with actors and the governance system. As a result of these interactions, decision making is carried out to produce outcomes such as policies. To illustrate, because of the highest valuation of existence and legacy value and maintenance of the life cycles of migratory species, decision makers could enhance conservation policies, ecotourism, and the environmental culture in the city. Tabares-Mosquera et al. [19] confirms that these ES are relevant to the city. Therefore, there is a need for policies that are focused on these issues.
Kabil et al. [59] propose policies to enhance ecotourism and environmental education in protected areas through economic valuation, as a policy to support local, regional, and national economies. The wetlands of Cali are also considered as areas of conservation and environmental protection. These policies could thus stimulate economic activities in the city.
Addressing the subject of weak governance in Cali, the centralized government has to move toward governance that is more inclusive and well-informed. On one hand, decision makers must encourage collective actions where inhabitants’ points of view are taken in wetland management policies. On the other hand, policy makers should pay special attention to the provisions of the land-use planning, since approving changes in land use with misinformation could be detrimental to wetlands.
For the abovementioned reasons, findings of this research can be applied to urban wetlands from developing countries (e.g., Latin America). By encouraging wetland protection and restoration programs, local authorities could develop green infrastructure projects to compensate for areas where wetlands are absent or scarce. Likewise, by promoting greater community participation, social appropriation of the benefits of wetlands could be encouraged. As a result, these policies would foster environmental culture among city residents.

5. Conclusions

Using benefit transfer and supported by data provided by GIS, this study carried out a total valuation of 61 urban wetlands and 175 peri-urban wetlands in Cali, covering an area of 250 ha. The wetlands are part of the environmental influence area that provides ES to the city, benefiting the population, businesses, and institutions. The total annual value of wetlands in Cali is estimated as USD 8,643,583. Seventy-six percent of the total value of the wetlands is provided by the ES for existence and legacy value, maintenance of the life cycles of migratory species, and water supply. The per capita value of wetlands depends on the distribution of the population in the comunas and corregimientos of the city. The economic valuation is an approximate estimate that provides information on the benefits of wetlands, thus being a better alternative to not recognizing any value of these ecosystems. An exploratory analysis of governance suggests the need for a regulatory framework that aims at wetland protection, and which includes noncompliance with regulations, dispute settlement, and legal recognition of users.
The results of this research have theoretical, methodological, and public policy implications. The theoretical implications have to do with the identification and valuation of positive externalities provided by wetlands, which benefit society without users paying for them. The methodological implications refer to the constructive replication of the GIS-supported benefit transfer method to perform an economic valuation of wetlands. This is not an end in itself, since it requires developing and applying integral valuation methodologies that make it possible to understand their monetary and nonmonetary dimensions. The implications in terms of public policies are directed at the need to design dynamic institutions that allow for better coordination between environmental regulations, the land-use plan, and the social-ecological system of the city. This requires governance built on an understanding of the benefits provided by wetlands that places the needs of all users before particular short-run interests. For example, despite the national and regional legal framework that has guidelines related to the sustainable management of wetlands in the urban expansion zone, 27 wetlands are being pressured by housing projects. That is because the land-use plan has allowed construction projects in this area.
Regarding the limitations of this work, the economic valuation should be interpreted with caution, owing to the small number of studies found with similar characteristics to those of Cali (of which there are only two in Latin America). Selection bias is declared because the sample of source studies is not chosen randomly. Additionally, the assessment of the wetland area does not include the hydrological complex of rivers and streams that feed them, which is due to data limitations. Last, it should be clarified that governance analysis is exploratory, and it requires confirmatory empirical studies that could emerge as lines of research derived from this work.
This research is positioned as a starting point for urban wetland valuation studies in Colombia, as well as in Latin America. Research into valuations of the loss of ES is needed. An empirical analysis of the differences between urban and rural wetlands, in terms of user preferences and benefits is also necessary. Finally, it is necessary to continue research on the valuations of urban wetlands in developing countries to generate contributions to the development of their governance systems.

Author Contributions

Conceptualization, L.D.-P., L.S. and F.T.; formal analysis, L.D.-P.; investigation, L.D.-P.; methodology, L.D.-P., L.S. and F.T.; supervision, L.S. and F.T.; writing—original draft, L.D.-P.; writing—review and editing, L.S. and F.T. All authors commented on previous versions of the manuscript. All authors have read and agreed to the published version of the manuscript.

Funding

This research received no external funding.

Informed Consent Statement

Not applicable.

Data Availability Statement

Data are available from the corresponding authors upon reasonable request.

Acknowledgments

We would like to thank Mónica Patricia Londoño, Ana María Valencia, and Andrés Felipe Zamudio from DAGMA for providing the maps of the wetlands of the city. We thank Emmanuel Zapata from the Universidad de Valle for providing the maps of the area of environmental influence of Cali, ecological structures, and nonmonetary valuation findings. We also thank Jhon Jairo Alvarado for his support in GIS and R programming language. Last, we thank Michael Williams and Roger Simpson for their support in translation and English-language editing services.

Conflicts of Interest

The authors declare no conflict of interest.

References

  1. Ramsar. Perspectiva Mundial Sobre los Humedales, Conveción Ramsar Sobre los Humed. 2018, p. 88. Available online: https://www.ramsar.org/sites/default/files/documents/library/gwo_s.pdf (accessed on 24 June 2021).
  2. Ricaurte, L.F.; Olaya-Rodríguez, M.H.; Cepeda-Valencia, J.; Lara, D.; Arroyave-Suárez, J.; Finlayson, C.M.; Palomo, I. Future impacts of drivers of change on wetland ecosystem services in Colombia. Glob. Environ. Chang. 2017, 44, 158–169. [Google Scholar] [CrossRef]
  3. Ramsar. Technical Session/Séance Technique/Sesión Técnica, 10. 1996. Available online: https://www.ramsar.org/search?searchapiviewsfulltext=Summary+Report+of+Technical+Session+B (accessed on 18 January 2021).
  4. DAGMA. Actualización de Inventario de Humedales Urbanos de Santiago de Cali y Lineamientos para su Conservación en Predios Privados. DAGMA. 2018. Available online: https://www.cali.gov.co/dagma/publicaciones/138055/humedales-de-santiago-de-cali/ (accessed on 23 January 2021).
  5. MEA. Ecosystems and Human Well-Being: Wetlands and Water. World Resources Institute. 2005. Available online: https://millenniumassessment.org/en/ (accessed on 23 January 2021).
  6. Wang, C.; Wang, Y.; Wang, R.; Zheng, P. Modeling and evaluating land-use/land-cover change for urban planning and sustainability: A case study of Dongying city, China. J. Clean. Prod. 2018, 172, 1529–1534. [Google Scholar] [CrossRef]
  7. Filho, W.L.; Barbir, J.; Sima, M.; Kalbus, A.; Nagy, G.J.; Paletta, A.; Villamizar, A.; Martinez, R.; Azeiteiro, U.M.; Pereira, M.J.; et al. Reviewing the role of ecosystems services in the sustainability of the urban environment: A multi-country analysis. J. Clean. Prod. 2020, 262, 121338. [Google Scholar] [CrossRef]
  8. Hu, S.; Niu, Z.; Chen, Y.; Li, L.; Zhang, H. Global wetlands: Potential distribution, wetland loss, and status. Sci. Total Environ. 2017, 586, 319–327. [Google Scholar] [CrossRef]
  9. Sierra, L.; Marin, W.; Castro, L.; Hernández-Manrique, O. Economic Valuation of Benefits in Freshwater Ecosystems: Complex Wetlands System Belonging to the San Juan River in the Magdalena Medio Region, Colombia. Sustainability 2021, 13, 5374. [Google Scholar] [CrossRef]
  10. Haase, D.; Larondelle, N.; Andersson, E.; Artmann, M.; Borgström, S.; Breuste, J.; Gomez-Baggethun, E.; Gren, Å.; Hamstead, Z.; Hansen, R.; et al. A Quantitative Review of Urban Ecosystem Service Assessments: Concepts, Models, and Implementation. Ambio 2014, 43, 413–433. [Google Scholar] [CrossRef] [Green Version]
  11. Costanza, R.; d’Arge, R.; de Groot, R.; Farber, S.; Grasso, M.; Hannon, B.; Limburg, K.; Naeem, S.; O’Neill, R.V.; Paruelo, J.; et al. The value of the world’s ecosystem services and natural capital. Nature 1997, 387, 253–260. [Google Scholar] [CrossRef]
  12. Heal, G.M. The Economic Case for Protecting Biodiversity; National Bureau of Economic Research: Cambridge, MA, USA, 2020.
  13. Ostrom, E. Beyond Markets and States: Polycentric Governance of Complex Economic Systems. Am. Econ. Rev. 2010, 100, 641–672. [Google Scholar] [CrossRef] [Green Version]
  14. Anderies, J.M.; Janssen, M.A.; Ostrom, E. A Framework to Analyze the Robustness of Social-ecological Systems from an Institutional Perspective. Ecol. Soc. 2004, 9, 18. Available online: http://www.ecologyandsociety.org/vol9/iss1/art18/ (accessed on 2 May 2021). [CrossRef]
  15. Rosenberger, R.S.; Loomis, J.B. Using meta-analysis for benefit transfer: In-sample convergent validity tests of an outdoor recreation database. Water Resour. Res. 2000, 36, 1097–1107. [Google Scholar] [CrossRef]
  16. Champ, P.A.; Boyle, K.J.; Brown, T.C. A Primer on Nonmarket Valuation, 1st ed.; Springer: New York, NY, USA, 2003. [Google Scholar]
  17. Liu, S.; Costanza, R.; Troy, A.; D’Aagostino, J.; Mates, W. Valuing New Jersey’s Ecosystem Services and Natural Capital: A Spatially Explicit Benefit Transfer Approach. Environ. Manag. 2010, 45, 1271–1285. [Google Scholar] [CrossRef]
  18. Dupras, J.; Alam, M.; Réveret, J.-P. Economic value of Greater Montreal’s non-market ecosystem services in a land use management and planning perspective. Can. Geogr./Le Géographe Can. 2015, 59, 93–106. [Google Scholar] [CrossRef]
  19. Tabares-Mosquera, M.; Zapata-Caldas, E.; Buitrago-Bermudez, O. Valuation of Ecosystem Services for the Identification of Metropolitan Ecological Structures: The Case of Cali, Colombia. Cuad. Investig. Geográfica 2020, 46, 603–631. [Google Scholar] [CrossRef] [Green Version]
  20. De Groot, R.; Brander, L.; Solomonides, S. Ecosystem Services Valuation Database (ESVD) Version June 2020, Defra, UK. 2020. Available online: www.es-partnership.org/esvd (accessed on 2 February 2021).
  21. TEEB. Integrating the Ecological and Economic Dimensions in Biodiversity and Ecosystem Service Valuation, TEEB. 2010. Available online: http://teebweb.org/publications/teeb-for/research-and-academia/ (accessed on 8 February 2021).
  22. Haines-Young, R.; Potschin-Young, M. Revision of the common international classification for ecosystem services (CICES Version 5.1): A policy brief. One Ecosyst. 2018, 3, e27108. [Google Scholar] [CrossRef]
  23. Dayathilake, D.D.T.L.; Lokupitiya, E.; Wijeratne, V.P.I.S. Estimation of aboveground and belowground carbon stocks in urban freshwater wetlands of Sri Lanka. Carbon Balance Manag. 2020, 15, 17. [Google Scholar] [CrossRef] [PubMed]
  24. Chaikumbung, M.; Doucouliagos, H.; Scarborough, H. The economic value of wetlands in developing countries: A meta-regression analysis. Ecol. Econ. 2016, 124, 164–174. [Google Scholar] [CrossRef]
  25. DAP. Datos de Cali y el Valle del Cauca. 2017. Available online: https://www.cali.gov.co/gobierno/publicaciones/227/datosdecaliyelvalledelcauca/ (accessed on 30 August 2020).
  26. Palacio, R.D.; Vidal-Astudillo, V.; Cárdenas, G.; Luna-Solarte, J. Aves del municipio de Santiago de Cali, Valle del Cauca, Colombia. Biota Colomb. 2018, 18, 229–239. [Google Scholar] [CrossRef] [Green Version]
  27. DAP. Cali en Cifras 2018–2019, DAP. 2019. Available online: https://www.cali.gov.co/planeacion/publicaciones/138164/cali-en-cifras/ (accessed on 28 October 2020).
  28. DAP. Cali en Cifras 2020. DAP. 2020. Available online: http://www.cali.gov.co/planeacion/publicaciones/137803/documentos-de-cali-en-cifras/ (accessed on 10 March 2021).
  29. Camps-Calvet, M.; Langemeyer, J.; Calvet-Mir, L.; Gómez-Baggethun, E. Ecosystem services provided by urban gardens in Barcelona, Spain: Insights for policy and planning. Environ. Sci. Policy 2016, 62, 14–23. [Google Scholar] [CrossRef]
  30. WWT Consulting. Good Practices Handbook for Integrating Urban Development and Wetland Conservation. 2018, p. 50. Available online: https://www.wwtconsulting.co.uk/wp-content/uploads/2018/10/Good-practices-urban-wetlands-handbook-181004-FOR-WEBSITE.pdf (accessed on 12 May 2022).
  31. CEPAL. Statistical Yearbook for Latin America and the Caribbean. 2021. Available online: https://repositorio.cepal.org/handle/11362/47827 (accessed on 12 May 2022).
  32. Haines-Young, R.; Potschin, M. Common International Classification of Ecosystem Services CICES, Version 4.3., EEA. 2013. Available online: https://cices.eu/resources/ (accessed on 9 December 2020).
  33. Campos, F.S.; David, J.; Lourenço-De-Moraes, R.; Rodrigues, P.; Silva, B.; da Silva, C.V.; Cabral, P. The economic and ecological benefits of saving ecosystems to protect services. J. Clean. Prod. 2021, 311, 127551. [Google Scholar] [CrossRef]
  34. Zhou, L.; Guan, D.; Huang, X.; Yuan, X.; Zhang, M. Evaluation of the cultural ecosystem services of wetland park. Ecol. Indic. 2020, 114, 122988. [Google Scholar] [CrossRef]
  35. Wilson, M.A.; Hoehn, J.P. Valuing environmental goods and services using benefit transfer: The state-of-the art and science. Ecol. Econ. 2006, 60, 335–342. [Google Scholar] [CrossRef]
  36. Dupras, J.; Alam, M. Urban Sprawl and Ecosystem Services: A Half Century Perspective in the Montreal Area (Quebec, Canada). J. Environ. Policy Plan. 2015, 17, 180–200. [Google Scholar] [CrossRef]
  37. Sención, G.J. Evaluación Económica de Humedales: Estudio de Caso de Humedales de Petexbatun-Petén, Guatemala. Universidad de la República. 2002. Available online: https://www.colibri.udelar.edu.uy/jspui/ (accessed on 30 March 2021).
  38. POT. Acuerdo N° 0373 de 2014 Por Medio del Cual se Adopta la Revisión Ordinaria de Contenido de Largo Plazo del Plan de Ordenamiento Territorial del Municipio de Santiago de Cali. Consejo Santiago de Cali. 2014. Available online: https://www.cali.gov.co/planeacion/publicaciones/106497/pot_2014_idesc/ (accessed on 21 April 2021).
  39. Nagendra, H.; Ostrom, E. Applying the social-ecological system framework to the diagnosis of urban lake commons in Bangalore, India. Ecol. Soc. 2014, 19, 67. [Google Scholar] [CrossRef]
  40. Mombo, F.; Lusambo, L.; Speelman, S.; Buysse, J.; Munishi, P.; Van Huylenbroeck, G. Scope for introducing payments for ecosystem services as a strategy to reduce deforestation in the Kilombero wetlands catchment area. For. Policy Econ. 2014, 38, 81–89. [Google Scholar] [CrossRef]
  41. Hassan, S.; Olsen, S.B.; Thorsen, B.J. Urban-rural divides in preferences for wetland conservation in Malaysia. Land Use Policy 2019, 84, 226–237. [Google Scholar] [CrossRef]
  42. D’Souza, R.; Nagendra, H. Changes in Public Commons as a Consequence of Urbanization: The Agara Lake in Bangalore, India. Environ. Manag. 2011, 47, 840–850. [Google Scholar] [CrossRef] [PubMed]
  43. Garnett, N.S. Managing the Urban Commons. Univ. PA. Law Rev. 2012, 160, 1995–2027. [Google Scholar] [CrossRef]
  44. Woodward, R.T.; Wui, Y.-S. The economic value of wetland services: A meta-analysis. Ecol. Econ. 2001, 37, 257–270. [Google Scholar] [CrossRef]
  45. Ibarra, A.A.; Zambrano, L.; Valiente, E.L.; Ramos-Bueno, A. Enhancing the potential value of environmental services in urban wetlands: An agro-ecosystem approach. Cities 2013, 31, 438–443. [Google Scholar] [CrossRef]
  46. CVC. Plan de Manejo Ambiental Laguna de Charco Azul, CVC. 2010. Available online: https://www.cali.gov.co/dagma/publicaciones/138913/humedal-charco-azul-cali/ (accessed on 11 May 2021).
  47. CVC. Plan de Manejo Ambiental del Humedal El Pondaje, CVC. 2017. Available online: https://www.cali.gov.co/documentos/1738/charco-azul/ (accessed on 6 April 2021).
  48. CVC. Plan de Manejo Ambiental Humedal Navarro, Municipio De Santiago de Cali, CVC. 2006. Available online: https://ecopedia.cvc.gov.co (accessed on 9 March 2021).
  49. The Nature Conservancy; Fundación Alma; Fundación Humedales; AUNAP. Estado de las Planicies Inundables y el Recurso Pesquero en la Macrocuenca y Propuesta para su Manejo Integrado; The Nature Conservancy: Arlington County, VA, USA, 2016; ISBN 978-958-8575-82-7. [Google Scholar]
  50. DAGMA. Plan de Manejo Ambiental Humedal La Babilla—Zanjón del Burro, DAGMA. 2012. Available online: https://www.cali.gov.co/dagma/publicaciones/138918/humedal-la-babilla-cali/ (accessed on 7 April 2021).
  51. DAGMA. Plan de Manejo Ambiental Humedal Panamericano, DAGMA. 2012. Available online: https://www.cali.gov.co/dagma/publicaciones/138921/lago-panamericano/ (accessed on 7 April 2021).
  52. He, J.; Moffette, F.; Fournier, R.; Revéret, J.-P.; Théau, J.; Dupras, J.; Boyer, J.-P.; Varin, M. Meta-analysis for the transfer of economic benefits of ecosystem services provided by wetlands within two watersheds in Quebec, Canada. Wetl. Ecol. Manag. 2015, 23, 707–725. [Google Scholar] [CrossRef]
  53. Plummer, M.L. Assessing benefit transfer for the valuation of ecosystem services. Front. Ecol. Environ. 2009, 7, 38–45. [Google Scholar] [CrossRef] [Green Version]
  54. Eigenbrod, F.; Armsworth, P.R.; Anderson, B.J.; Heinemeyer, A.; Gillings, S.; Roy, D.B.; Thomas, C.D.; Gaston, K.J. Error propagation associated with benefits transfer-based mapping of ecosystem services. Biol. Conserv. 2010, 143, 2487–2493. [Google Scholar] [CrossRef]
  55. Brouwer, R.; Langford, I.H.; Bateman, I.J.; Crowards, T.C.; Turner, R.K. A meta-analysis of wetland contingent valuation studies. Reg. Environ. Chang. 1999, 1, 1. Available online: https://link.springer.com/article/10.1007/s101130050007 (accessed on 12 September 2020). [CrossRef]
  56. Morrison, M.; Bennett, J. Choice Modelling, Non-Use Values and Benefit Transfer. Econ. Anal. Policy 2000, 30, 13–32. [Google Scholar] [CrossRef] [Green Version]
  57. De Groot, R.S.; Wilson, M.A.; Boumans, R.M.J. A typology for the classification, description and valuation of ecosystem functions, goods and services. Ecol. Econ. 2002, 41, 393–408. [Google Scholar] [CrossRef] [Green Version]
  58. Mcginnis, M.D.; Ostrom, E. Social-ecological system framework: Initial changes and continuing. Ecol. Soc. 2014, 19, 2. [Google Scholar] [CrossRef] [Green Version]
  59. Kabil, M.; Alayan, R.; Lakner, Z.; Dávid, L.D. Enhancing Regional Tourism Development in the Protected Areas Using the Total Economic Value Approach. Forests 2022, 13, 727. [Google Scholar] [CrossRef]
Figure 1. Methodological steps for economic valuation of wetlands in Cali. Note: * Ecosystem services. Source: Adapted from Champ et al. [16] and Dupras et al. [18].
Sustainability 14 08302 g001
Figure 2. Study Area. The geographic coordinates were provided by the Spatial Data Infrastructure of Cali and the resolution 055 of 2018 by the Administrative Department of Environmental Management of Cali. The red frame corresponds to the study site at national, regional and local level. The purple color on the red frame corresponds to the social-ecological structure of Cali proposed by Tabares-Mosquera et al. [19]. Both comunas of Cali (urban zone) and the urban expansion zone are shown in white. Corregimientos (peri-urban zone) are shown in gray. Rivers are shown in blue. Sixty-one urban wetlands are located in comunas and shown in green; 175 peri-urban wetlands are located in corregimientos and the urban expansion zone. These are shown in yellow. Note that most of these are small in their extension. The inventory of urban and peri-urban (rural) wetlands in Cali is available upon request.
Sustainability 14 08302 g002
Figure 3. Total valuation of wetlands by comunas and corregimientos. The high-value areas are highlighted in orange. The low-value areas are highlighted in blue. Note that comunas are numbered between 1 and 22. The corregimientos are indicated by their proper name. The expansion zone of the city is shown in yellow. There are no wetlands in zones that are shown in white.
Sustainability 14 08302 g003
Figure 4. Valuation of wetlands per capita. The high-value and low population density areas are highlighted in orange. The low-value areas and high population density are highlighted in blue. Note that comunas are numbered between 1 and 22. The corregimientos are indicated by their proper names. The expansion zone of the city is shown in yellow. There are no wetlands in zones that are shown in white.
Sustainability 14 08302 g004
Table 1. Ecosystem services valued in wetlands of Cali.
GroupDescription *
ProvisioningFood
Water
Raw material
Regulation and maintenanceClimate regulation **
Regulation of extreme events
Water flow regulation
Waste treatment
HabitatMaintenance of life cycle of migratory species
CulturalAesthetic information
Recreation and tourism
Existence and legacy value
Note: * Based on the description of TEEB [21] ecosystem services classification; ** this ecosystem service relates to carbon sequestration.
Table 2. Studies selected for the benefit transfer in Cali.
AuthorsCountryName of WetlandUSD/ha/yr *
Hanafi et al. Year 2014 °IndonesiaTapin District72,967.5
Midora y Anggraeni. Year 2006 °IndonesiaBatang Gadis National Park38,360.0
Mukherjee. Year 2008 °IndiaKalobaur beel (oxbow lake)32,955.7
Eaton y Sarch. Year 1997 °NigeriaHadejia-Nguru wetlands16,077.4
Ibarra et al. Year 2013 °MexicoXochimilco13,796.4 **
Emerton et al. Year 1998 °UgandaNakivubo10,019.8
Kadigi et al. Year 2005 °TanzaniaUsangu wetland and floodplain6531.9
Nalukenge et al. Year 2009 °UgandaPallisa District wetlands5754.9
Nuva. Year 2009 °IndonesiaGunung Gede Pangrango National Park4580.4
Karanja et al. Year 2001 °UgandaNamatala3475.0
Pallisa District wetlands318.8
Kakuru et al. Year 2013 °UgandaKyoga plains2818.3
Southwestern farmlands2208.0
Lake Victoria crescent2205.5
Gerrard. Year 2004 °LaosThat Luang Marsh2662.4
Dayathilake et al. [23] °°Sri LankaKolonnawa wetland and Thalawatugoda wetland park1522.8 ***
Hap et al. Year 2000 °CambodiaMuk Kompul and Ponheur Leu Districts320.5
Barbier et al. Year 1991 °NigeriaHadejia-Nguru311.2
Sención [37] °GuatemalaPetexbatu’n244.3
Munasinghe. Year 1993 °MadagascarMantadia National Park228.9
Le et al. Year 2016 °VietnamTam Dao National Park137.7
Siima et al. Year 2012 °TanzaniaKilombero77.9
Turpie et al. Year 1999 °MozambiqueBarotse floodplain75.9
Lower Shire wetlands21.2
Angella et al. Year 2014 °UgandaDohu Rice Irrigation system52.3
Abila y Othina Year 2006 °KenyaYala Wetland51.2
Loth. Year 2004 °CameroonWaza Logone42.6
Kasthala et al. Year 2008 °TanzaniaMtanza-Msona village wetlands15.2
Mireri et al. Year 2008 °KenyaTana River Delta7.5
Geta et al. Year 2015 °EthiopiaDechatu drainage basin3.9
Roy et al. Year 2012 °IndiaBhomra Beel0.6
Setlhogile et al. Year 2010 °BotswanaMakgadikgadi wetland0.6
Manlosa et al. Year 2013 °PhilippinesLayawan Watershed0.1
Note: * International dollars. Year 2020; ** This value includes carbon sequestration valuation = 421.34 USD/ha/yr; *** Aboveground carbon stock = 46.63 tC/ha, belowground carbon stock = 7.24 tC/ha and price EU allowances (EUA) = 28.27 USD/t; ° These studies and data are taken from the Ecosystem Services Valuation Database by De Groot et al. [20]; °° We have taken into account this study to refine our valuation of the carbon sequestration service.
Table 3. Total value of urban wetlands in Cali.
ES *N **Minimum MaximumSt. DeviationMeanTotal °
USD/ha/yr °USD/ha/yr °USD/ha/yr °USD/ha/yr °Urban
(33 ha)
Provisioning
Food240.52 65,000 13,904 5003 164,102
Water230.10 81,073 22,955 9261 303,807
Raw material251.03 40,692 8518 3342 109,636
Regulation and maintenance
Climate regulation21066 3854 1971 2460 80,709
Regulation of extreme events10.37 0.37 NA ***0.37 12
Water flow regulation34.87 449 253 156 5128
Waste treatment711 24,509 9210 3627 118,973
Habitat
Maintenance of life cycle of migratory species2348 33,379 23,356 16,864 553,195
Cultural
Aesthetic information11.02 1.02 NA *** 1.02 33
Recreation and tourism45.14 11,593 5725 3008 98,684
Existence and legacy value229,019 29,185118 29,102 954,662
9430,457 289,736 72,825 2,388,942
Note: * Ecosystem services; ** number of value estimates; *** does not apply; ° international dollars. Year 2020.
Table 4. Total value of peri-urban wetlands in Cali.
ES *N **Minimum MaximumSt. DeviationMeanTotal °
USD/ha/yr °USD/ha/yr °USD/ha/yr °USD/ha/yr °Peri-Urban
(217 ha)
Provisioning
Food240.20 25,6825494 1977 429,647
Water230.04 32,03290693659 795,416
Raw material250.41 16,077 3366 1320 287,044
Regulation and maintenance
Climate regulation2421 1523 779 972 211,309
Regulation of extreme events10.15 0.15NA *** 0.15 32
Water flow regulation32177100 62 13,425
Waste treatment749684 3639 1433 311,492
Habitat
Maintenance of life cycle of migratory species2138 13,188 9228 6663 1,448,356
Cultural
Aesthetic information10.40 0.40 NA *** 0.40 87
Recreation and tourism42 4580 2262 1189 258,371
Existence and legacy value211,465 11,531 47 11,498 2,499,462
9412,034114,475 28,7736,254,641
Note: * Ecosystem services; ** number of value estimates; *** does not apply; ° international dollars. Year 2020.
Table 5. Total value of urban wetlands in Cali with area constraint.
ES *N **Minimum MaximumSt. DeviationMeanTotal °
USD/ha/yr °USD/ha/yr °USD/ha/yr °USD/ha/yr °Urban
(33 ha)
Provisioning
Food865218 2101 2071 67,932
Water379 78,842 45,459 26,351 864,422
Raw material810 40,692 14,115 5806 190,451
Regulation and maintenance
Climate regulation21066 3854 1971 2460 80,709
Water flow regulation1449 449 NA *** 449 14,713
Waste treatment 437 24,509 12,133 6311 207,022
Habitat
Maintenance of life cycle of migratory species133,379 33,379 NA *** 33,379 1,094,962
2735,026 186,943 76,827 2,520,211
Note: * Ecosystem services; ** number of value estimates; *** does not apply; ° international dollars. Year 2020.
Table 6. Total value of peri-urban wetlands in Cali with area constraint.
ES *N **Minimum MaximumSt. DeviationMeanTotal °
USD/ha/yr °USD/ha/yr °USD/ha/yr °USD/ha/yr °Peri-Urban
(217 ha)
Provisioning
Food822062830 818 177,856
Water33131,15117,96110,4112,263,199
Raw material8416,07755772294 498,633
Regulation and maintenance
Climate regulation24211523779 972 211,309
Water flow regulation1177 177NA ***177 38,521
Waste treatment 415 968447942493542,018
Habitat
Maintenance of life cycle of migratory species113,188 13,188NA ***13,1882,866,789
2713,839 73,861 30,3546,598,324
Note: * Ecosystem services; ** number of value estimates; *** does not apply; ° international dollars. Year 2020.
Table 7. Valuation compared to other research.
AuthorsCountryWetlandha *Method **Year + USD/ha/yr ++ ES ° USD/ha/yr/ES ++
Costanza et al. [11]GlobalGeneric330,000,000 BT199722,790102279
Liu et al. [17]New Jersey, NJ, USAUrban329,608 BT, GIS 200411,76942942
He et al. [52]Quebec, Canada:
Africa, North America Asia, Europe Australia
Rural and urban:
Man-made, isolated, complex
NA ***MRA, GIS 201422,208 °° 37403
Chaikumbung et al. [24]Developing countries:
Asia, Africa, Latin America, Pacific Islands
Rural and urban:
Estuarine, riverine, marine, artificial, lacustrine, marshy among others
NA*** MRA 20022829 °°12 236
Ibarra et al. [45]MexicoUrban 2614RC, MP 202013,79634599
This studyCali, ColombiaUrban 33BT, GIS 202072,825116620
This studyCali ColombiaPeri-Urban217BT, GIS 202028,773112616
Note: * Hectares; ** BT: benefit transfer, GIS: geographical information system, MRA: meta-regression analysis, RC: replacement cost, MP: market prices; *** does not apply; + year of reported value; ++ international dollars. Year 2020; ° assessed ecosystem services; °° average per hectare value calculated from the meta-analysis database.
Publisher’s Note: MDPI stays neutral with regard to jurisdictional claims in published maps and institutional affiliations.

