
Ammonium Reactive Migration Process and Functional Bacteria Response along Lateral Runoff Path under Groundwater Exploitation


 , ,
, , 
Abstract
:1. Introduction
2. Materials and Methods
2.1. Description of the Study Site
2.2. Layout of Field Experimental Wells and Sampling Procedures
2.3. Analysis Methods for Groundwater Samples and Microbial Communities
2.4. The Experiment Conditions Setting and Analysis Method for NH4+ Sorption Process
3. Results and Discussion
3.1. Groundwater Level Variations and Hydrochemistry Analysis
3.2. Temporal Variations of NH4+ and NO3− Concentration in Groundwater during the Pumping Test
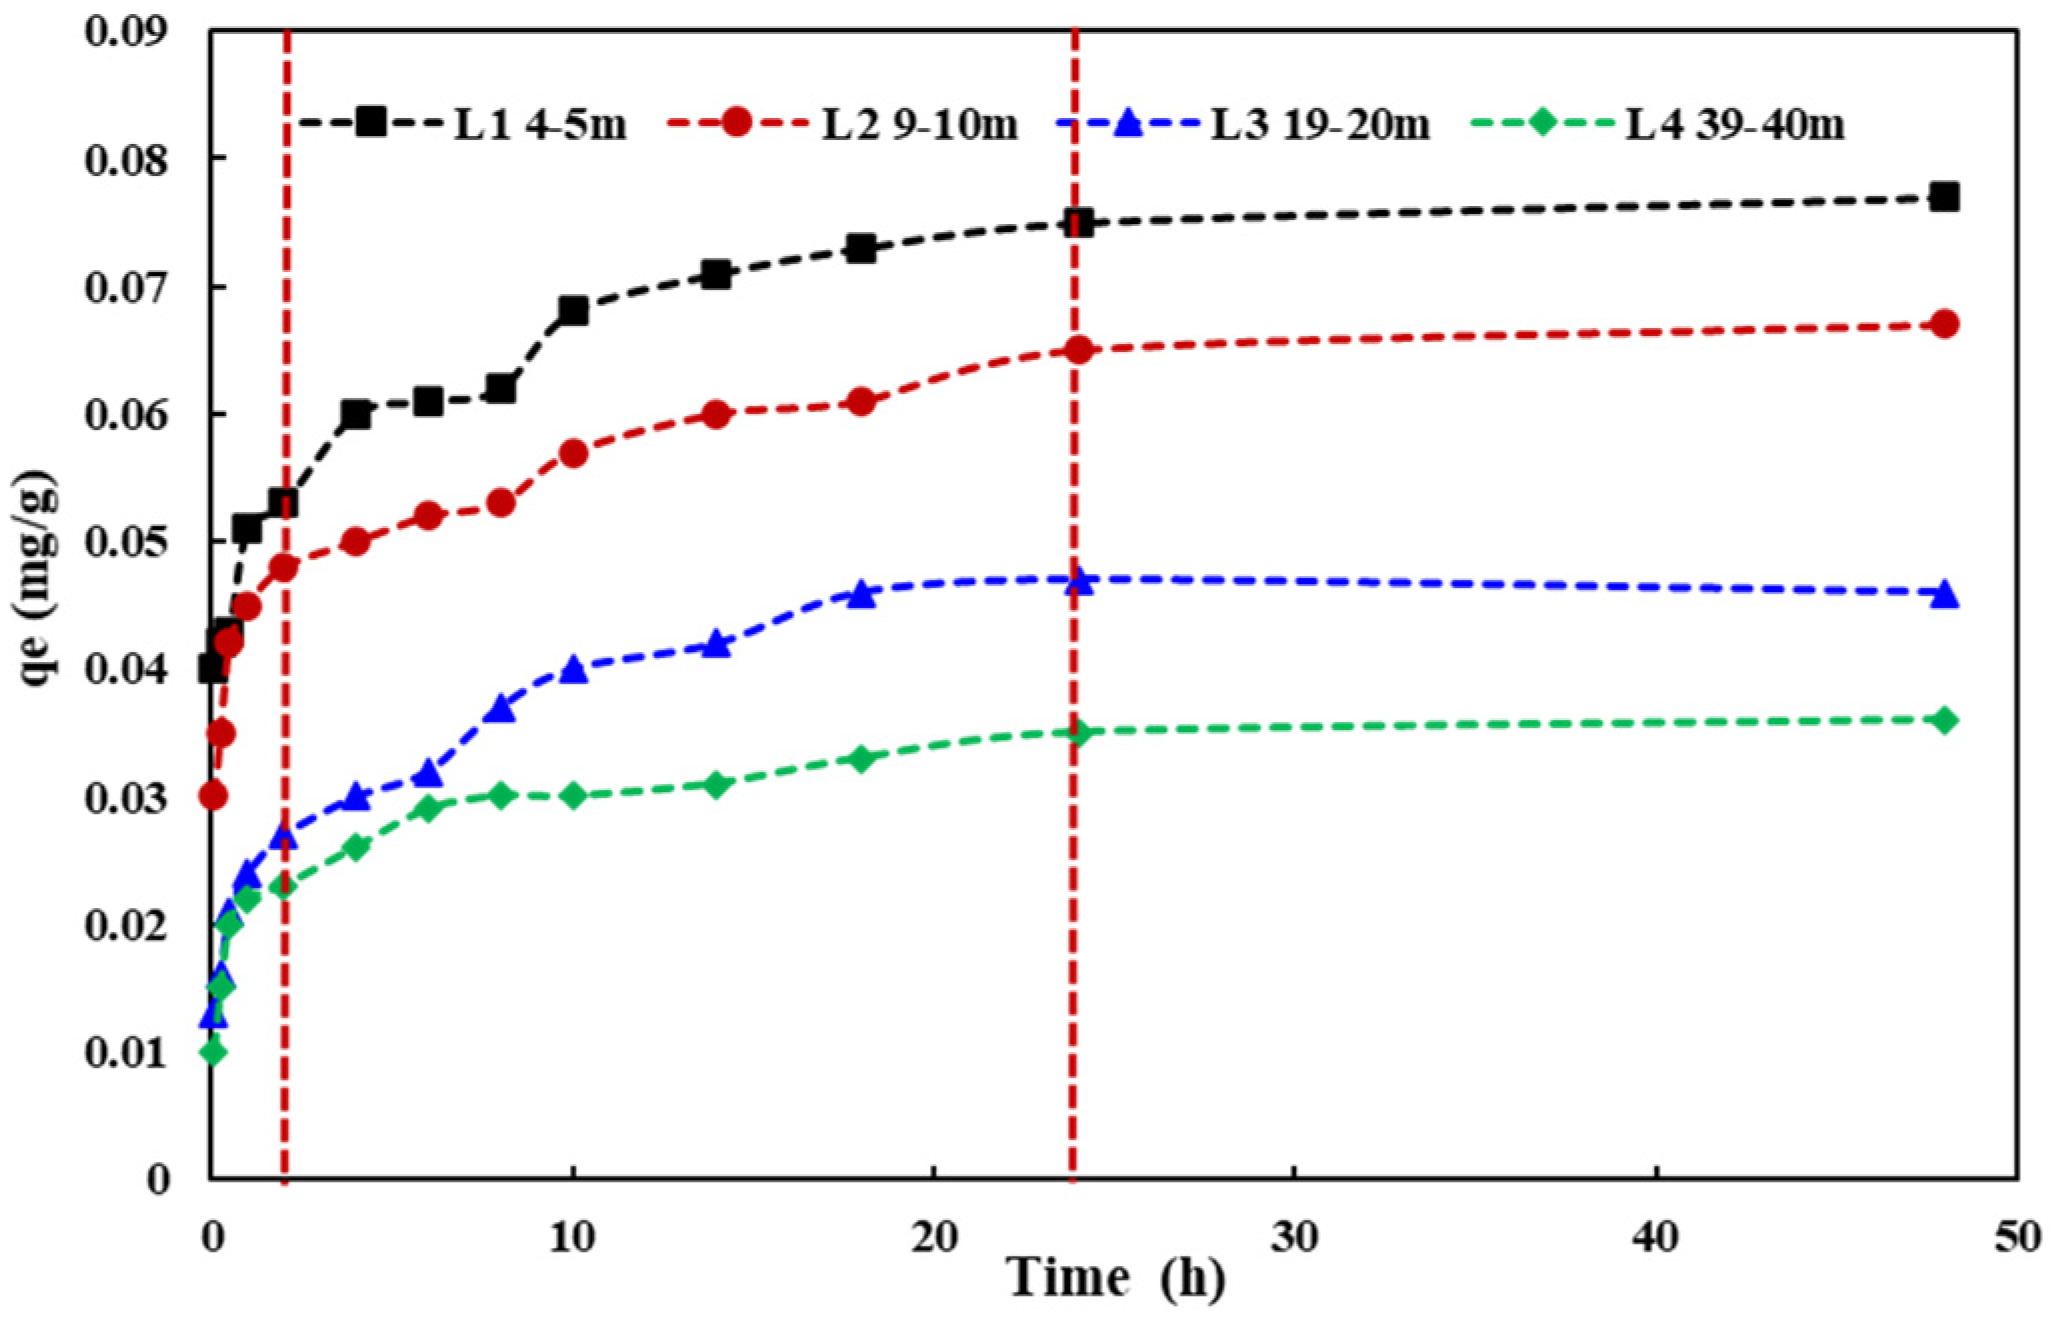
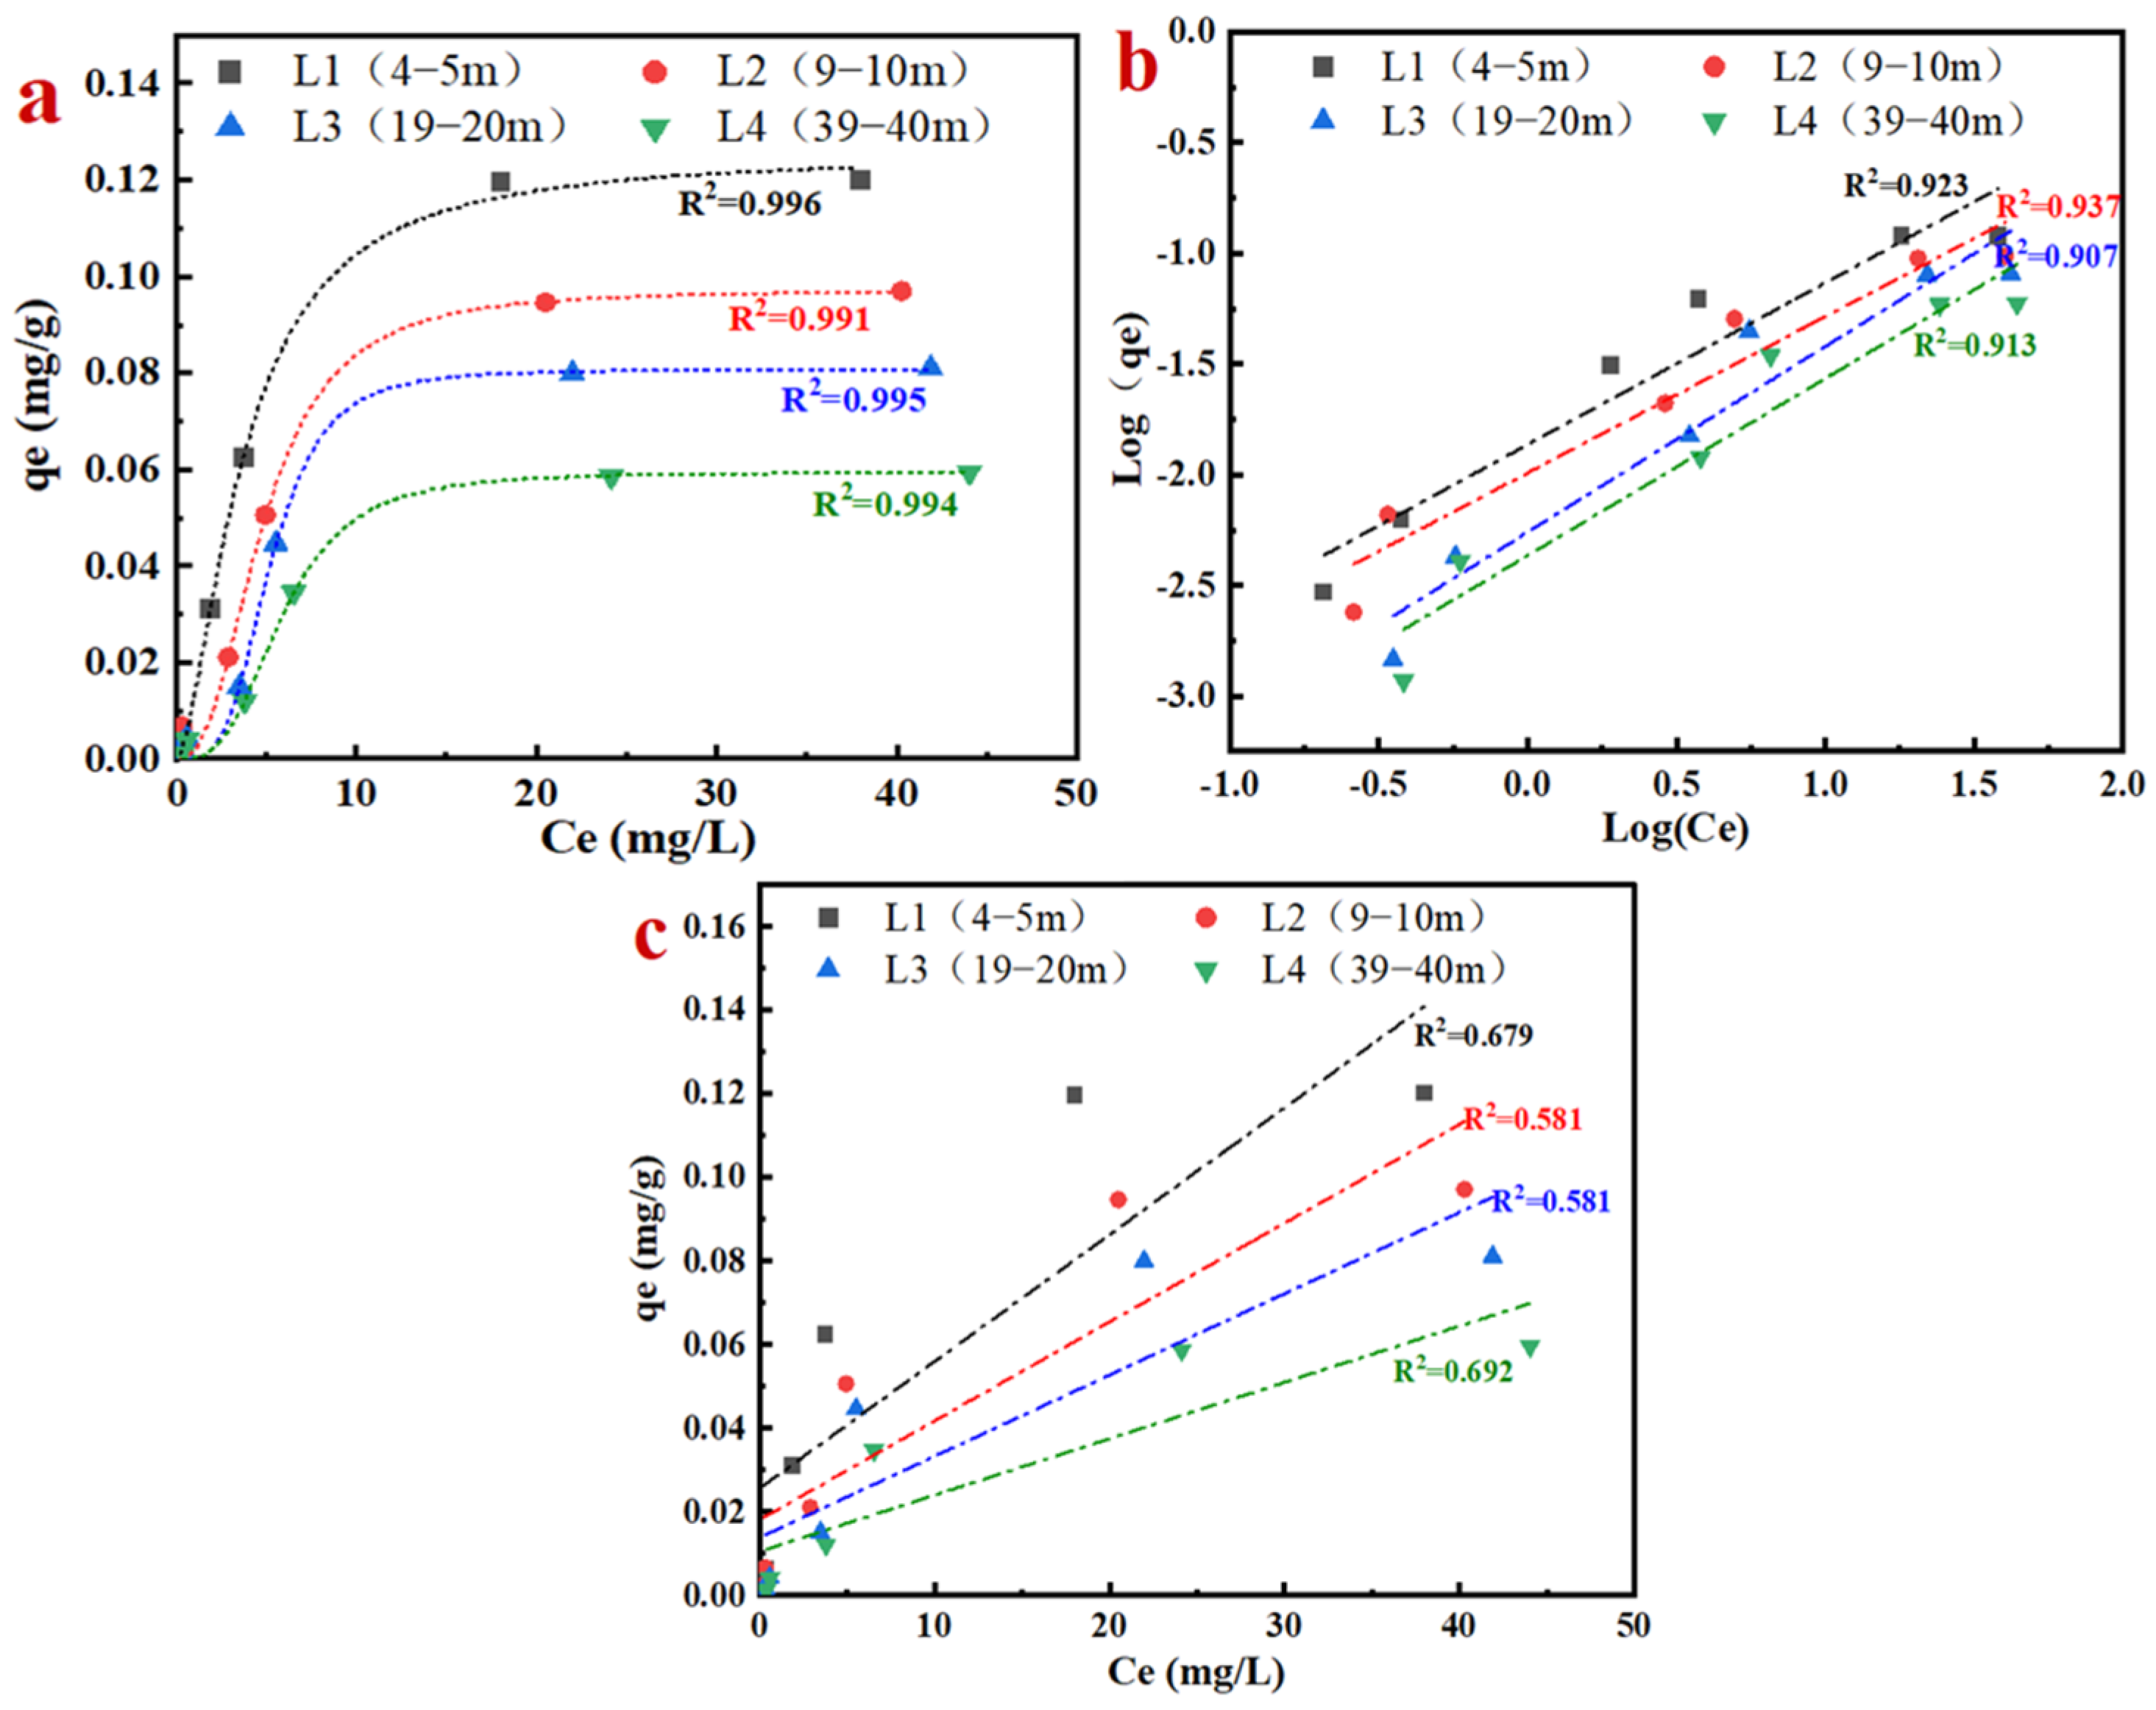
3.3. Adsorption Process of Aquifer Media for NH4+
3.4. Analysis of Microbial Community Structure and Biotransformation Process with NH4+
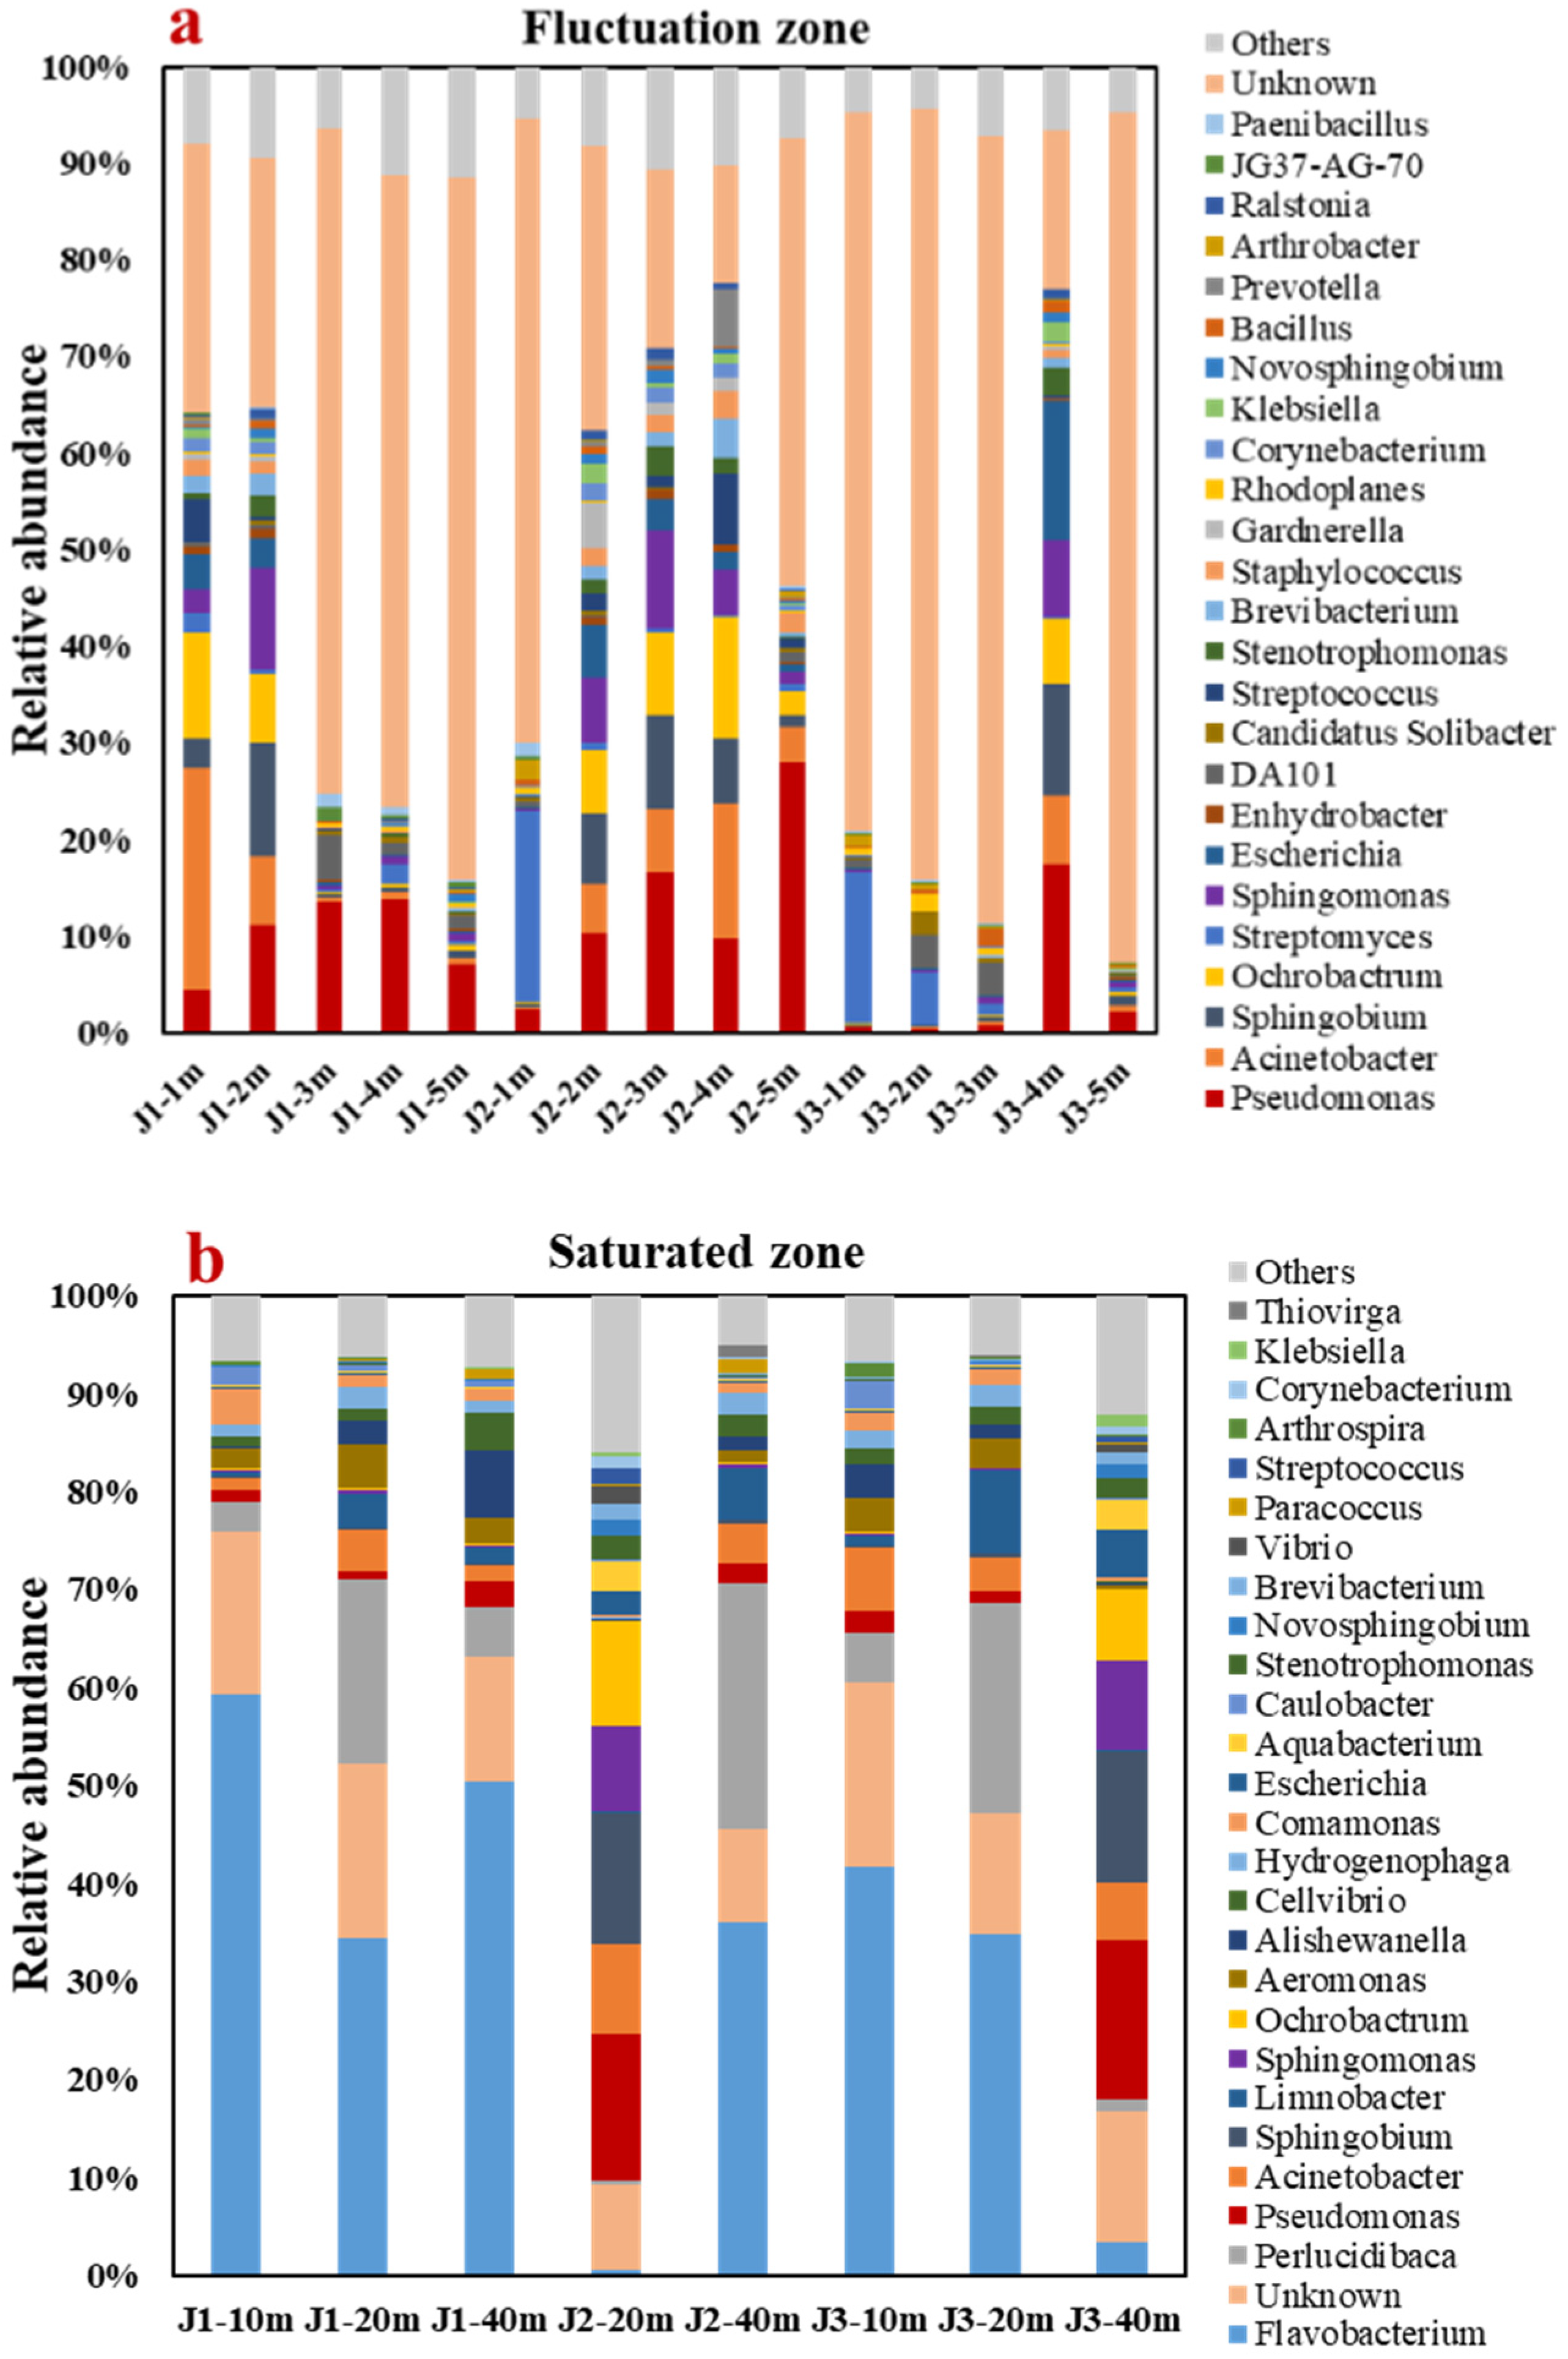
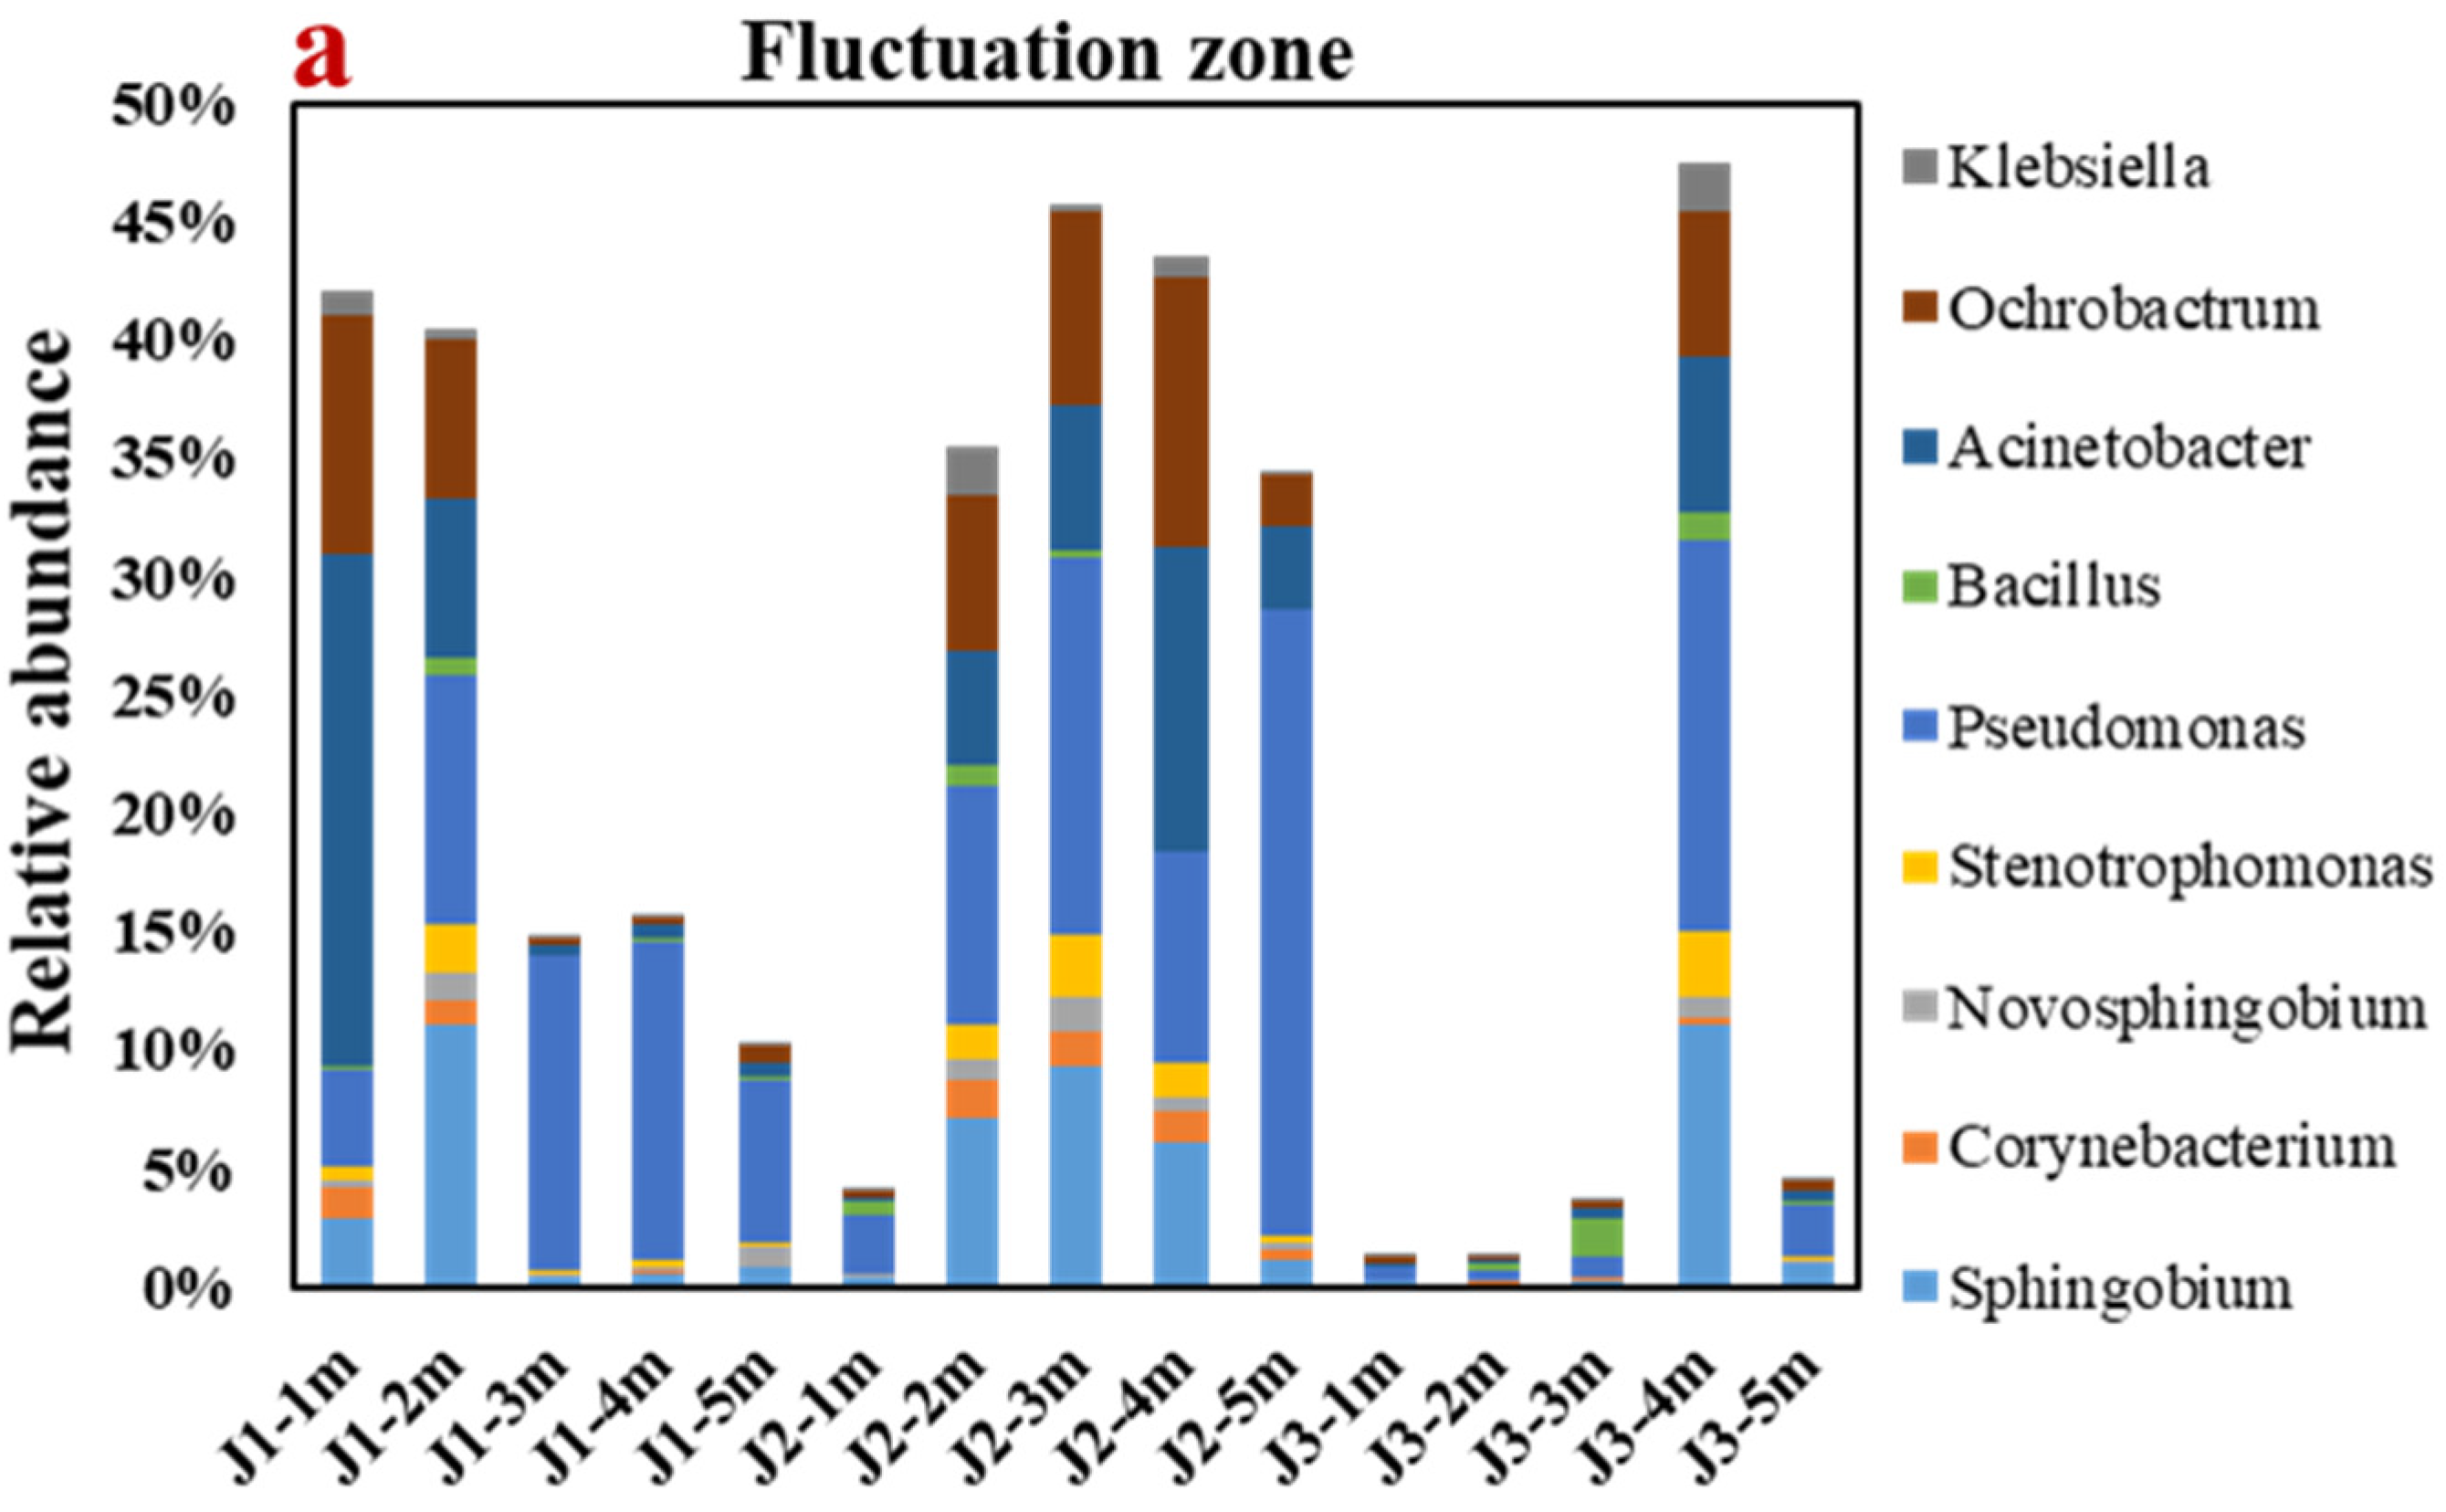
3.4.1. Analyses of Genus-Level Microbial Diversity and Community Structure
3.4.2. Analysis of Biotransformation of NH4+
3.5. Analysis of NH4+ Transformation Processes in the Study Site
4. Conclusions
- (1)
- NH4+ concentration in test wells J1, J2, and J3 decreased by 8%, 18%, and 22%, respectively, under the groundwater exploitation. The concentration of NO3− in J1 increased by about 0.05 mg/L and decreased by about 0.06 and 0.19 mg/L, respectively, in J2 and J3. The results indicated that bio-geochemical transformation of NH4+ existed during groundwater runoff driven by exploitation.
- (2)
- According to a pseudo-second-order kinetic equation, the adsorption process was a monolayer one. The unit adsorption capacities of NH4+ in four different aquifer media with varying depths were 0.076, 0.068, 0.047, and 0.036 mg/g. The adsorption of the aquifer medium for NH4+ decreased with increasing depth in the study site.
- (3)
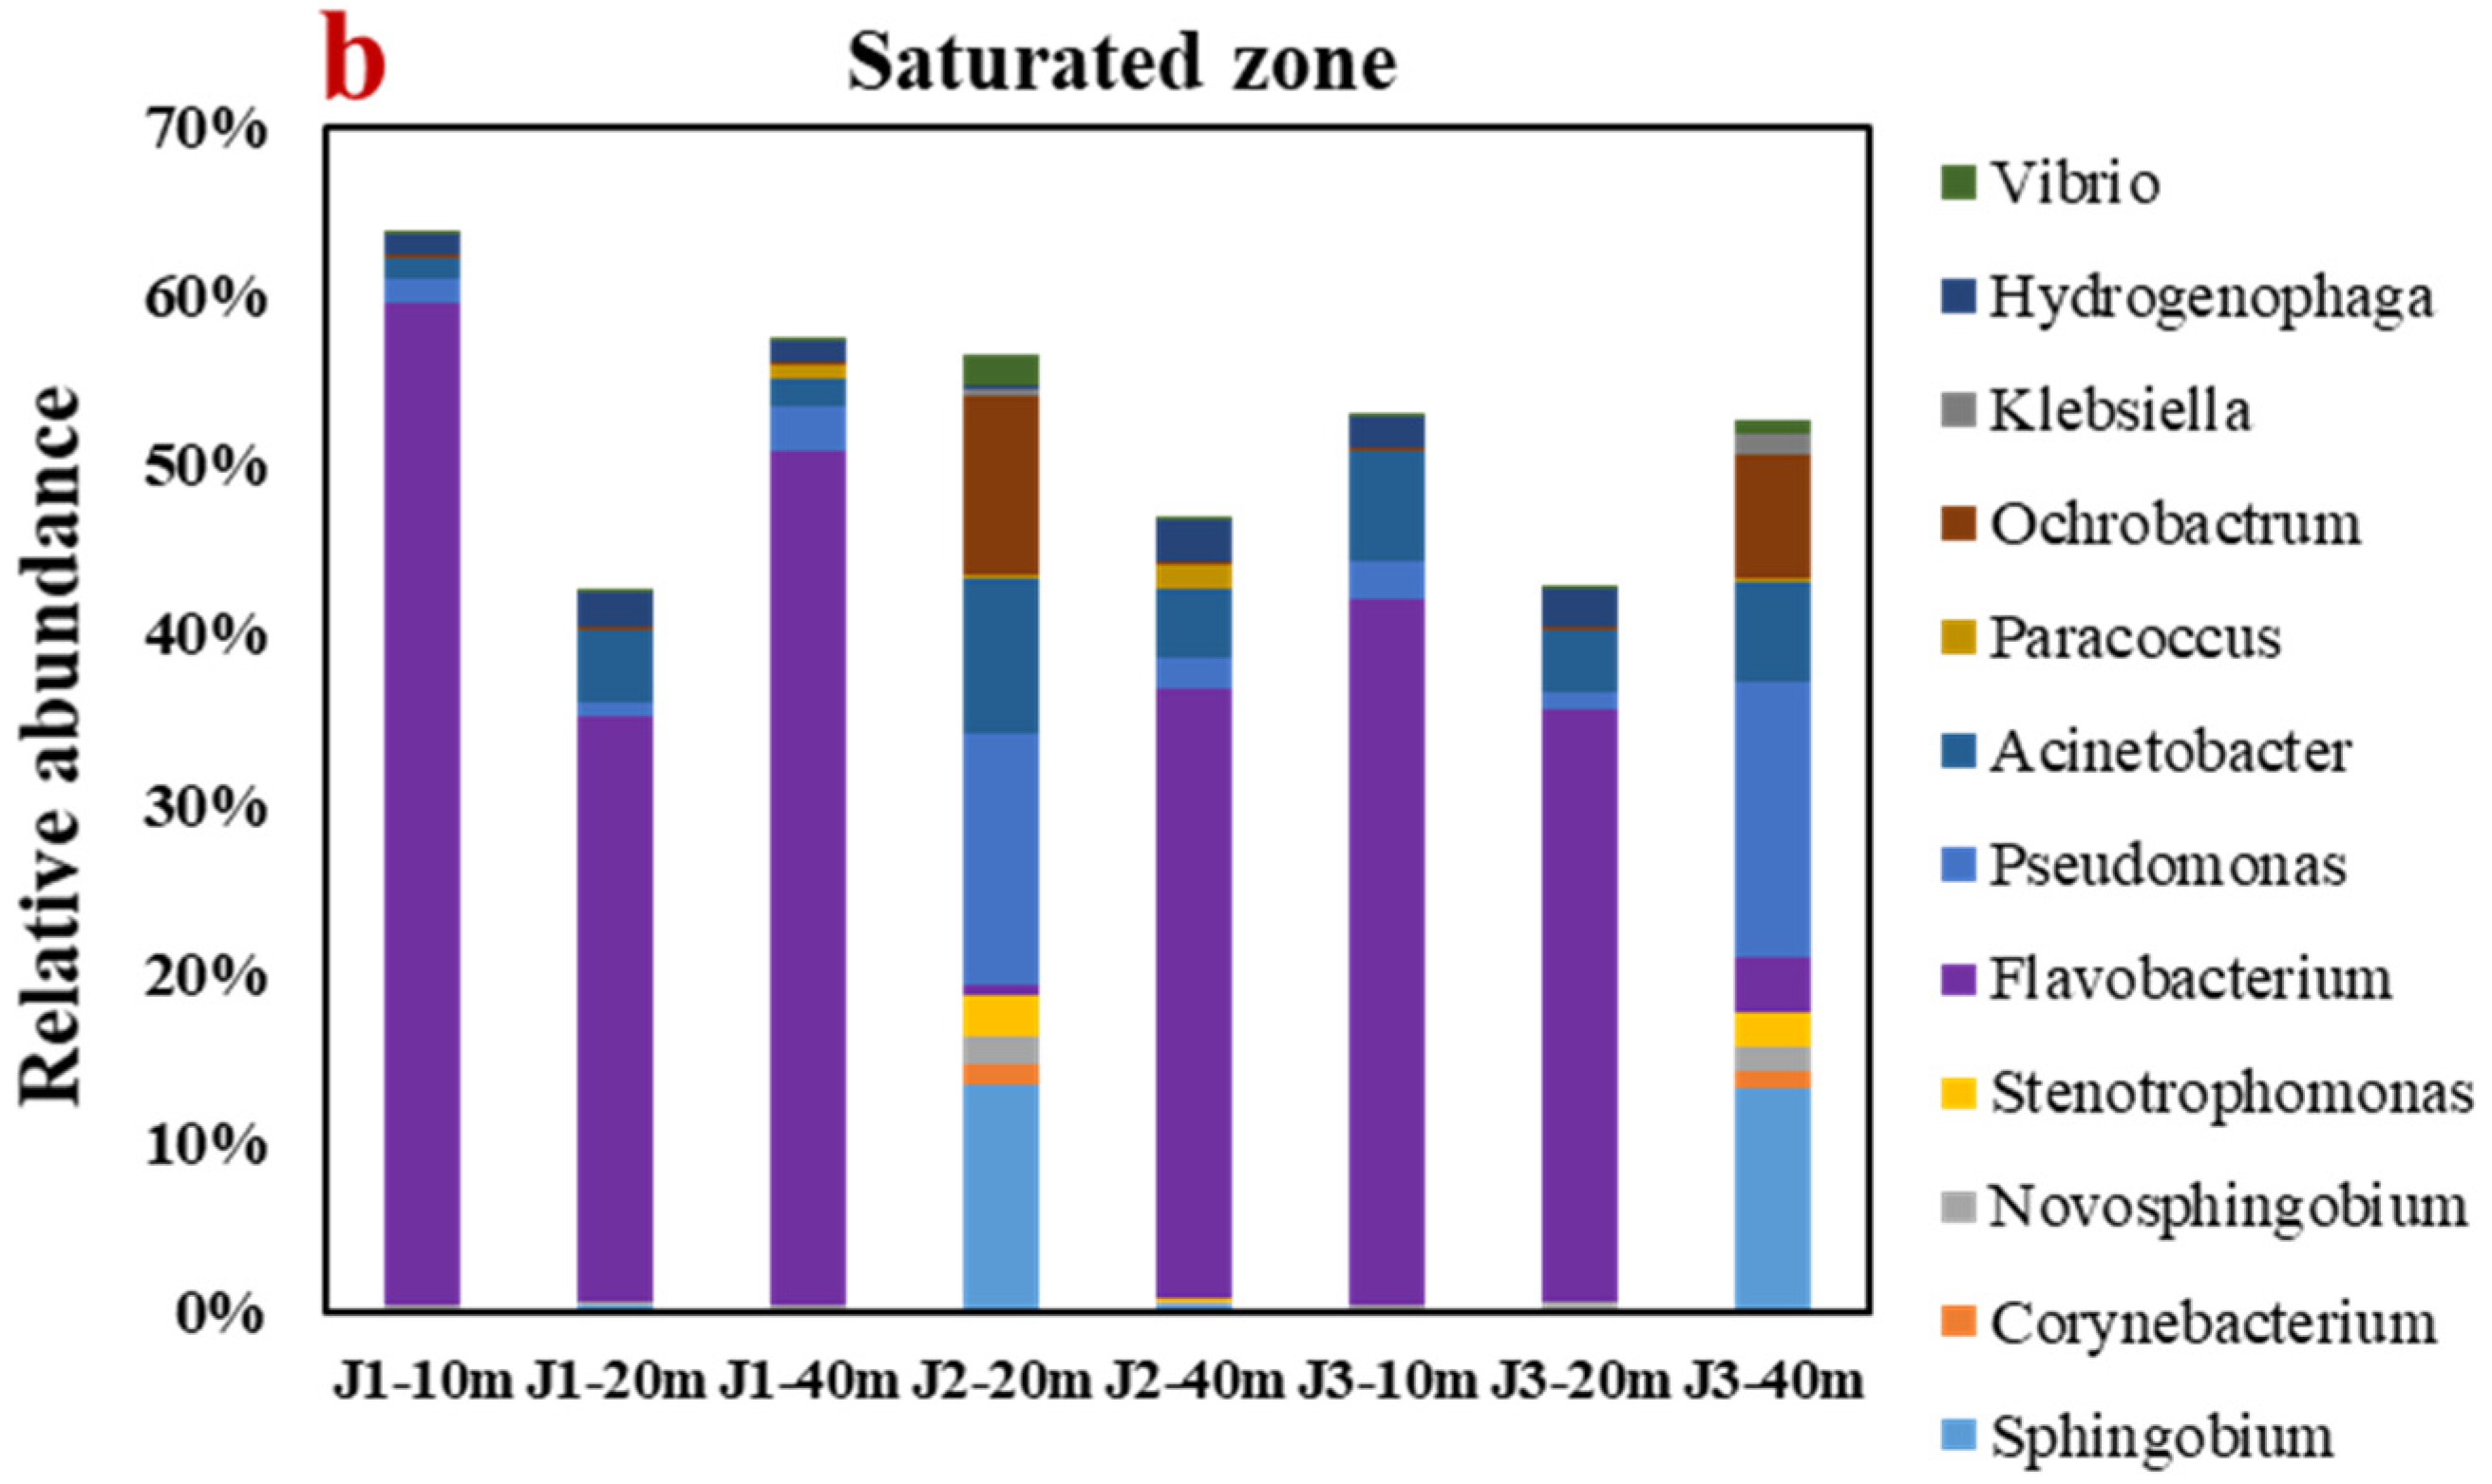
- The alpha diversity analysis discovered that the number of microbes in the groundwater runoff direction decreased to some degree. The main genera in the fluctuation zone were Pseudomonas (8.83%) and Acinetobacter (4.37%), which mainly transformed NH4+ by HN–AD. The main genera in the saturated zone are Flavobacterium (32.60%) and Sphingobium (3.54%), which mainly transform NH4+ by anaerobic denitrification.
- (4)
- In the vertical and horizontal groundwater runoff directions, the percentage of NH4+ adsorption gradually decreased and the percentage of biotransformation gradually increased. In the fluctuation zone and saturated zone, the difference of adsorption was obvious. The average value of the proportion of adsorption in the fluctuation and saturated zones was 20% and 1.6%. Biotransformation was the dominant process in all layers. Especially in the saturated zone (5–49 m), the percentage was more than 95%.
- (5)
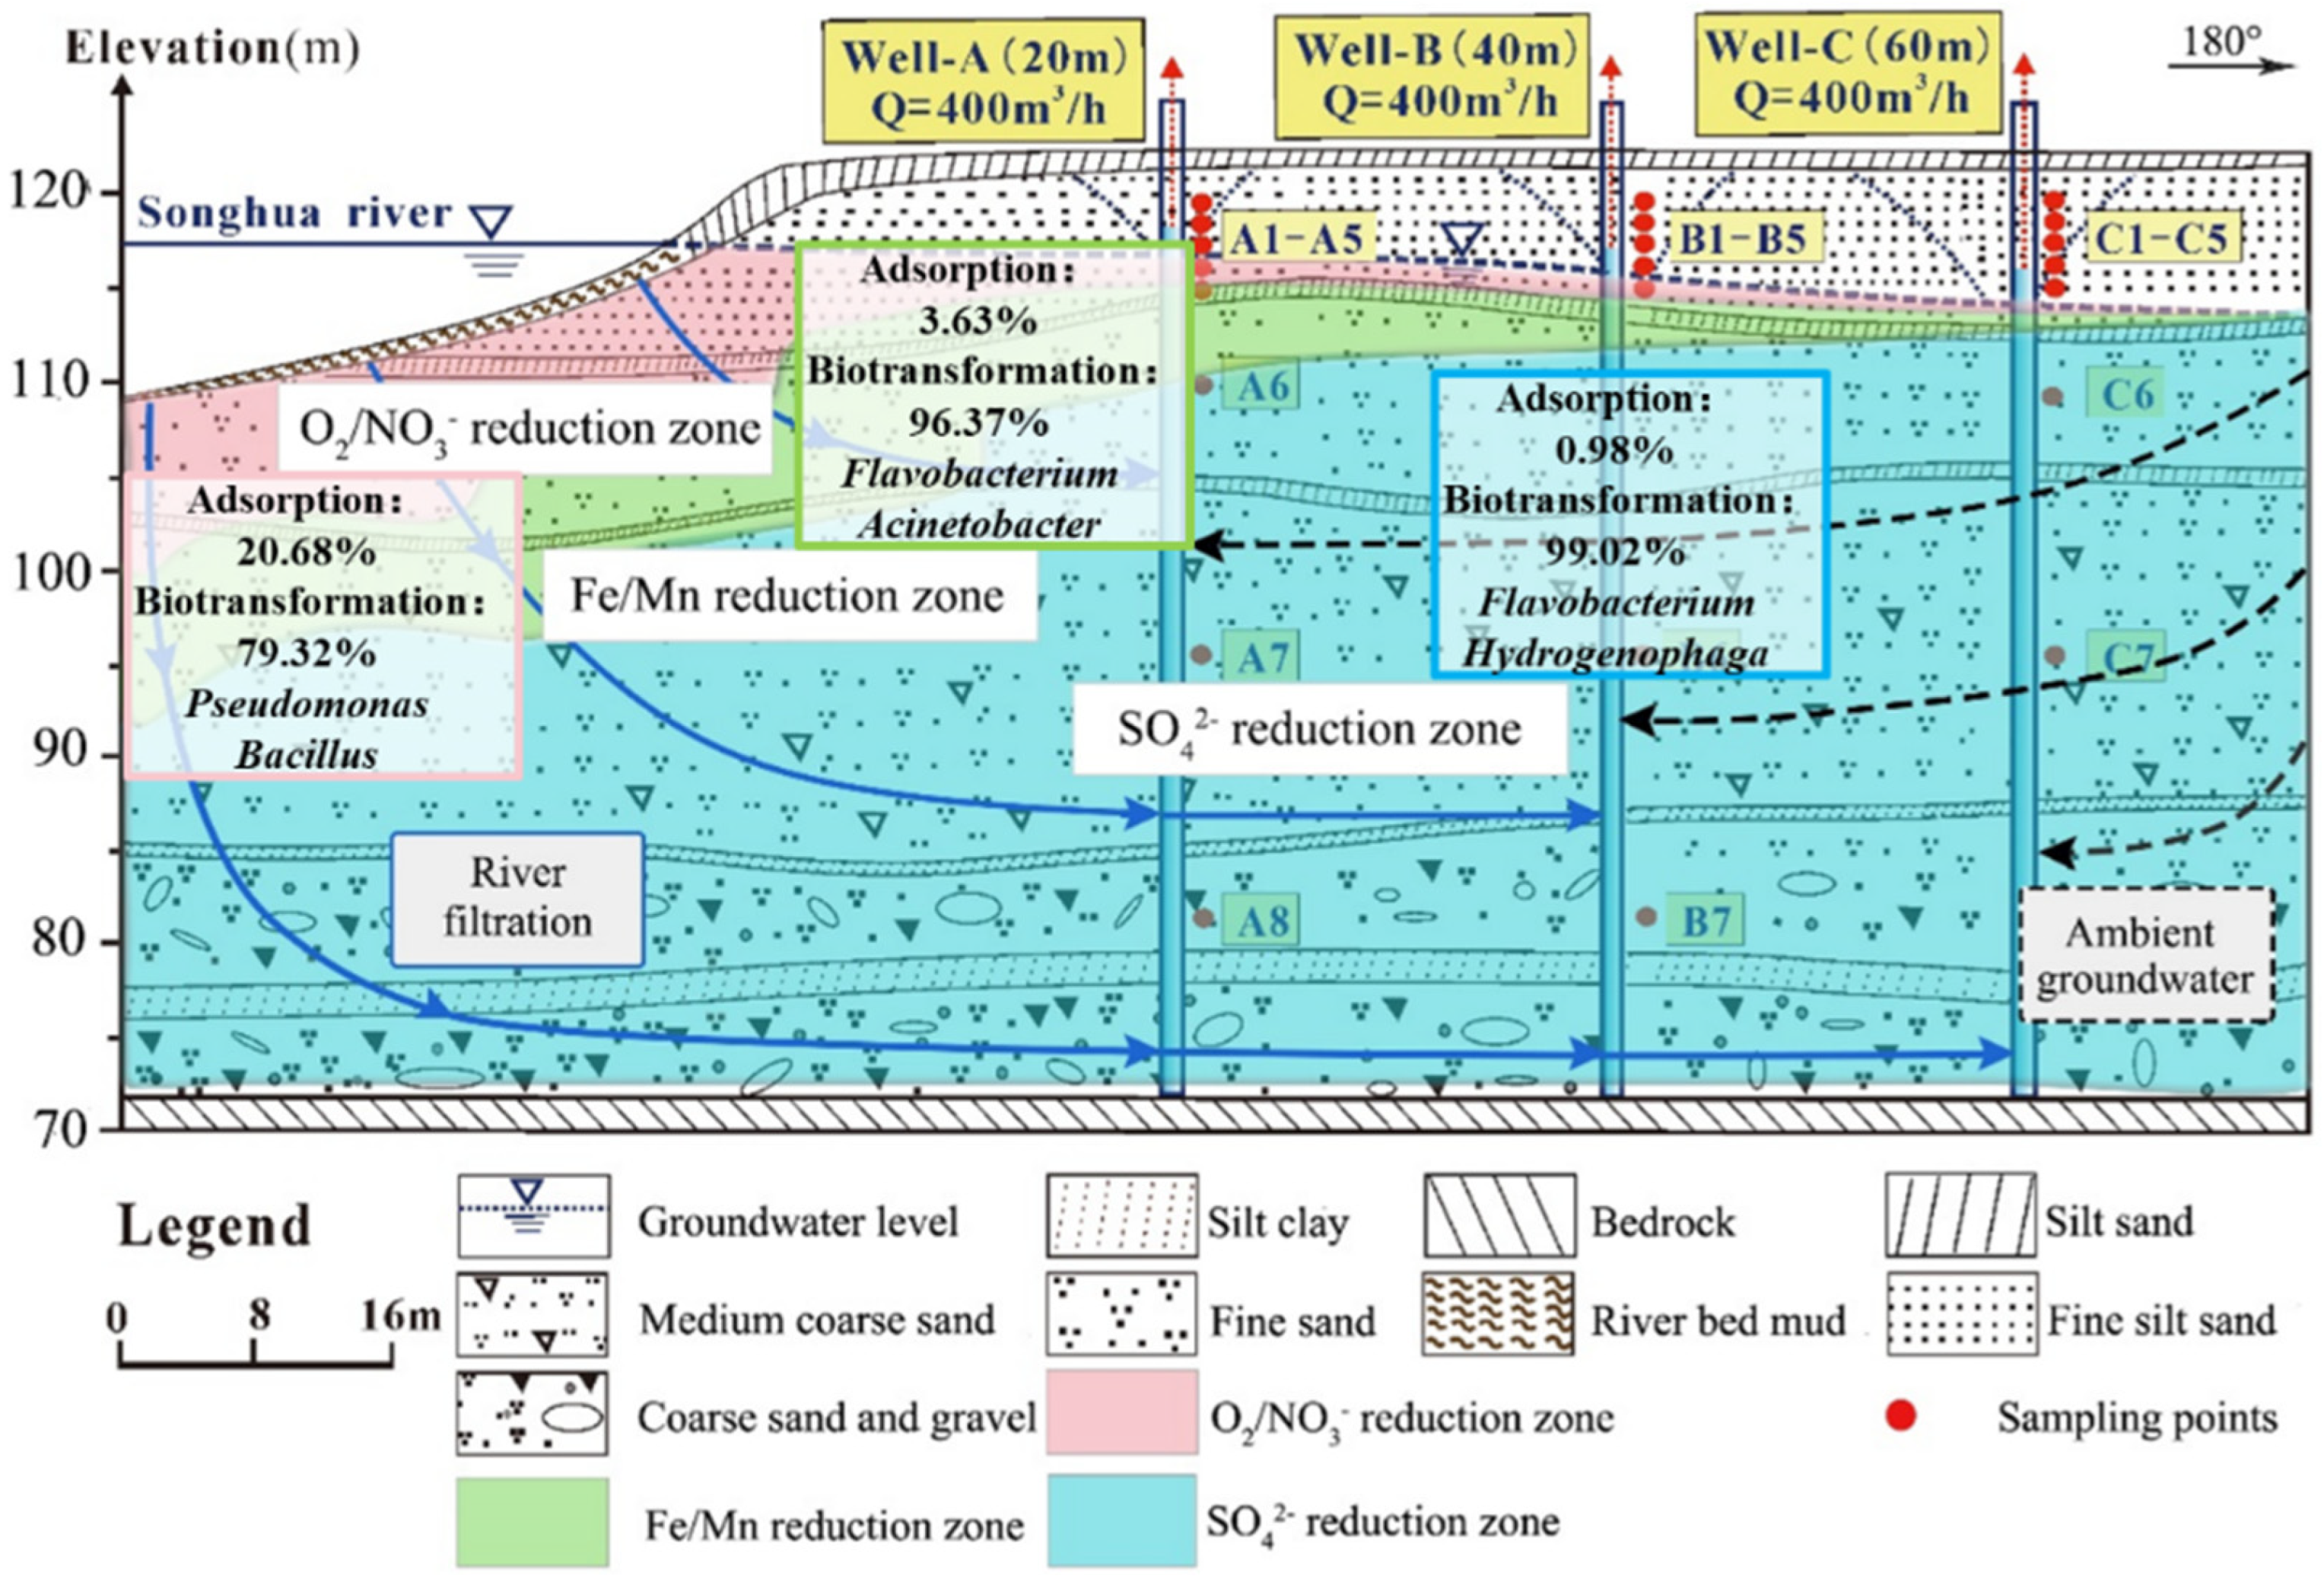
- In the O2/NO3− reduction zone, the proportions of adsorption and biotransformation were 20.7% and 79.3%, indicating mainly the HN–AD process to transform NH4+. In the Fe/Mn reduction zone, the proportions of adsorption and biotransformation were 3.6% and 96.4%. Both HN–AD and anaerobic denitrification were involved in the transformation of NH4+. In the SO42− reduction zone, the proportions of adsorption and biotransformation were 1.0% and 99.0%, mainly through the anaerobic denitrification process to transform NH4+.
Author Contributions
Funding
Institutional Review Board Statement
Informed Consent Statement
Data Availability Statement
Conflicts of Interest
References
- El Alfy, M.; Lashin, A.; Abdalla, F.; Al-Bassam, A. Assessing the hydrogeochemical processes affecting groundwater pollution in arid areas using an integration of geochemical equilibrium and multivariate statistical techniques. Environ. Pollut. 2017, 229, 760–770. [Google Scholar] [CrossRef] [PubMed]
- Fusco, F.; Allocca, V.; Coda, S.; Cusano, D.; Tufano, R.; De Vita, P. Quantitative assessment of specific vulnerability to nitrate pollution of shallow alluvial aquifers by process-based and empirical approaches. Water 2020, 12, 269. [Google Scholar] [CrossRef] [Green Version]
- Zhang, Y.; Wu, J.; Xu, B. Human health risk assessment of groundwater nitrogen pollution in Jinghui canal irrigation area of the loess region, northwest China. Environ. Earth Sci. 2018, 77, 273. [Google Scholar] [CrossRef]
- Zuo, R.; Chen, X.; Li, X.; Shan, D.; Yang, J.; Wang, J.; Teng, Y. Distribution, genesis, and pollution risk of ammonium nitrogen in groundwater in an arid loess plain, northwestern China. Environ. Earth Sci. 2017, 76, 629. [Google Scholar] [CrossRef]
- Gao, T.; Pang, H.; Zhang, J.; Zhang, H.; Zhou, J. Migration and transformation rule of nitrogen in vadose zone and groundwater: A case of Hebei plain. In Proceedings of the 2011 International Conference on Electrical and Control Engineering, Yichang, China, 16–18 September 2011; pp. 3524–3527. [Google Scholar]
- Hao, R.; Li, S.; Li, J.; Meng, C. Denitrification of simulated municipal wastewater treatment plant effluent using a three-dimensional biofilm-electrode reactor: Operating performance and bacterial community. Bioresour. Technol. 2013, 143, 178–186. [Google Scholar] [CrossRef]
- Ansari, F.A.; Ali, S.N.; Mahmood, R. Sodium nitrite-induced oxidative stress causes membrane damage, protein oxidation, lipid peroxidation and alters major metabolic pathways in human erythrocytes. Toxicol. In Vitro 2015, 29, 1878–1886. [Google Scholar] [CrossRef]
- Ward, M.H.; DeKok, T.M.; Levallois, P.; Brender, J.; Gulis, G.; Nolan, B.T.; VanDerslice, J. Workgroup report: Drinking-water nitrate and health—Recent findings and research needs. Environ. Health Perspect. 2005, 113, 1607–1614. [Google Scholar] [CrossRef] [Green Version]
- Sharma, S.; Bhattacharya, A. Drinking water contamination and treatment techniques. Appl. Water Res. 2017, 7, 1043–1067. [Google Scholar] [CrossRef] [Green Version]
- Li, Y.; Bai, G.; Zou, X.; Qu, J.; Wang, L. Nitrogen Migration and Transformation Mechanism in the Groundwater Level Fluctuation Zone of Typical Medium. Water 2021, 13, 3626. [Google Scholar] [CrossRef]
- Liang, P.; Yu, H.; Huang, J.; Zhang, Y.; Cao, H. The review on adsorption and removing ammonia nitrogen with biochar on its mechanism. MATEC Web Conf. 2016, 67, 07006. [Google Scholar] [CrossRef] [Green Version]
- Li, D.; Zhou, Y.; Long, Q.; Li, R.; Lu, C. Ammonia nitrogen adsorption by different aquifer media: An experimental trial for nitrogen removal from groundwater. Hum. Ecol. Risk Assess. 2020, 26, 2434–2446. [Google Scholar] [CrossRef]
- Vocciante, M.; Alessandra De Folly, D.; Finocchi, A.; Tagliabue, M.; Bellettato, M.; Ferrucci, A.; Reverberi, A.P.; Ferro, S. Adsorption of ammonium on clinoptilolite in presence of competing cations: Investigation on groundwater remediation. J. Clean. Prod. 2018, 198, 480–487. [Google Scholar] [CrossRef]
- Wang, S.; Peng, Y. Natural zeolites as effective adsorbents in water and wastewater treatment. Chem. Eng. J. 2010, 156, 11–24. [Google Scholar] [CrossRef]
- Xie, H.; Wang, S.; Qiu, Z.; Jiang, J. Adsorption of NH4+-N on Chinese loess: Non-equilibrium and equilibrium investigations. J. Environ. Manag. 2017, 202, 46–54. [Google Scholar] [CrossRef]
- Pham, T.D.; Do, T.T.; Doan, T.H.Y.; Nguyen, T.A.H.; Mai, T.D.; Kobayashi, M.; Adachi, Y. Adsorptive removal of ammonium ion from aqueous solution using surfactant-modified alumina. Environ. Chem. 2017, 14, 327–337. [Google Scholar] [CrossRef] [Green Version]
- Guo, L.; Wang, G.; Sheng, Y.; Shi, Z.; Sun, X. Groundwater microbial communities and their connection to hydrochemical environment in Golmud, Northwest China. Sci. Total Environ. 2019, 695, 133848. [Google Scholar] [CrossRef]
- Daims, H.; Lebedeva, E.V.; Pjevac, P.; Han, P.; Herbold, C.; Albertsen, M.; Jehmlich, N.; Palatinszky, M.; Vierheilig, J.; Bulaev, A.; et al. Complete nitrification by Nitrospira bacteria. Nature 2015, 528, 504–509. [Google Scholar] [CrossRef]
- Meng, L.; Zuo, R.; Wang, J.S.; Yang, J.; Li, Q.; Chen, M. The spatial variations of correlation between microbial diversity and groundwater quality derived from a riverbank filtration site, northeast China. Sci. Total Environt. 2020, 706, 135855.1–135855.12. [Google Scholar] [CrossRef]
- Dragon, K. Identification of groundwater conditions in the recharge zone of regionally extended aquifer system with use of water chemistry and isotopes (Lwowek region, Poland). J. Hydrol. Reg. Stud. 2021, 34, 100787. [Google Scholar] [CrossRef]
- Medihala, P.G.; Lawrence, J.R.; Swerhone, G.D.W.; Korber, D.R. Spatial variation in microbial community structure, richness, and diversity in an alluvial aquifer. Can. J. Microbiol. 2012, 58, 1135–1151. [Google Scholar] [CrossRef]
- Dwivedi, D.; Arora, B.; Steefel, C.I.; Dafflon, B.; Versteeg, R. Hot spots and hot moments of nitrogen in a riparian corridor. Water Resour. Res. 2018, 54, 205–222. [Google Scholar] [CrossRef]
- Barba, C.; Folch, A.; Sanchez-Vila, X.; Martínez-Alonso, M.; Gaju, N. Are dominant microbial sub-surface communities affected by water quality and soil characteristics? J. Environ. Manag. 2019, 237, 332–343. [Google Scholar] [CrossRef] [PubMed]
- Ge, Y.; Lou, Y.; Xu, M.; Wu, C.; Meng, J.; Shi, L.; Xia, F.; Xu, Y. Spatial distribution and influencing factors on the variation of bacterial communities in an urban river sediment. Environ. Pollut. 2021, 272, 115984. [Google Scholar] [CrossRef]
- Yuan, W.; Su, X.; Bai, J.; Xu, W.; Wang, H.; Su, D. Response of microbial community structure to the hydrochemical evolution during riverbank filtration: A case study in Shenyang, China. Hum. Ecol. Risk Assess. 2020, 26, 807–821. [Google Scholar] [CrossRef]
- Shi, J.; Fujisawa, S.; Nakai, S.; Hosomi, M. Biodegradation of natural and synthetic estrogens by nitrifying activated sludge and ammonia-oxidizing bacterium Nitrosomonas europaea. Water Res. 2004, 38, 2323–2330. [Google Scholar] [CrossRef]
- Gumaelius, L.; Magnusson, G.; Pettersson, B.; Dalhammar, G. Comamonas denitrificans sp. nov., an efficient denitrifying bacterium isolated from activated sludge. Int. J. Syst. Evol. Microbiol. 2001, 51, 999–1006. [Google Scholar] [CrossRef]
- Yao, S.; Ni, J.; Ma, T.; Li, C. Heterotrophic nitrification and aerobic denitrification at low temperature by a newly isolated bacterium, Acinetobacter sp. HA2. Bioresour. Technol. 2013, 139, 80–86. [Google Scholar] [CrossRef]
- Park, J.; Sanford, R.A.; Bethke, C.M. Microbial activity and chemical weathering in the Middendorf aquifer, South Carolina. Chem. Geol. 2009, 258, 232–241. [Google Scholar] [CrossRef]
- Meng, L.; Zuo, R.; Wang, J.S.; Yang, J.; Teng, Y.G.; Shi, R.T.; Zhai, Y.Z. Apportionment and evolution of pollution sources in a typical riverside groundwater resource area using PCA-APCS-MLR model. J. Contam. Hydrol. 2018, 218, 70–83. [Google Scholar] [CrossRef]
- Pruesse, E.; Peplies, J.; Glöckner, F.O. SINA: Accurate high-throughput multiple sequence alignment of ribosomal RNA genes. Bioinformatics 2012, 28, 1823–1829. [Google Scholar] [CrossRef]
- Fischer, H.; Kloep, F.; Wilzcek, S.; Pusch, M.T. A river’s liver: Microbial processes within the hyporheic zone of a large lowland river. Biogeochemistry 2005, 76, 349–371. [Google Scholar] [CrossRef]
- Chu, Z.R.; Wang, K.; Li, X.K.; Zhu, M.T.; Yang, L.; Zhang, J. Microbial characterization of aggregates within a one-stage nitritation–anammox system using high-throughput amplicon sequencing. Chem. Eng. J. 2015, 262, 41–48. [Google Scholar] [CrossRef]
- Caporaso, J.G.; Kuczynski, J.; Stombaugh, J.; Bittinger, K.; Bushman, F.D.; Costello, E.K.; Fierer, N.; Peña, A.G.; Goodrich, J.K.; Gordon, J.I.; et al. QIIME allows analysis of high throughput community sequencing data. Nat. Methods 2010, 7, 335–336. [Google Scholar] [CrossRef] [PubMed] [Green Version]
- Rich, J.J.; Myrold, D.D. Community composition and activities of denitrifying bacteria from adjacent agricultural soil, riparian soil, and creek sediment in Oregon, USA. Soil Biol. Biochem. 2004, 36, 1431–1441. [Google Scholar] [CrossRef]
- Ho, Y.S.; McKay, G. Pseudo-second order model for sorption processes. Process Biochem. 1999, 34, 451–465. [Google Scholar] [CrossRef]
- Langmuir, I. The constitution and fundamental properties of solids and liquids. Part I Solids J. Am. Chem. Soc. 1916, 38, 2221–2295. [Google Scholar] [CrossRef] [Green Version]
- Freundlich, H.M.F. Over the adsorption in solution. J. Phys. Chem. 1906, 57, 1100–1107. [Google Scholar]
- Ruthven, D.M. Principles of Adsorption and Adsorption Processes; John Wiley & Sons: Hoboken, NJ, USA, 1984. [Google Scholar]
- Zhu, Y.; Zhai, Y.; Teng, Y.; Wang, G.; Yang, G. Water supply safety of riverbank filtration wells under the impact of surface water-groundwater interaction: Evidence from long-term field pumping tests. Sci. Total Environ. 2019, 711, 135141. [Google Scholar] [CrossRef]
- Kumar, A.R.; Riyazuddin, P. Seasonal variation of redox species and redox potentials in shallow groundwater: A comparison of measured and calculated redox potentials. J. Hydrol. 2012, 444, 187–198. [Google Scholar] [CrossRef]
- Pinto, A.J.; Schroeder, J.; Lunn, M.; Sloan, W.; Raskin, L. Spatial-temporal survey and occupancy-abundance modeling to predict bacterial community dynamics in the drinking water microbiome. MBio 2014, 5, e01135-14. [Google Scholar] [CrossRef] [Green Version]
- Thukral, A.K. A review on measurement of Alpha diversity in biology. Agric. Res. J. 2017, 54, 1–10. [Google Scholar] [CrossRef]
- Sengupta, A.; Dick, W.A. Bacterial community diversity in soil under two tillage practices as determined by pyrosequencing. Microb. Ecol. 2015, 70, 853–859. [Google Scholar] [CrossRef] [PubMed]
- Kim, B.R.; Shin, J.; Guevarra, R.B.; Lee, J.H.; Kim, D.W.; Seol, K.H.; Lee, J.H.; Kim, H.B.; Isaacson, R.E. Deciphering diversity indices for a better understanding of microbial communities. J. Microbiol. Biotechnol. 2017, 27, 2089–2093. [Google Scholar] [CrossRef] [PubMed] [Green Version]
- Zhang, J.; Wu, P.; Hao, B.; Yu, Z. Heterotrophic nitrification and aerobic denitrification by the bacterium Pseudomonas stutzeri YZN-001. Bioresour. Technol. 2011, 102, 9866–9869. [Google Scholar] [CrossRef]
- Zhang, Q.L.; Liu, Y.; Ai, G.M.; Miao, L.L.; Zheng, H.Y.; Liu, Z.P. The characteristics of a novel heterotrophic nitrification–aerobic denitrification bacterium, Bacillus methylotrophicus strain L7. Bioresour. Technol. 2012, 108, 35–44. [Google Scholar] [CrossRef]
- Chen, S.; He, S.; Wu, C.; Du, D. Characteristics of heterotrophic nitrification and aerobic denitrification bacterium Acinetobacter sp. T1 and its application for pig farm wastewater treatment. J. Biosci. Bioeng. 2019, 127, 201–205. [Google Scholar] [CrossRef]
- Shi, Z.; Zhang, Y.; Zhou, J.; Chen, M.; Wang, X. Biological removal of nitrate and ammonium under aerobic atmosphere by Paracoccus versutus LYM. Bioresour. Technol. 2013, 148, 144–148. [Google Scholar] [CrossRef]
- Ren, J.; Bai, X.; Liu, Y.; Huang, X. Simultaneous nitrification and aerobic denitrification by a novel isolated Ochrobactrum anthropi HND19. Bioresour. Technol. 2021, 340, 125582. [Google Scholar] [CrossRef]
- Duan, J.; Fang, H.; Su, B.; Chen, J.; Lin, J. Characterization of a halophilic heterotrophic nitrification–aerobic denitrification bacterium and its application on treatment of saline wastewater. Bioresour. Technol. 2015, 179, 421–428. [Google Scholar] [CrossRef]
- Padhi, S.K.; Tripathy, S.; Sen, R.; Mahapatra, A.S.; Mohanty, S.; Maiti, N.K. Characterisation of heterotrophic nitrifying and aerobic denitrifying Klebsiella pneumoniae CF-S9 strain for bioremediation of wastewater. Int. Biodeterior. Biodegrad. 2013, 78, 67–73. [Google Scholar] [CrossRef]
- Verbaendert, I.; De Vos, P.; Boon, N.; Heylen, K. Denitrification in Gram-positive bacteria: An underexplored trait. Biochem. Soc. Trans. 2011, 39, 254–258. [Google Scholar] [CrossRef] [PubMed] [Green Version]
- Liu, X.; Wang, L.; Pang, L. Application of a novel strain Corynebacterium pollutisoli SPH6 to improve nitrogen removal in an anaerobic/aerobic-moving bed biofilm reactor (A/O-MBBR). Bioresour. Technol. 2018, 269, 113–120. [Google Scholar] [CrossRef] [PubMed]
- He, Q.; Gao, S.; Zhang, S.; Zhang, W.; Wang, H. Chronic responses of aerobic granules to zinc oxide nanoparticles in a sequencing batch reactor performing simultaneous nitrification, denitrification and phosphorus removal. Bioresour. Technol. 2017, 238, 95–101. [Google Scholar] [CrossRef] [PubMed]
- Yu, L.; Liu, Y.; Wang, G. Identification of novel denitrifying bacteria Stenotrophomonas sp. ZZ15 and Oceanimonas sp. YC13 and application for removal of nitrate from industrial wastewater. Biodegradation 2009, 20, 391–400. [Google Scholar] [CrossRef] [PubMed]
- Bernardet, J.F.; Bowman, J.P. The genus flavobacterium. Prokaryotes 2006, 7, 481–531. [Google Scholar]
- Tang, S.; Liao, Y.; Xu, Y.; Dang, Z.; Zhu, X.; Ji, G. Microbial coupling mechanisms of nitrogen removal in constructed wetlands: A review. Bioresour. Technol. 2020, 314, 123759. [Google Scholar] [CrossRef]
- Burgin, A.J.; Hamilton, S.K. Have we overemphasized the role of denitrification in aquatic ecosystems? A review of nitrate removal pathways. Front. Ecol. Environ. 2007, 5, 89–96. [Google Scholar] [CrossRef] [Green Version]
- Zuo, R.; Xue, Z.; Wang, J.; Meng, L.; Zhao, X.; Pan, M.; Cai, W. Spatiotemporal variations of redox conditions and microbial responses in a typical river bank filtration system with high Fe2+ and Mn2+ contents. J. Hydrol. 2022, 609, 127777. [Google Scholar] [CrossRef]
- Zhang, X.; Li, X.; Zhao, X.; Li, Y. Factors affecting the efficiency of a bioelectrochemical system: A review. RSC Adv. 2019, 9, 19748–19761. [Google Scholar] [CrossRef]


| Experimental Wells | J1 | J2 | J3 |
|---|---|---|---|
| The depth of well (m) | 49 | 49 | 49 |
| The distance off the Songhua River (m) | 20 | 40 | 60 |
| The capacity of groundwater exploration (m3/h) | 400 | 400 | 400 |
| Hydraulic conductivity (m/d) | 53.65 | ||
| Water head difference (m) | 10.04–11.91 | 8.63–10.08 | 7.91–10.08 |
| The designed drawdown (m) | 12–14 | 12–14 | 12–14 |
| The real drawdown (m) | 10.42 | 10.21 | 9.36 |
| Hydraulic gradient | 0.50–0.59 | 0.22–0.28 | 0.13–0.17 |
| Velocity (m/d) | 26.93–31.98 | 11.59–15.08 | 7.08–9.01 |
| PCR Reaction System (Kapa DNA Polymerase) | Reaction Conditions | |||
|---|---|---|---|---|
| ddH2O | 38.8 μL | 95 °C | 3 min | |
| Buffer (10×Taq A with Mg) | 5 μL | 95 °C | 10 s | |
| dNTP | 1 μL | 50 °C | 30 s | 30 cycles |
| DNA | 1 μL | 72 °C | 60 s | |
| Primers F Mix | 2 μL | 72 °C | 7 min | |
| Primers R Mix | 2 μL | 4 °C | ∞ | |
| Polymerase | 0.2 μL | |||
| Total | 50 μL | |||
| The Depth of Aquifer Medium | Distribution of Grain Size/% | |||||
|---|---|---|---|---|---|---|
| >1 mm | 0.5~1 mm | 0.25~0.5 mm | 0.15~0.25 mm | 0.075~0.15 mm | <0.075 mm | |
| L1 (4~5 m) | 0.0 | 9.3 | 14.8 | 18.6 | 32.4 | 24.9 |
| L2 (9~10 m) | 13.6 | 27.8 | 20.4 | 17.2 | 11.4 | 9.7 |
| L3 (19~20 m) | 19.3 | 31.5 | 16.3 | 16.4 | 10.0 | 6.5 |
| L4 (39~40 m) | 22.5 | 33.4 | 14.2 | 15.3 | 9.4 | 5.4 |
| Name | Equation | Key Parameters | |
|---|---|---|---|
| Adsorption kinetic model | pseudo-first-order kinetic model [36] | : constant(min−1); : power adsorption amount (mg/g); : equilibrium adsorption amount (mg/g); t: adsorption time (h) | |
| pseudo-second-order kinetic model [36] | : rate constant (g·mg−1·min−1) | ||
| Isothermal adsorption model | Langmuir isothermal adsorption model [37] | : unit adsorption amount (mg/g); : equilibrium mass concentration (mg·L−1); : maximum adsorption amount (mg/g); : Langmuir adsorption constant | |
| Freundlich isothermal adsorption model [38] | : Freundlich adsorption constant; n: constant | ||
| Henry isothermal adsorption model [39] | : partition coefficient |
| Aquifer Medium | Pseudo-First-Order Kinetic Model | Pseudo-Second-Order Kinetic Model | ||||
|---|---|---|---|---|---|---|
| qe/(mg/g) | K1 | R2 | qe/(mg/g) | K2(mg/g·h) | R2 | |
| L1(4–5 m) | 0.065 | 4.416 | 0.298 | 0.068 | 105.450 | 0.879 |
| L2(9–10 m) | 0.057 | 4.159 | 0.479 | 0.059 | 97.710 | 0.870 |
| L3(19–20 m) | 0.040 | 1.010 | 0.667 | 0.043 | 30.030 | 0.822 |
| L4(39–40 m) | 0.031 | 2.007 | 0.717 | 0.033 | 23.640 | 0.867 |
| Aquifer Medium | Langmuir | Freundlich | Henry | |||||
|---|---|---|---|---|---|---|---|---|
| KL (L/mg) | qmax (mg/g) | R2 | KF | 1/n | R2 | Kd (mg/g) | R2 | |
| L1 (4–5 m) | 0.116 | 0.125 | 0.996 | 0.155 | 0.717 | 0.923 | 0.003 | 0.679 |
| L2 (9–10 m) | 0.02 | 0.097 | 0.991 | 0.137 | 0.706 | 0.937 | 0.0024 | 0.581 |
| L3 (19–20 m) | 0.002 | 0.080 | 0.995 | 0.104 | 0.798 | 0.907 | 0.0019 | 0.581 |
| L4 (39–40 m) | 0.004 | 0.059 | 0.994 | 0.094 | 0.78 | 0.913 | 0.0013 | 0.692 |
| Test Well | High Quality Sequence | OTUs | ACE | Simpson | Shannon | Chao1 | Dood’s Coverage | |
|---|---|---|---|---|---|---|---|---|
| Fluctuation zone (1~5 m) | J1 | 273137 | 9000 | 24196 | 0.98 | 9.70 | 22393 | 0.91 |
| J2 | 239226 | 9025 | 22156 | 0.97 | 9.05 | 20486 | 0.92 | |
| J3 | 159817 | 8862 | 18480 | 0.96 | 8.83 | 17610 | 0.94 | |
| Saturation zone (5~50 m) | J1 | 326439 | 5542 | 15843 | 0.94 | 6.57 | 13888 | 0.95 |
| J2 | 185061 | 4707 | 12280 | 0.95 | 6.92 | 10831 | 0.96 | |
| J3 | 224319 | 4854 | 13228 | 0.95 | 6.69 | 11184 | 0.95 |
| J1 | J2 | J3 | |
|---|---|---|---|
| Sphingobium | 2.03% | 5.40% | 3.31% |
| Corynebacterium | 0.34% | 0.89% | 0.17% |
| Novosphingobium | 0.38% | 0.72% | 0.39% |
| Stenotrophomonas | 0.44% | 1.20% | 0.64% |
| Flavobacterium | 48.08% | 18.29% | 26.65% |
| Pseudomonas | 6.64% | 11.51% | 4.98% |
| Bacillus | 22.00% | 0.40% | 0.63% |
| Acinetobacter | 4.63% | 5.82% | 3.02% |
| Paracoccus | 0.33% | 0.76% | 0.08% |
| Ochrobactrum | 2.32% | 5.62% | 1.84% |
| Klebsiella | 0.20% | 0.58% | 0.41% |
| Hydrogenophaga | 1.53% | 1.20% | 1.44% |
| Vibrio | 0.06% | 0.96% | 0.29% |
| Average | 6.84% | 4.10% | 3.37% |
| Depth | J1 (20 m) | J2 (40 m) | J3 (60 m) | |||
|---|---|---|---|---|---|---|
| Adsorption | Biotransformation | Adsorption | Biotransformation | Adsorption | Biotransformation | |
| 0–5 m | 22.4% | 77.6% | 20.1% | 79.9% | 19.5% | 80.5% |
| 5–15 m | 3.9% | 96.1% | 3.4% | 96.6% | 3.3% | 96.7% |
| 15–30 m | 0.5% | 99.5% | 0.4% | 99.6% | 0.4% | 99.6% |
| 30–49 m | 0.9% | 99.1% | 0.8% | 99.2% | 0.7% | 99.3% |
Publisher’s Note: MDPI stays neutral with regard to jurisdictional claims in published maps and institutional affiliations. |
© 2022 by the authors. Licensee MDPI, Basel, Switzerland. This article is an open access article distributed under the terms and conditions of the Creative Commons Attribution (CC BY) license (https://creativecommons.org/licenses/by/4.0/).
Share and Cite
Meng, L.; Shi, J.; Zhai, Y.; Zuo, R.; Wang, J.; Guo, X.; Teng, Y.; Gao, J.; Xu, L.; Guo, B. Ammonium Reactive Migration Process and Functional Bacteria Response along Lateral Runoff Path under Groundwater Exploitation. Sustainability 2022, 14, 8609. https://doi.org/10.3390/su14148609
Meng L, Shi J, Zhai Y, Zuo R, Wang J, Guo X, Teng Y, Gao J, Xu L, Guo B. Ammonium Reactive Migration Process and Functional Bacteria Response along Lateral Runoff Path under Groundwater Exploitation. Sustainability. 2022; 14(14):8609. https://doi.org/10.3390/su14148609
Chicago/Turabian StyleMeng, Li, Jian Shi, Yuanzheng Zhai, Rui Zuo, Jinsheng Wang, Xueru Guo, Yanguo Teng, Jian Gao, Li Xu, and Bingchi Guo. 2022. "Ammonium Reactive Migration Process and Functional Bacteria Response along Lateral Runoff Path under Groundwater Exploitation" Sustainability 14, no. 14: 8609. https://doi.org/10.3390/su14148609
APA StyleMeng, L., Shi, J., Zhai, Y., Zuo, R., Wang, J., Guo, X., Teng, Y., Gao, J., Xu, L., & Guo, B. (2022). Ammonium Reactive Migration Process and Functional Bacteria Response along Lateral Runoff Path under Groundwater Exploitation. Sustainability, 14(14), 8609. https://doi.org/10.3390/su14148609