Article

Analysis and Evaluation of Variation Characteristics in Groundwater Resources Carrying Capacity in Beijing between 2010 and 2020

1
Faculty of Architecture, Civil and Transportation Engineering, Beijing University of Technology, Beijing 100124, China
2
Beijing Water Science and Technology Institute, Beijing 100048, China
3
Faculty of Geographical Science, Beijing Normal University, Beijing 100875, China
4
National Marine Hazard Mitigation Service, Ministry of Natural Resource of the People’s Republic of China, Beijing 100194, China
*
Author to whom correspondence should be addressed.
Sustainability 2022, 14(15), 9200; https://doi.org/10.3390/su14159200
Submission received: 28 June 2022 / Revised: 23 July 2022 / Accepted: 25 July 2022 / Published: 27 July 2022
(This article belongs to the Special Issue Sustainable Assessment and Management of Groundwater Resources)

Abstract

:
The problems of water shortages and groundwater overexploitation are serious in Beijing. Resources are over-exploited to meet the industrial needs of various sectors, and the capacity of groundwater resources to support economic development is also reduced. Therefore, it is of great significance to study the evaluation of regional groundwater resources carrying capacity from the perspective of time and space. This study evaluates the groundwater resource carrying capacity of Beijing from time and space by using the function between water use efficiency and groundwater availability constructed by regional water supply, consumption data and GDP data. The results show that: The proportion of groundwater in water supply in Beijing has decreased and it was still one of the main sources of water supply from 2010 to 2020. From the perspective of time, when the degree of groundwater exploitation (De) was greater than 1, the contribution rate of exploitation degree of economic development (Dg) reached 60% from 2010 to 2015, indicating that the economic development of Beijing is highly dependent on groundwater resources. From 2015 to 2020, the De was less than 1, but the Dg value kept increasing and approaching 90% and the total overload rate was 81.8%. The supporting capacity of groundwater resources will become more fragile. At the spatial scale, only the Dongcheng and the Xicheng regions were overloaded whose rates were 58.48% and 69.92%. The research shows that the degree of groundwater exploitation has approached the saturation state, the economic development is highly dependent on groundwater resources and there is a large space for water saving. Improving the utilization efficiency of water resources cannot improve the carrying capacity of groundwater resources, so it is still necessary to increase the amount of groundwater resources by recharging the groundwater through a series of comprehensive over-exploitation control measures, which is of great significance to the management and sustainable development of regional groundwater.

1. Introduction

Water security is essential for cities to continue to thrive and contribute to national and global economies [1]. With the rapid increase in the population and the rapid development of the social economy, the global demand for water resources has increased [2]. Projected deficits in the future of urban water supplies will likely have a major impact on both water availability and costs [3]. The risks and challenges brought by a water resources shortage and water environment deterioration have become more complex [4,5,6]. Urban water scarcity has typically been addressed via engineering, infrastructure and the feasibility of some solutions for water-scarce cities [7,8]. Proposed solutions include groundwater exploitation, seawater desalination, increased water storage in reservoirs, inter-basin water transfer, improved water-use efficiency and urban landscape management [9,10]. Pairing the identification of water-scarce cities with an evaluation of potential solutions is essential for guiding investment in future urban water security. As an important part of water resources, groundwater resources have become an indispensable part of social and economic development due to the shortage of surface water caused by the interruption of rivers and the decrease in rainfall especially in some arid and semi-arid areas [5,6]. Some studies [11,12] have stated that the shortage of groundwater resources affects the development of the country, making the sustainable utilization of groundwater resources important. It was reported [13,14,15] that a large number of groundwater resources have been reduced in groundwater mining areas all over the world, and groundwater funnels have even appeared in the most severely affected areas. The phenomena all show that the exploitation of groundwater resources has its own limit value [16]; meanwhile, human production activities and social economic development are also subject to certain restrictions [17,18,19]. Therefore, within the limit of groundwater resources, the rational development and utilization of groundwater resources that is the research on the carrying capacity of groundwater resources has become an important topic of discussion in regional groundwater resources management [20,21,22].
Accurate evaluation of the carrying capacity of groundwater resources is of great significance to the utilization degree of groundwater resources, economic development, the benign cycle of ecological environment and the sustainable development of groundwater resources [23,24,25,26]. International studies on the carrying capacity of groundwater resources have been extended to the theory of sustainable development [27], which studies whether the carrying capacity can provide a measure of security from the perspective of urban water supply and agricultural production. The carrying capacity of groundwater resources in China is based on the related ecological and environmental issues such as land subsidence caused by the loss of groundwater reserves to study the carrying capacity of economic development [28,29]. In recent decades, the definition of groundwater resource carrying capacity, research methods and the development of different interdisciplinary studies [30,31] have shifted the research from a static analysis of a single index to a systematic analysis with specific objectives. This study does not adopt the concept of quantifying water resources carrying capacity with a complex index layer system under the evaluation method of the selected algorithm model. However, it uses the principle of sustainable development, taking the availability of groundwater as the premise and using the gross domestic product (GDP) to express the ability of groundwater resources to support regional social and economic development under the water use efficiency of a certain industry [32]. It is more inclined to analyze the practical problems of social and economic development and the water resources carrying limit. The conducted research [33,34] has shown that the evaluation grade of the descriptive statistics of related groundwater parameters and development of the model also fluctuate with seasonal changes. Water sample analysis and the chemical and microbiological water quality parameters of municipal water at the same site have different effects depending on the wet and dry season [35,36]. The availability of groundwater resources and the degree of economic development in a region are always experiencing dynamic change and are not constant. Therefore, it is necessary to evaluate the carrying capacity of groundwater resources from the perspective of time and space and to propose corresponding control methods and countermeasures for overexploitation areas. This is not only an important theoretical basis for the study of sustainable utilization in Beijing, but also provides an important basis for the optimal allocation of groundwater resources in the North China Plain and the rational planning of overexploitation control areas.
On the basis of the analysis and research from the perspective of time and space, this paper considers the support capacity of groundwater resources for social and economic development from two perspectives of groundwater resource availability and water use efficiency. Based on the new evaluation method of regional groundwater resource carrying capacity, the correlation coefficient between the economic development degree and groundwater exploitation degree of various regions in Beijing under the current conditions is used to evaluate the over-exploitation ratio. The regulation method to improve the groundwater resource carrying capacity is proposed which provides a reference for groundwater resource managers in the North China Plain.

2. Materials and Methods

2.1. Description of Study Area

Beijing is located at the northern end of the North China Plain, which is adjacent to Tianjin in the east and borders the surrounding cities of Hebei Province in the rest of the direction (Figure 1a). Beijing lies between latitude 39°28′–41°05′ N and longitude 115°25′–117°30′ E. The city covers an area of about 16,410 km2 and the administrative areas cover 16 districts (Figure 1c). According to the genetic type and morphological characteristics, it can be divided into two landform units: mountainous area and plain area (Figure 1a), and the plain area accounts for 6200 km2. On the whole, the terrain is high in the northwest and low in the southeast. The west region belongs to the Taihang Mountains and the northeast region belongs to the Yanshan Mountains. The plain terrain gradually slopes from the northwest to the southeast, with an average elevation of 43.5 m (Figure 1b). The climate of Beijing is characterized by a warm temperate zone and semi-humid and semi-arid continental monsoons with an annual rainfall of 621.5 mm (2010–2020) and an average temperature of 11.7 °C. The main land use in Beijing is classified into farmlands, forests, grasslands, water and urban areas (Figure 1d). According to the National Bureau of Statistics, the resident population in Beijing has increased from 19.619 million in 2010 to 21.89 million in 2020 and the sown area of crops has decreased from 317,000 hm2 in 2010 to 10.2 hm2 in 2020 (http://www.tjj.beijing.gov.cn, accessed on 3 May 2022).

2.2. Data Sources and Integrate Framework

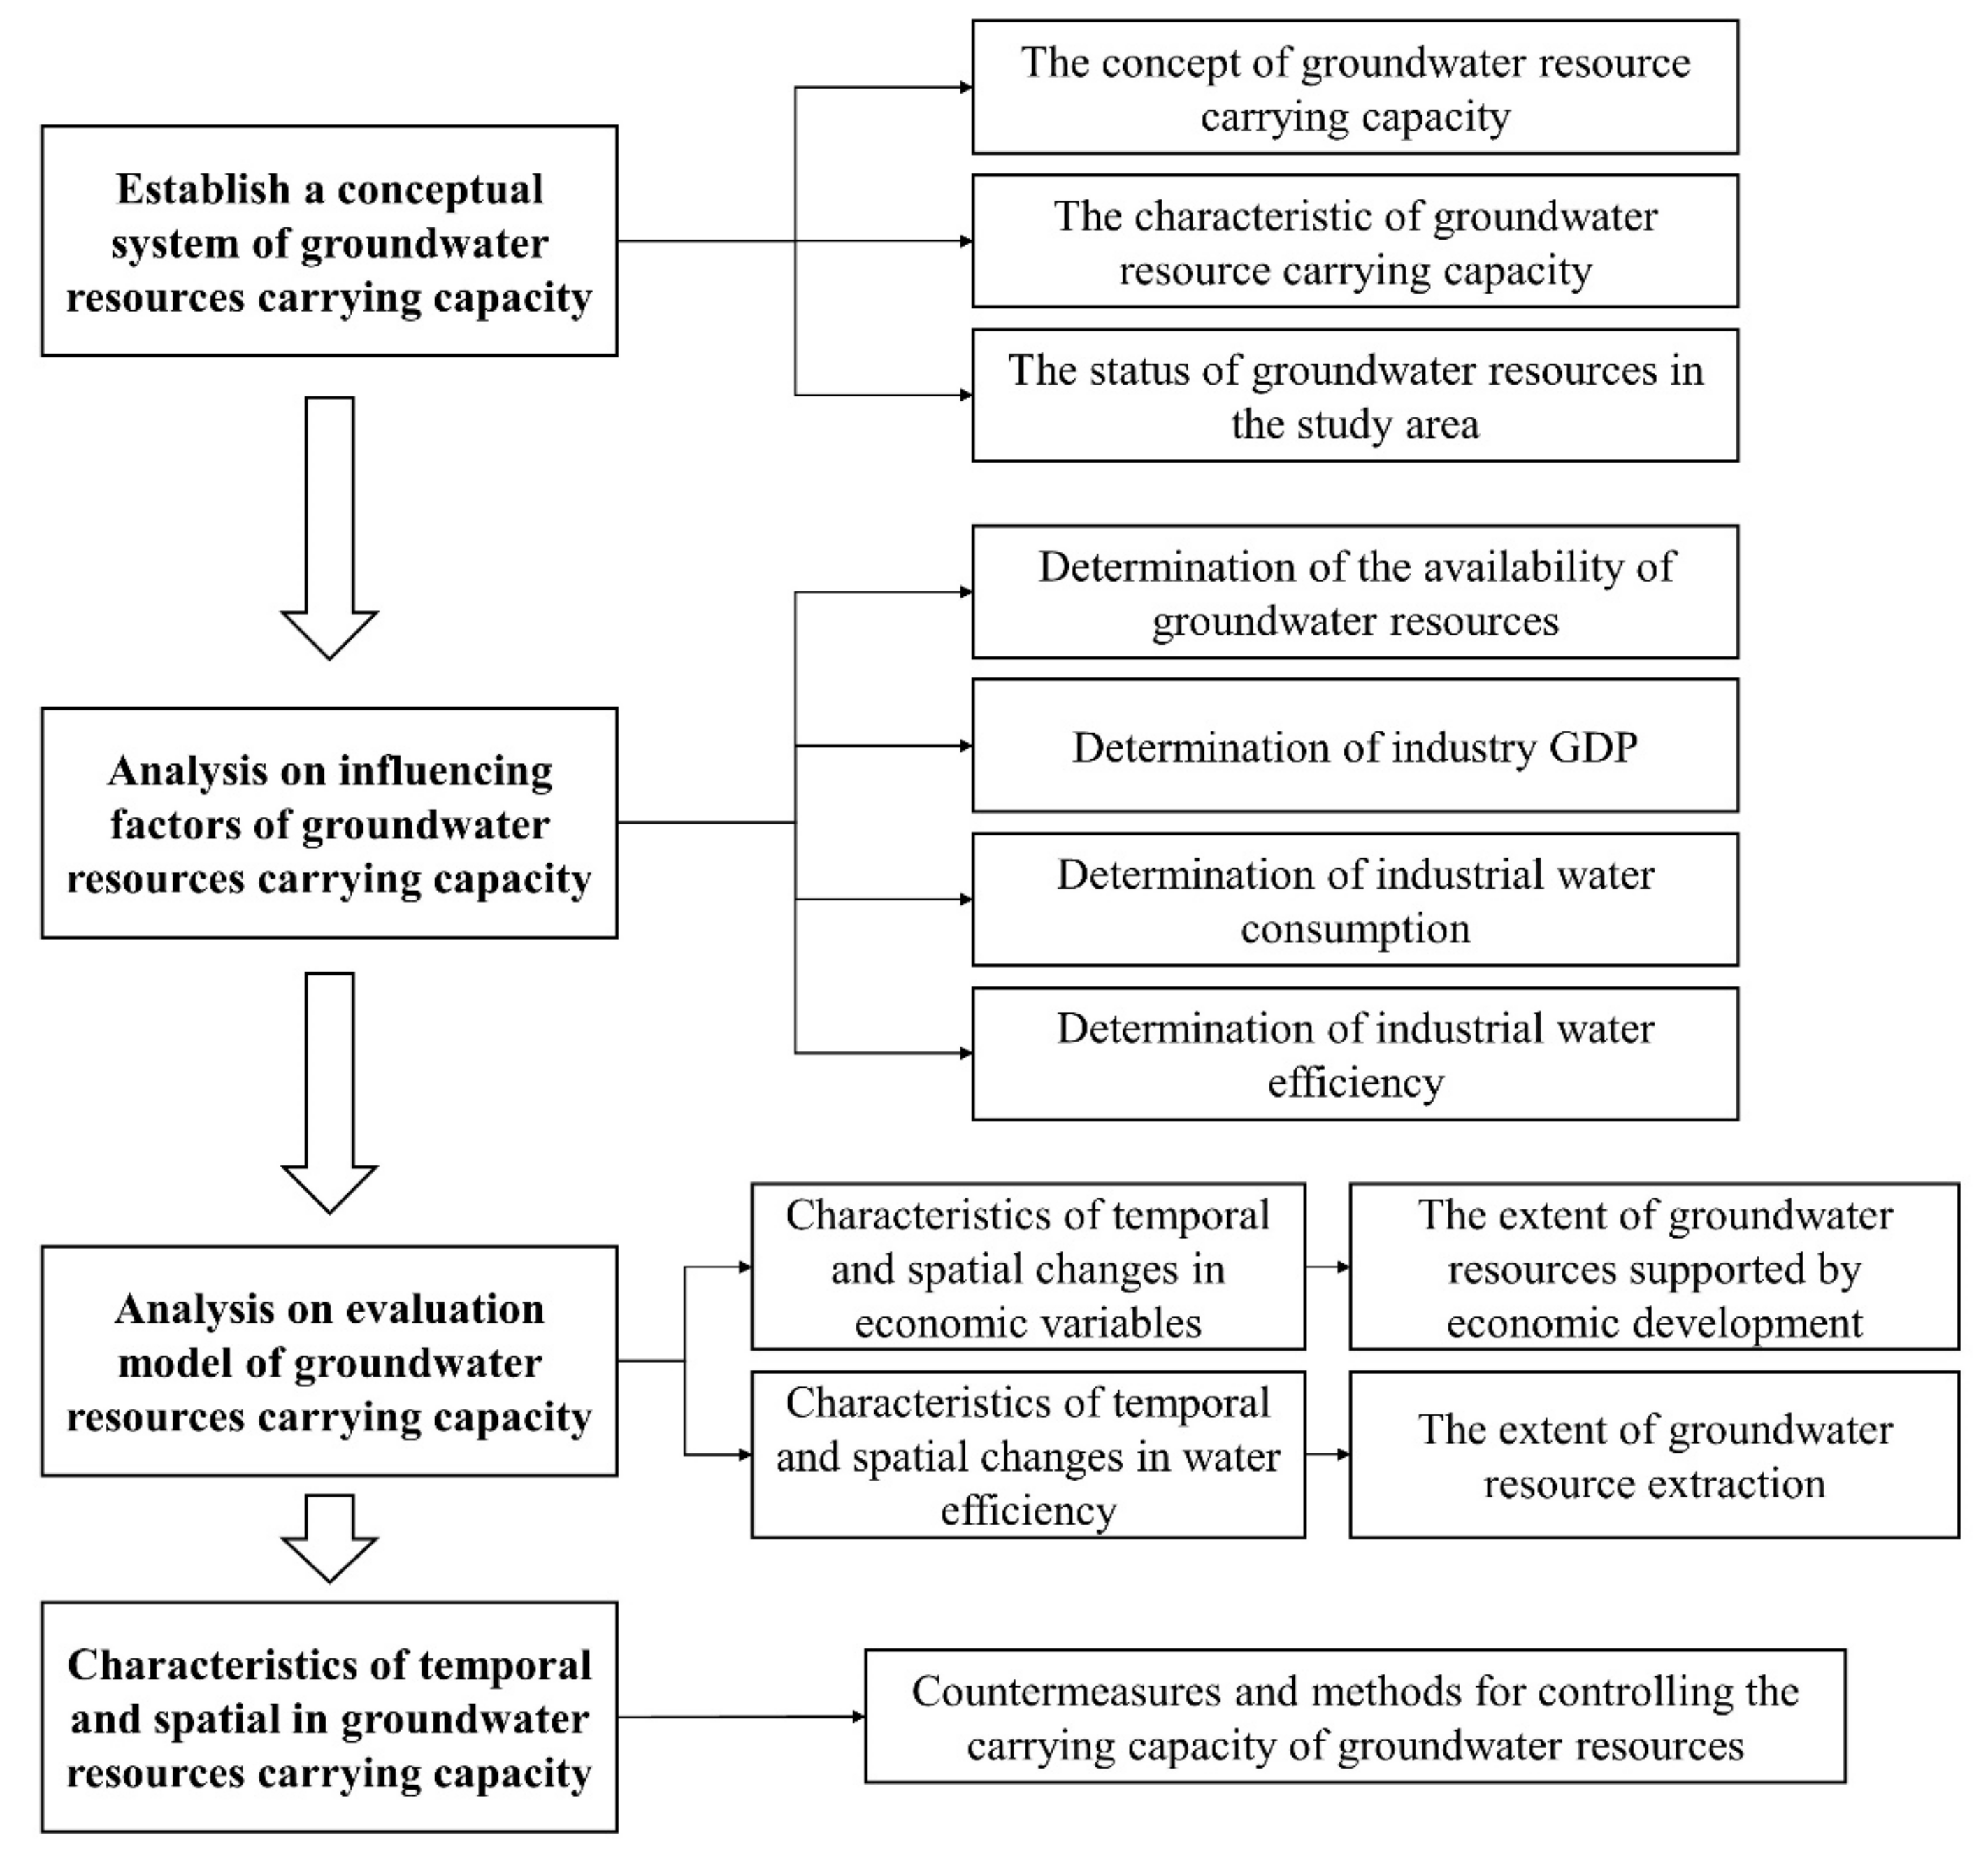
The sources of surface water resources, groundwater resources and groundwater supply involved in this study are all from the Beijing Water Statistical Yearbook in the corresponding year [37]. The data of water consumption and actual groundwater exploitation of specific departments in Beijing are from the Beijing Water Resources Bulletin in the corresponding year [38]. The population data, GDP data and other relevant economic data indicators come from Beijing Statistical Yearbook of water conservancy (http://www.tjj.beijing.gov.cn, accessed on 3 May 2022). The assessment framework is proposed based on the characteristics of temporal and spatial factors related to groundwater resources carrying capacity to control the effective utilization of groundwater resources. The framework is shown in Figure 2.

2.3. Definition and Construction of the Evaluation Model

There is currently no unified standard for the definition of groundwater resource carrying capacity. Most studies on groundwater resource carrying capacity still use the research method of water resource carrying capacity [14,37]. It builds a systematic criterion layer index, classifies the subordinate index layers in the criterion layer [17,38] and finally calculates the comprehensive index of groundwater carrying capacity according to different algorithm models. Through the comprehensive evaluation of the above steps, the large macro concept of groundwater resource carrying capacity can be quantified. Due to the large subjectivity of index selection, the variety of input data and the uncertainty of algorithm model selection, these methods are greatly limited in practical popularization and application.
From the perspective of research, the natural and social attributes of groundwater resources are taken into account. On the one hand, this depends on the natural recharge capacity and maximum water supply capacity of groundwater resources under the constraints of the natural environment. On the other hand, it depends on the water use efficiency of various industries and the supporting capacity of social and economic development. The study area of Beijing is in the North China Plain, which is within the definition of Gao et al. [39]. The study area of Beijing belongs to the North China Plain, which is within the scope defined as the basis for the study of groundwater resource carrying capacity. The maximum groundwater availability and the maximum water use efficiency of various sectors were taken as the premise and the maximum supportable social and economic development scale (GDP) was used to characterize the groundwater carrying capacity. In this study, the response of groundwater resources to changes in the economic development process was focused on.
According to the above definition, groundwater resource carrying capacity (G) is a function of water use efficiency (θ) and the availability of groundwater resources (A) and the expression relationship between them is as follows:
G = A × θ
where G is the scale of social and economic development supported by groundwater which expressed in GDP (yuan); θ is the water efficiency which includes various industries (yuan/m3); and A refers to the amount of groundwater resources with natural and social factors as independent variables (m3), such as precipitation size and intensity, surface water characteristics, artificial recharge scale, lithology’s thickness and the permeability of vadose zone, the depth of the groundwater and so on.
θ = a θ d o m + b θ e c o + c θ a g r + d θ i n d + e θ c o n + f θ s e r
θ d o m = V d o m C d o m θ e c o = V e c o C e c o θ a g r = V a g r C a g r θ i n d = V i n d C i n d θ c o n = V c o n C c o n θ s e r = V s e r C s e r
Water use efficiency (θ) is divided into domestic water use efficiency (θdom), ecological water use efficiency (θeco), agricultural water use efficiency (θagr), industrial water use efficiency (θind), construction water use efficiency (θcon) and service water use efficiency (θser), which is expressed by the ratio of the total output value of a certain department (GDP) and the total water consumption of the department. Vdom, Veco, Vagr, Vind, Vcon and Vser represent GDP for domestic living, ecological environment, agriculture, industry, construction industry and service industry. Cdom, Ceco, Cagr, Cind, Ccon and Cser represent the water consumption of domestic living, the ecological environment, agriculture, industry, the construction industry and the service industry. For θ, the weight of the water consumption of all sectors should be considered. The weights of domestic water, ecological water, agricultural water, industrial water, construction water and service water in all the total water consumption, respectively, are a, b, c, d, e, f.
It can be obtained from Equation (1) that the carrying capacity of groundwater resources is proportional to the regional water use efficiency and the available amount of local groundwater. For the selected study area, the maximum groundwater availability for the study area at that time is known and the maximum theoretical groundwater resource carrying capacity (Gmax) of the study area can be obtained by selecting the largest one under different water use efficiency. The factual and maximum theoretical groundwater resource carrying capacity can be calculated as:
G f a c = A   ×   θ
G m a x = A m a x   ×     θ m a x

2.4. Evaluation Method of Groundwater Resource Carrying Capacity

In order to comprehensively evaluate the variation characteristics of groundwater resource carrying capacity under the condition of the interannual scale in Beijing, this study used the groundwater resource carrying capacity assessment coefficient (C) to reflect the degree of groundwater exploitation (De) on the degree of economic development (Dg). The correlation is the ratio between economic development supported by groundwater resources and groundwater exploitation [39,40]. The specific formulas are as follows:
D g = G f a c G m a x
D e = W A
C = D g D e
where W is groundwater withdrawal (m3), A is the availability of groundwater resource (m3) and C is the assessment coefficient (non-dimensional). The formula of the economic development degree of groundwater resources is the ratio relationship between normal water use efficiency and maximum water use efficiency, so the whole value is less than 1. The higher the C value, the smaller the carrying capacity of groundwater resources, the greater the contribution of groundwater exploitation degree to economic development and the more serious the overloading of groundwater exploitation. On the contrary, the overloading of groundwater exploitation is lighter.
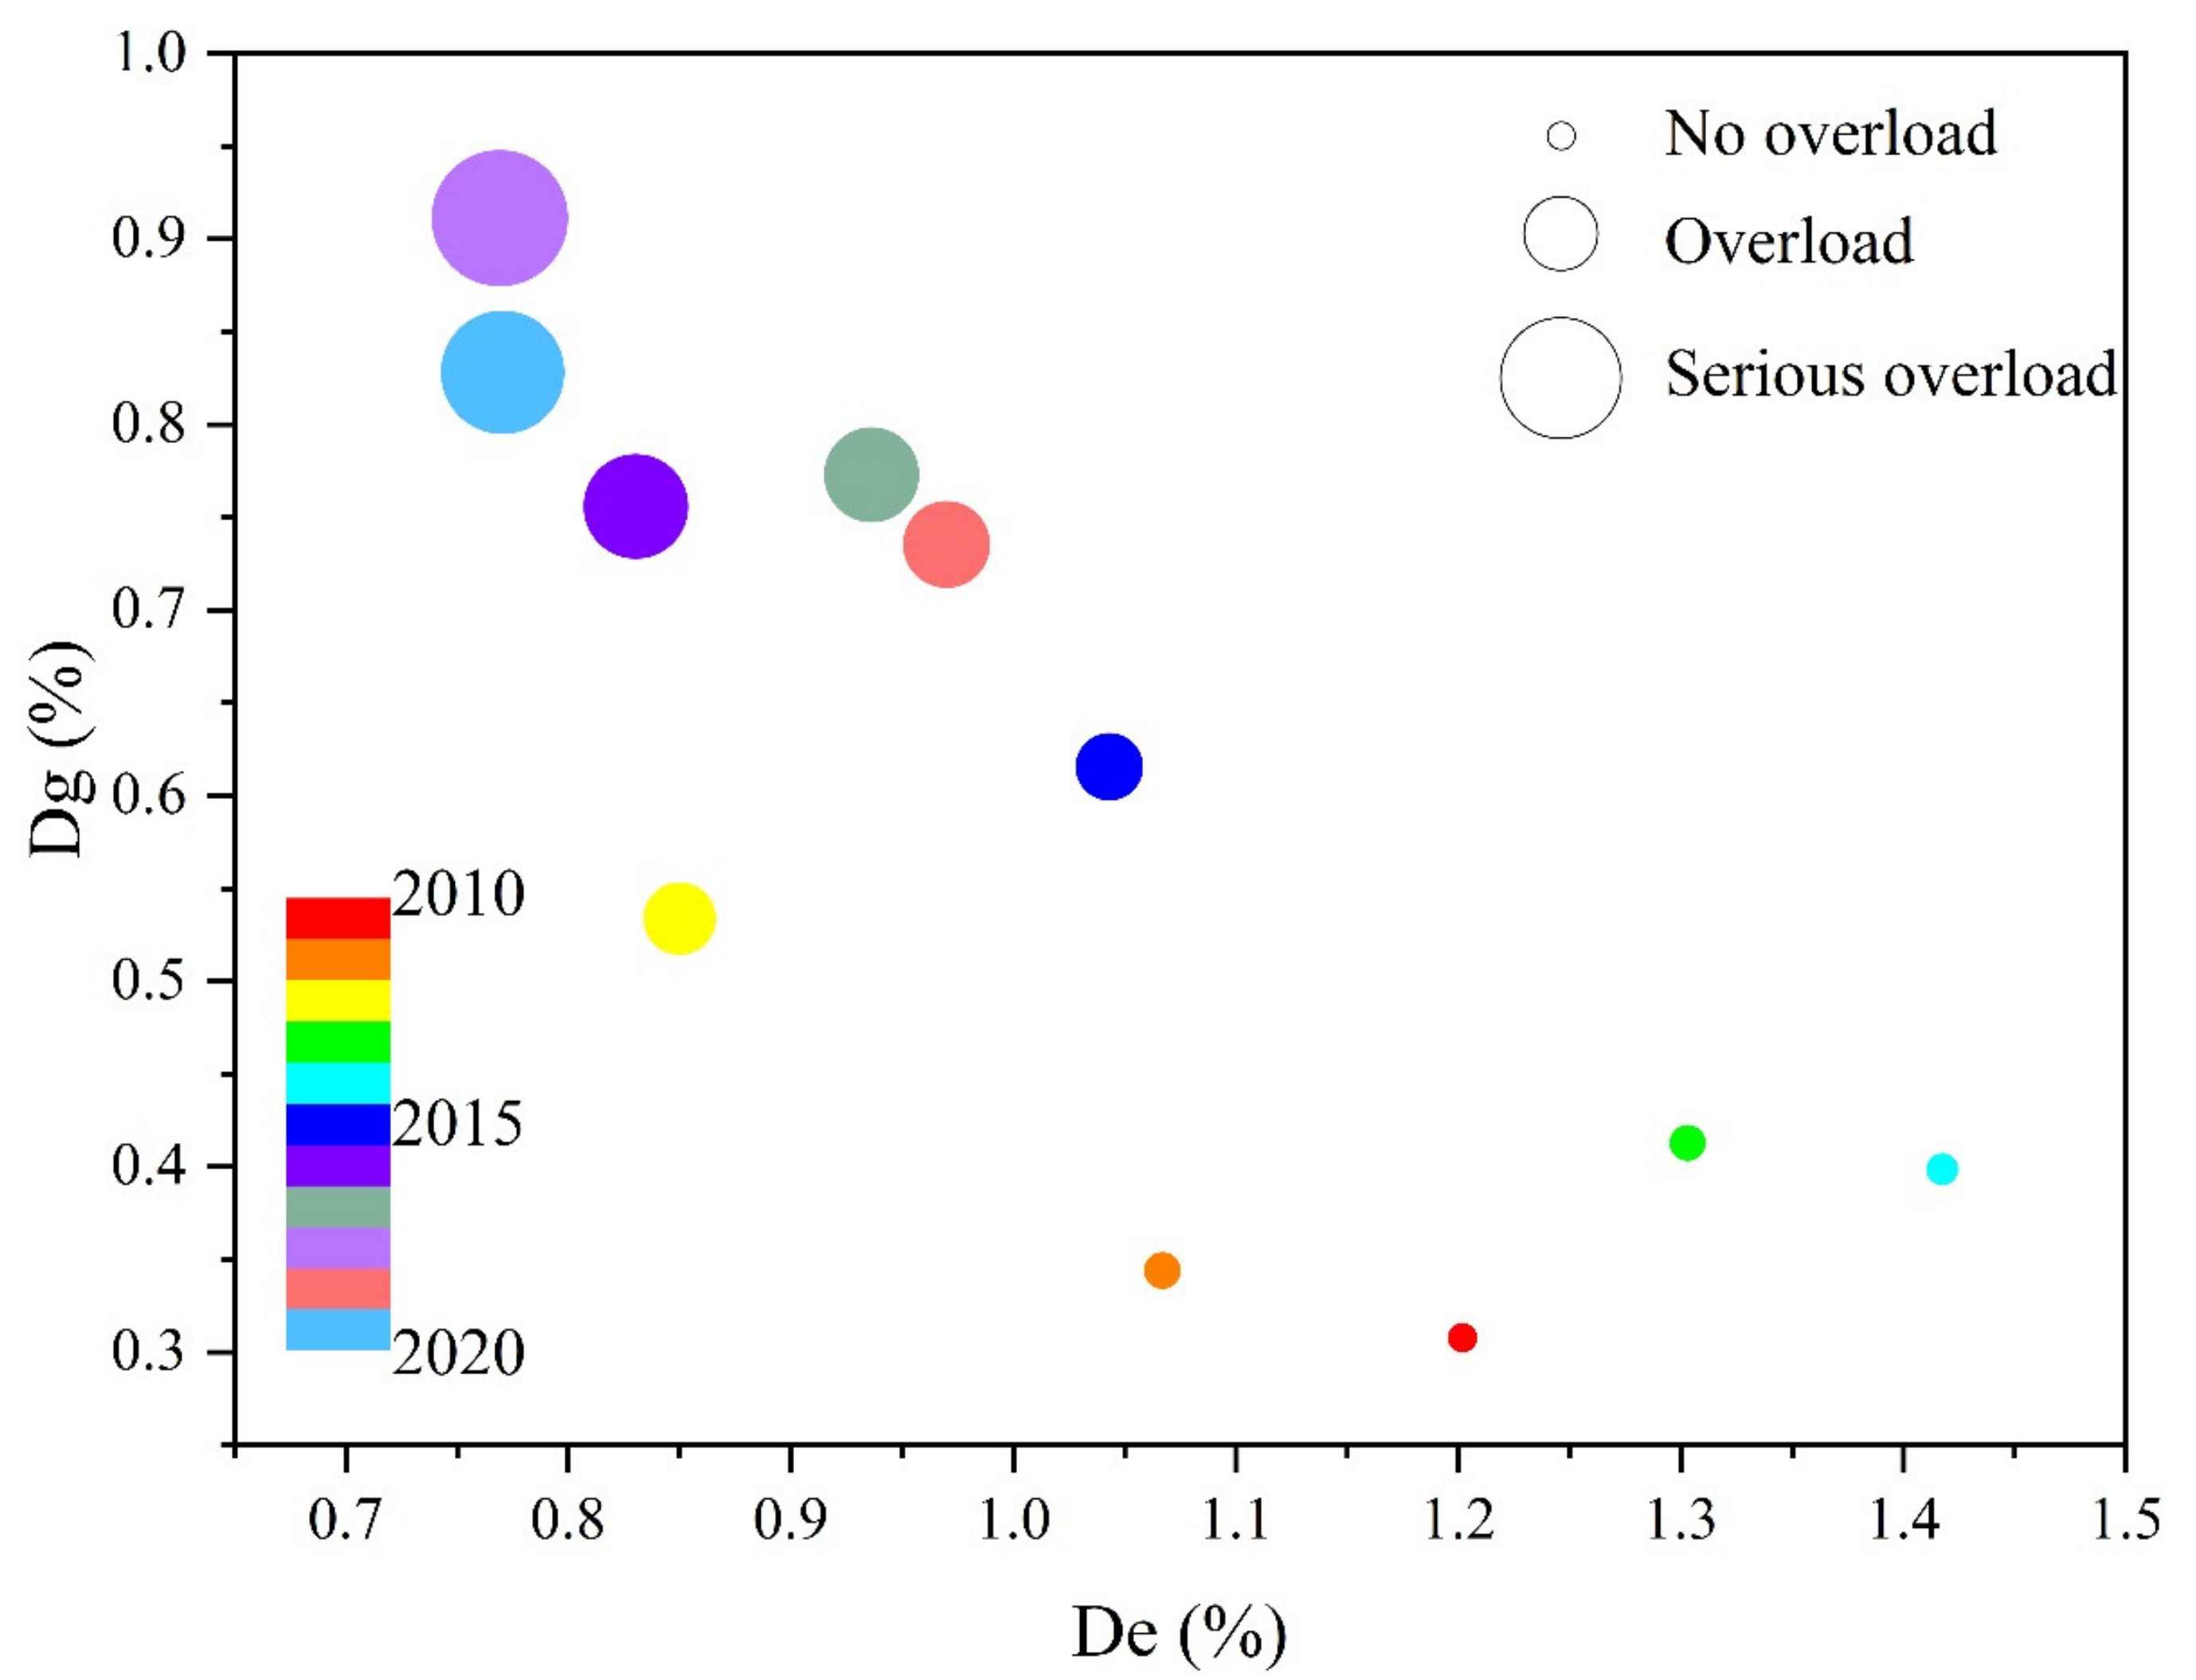
The degree of overloading for C can be divided into three parts [39]: no overload (C ≤ 30%), overload (30% < C < 50%) and serious overload (C ≥ 50%).

3. Results and Discussion

3.1. Analysis of Water Supply and Water Use Situation in Beijing

According to the results of the third survey and evaluation of water resources in Beijing (statistical data from 2001 to 2016), the annual average amount of water resources in Beijing was 2.30 billion m3, the annual average amount of groundwater resources was 2.29 billion m3, the groundwater exploitation was 1.97 billion m3 and the total water supply was 2.09 billion m3. The total exploitation and utilization of water resources was 91%. The proportion of water use and supply by all departments of Beijing in the past decade is shown in Figure 3.
The proportion of agricultural water consumption in the total water consumption in Beijing decreased from 32.36% in 2010 to 8.96% in 2020 (Figure 3a). Agricultural water refers to water used for irrigation and rural livestock. Due to the construction of efficient water-saving projects and the widespread promotion of water-saving irrigation in this area [11,23], the usage of groundwater resources from agricultural consumption has been controlled to a certain extent. The proportion of ecological water consumption has increased year by year, from 11.29% in 2010 to 42.14% in 2020. The main components were green sanitation and water replenishment for rivers and lakes, which indicates that Beijing is actively implementing ecological water replenishment for rivers and lakes to promote groundwater replenishment. From the change process of the water supply ratio in Beijing in Figure 3b, it can be seen that the groundwater water supply ratio in 2010, 2015 and 2020 continued to decline, while the reclaimed water supply ratio increased steadily, and the surface water and South-to-North water diversion also increased relatively. It also illustrates that the economic and social development of Beijing is still related to the demand of groundwater resources.

3.2. Analysis of Groundwater Resources Carrying Capacity in Beijing

3.2.1. Temporal and Spatial Variation Characteristics of GDP and Water Use Efficiency

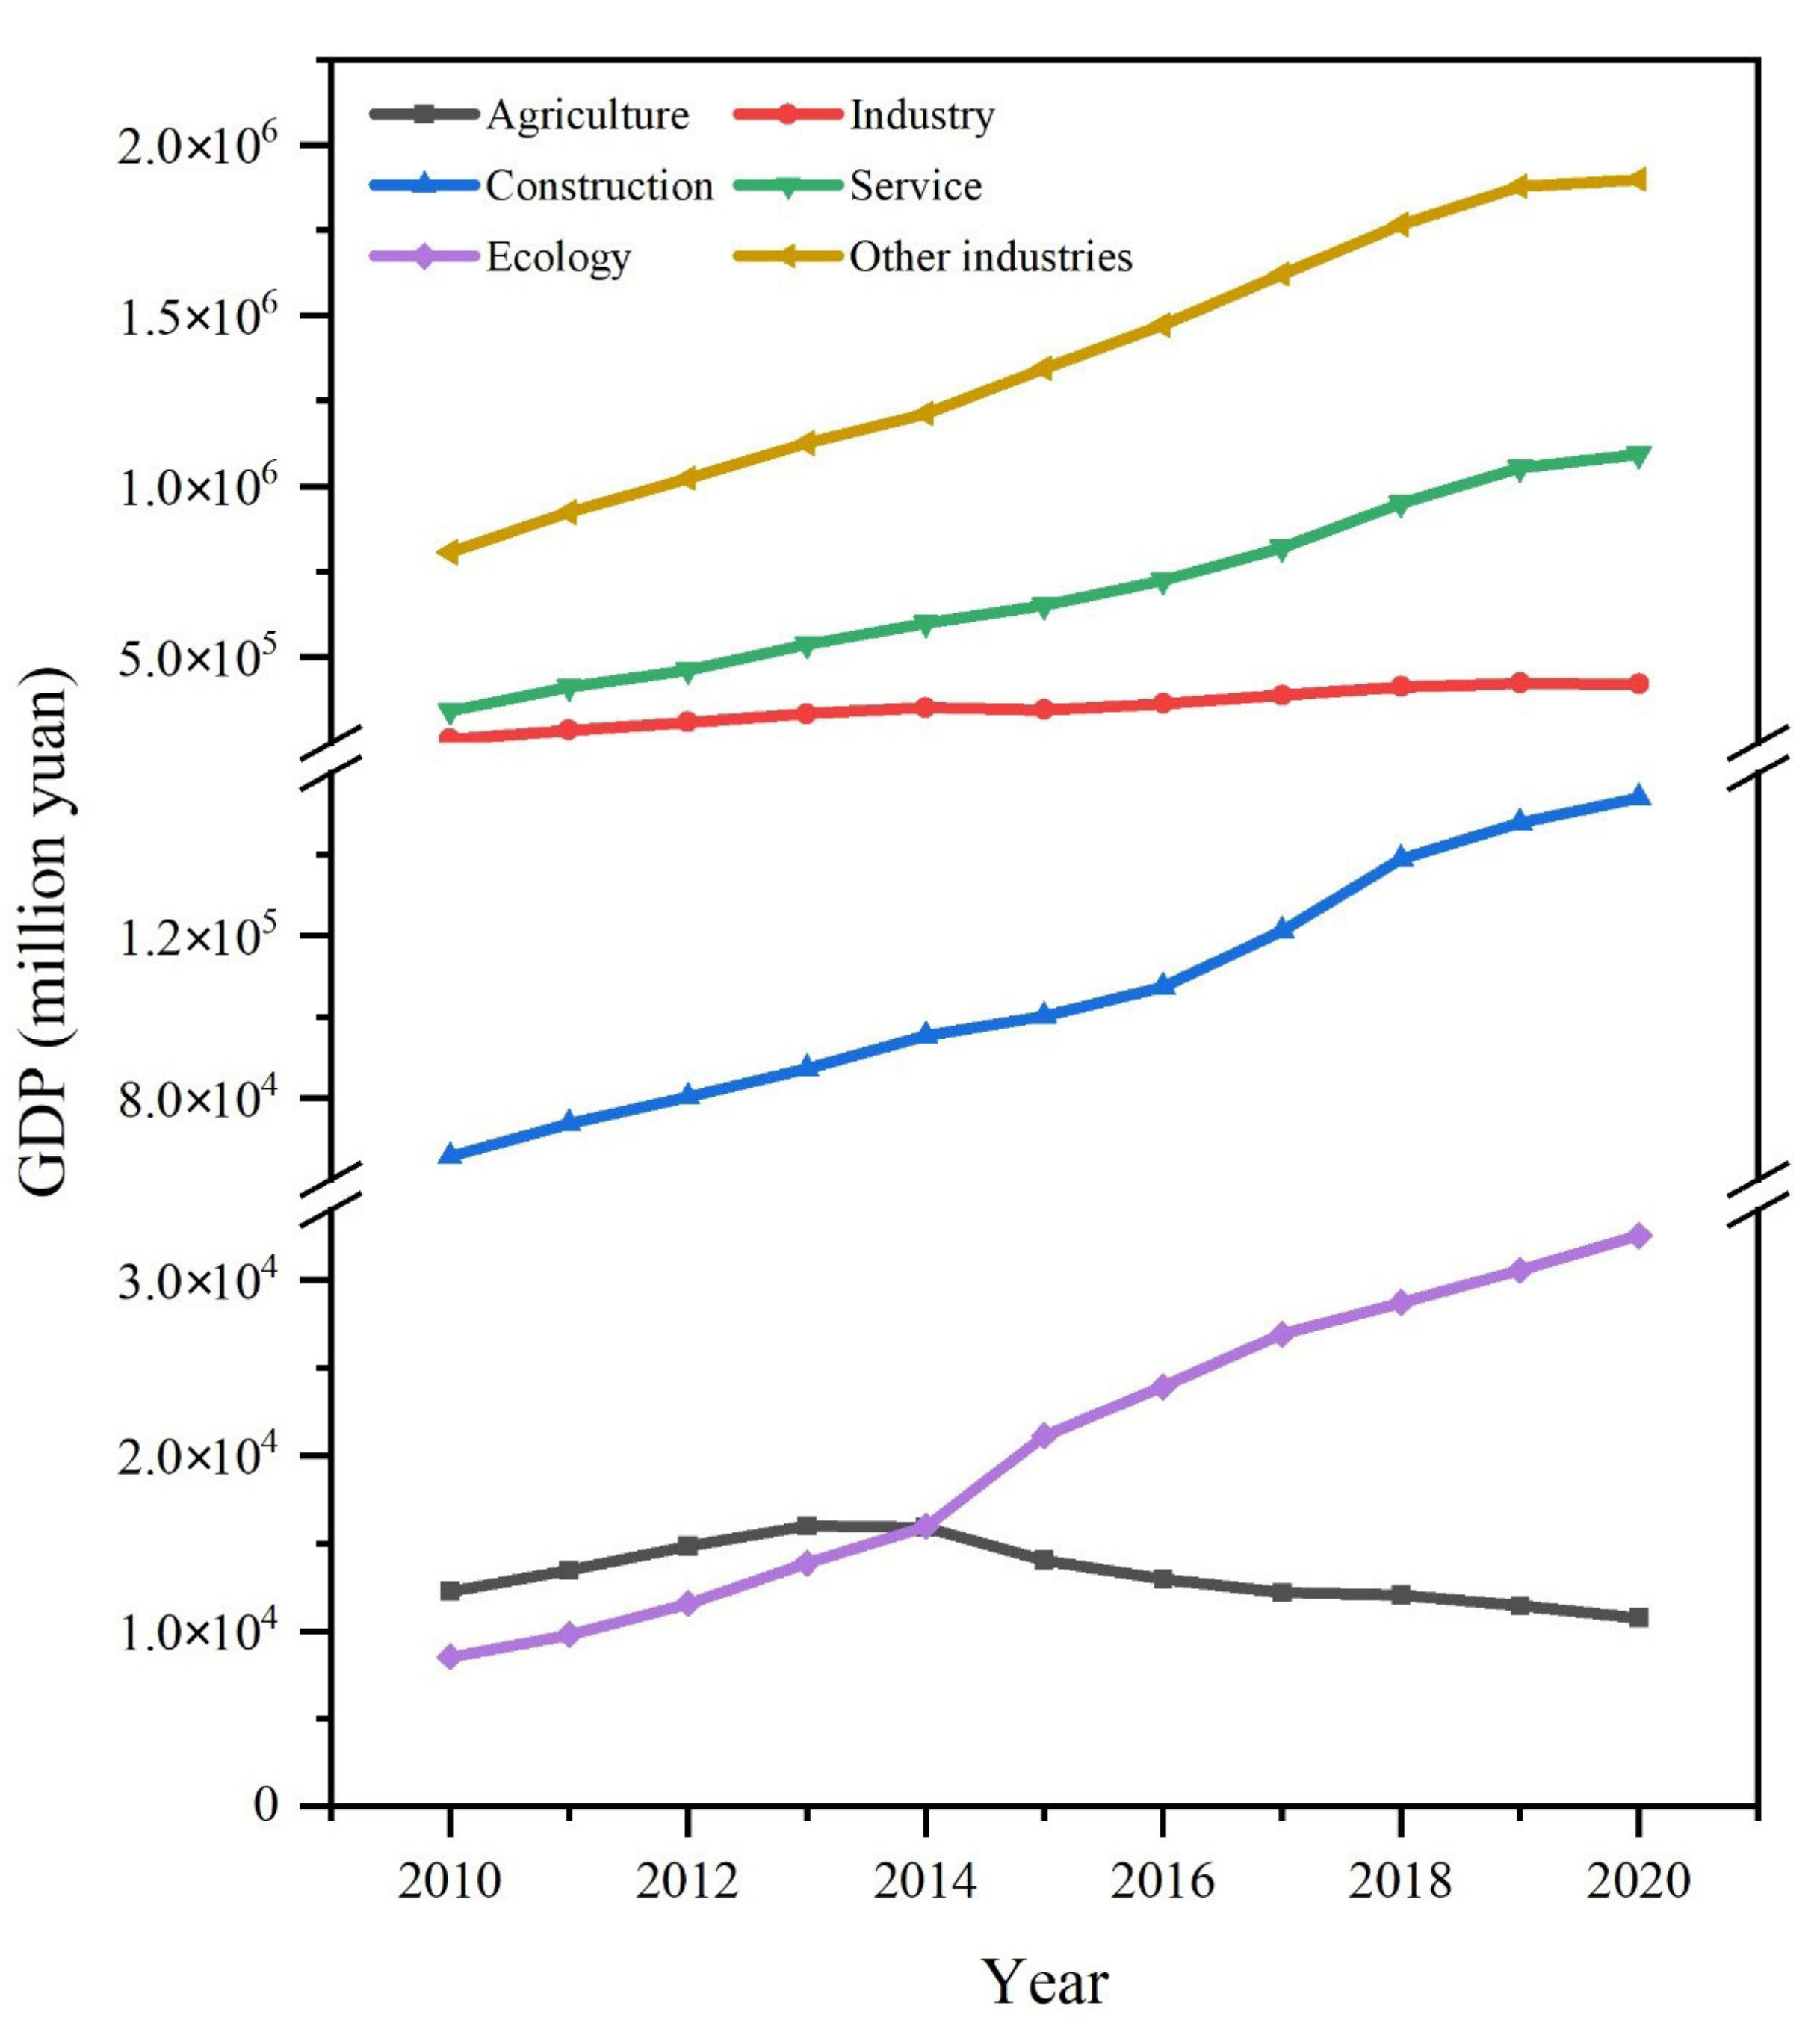
In this study, all industries in Beijing were divided into six categories for discussion. From the perspective of time series, the GDP of the six industries except agriculture were all in the stage of rapid growth from 2010 to 2020 (as shown in Figure 4). In terms of agriculture, Beijing has adopted efficient agricultural water-saving policies and reduced the usage of agricultural groundwater by adjusting the agricultural planting structure. As a result, the corresponding decrease rate of agricultural GDP was 12.38%. At the same time, ecological GDP increased the most, reaching 281.92%. The growth rate of GDP followed by service industry was 219.47%, for other industries it was 135.23%, for the construction industry it was 134.4% and industry increased by 61.71%. From the upward trend, the growth trend of construction, ecology and other industries was significantly higher than the rest.
From the perspective of the spatial distribution of GDP of all industries (Figure 5), the distribution characteristics of the service industry, ecology and other industries were basically the same, showing a focused radiation, which increased in turn from the surrounding suburbs of Beijing to the urban center, and finally converged in the four urban areas of Chaoyang, Haidian, Xicheng and Dongcheng which had the largest GDP. The difference for the construction industry is that it gradually expanded and increased from the northern and western mountainous areas of Beijing to the central and southeastern plains. In terms of industry, the GDP was the largest in Daxing and Shunyi and the surrounding areas were relatively small. In terms of agriculture, due to the special location and industrial distribution of Dongcheng, Xicheng and Shijingshan, the three areas were not involved in it. The remaining 13 regions had the largest GDP in the eastern and southern regions and Shunyi had the largest, while the northern and western regions were relatively small and Fengtai was the smallest.
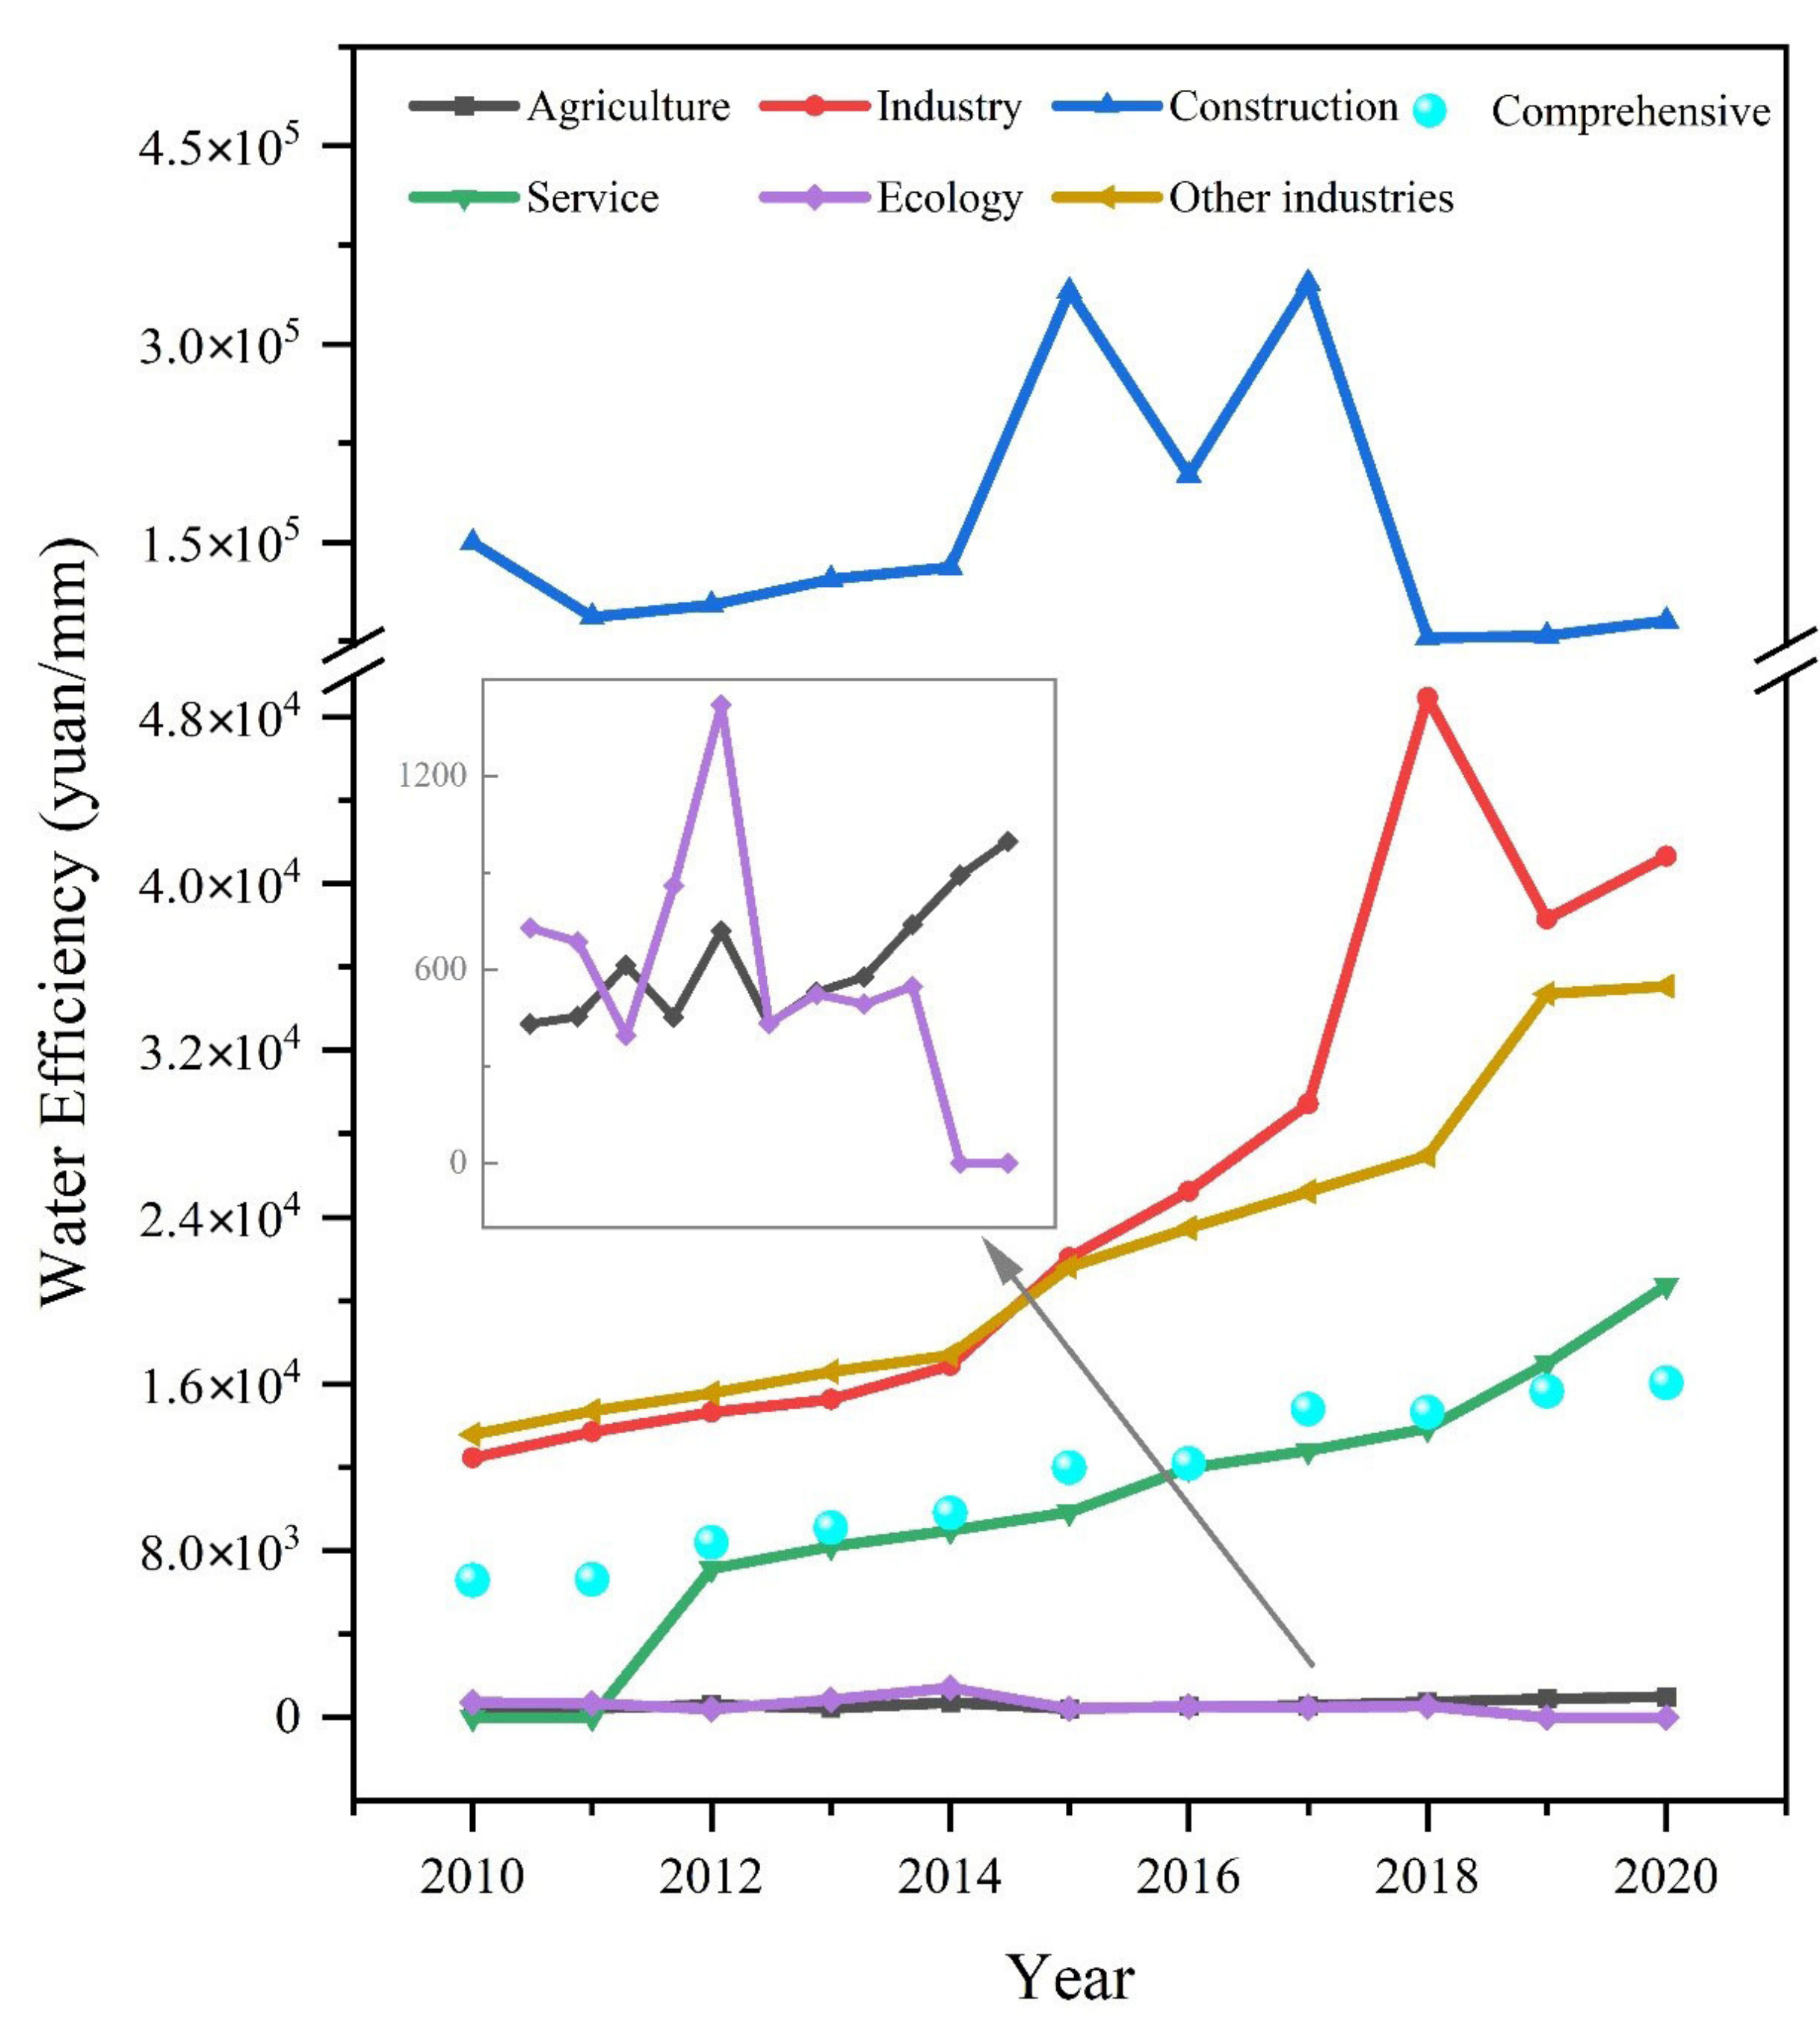
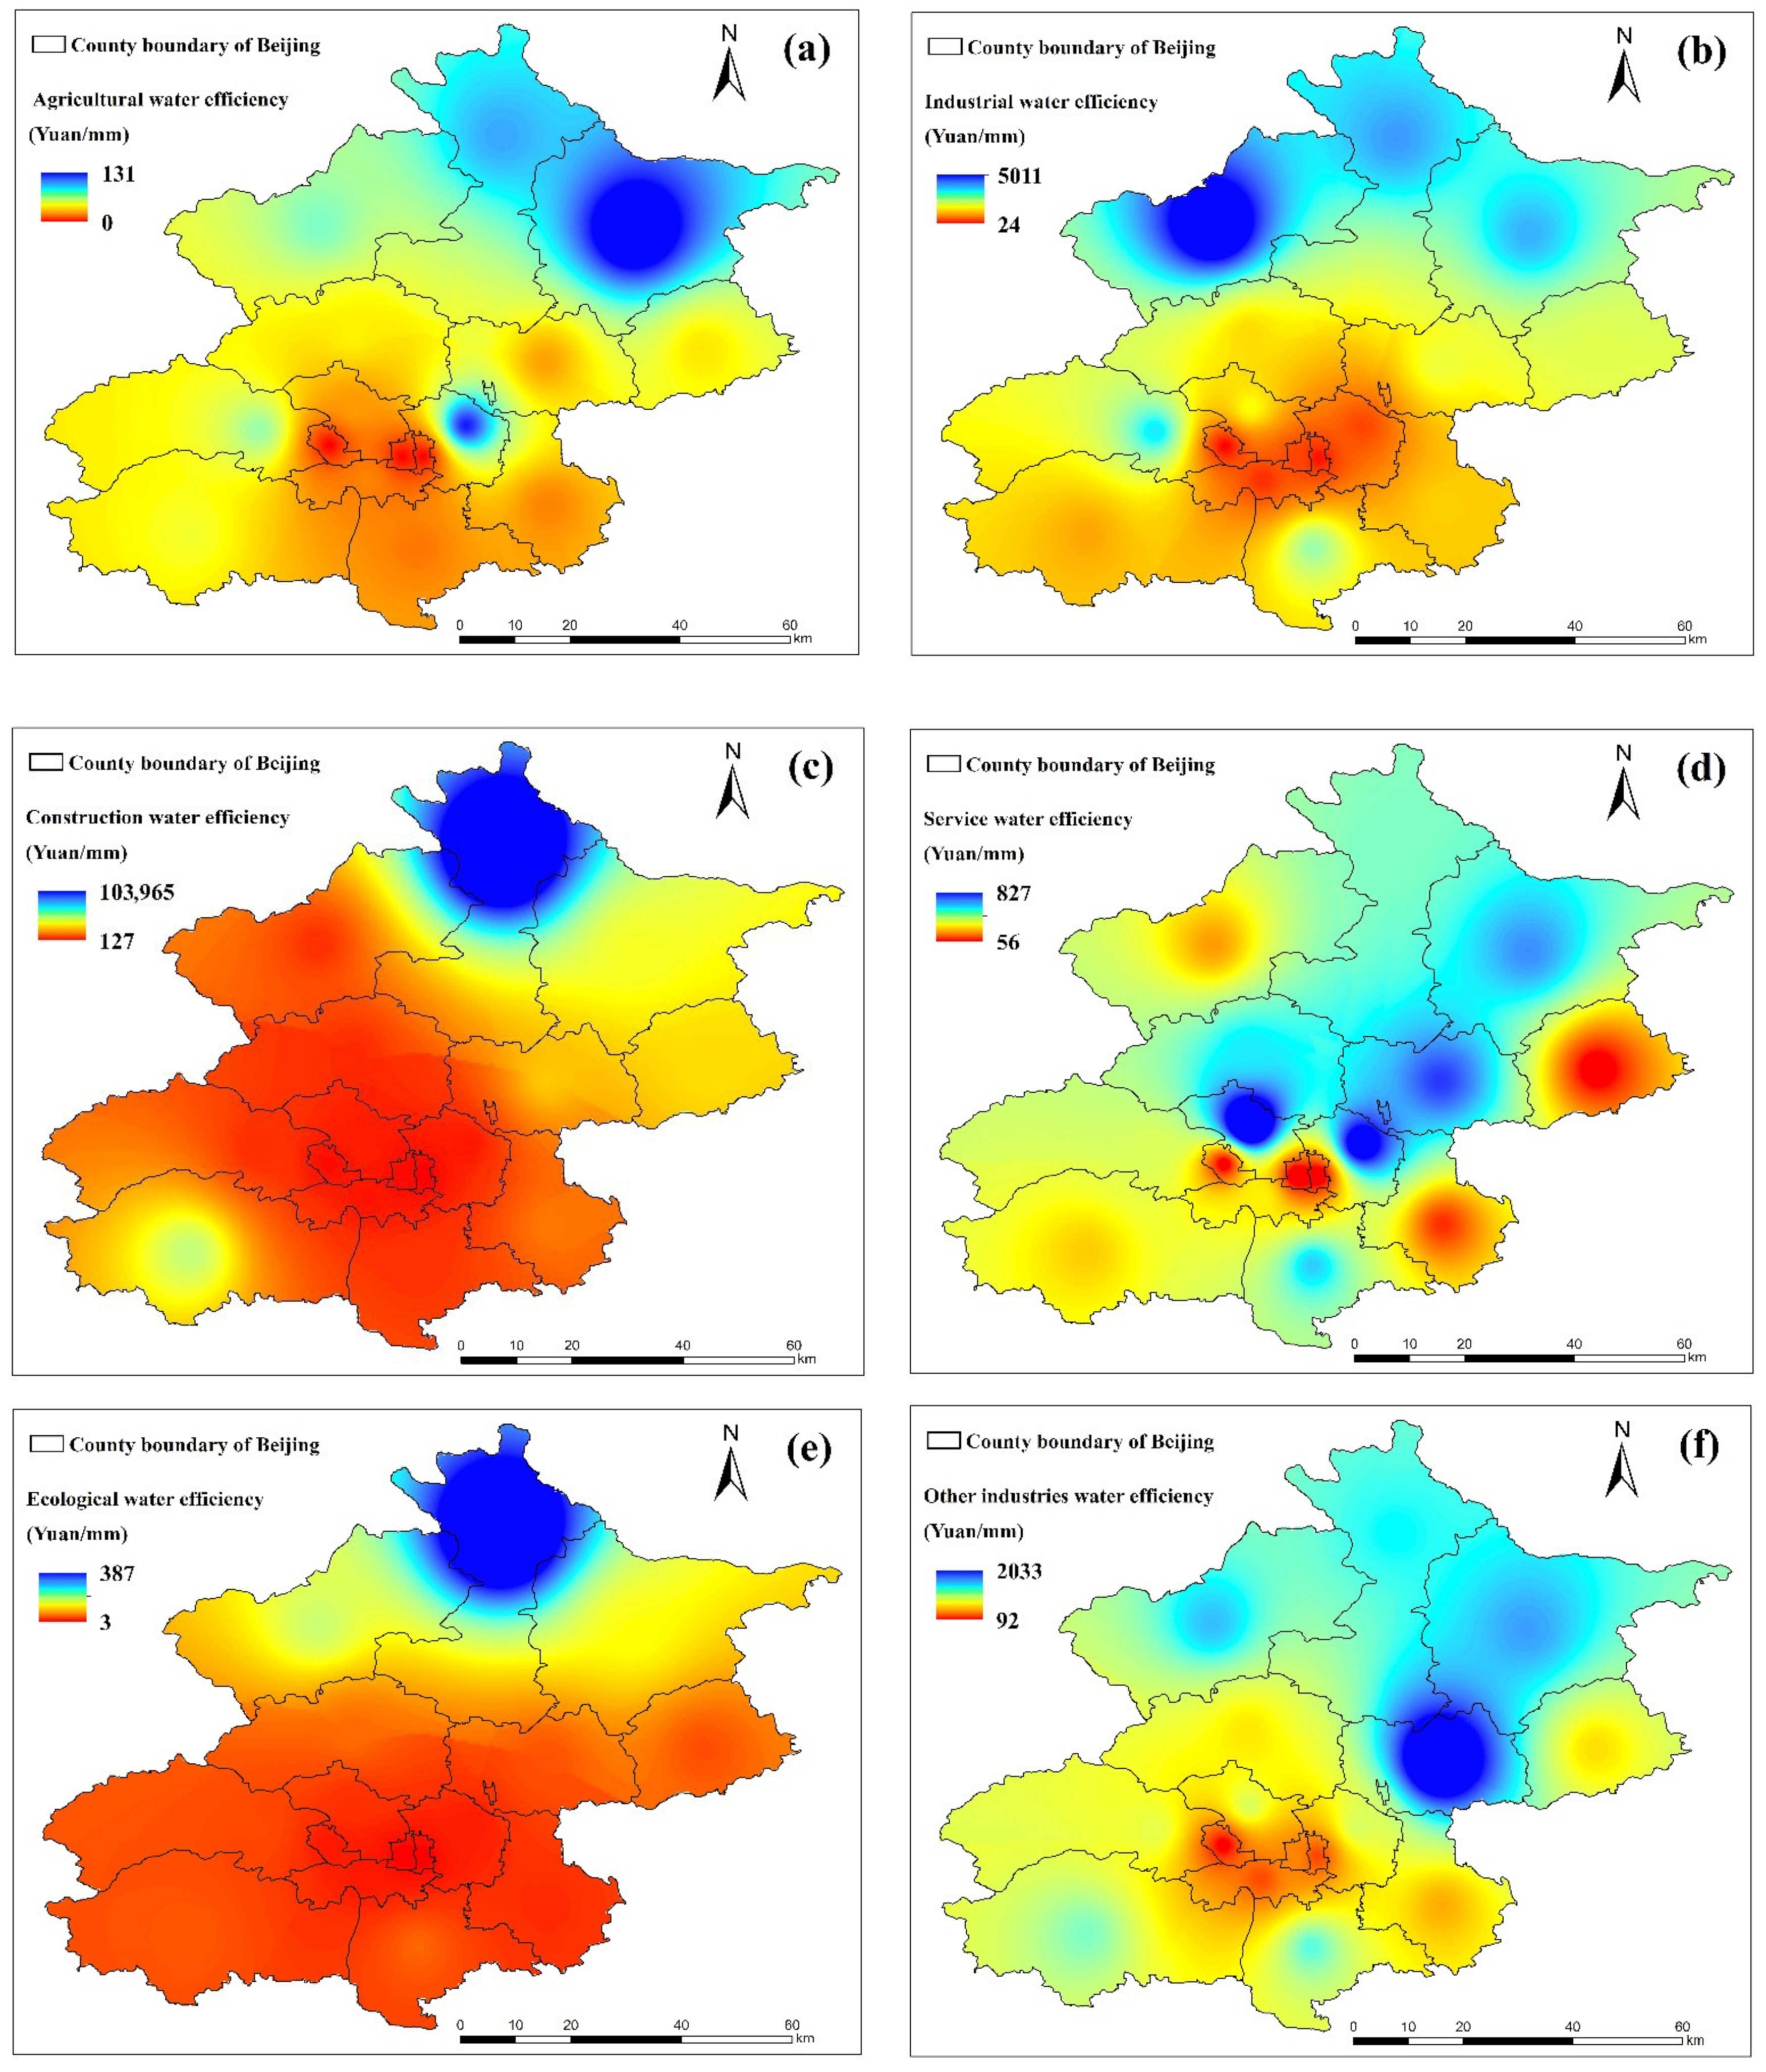
While the GDP of various industries in Beijing changed, the water efficiency of various industries also changed. Figure 5 and Figure 6 show the spatial and temporal variation characteristics of department water use efficiency in Beijing from 2010 to 2020. Since it is necessary to evaluate the spatial distribution of the industrial water use efficiency in each area of the study areas, according to the research needs of the dimension of the calculation results, the units of the usable amounts of industrial water consumption and groundwater were converted to depth (mm). Therefore, the converted water use efficiency unit is yuan/mm.
From Figure 6, it can be seen that except for the decrease in the change of water use efficiency in the construction industry and ecology, all others were on the rise. Among them, industrial water efficiency increased the most, with a growth rate that more than doubled, followed by services, other industries and agriculture. The change trend of comprehensive water use efficiency was from 6591 CNY/mm in 2010 to 16,060 CNY/mm in 2020, showing an increasing trend year by year. This change shows that Beijing insisted on giving priority to water conservation, comprehensively promoted water conservation in various fields and industries, improved water use efficiency and strove to reduce the overall level of groundwater development and utilization in the industry, which is in line with the “negative growth of new water for agriculture and zero growth of new water for industry, controlled growth of domestic water use, moderate growth of ecological water use” water management and control principles.
In Figure 7, except for the whole region of Miyun and the northeast region of Chaoyang, it can be seen that the agricultural water efficiency was relatively low. The industrial water use efficiency was the highest in the Yanqing area, followed by the Huairou and Miyun region, but it does not fully explain why its industrial development was better. While the water use efficiency was high, it should also aim to reduce the overall industrial water consumption, rather than simply increase water use efficiency. The construction industry and ecology were characterized by prominent water use efficiency in the northern part of Huairou, while the service industry was characterized by the convergence of the suburbs on both sides to the city center. The closer to the center, the higher the water use efficiency of the service industry. The water efficiency of other industries was mainly in the Shunyi and Miyun regions. The above results show that improving the water use efficiency of the ecological and construction industries represents an important breakthrough direction for improving comprehensive water use efficiency of Beijing.

3.2.2. Temporal and Spatial Variation Characteristics of the Assessment Coefficient

The economic scale GDP of groundwater resources carrying capacity in Beijing changed with the change in water use efficiency of all industries in Beijing. According to the calculation of the research method in Section 2, it can be seen that the maximum carrying capacity of groundwater resources can be obtained by finding out the water use efficiency of the maximum period under the premise of obtaining the maximum available amount of groundwater in the research period. The corresponding maximum carrying capacity of groundwater resources was CNY 2068.9 billion, while the corresponding actual carrying capacity of Beijing showed an upward trend, rising from CNY 637 billion in 2010 to CNY 1885.7 billion in 2018, and falling to CNY 1713.7 billion in 2020. On the whole, although the GDP actually supported by groundwater in Beijing was lower than the maximum carrying capacity of groundwater resources, it does not mean that we can exploit groundwater resources indefinitely for economic development.
As shown in Figure 8, the actual carrying capacity of groundwater from 2010 to 2018 approached the maximum carrying capacity of groundwater resources, and it was close to saturation. The proportion of the economic development degree also increased from 0.3 in 2010 to 0.91 in 2018 and decreased to 0.83 in 2020. Overall, it was still a big growth rate. The development and utilization of Beijing still faces severe challenges. The degree of groundwater exploitation went from 1.2 in 2010 to 1.04 in 2015. During the period, groundwater exploitation was in a state of overexploitation. After 2015, the phenomenon improved a lot. This was not due to the over-exploited trend; the critical reason was that the south-to-north water transfer project of water entered Beijing to relieve the use of groundwater pressure after 2015. It can be seen from Figure 2 that the ecological water consumption increased to carry out the ecological filling water of lakes and groundwater recharge. At the same time, due to the vigorous promotion of agricultural water-saving irrigation measures and the substitution of high-water-consuming production processes and industries, the use of groundwater was greatly reduced.
As can be seen from Figure 8, during 2010–2015 in Beijing, the values calculated by the evaluation index were not overloaded and overloaded. At this time, the carrying capacity of groundwater resources supported by the region ranged from CNY 637 billion to CNY 1273.6 billion. However, the theoretical economic development range supported by groundwater in Beijing was CNY 2068.9 billion, indicating that the contribution of groundwater exploitation to economic development in Beijing has increased in recent years. When the assessment index of groundwater resources carrying capacity in Beijing was calculated as a serious overload after 2016, department GDP was in the stage of rapid growth and the contribution of groundwater to economic development was more than 60%, indicating that the economic development of Beijing increasingly depended on groundwater exploitation. Besides, the groundwater exploitation degree has always been less than 1, indicating that with the over-dependence of regional economic development on groundwater resources, the evaluation index will keep rising and the supporting capacity of groundwater resources will become more fragile. In the whole study, although the comprehensive water use efficiency continuously improved, the reduction in groundwater exploitation was the main solution that improved the carrying capacity of groundwater resources.
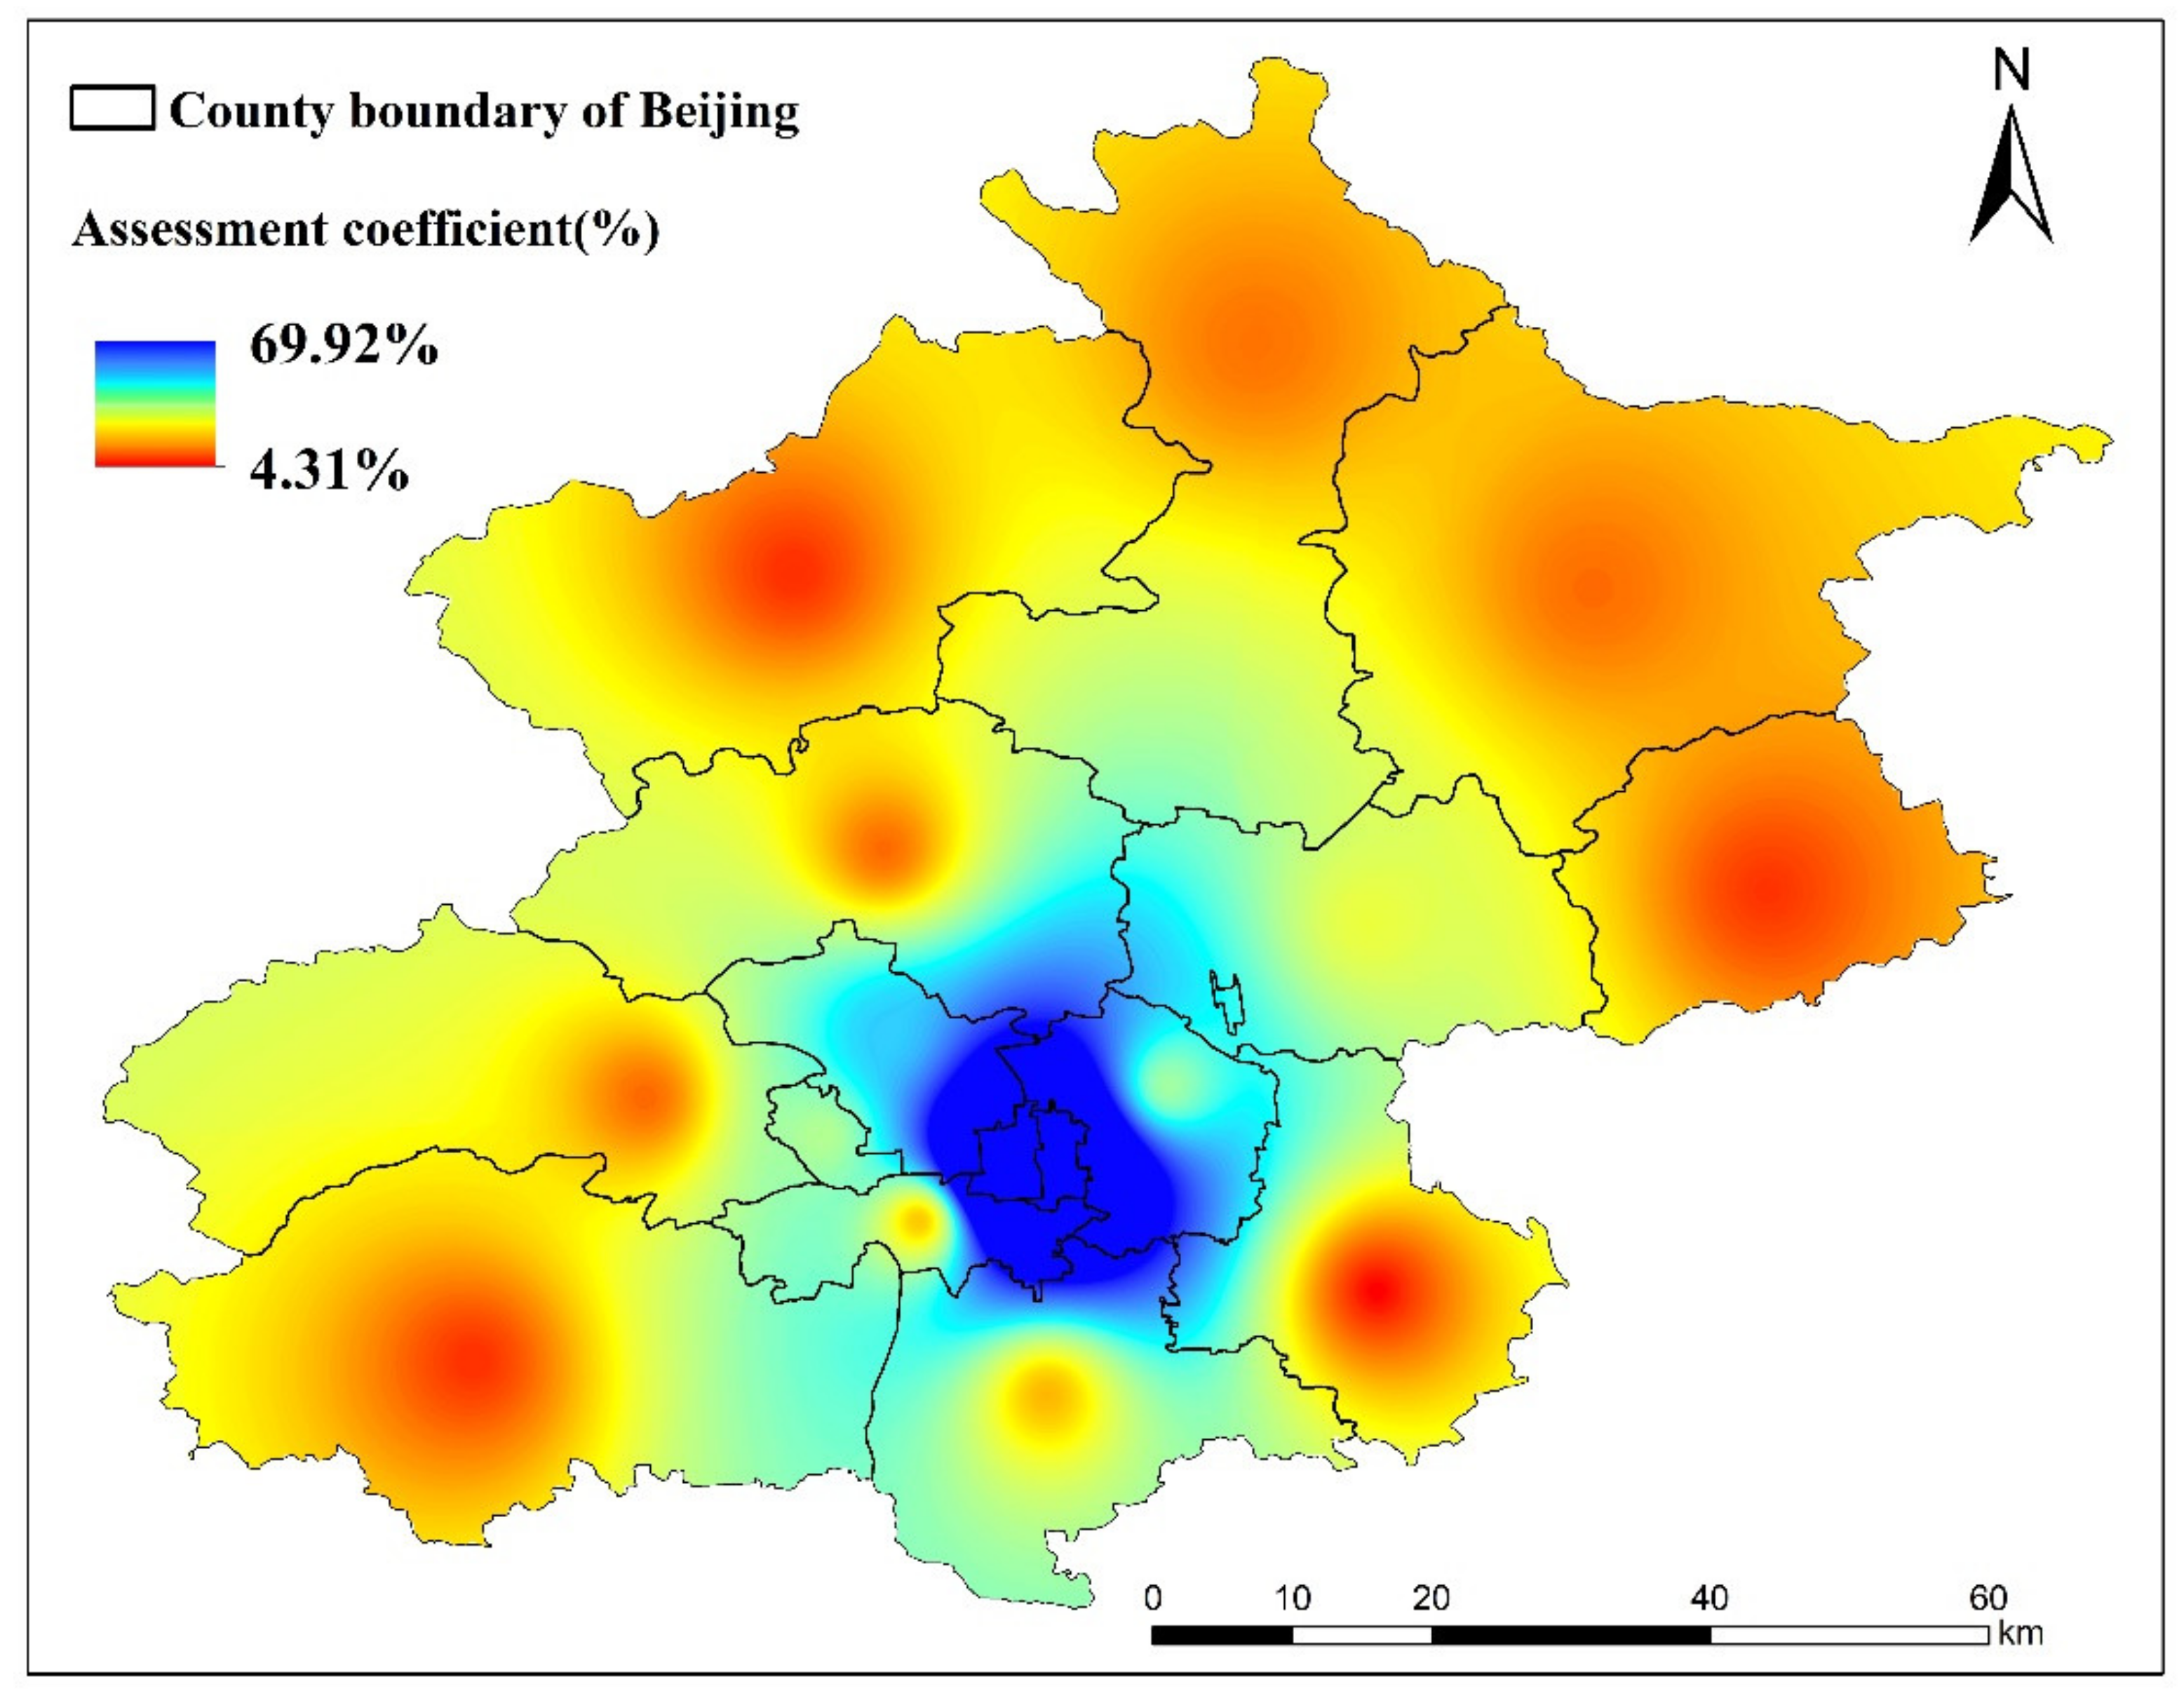
Figure 9 shows the spatial distribution characteristics of the multi-year average value of the groundwater resource carrying capacity assessment index from 2010 to 2020 in Beijing. According to the overload classification standard in Section 2, it can be concluded that only the Dongcheng and Xicheng regions were in the state of overloading of groundwater resources, which were 58.48% and 69.92%, respectively. It shows that at the water efficiency of current water use levels, the amount of groundwater resources will constitute an important constraint on future development in the absence of an increase in the availability of groundwater. The remaining 14 administrative regions were not overloaded. From the perspective of groundwater availability, the degree of groundwater exploitation has approached saturation, while economic development is less dependent on groundwater resources and water use efficiency needs to be improved. There is a large space for water saving and it is still very necessary to recharge the groundwater through a series of comprehensive overdraft control measures.

3.3. Control Countermeasures and Methods of Groundwater Resources Carrying Capacity in Beijing

The carrying capacity of groundwater resources has both the natural attribute of groundwater availability and the social attribute of water use efficiency in the industry. This relationship influences and restricts both these factors, which can be measured from the aspects of reducing groundwater exploitation and increasing groundwater recharge. The water efficiency of the industry is strictly controlled by the water resource constraints of population size, construction scale and industrial development orientation to adhere to the planning and leading role.
In terms of the natural nature of groundwater availability, we can replenish groundwater by increasing the external water transfer and remediation of rivers and lakes. In addition, we can accelerate the replacement of underground water sources and the utilization level of reclaimed water to reduce the use of groundwater resource. Therefore, it is necessary to study the change between the buried depth of groundwater level and groundwater resource that determines the change of groundwater availability.
In terms of the social nature of industry water use efficiency, factors such as industrial structure, water-saving technologies and management policies need to be considered. These measures include, but are not limited to, strict control of the use of groundwater by continuously adjusting and optimizing the agricultural planting structure and industrial structure, accelerating the promotion of agricultural and industrial water-saving renovation projects and accelerating urban water-saving and landscaping. In addition, the implementation of policies for the management of prohibited and restricted groundwater areas is also an important influencing factor.

4. Conclusions

In this paper, the functional relationship between groundwater availability and water use efficiency was used to study the maximum support capacity of groundwater resources for regional economic development. In addition, the ratio of the contribution of groundwater exploitation to economic development was used to judge the bearing capacity of groundwater resources, that is, to determine the classification standard of groundwater exploitation overload. The main conclusions are: (1) the comprehensive water efficiency of the study area increased from 6591 CNY/mm in 2010 to 16,060 CNY/mm in 2020. (2) The total GDP of the actual carrying capacity of groundwater in Beijing rapidly increased from CNY 637 billion in 2010 to CNY 1713.6 billion in 2020, an increase of 1.69 times in the past 10 years. The annual proportion of over-exploitation areas from 2010 to 2020 was 81.8%. (3) From the spatial perspective, the evaluation indices of Xicheng District and Dongcheng District were 69.82% and 58.48%, respectively. The proportion of over-exploitation areas in administrative distribution was 12.5%. (4) Increasing the availability of groundwater resources through the task of increasing and decreasing overexploitation control measures, optimizing and promoting industrial structure and water-saving technologies to further improve water use efficiency are all key factors to improve the carrying capacity of groundwater resources.
The exploitation of groundwater resources in some regions of the study area has reached a certain scale and the carrying capacity of groundwater resources is close to saturation value, but it still has a certain exploitation potential. With the continuous advancement of groundwater over-exploitation control measures, the rate of decline of groundwater level has been eased. However, groundwater resources in some areas can no longer meet the needs of local economic and social development and ecological environmental protection, and the amount of groundwater resources is gradually decreasing. Therefore, it is necessary to formulate relevant policies. In particular, relevant policies include reducing groundwater pollution, reducing sewage discharge, adjusting the economic industrialization structure in order to rationally allocate water resources, carrying out water saving education to improve people’s awareness of water saving and water resource utilization and using surface water instead of groundwater when necessary. These policies are of great significance for improving the carrying capacity of groundwater resources.

Author Contributions

Conceptualization and software, Y.G.; methodology, J.W. (Jin Wu); supervision and project administration, B.L.; writing—original draft preparation, X.C.; Writing—Review and Editing, J.W. (Jiangyue Wu). All authors have read and agreed to the published version of the manuscript.

Funding

This study was funded by Beijing Normal University Young Teachers Fund Project (Grant No: 2020NTST01).

Institutional Review Board Statement

Not applicable.

Informed Consent Statement

Not applicable.

Data Availability Statement

Not applicable.

Acknowledgments

The authors would like to thank the experts for their opinions and comments.

Conflicts of Interest

The authors declare no conflict of interest.

References

  1. OECD. Water and Cities Ensuring Sustainable Futures; OECD Publishing: Washington, DC, USA, 2015. [Google Scholar]
  2. Foster, S.; Garduno, H.; Evans, R.; Olson, D.; Tian, Y.; Zhang, W.; Han, Z. Quaternary Aquifer of the North China Plain—assessing and achieving groundwater resource sustainability. Hydrogeol. J. 2004, 12, 81–93. [Google Scholar] [CrossRef]
  3. Rosenzweig, C.; Solecki, W.D.; Romero-Lankao, P.; Mehrotra, S.; Dhakal, S.; Ibrahim, S.A. Summary for City Leaders. In Climate Change and Cities: Second Assessment Report of the Urban Climate Change Research Network; Cambridge University Press: Cambridge, UK, 2018. [Google Scholar]
  4. Chand, R.; Chandra, S.; Rao, V.A.; Singh, V.S.; Jain, S.C. Estimation of natural recharge and its dependency on sub-surface geoelectric parameters. J. Hydrol. 2004, 299, 67–83. [Google Scholar] [CrossRef]
  5. Zhou, D.; Zhang, Z.; Shi, M. Where is the future for a growing metropolis in North China under water resource constraints? Sustain. Sci. 2015, 10, 113–122. [Google Scholar] [CrossRef]
  6. Atoui, M.; Agoubi, B. Assessment of groundwater vulnerability and pollution risk using AVI, SPI, and RGPI indexes: Applied to southern Gabes aquifer system, Tunisia. Environ. Sci. Pollut. Res. 2022, 29, 50881–50894. [Google Scholar] [CrossRef]
  7. He, C.; Liu, Z.; Wu, J.; Pan, X.; Fang, Z.; Li, J.; Bryan, B.A. Future global urban water scarcity and potential solutions. Nat. Commun. 2021, 12, 4667. [Google Scholar] [CrossRef]
  8. Greve, P.; Kahil, T.; Mochizuki, J.; Schinko, T.; Satoh, Y.; Burek, P.; Fischer, G.; Tramberend, S.; Burtscher, R.; Langan, S.; et al. Global assessment of water challenges under uncertainty in water scarcity projections. Nat. Sustain. 2018, 1, 486–494. [Google Scholar] [CrossRef]
  9. McDonald, R.I.; Weber, K.; Padowski, J.; Flörke, M.; Schneider, C.; Green, P.A.; Gleeson, T.; Eckman, S.; Lehner, B.; Balk, D.; et al. Water on an urban planet: Urbanization and the reach of urban water infrastructure. Glob. Environ. Chang. 2014, 27, 96–105. [Google Scholar] [CrossRef] [Green Version]
  10. Kammen, D.M.; Sunter, D.A. City-integrated renewable energy for urban sustainability. Science 2016, 352, 922–928. [Google Scholar] [CrossRef] [Green Version]
  11. Barthel, R.; Sonneveld, B.G.J.S.; Götzinger, J.; Keyzer, M.A.; Pande, S.; Printz, A.; Gaiser, T. Integrated assessment of groundwater resources in the Ouémé basin, Benin, West Africa. Phys. Chem. Earth Parts A/B/C 2009, 34, 236–250. [Google Scholar] [CrossRef]
  12. Howard, J.; Merrifield, M. Mapping groundwater dependent ecosystems in California. PLoS ONE 2010, 5, e11249. [Google Scholar] [CrossRef] [Green Version]
  13. Harris, J.M.; Kennedy, S. Carrying capacity in agriculture: Global and regional issues. Ecol. Econ. 1999, 29, 443–461. [Google Scholar] [CrossRef]
  14. Khorsandi, M.; Homayouni, S.; van Oel, P. The edge of the petri dish for a nation: Water resources carrying capacity assessment for Iran. Sci. Total Environ. 2022, 817, 153038. [Google Scholar] [CrossRef]
  15. Mullakkezhil Reghunathan, V.; Joseph, S.; Warrier, C.U.; Hameed, A.S.; Albert Moses, S. Factors affecting the environmental carrying capacity of a freshwater tropical lake system. Environ. Monit. Assess. 2016, 188, 615. [Google Scholar] [CrossRef]
  16. Dalin, C.; Wada, Y.; Kastner, T.; Puma, M.J. Groundwater depletion embedded in international food trade. Nature 2017, 543, 700–704. [Google Scholar] [CrossRef] [Green Version]
  17. Ge, Y.; Wu, J.; Zhang, D.; Jia, R.; Yang, H. Uncertain Analysis of Fuzzy Evaluation Model for Water Resources Carrying Capacity: A Case Study in Zanhuang County, North China Plain. Water 2021, 13, 2804. [Google Scholar] [CrossRef]
  18. Gao, F.; Sun, S.; Yao, N.; Yang, H.; Cheng, B.; Luan, X.; Wang, K. Identifying the impact of crop distribution on groundwater resources carrying capacity in groundwater-depended agricultural regions. Agric. Water Manag. 2022, 264, 107504. [Google Scholar] [CrossRef]
  19. Xue, D.; Gui, D.; Dai, H.; Liu, Y.; Liu, Y.; Zhang, L.; Ahmed, Z. Oasis sustainability assessment in arid areas using GRACE satellite data. Environ. Monit. Assess. 2022, 194, 1–14. [Google Scholar] [CrossRef]
  20. Ferozur, R.M.; Jahan, C.S.; Arefin, R.; Mazumder, Q.H. Groundwater potentiality study in drought prone barind tract, NW Bangladesh using remote sensing and GIS. Groundw. Sustain. Dev. 2019, 8, 205–215. [Google Scholar] [CrossRef]
  21. Dai, D.; Sun, M.; Lv, X.; Lei, K. Evaluating water resource sustainability from the perspective of water resource carrying capacity, a case study of the Yongding River watershed in Beijing-Tianjin-Hebei region, China. Environ. Sci. Pollut. R 2020, 27, 21590–21603. [Google Scholar] [CrossRef]
  22. Li, R.; Yin, Z.; Wang, Y.; Li, X.; Liu, Q.; Gao, M. Geological resources and environmental carrying capacity evaluation review, theory, and practice in China. China Geol. 2018, 1, 556–565. [Google Scholar] [CrossRef]
  23. Keita, S.; Zhonghua, T. The assessment of processes controlling the spatial distribution of hydrogeochemical groundwater types in Mali using multivariate statistics. J. Afr. Earth Sci. 2017, 134, 573–589. [Google Scholar] [CrossRef]
  24. Kumar, S.V.; Zaitchik, B.F.; Peters-Lidard, C.D.; Rodell, M.; Reichle, R.; Li, B.; Jasinski, M.; Mocko, D.; Getirana, A.; De Lannoy, G.; et al. Assimilation of Gridded GRACE Terrestrial Water Storage Estimates in the North American Land Data Assimilation System. J. Hydrometeorol. 2016, 17, 1951–1972. [Google Scholar] [CrossRef]
  25. Santoso, E.B.; Erli, H.K.D.M.; Aulia, B.U.; Ghozali, A. Concept of Carrying Capacity: Challenges in Spatial Planning (Case Study of East Java Province, Indonesia). Procedia-Soc. Behav. Sci. 2014, 135, 130–135. [Google Scholar] [CrossRef] [Green Version]
  26. Naimi Ait-Aoudia, M.; Berezowska-Azzag, E. Water resources carrying capacity assessment: The case of Algeria’s capital city. Habitat Int. 2016, 58, 51–58. [Google Scholar] [CrossRef]
  27. Aldous, A.R.; Bach, L.B. Hydro-ecology of groundwater-dependent ecosystems: Applying basic science to groundwater management. Hydrol. Sci. J. 2014, 59, 530–544. [Google Scholar] [CrossRef]
  28. Zhang, Y.; Li, F.; Li, J.; Liu, Q.; Tu, C.; Suzuki, Y.; Huang, C. Spatial Distribution, Potential Sources, and Risk Assessment of Trace Metals of Groundwater in the North China Plain. Hum. Ecol. Risk Assess. Int. J. 2015, 21, 726–743. [Google Scholar] [CrossRef] [Green Version]
  29. Zheng, P.; Cui, J.; Hu, L.; Chen, P.; Huang, J.; Cheng, S.; Mu, K. Effect of long-term operation of a subsurface wastewater infiltration system (SWIS) based on the limiting value of environmental carrying capacity. Ecol. Eng. 2016, 92, 190–198. [Google Scholar] [CrossRef]
  30. Kang, J.; Zi, X.; Wang, S.; He, L. Evaluation and Optimization of Agricultural Water Resources Carrying Capacity in Haihe River Basin, China. Water 2019, 11, 999. [Google Scholar] [CrossRef] [Green Version]
  31. Zhao, Y.; Wang, Y.; Wang, Y. Comprehensive evaluation and influencing factors of urban agglomeration water resources carrying capacity. J. Clean. Prod. 2021, 288, 125097. [Google Scholar] [CrossRef]
  32. Chen, Y.; Lu, H.; Li, J.; Yang, Y.; Xia, J. Multi-criteria decision making and fairness evaluation of water ecological carrying capacity for inter-regional green development. Environ. Sci. Pollut. Res. 2021, 28, 6470–6490. [Google Scholar] [CrossRef]
  33. Ober, J.; Karwot, J.; Rusakov, S. Tap Water Quality and Habits of Its Use: A Comparative Analysis in Poland and Ukraine. Energies 2022, 15, 981. [Google Scholar] [CrossRef]
  34. Han, Z.; An, W.; Yang, M.; Zhang, Y. Assessing the impact of source water on tap water bacterial communities in 46 drinking water supply systems in China. Water Res. 2020, 172, 115469. [Google Scholar] [CrossRef]
  35. Ji, Y.; Wu, J.; Wang, Y.; Elumalai, V.; Subramani, T. Seasonal Variation of Drinking Water Quality and Human Health Risk Assessment in Hancheng City of Guanzhong Plain, China. Expo. Health 2020, 12, 469–485. [Google Scholar] [CrossRef]
  36. Zhang, H.; Xu, L.; Huang, T.; Yan, M.; Liu, K.; Miao, Y.; He, H.; Li, S.; Sekar, R. Combined effects of seasonality and stagnation on tap water quality: Changes in chemical parameters, metabolic activity and co-existence in bacterial community. J. Hazard. Mater. 2021, 403, 124018. [Google Scholar] [CrossRef]
  37. Statistics Bureau of Beijing. Statistical Yearbook of Beijing; Statistics Bureau of Beijing: Beijing, China, 2020. [Google Scholar]
  38. Beijing Water Bureau. The Beijing Water Resources Bulletin; Beijing Water Bureau: Beijing, China, 2020. [Google Scholar]
  39. Cao, F.; Lu, Y.; Dong, S.; Li, X. Evaluation of natural support capacity of water resources using principal component analysis method: A case study of Fuyang district, China. Appl. Water Sci. 2020, 10, 1–8. [Google Scholar] [CrossRef]
  40. Xu, Y.; Ma, L.; Khan, N.M. Prediction and Maintenance of Water Resources Carrying Capacity in Mining Area—A Case Study in the Yu-Shen Mining Area. Sustainability 2020, 12, 7782. [Google Scholar] [CrossRef]
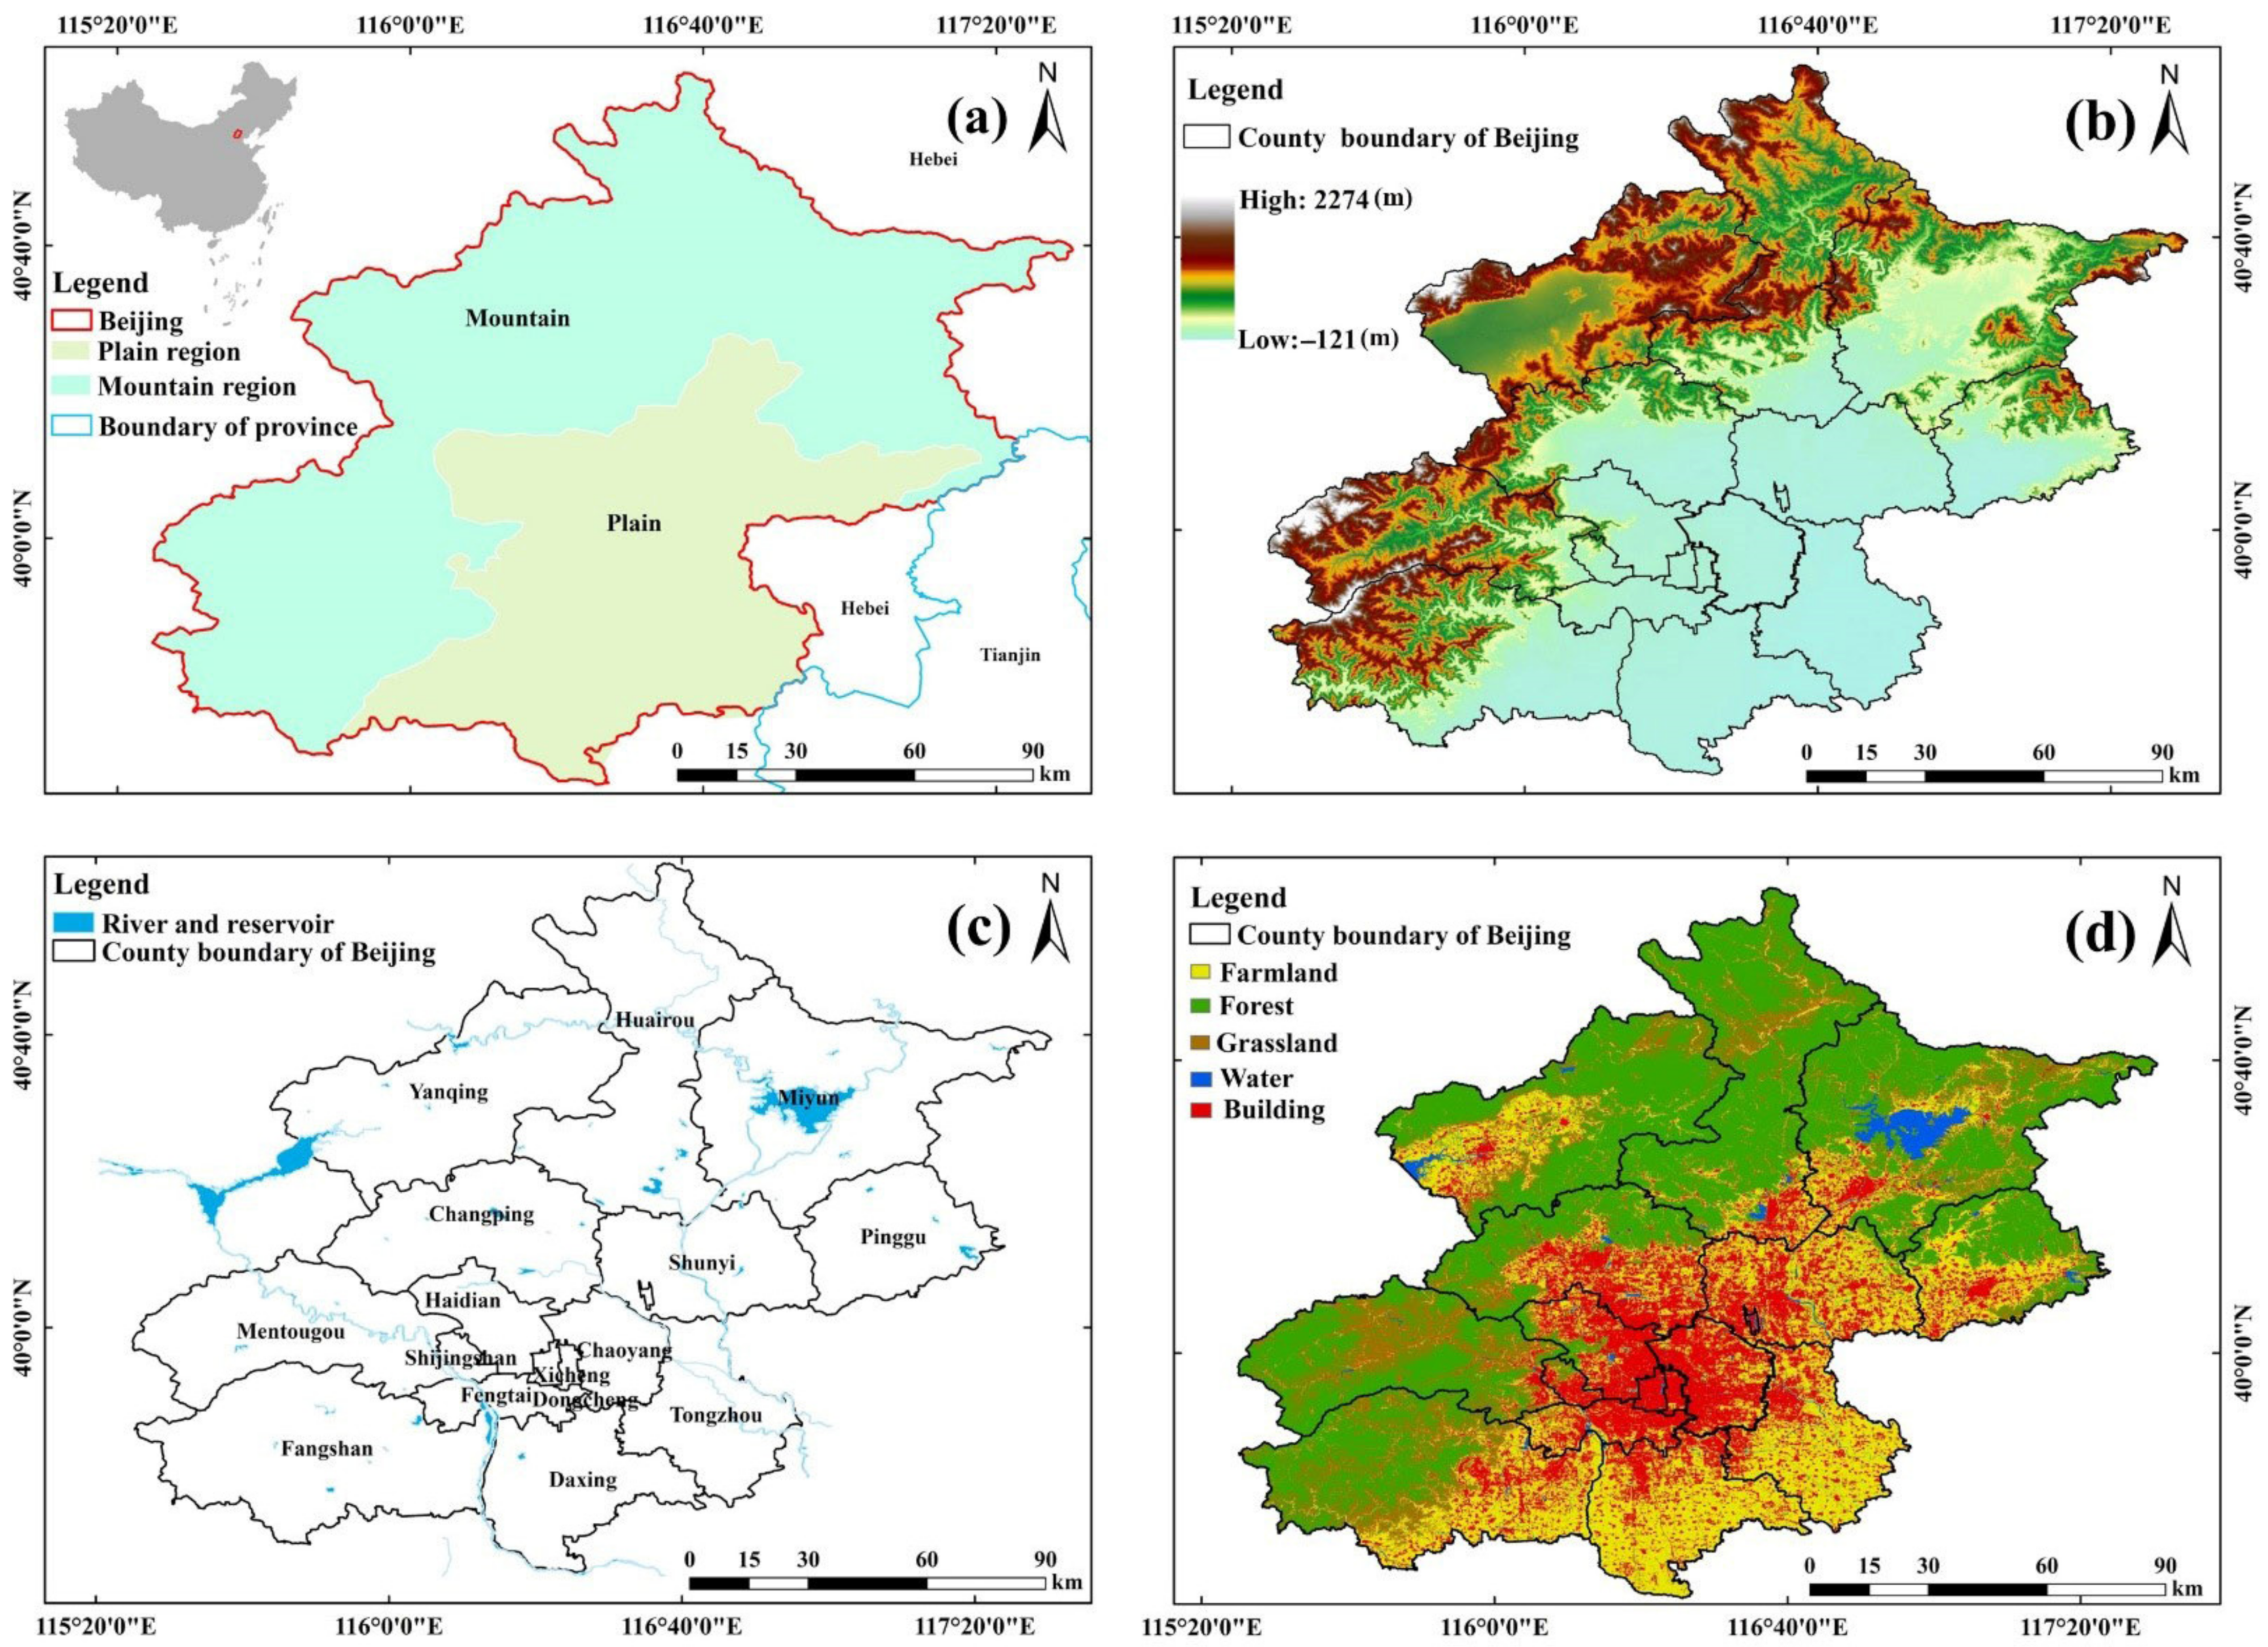
Figure 1. The map showing the location of study area (a), the elevation of Beijing (b), the administrative region and water of Beijing (c), and land use types of Beijing (d).
Sustainability 14 09200 g001
Figure 2. Flow chart of the groundwater resources carrying capacity assessment.
Sustainability 14 09200 g002
Figure 3. Proportion of the water use (a) and water supply (b) in all departments in the study area in 2010–2020.
Sustainability 14 09200 g003
Figure 4. Temporal variation of GDP for agriculture, industry, construction, service, ecology and other industries in Beijing from 2010 to 2020.
Sustainability 14 09200 g004
Figure 5. Spatial variation characteristics of GDP for agriculture (a), industry (b), construction (c), service (d), ecology (e) and other industries (f) during 2010~2020 in Beijing.
Sustainability 14 09200 g005
Figure 6. Temporal variation of water efficiency for all industries in Beijing from 2010 to 2020.
Sustainability 14 09200 g006
Figure 7. Spatial variation characteristics of water efficiency for agriculture (a), industry (b), construction (c), service (d), ecology (e) and other industries (f) during 2010~2020 in Beijing.
Sustainability 14 09200 g007
Figure 8. Relationship between groundwater exploitation and economic development supported by the groundwater resources in Beijing from 2010 to 2020.
Sustainability 14 09200 g008
Figure 9. Spatial variation characteristics of the groundwater carrying capacity assessment coefficient in Beijing from 2010 to 2020.
Sustainability 14 09200 g009
Publisher’s Note: MDPI stays neutral with regard to jurisdictional claims in published maps and institutional affiliations.