
The Application of In Situ Methods to Monitor VOC Concentrations in Urban Areas—A Bibliometric Analysis and Measuring Solution Review


Abstract
:1. Introduction
1.1. The Main Contents in This Review
1.2. VOCs in Urban Areas
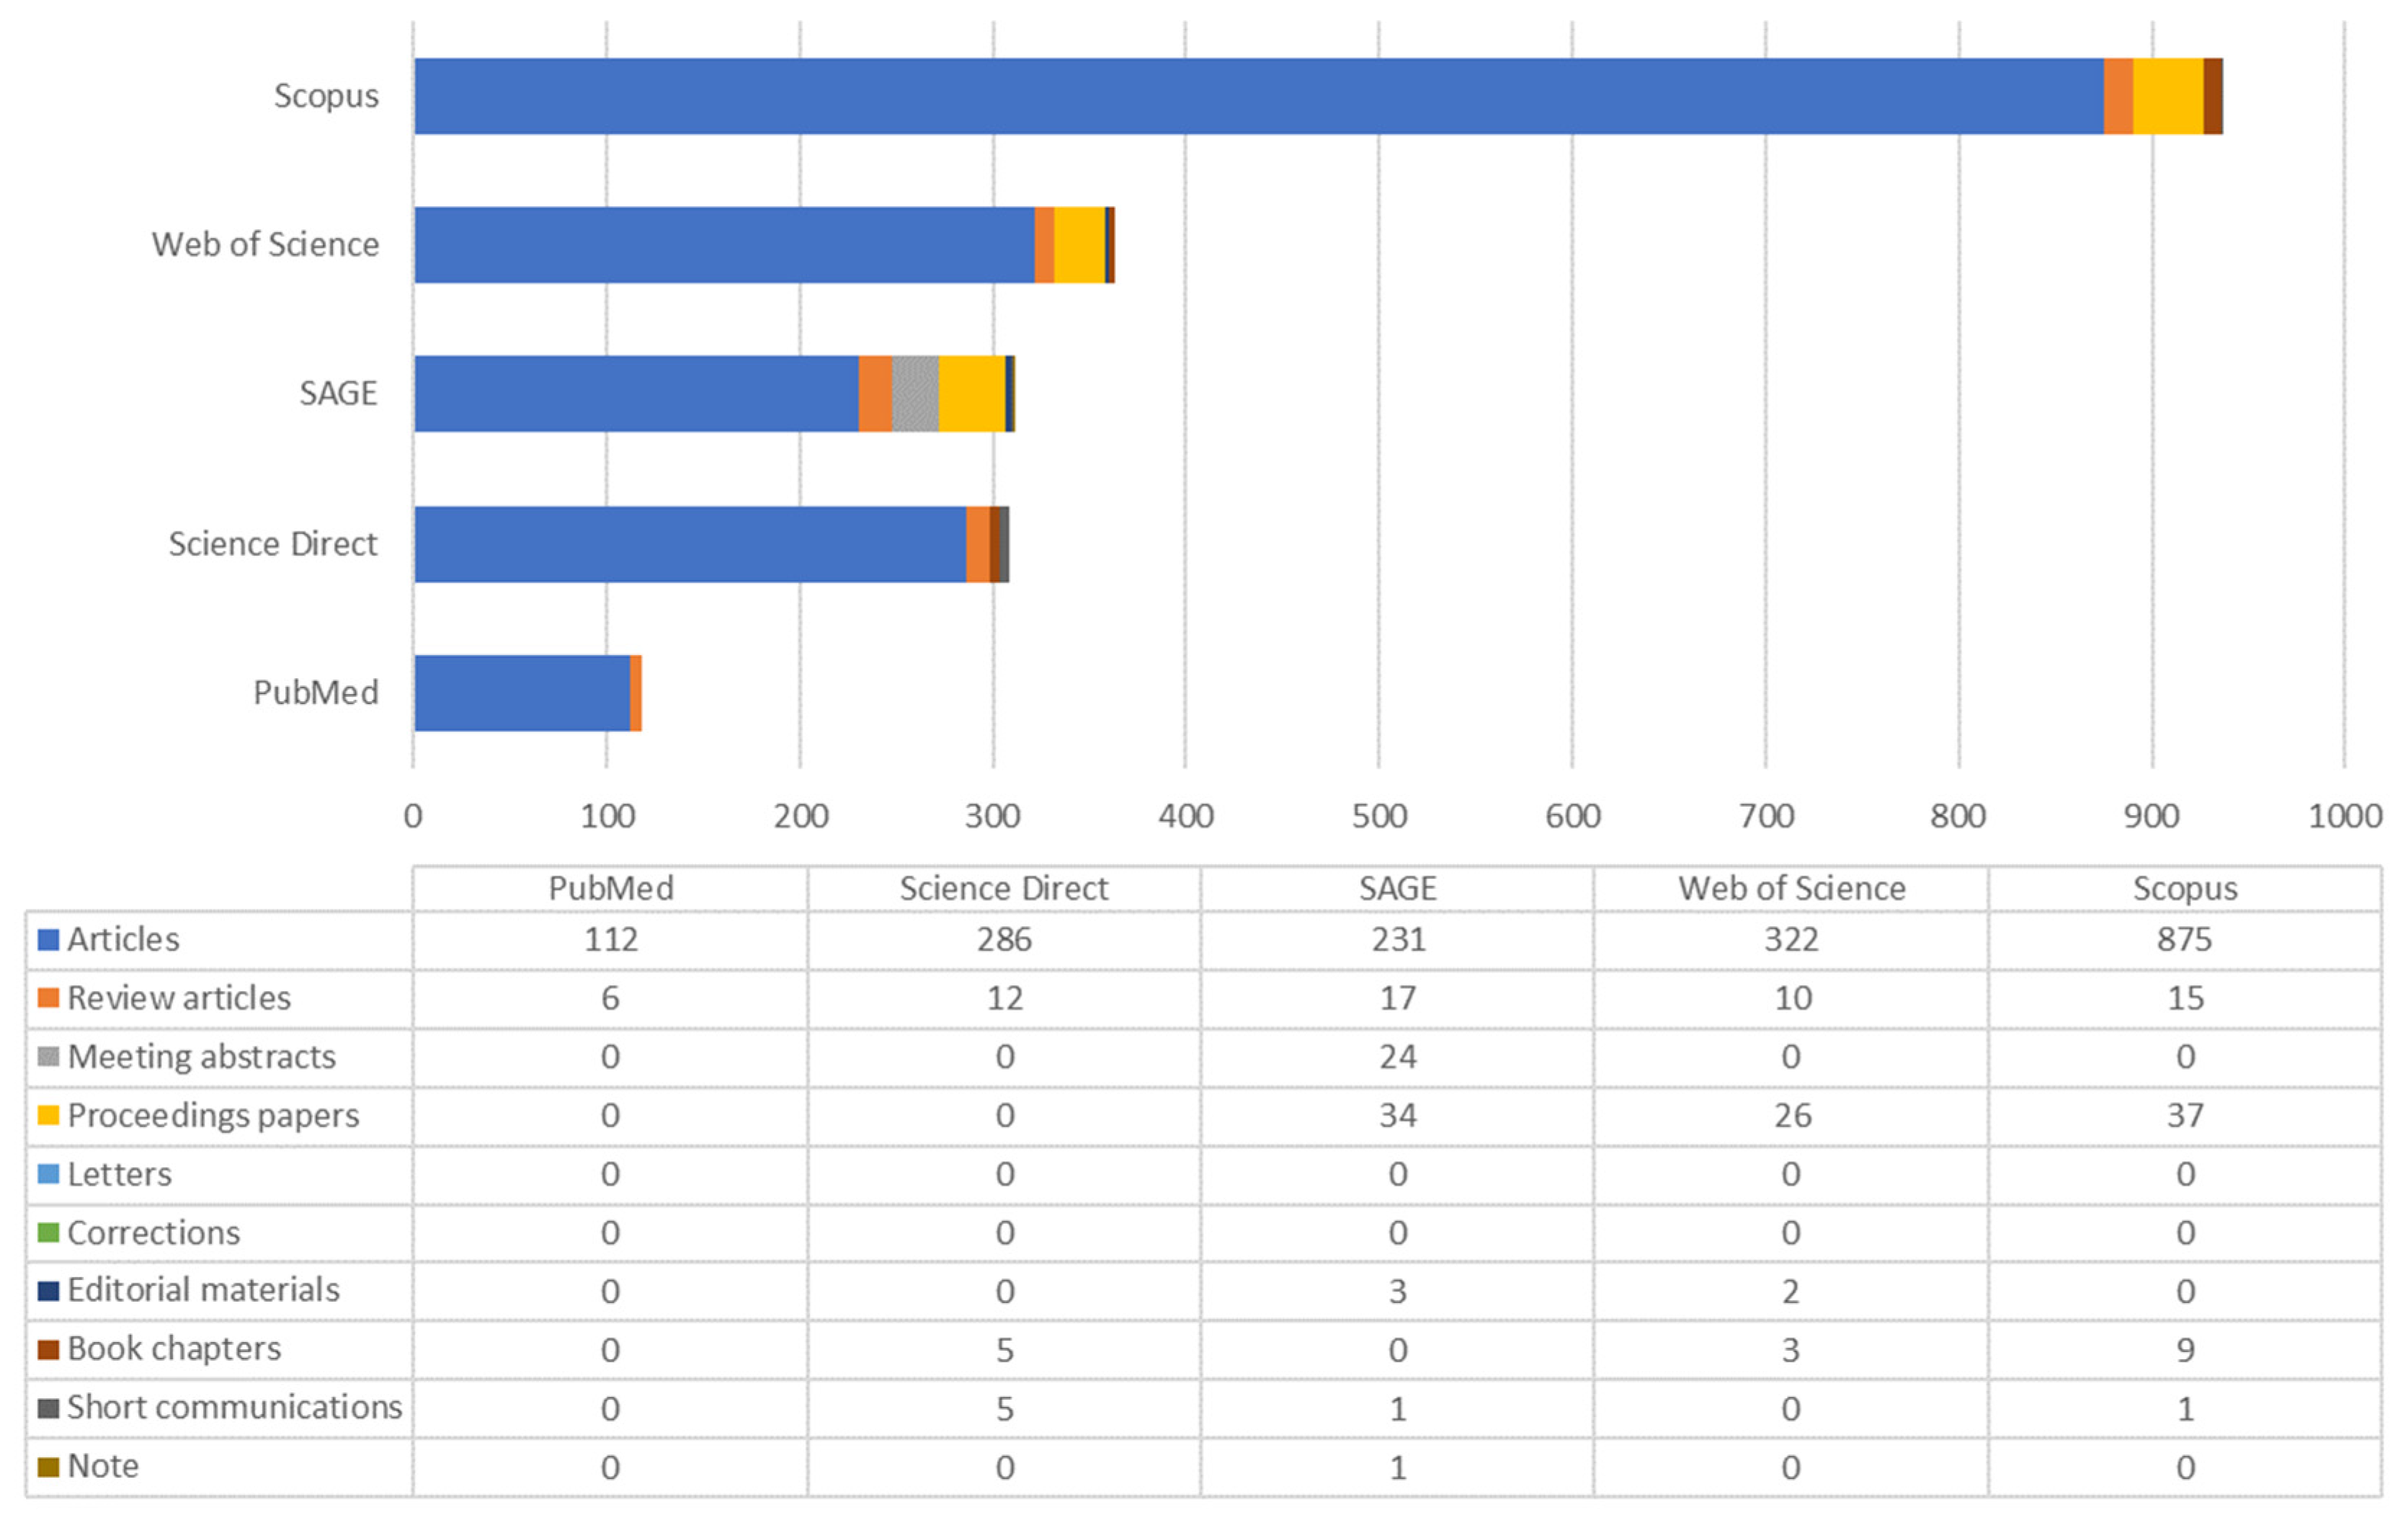
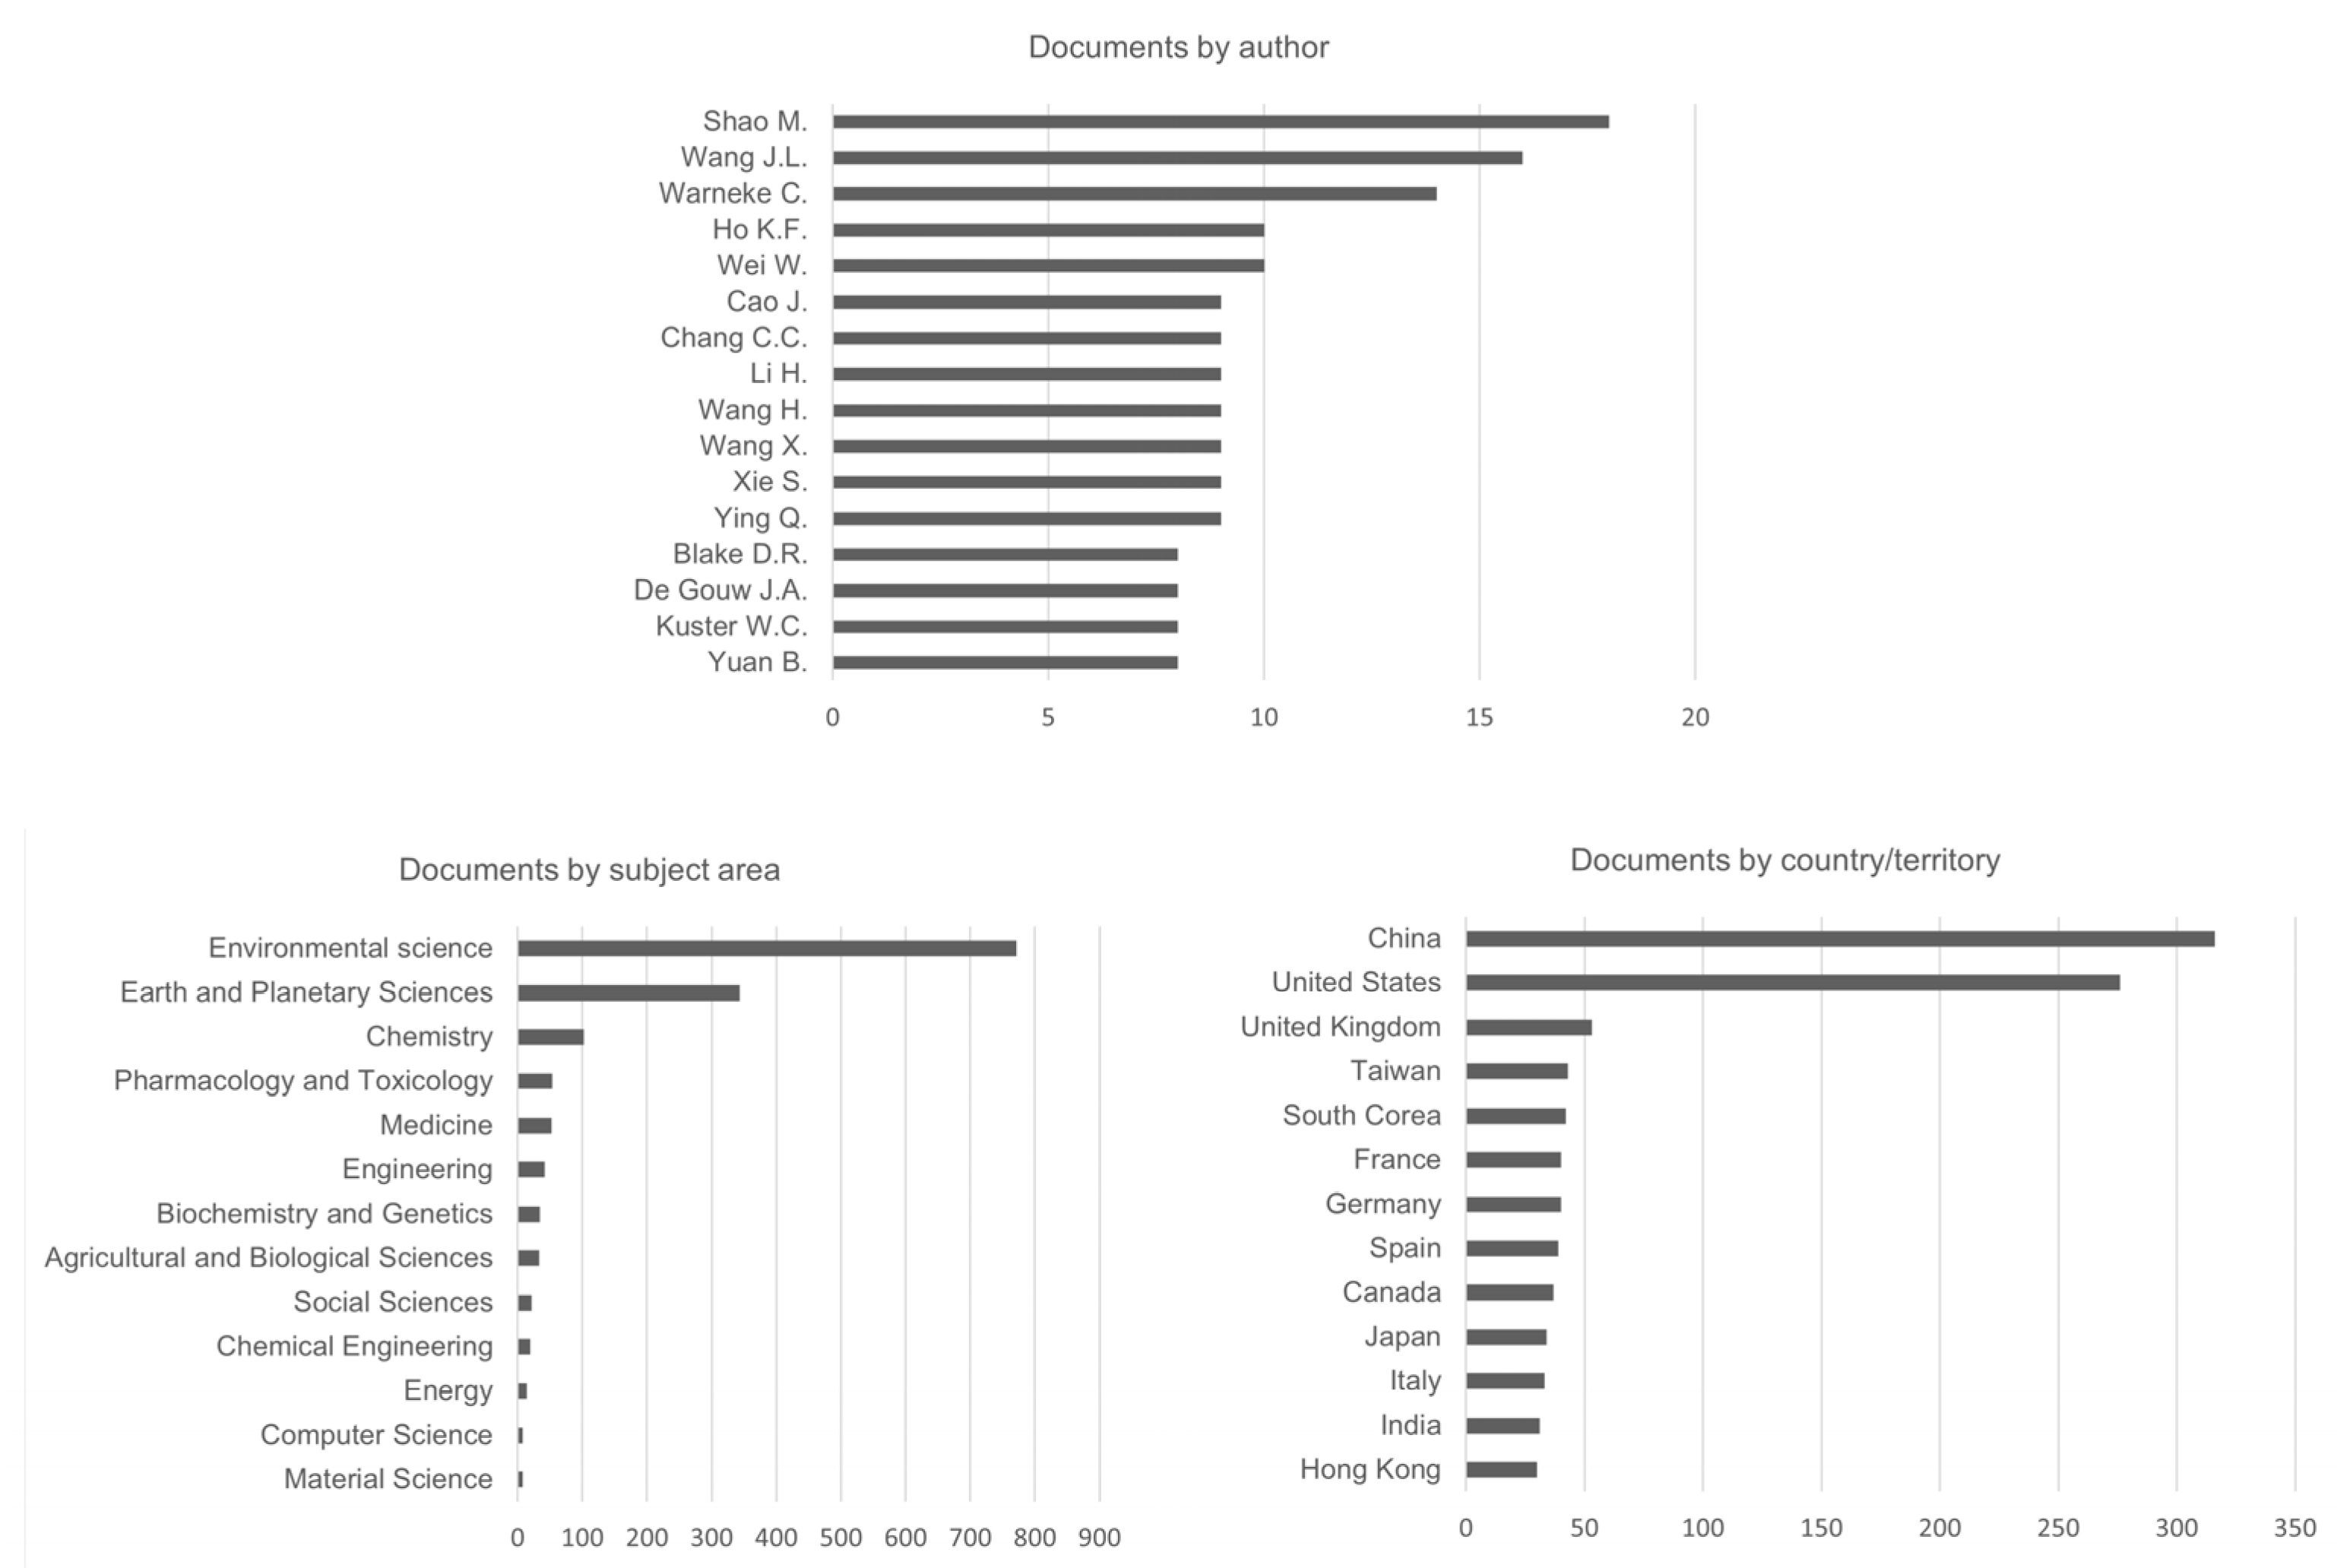
2. Bibliometric Analysis
- Atkinson R. (2000) [44]—cited by 2182 authors.
- Carter W.P.L. (1994) [48]—cited by 1101 authors.
- Khalili N.R., Scheff P.A., Holsen T.M. (1995) [49]—cited by 1093 authors.
- Hoek G et al. (2008) [50]—cited by 920 authors.
- Volkamer R. et al. (2006) [51]—cited by 766 authors.
- Li K. et al. (2019) [52]—cited by 613 authors.
- Watson J.G. et al. (2001) [53]—cited by 442 authors.
3. Characteristics of Various Methods for VOC Determination
3.1. Portable Gas Detectors
3.2. Portable Gas Chromatographs
3.3. Electronic Noses (E-Noses)
3.4. Gas Detectors with GC Function
4. Summary and Future Research Work
5. Conclusions
Author Contributions
Funding
Institutional Review Board Statement
Informed Consent Statement
Data Availability Statement
Conflicts of Interest
References
- Wiśniewska, M.; Kulig, A.; Lelicińska-Serafin, K. The use of chemical sensors to monitor odour emissions at municipal waste biogas plants. Appl. Sci. 2021, 11, 3916. [Google Scholar] [CrossRef]
- Brown, D.L.; Cromartie, J.B.; Kulcsar, L.J. Metropolitan areas and the measurement of American urbanisation. Popul. Res. Policy Rev. 2004, 23, 399–418. [Google Scholar] [CrossRef]
- Karimov, R. Demographic and economic development of large cities in Azerbaijan. Int. J. Res. Bus. Soc. Sci. 2011, 2, 268–274. [Google Scholar]
- Vias, A.C. Micropolitan areas and urbanisation processes in the US. Cities 2012, 9, S24–S28. [Google Scholar] [CrossRef]
- Wei, C.; Taubenböck, H.; Blaschke, T. Measuring urban agglomeration using a city scaled asymmetric population map: A study in the Pearl River Delta China. Habitat Int. 2017, 59, 32–43. [Google Scholar] [CrossRef] [Green Version]
- Wu, S.; Ze, L.; Li, S. Relationships between urban development level and urban vegetation states: A global perspective. Urban For. Urban Green. 2019, 38, 215–222. [Google Scholar] [CrossRef]
- Quigley, M.F. Franklin Park: 150 years of changing design, disturbances, and impact on tree growth. Urban Ecosyst. 2002, 6, 223–235. [Google Scholar] [CrossRef]
- Syphard, A.D.; Clarke, K.C.; Franklin, J.; Regan, H.M.; Mcginnis, M. Forest of habitat loss and fragmentation due to urban growth are sensitive to source of input data. J. Environ. Manag. 2011, 92, 1882–1893. [Google Scholar] [CrossRef]
- Savé, R.; De Herralde, F.; Aranda, X.; Biel, C. Potential effects of global change to urban vegetation: Vulnerability and adaptations. J. Life Sci. 2012, 6, 194–200. [Google Scholar] [CrossRef]
- Capelli, L.; Sironi, S.; Del Rosso, R.; Guillot, J.M. Measuring odours in the environment vs. dispersion modelling: A review. Atmos. Environ. 2013, 79, 731. [Google Scholar] [CrossRef]
- Davoli, E.; Gangai, M.L.; Morselli, L.; Tonelli, D. Characterisation of odorants emissions from landfills by SPME and GC/MS. Chemosphere 2003, 51, 357. [Google Scholar] [CrossRef]
- De Santis, F.; Fino, A.; Menichelli, S.; Vazzana, C.; Allegrini, I. Monitoring the air quality around an oil refinery through the use of diffusive sampling. Anal. Bioanal. Chem. 2004, 378, 782. [Google Scholar] [CrossRef] [PubMed]
- Chen, C.L.; Shu, C.M.; Fang, H.Y. Location and characterization of emission sources for airborne volatile organic compounds inside a refinery in Taiwan. Environ. Monit. Assess. 2006, 120, 487. [Google Scholar] [CrossRef] [PubMed]
- Guenther, A.; Hewitt, C.N.; Erickson, D.; Fall, R.; Geron, C. A global model of natural volatile organic compound emissions. J. Geophys. Res. 1995, 100, 8873–8892. [Google Scholar] [CrossRef]
- Li, G.H.; Wei, W.; Shao, X.; Nie, L.; Wang, H.L. A comprehensive classification method for VOCs emission sources to tackle air pollution based on VOCs species reactivity and emission amounts. J. Environ. Sci. 2018, 67, 78–88. [Google Scholar] [CrossRef]
- Maroni, M.; Seifert, B.; Lindvall, T. Indoor Air Quality: A Comprehensive Reference Book; Elsevier Science: Amsterdam, The Netherlands, 1995. [Google Scholar]
- European Commission. Council directive 1999/13/EC of 11 March 1999 on the limitation of emissions of volatile organic compounds due to the use of organic solvents in certain activities and installations. Off. J. Eur. Commun. 1999, L085, 1–24. [Google Scholar]
- ISO/TC 146; AN ISO 16000-5; Indoor Air—Part 5: Sampling Strategy for Volatile Organic Compounds (VOCs). Technical Committee: Geneva, Switzerland, 2007.
- Thurston, G.D. Outdoor air pollution: Sources, atmospheric transport, and human health effects. In International Encyclopedia of Public Health, 2nd ed.; Quah, S.R., Ed.; Elsevier: Cambridge, MA, USA, 2017; Volume 5, pp. 367–377. [Google Scholar]
- Demirel, G.; Özden, Ö.; Dögerogly, T.; Gaga, E.O. Personal exposure of primary school children to BTEX, NO2 and ozone in Eskisehir, Turkey: Relationship with indoor/outdoor concentrations and risk assessment. Sci. Total Environ. 2014, 473–474, 537–548. [Google Scholar] [CrossRef]
- World Health Organization. Indoor Air Quality: Organic Pollutants. Report on a WHO Meeting, Berlin, 23–27 August 1987; EURO Reports and Studies 111 Series; World Health Organization Regional Office for Europe: Copenhagen, Denmark, 1989. [Google Scholar]
- Font, X.; Artola, A.; Sánchez, A. Detection, composition and treatment of volatile organic compounds from waste treatment plants. Sensors 2011, 11, 4043–4059. [Google Scholar] [CrossRef] [PubMed] [Green Version]
- Mohave, L.; Clausen, G.; Berglund, B.; Deaurriz, J.; Kettrup, A.; Lindvall, T.; Maroni, M.; Pickering, A.C.; Risse, U.; Rothweiler, H.; et al. Total volatile organic compounds (TVOC) in indoors air quality investigations. Indoor Air J. 2004, 7, 225–240. [Google Scholar] [CrossRef]
- Zhang, H.; Li, H.; Zhang, Q.; Zhang, Y.; Zhang, W.; Wang, X.; Bi, F.; Chai, F.; Gao, J.; Meng, L.; et al. Atmospheric volatile organic compounds in a typical urban area of beijing: Pollution characterisation, health risk assessment and source apportionment. Atmosphere 2017, 8, 61. [Google Scholar] [CrossRef] [Green Version]
- World Health Organization. Air Quality Guidelines for Europe, 2nd ed.; WHO Regional Publications; World Health Organization: Geneva, Switzerland; Regional Office for Europe: Copenhagen, Denmark, 2000. [Google Scholar]
- Laothawornkitkul, J.; Taylor, J.E.; Paul, N.D.; Hewitt, C.N. Biogenic volatile organic compounds in the Earth system. New Phytol. 2009, 183, 27. [Google Scholar] [CrossRef] [PubMed]
- Hewitt, C.N.; Karl, T.; Langford, B.; Owen, S.M.; Possell, M. Quantification of VOC emission rates from the biosphere. Trends Anal. Chem. 2011, 30, 7. [Google Scholar] [CrossRef]
- Feussner, I.; Wasternack, C. The lipoxygenase pathway. Annu. Rev. Plant Biol. 2002, 53, 275–297. [Google Scholar] [CrossRef] [PubMed]
- Dudareva, N.; Negre, F.; Nagegowda, D.A.; Orlova, I. Plant volatiles: Recent advances and future perspectives. Crit. Rev. Plant Sci. 2006, 25, 417–440. [Google Scholar] [CrossRef]
- Matsui, K. Green leaf volatiles: Hydroperoxide lyase pathway of oxylipin metabolism. Curr. Opin. Plant Biol. 2006, 9, 274–280. [Google Scholar] [CrossRef]
- Xiang, L.; Milc, J.; Pecchioni, N.; Chen, L. Genetic aspects of floral fragrance in plants. Biochemistry 2007, 72, 351–358. [Google Scholar] [CrossRef]
- Qualley, A.V.; Dudareva, N. Aromatic volatiles and their involvement in plant defense. In Induced Plant Resistance to Herbivory; Schaller, A., Ed.; Springer: Amsterdam, The Netherlands, 2008; pp. 409–432. [Google Scholar] [CrossRef]
- Owen, S.M.; Boissard, C.; Hewitt, C.N. Volatile organic compounds (VOCs) emitted from 40 Mediterranean plant species: VOC speciation and extrapolation to habitat scale. Atmos. Environ. 2001, 35, 5393–5409. [Google Scholar] [CrossRef]
- Keeling, C.I.; Bohlmann, J. Genes, enzymes and chemicals of terpenoid diversity in the constitutive and induced defence of conifers against insects and pathogens. New Phytol. 2006, 170, 657–675. [Google Scholar] [CrossRef]
- Shi, T.; Yue, Y.; Shi, M.; Chen, M.; Yang, X.; Wang, L. Exploration of floral volatile organic compounds in six typical lycoris taxa by GC-MS. Plants 2019, 8, 422. [Google Scholar] [CrossRef] [Green Version]
- Robustelli della Cuna, F.S.; Calevo, J.; Bazzicalupo, M.; Sottani, C.; Grignani, E.; Preda, S. Chemical composition of essential oil from flowers of five fragrant Dendrobium (Orchidaceae). Plants 2021, 10, 1718. [Google Scholar] [CrossRef]
- Bueyueksoenmez, F.; Evans, J. Biogenic emissions from green waste and comparison to the emissions resulting from composting-Part II: Volatile organic compounds (VOCs). Compost. Sci. Util. 2013, 15, 191–199. [Google Scholar] [CrossRef]
- Kumar, A.; Alaimo, C.P.; Horowitz, R.; Mitloehner, F.M.; Kleeman, M.J.; Green, P.G. Volatile organic compound emissions from green waste composting: Characterisation and ozone formation. Atmos. Environ. 2011, 45, 1841–1848. [Google Scholar] [CrossRef]
- Wiśniewska, M.; Lelicińska-Serafin, K. The effectiveness of the mechanical treatment of municipal waste using the example of a selected installation. E3S Web Conf. 2018, 45, 102. [Google Scholar] [CrossRef] [Green Version]
- Hyodo, T.; Shimizu, Y. adsorption/combustion-type micro gas sensors: Typical VOC-sensing properties and material-design approach for highly sensitive and selective voc detection. Anal. Sci. 2020, 36, 19R011. [Google Scholar] [CrossRef] [Green Version]
- Stetter, J.R.; Li, J. Amperometric gas sensors—A review. Chem. Rev. 2008, 108, 352–366. [Google Scholar] [CrossRef]
- Rock, F.; Barsan, N.; Weimar, U. Electronic nose: Current status and future trends. Chem. Rev. 2008, 108, 705–725. [Google Scholar] [CrossRef]
- Gębicki, J. Application of electrochemical sensors and sensor matrixes for measurement of odorous chemical compounds. Trac Trends Anal. Chem. 2016, 77, 1–13. [Google Scholar] [CrossRef]
- Atkinson, R. Atmospheric chemistry of VOCs and NO(x). Atmos. Environ. 2000, 34, 2063–2101. [Google Scholar] [CrossRef]
- Van Eck, N.J.; Waltman, L. Software survey: Vosviewer, a computer program for bibliometric mapping. Scientometrics 2010, 84, 523–538. [Google Scholar] [CrossRef] [Green Version]
- Guo, Y.-M.; Huang, Z.-L.; Guo, J.; Li, H.; Guo, X.-R.; Nkeli, M.J. Bibliometric analysis on smart cities research. Sustainability 2019, 11, 3606. [Google Scholar] [CrossRef] [Green Version]
- Kermarrec, A.; Moin, A. Energy Models for Drawing Signed Graphs. [Research Report], 2011, p. 29. Available online: https://hal.inria.fr/inria-00605924v3/document (accessed on 13 June 2022).
- Carter, W.P.L. Development of ozone reactivity scales for volatile organic compounds. J. Air Waste Manag. Assoc. 1994, 44, 881–899. [Google Scholar] [CrossRef] [Green Version]
- Khalili, N.R.; Scheff, P.A.; Holsen, T.M. PAH source fingerprints for coke ovens, diesel and gasoline engines, highway tunnels, and wood combustion emissions. Atmos. Environ. 1995, 29, 533–542. [Google Scholar] [CrossRef]
- Hoek, G.; Beelen, R.; De Hoogh, K.; Vienneau, D.; Gulliver, J.; Fischer, P.; Briggs, D. A review of land-use regression models to assess spatial variation of outdoor air pollution. Atmos. Environ. 2008, 42, 7561–7578. [Google Scholar] [CrossRef]
- Volkamer, R.; Jimenez, J.L.; San Martini, F.; Dzepina, K.; Zhang, Q.; Salcedo, D.; Molina, M.J. Secondary organic aerosol formation from anthropogenic air pollution: Rapid and higher than expected. Geophys. Res. Lett. 2006, 33, L17811. [Google Scholar] [CrossRef] [Green Version]
- Li, K.; Jacob, D.J.; Liao, H.; Shen, L.; Zhang, Q.; Bates, K.H. Anthropogenic drivers of 2013–2017 trends in summer surface ozone in China. Proc. Natl. Acad. Sci. USA 2019, 116, 422–427. [Google Scholar] [CrossRef] [Green Version]
- Watson, J.G.; Chow, J.C.; Fujita, E.M. Review of volatile organic compound source apportionment by chemical mass balance. Atmos. Environ. 2001, 35, 1567–1584. [Google Scholar] [CrossRef]
- Cao, Z.; Buttner, W.J.; Stetter, J.R. The properties and applications of amperometric gas sensors. Electroanalysis 1992, 4, 253–266. [Google Scholar] [CrossRef]
- Bontempelli, G.; Comisso, N.; Toniolo, R.; Schiavon, G. Electroanalytical sensors for nonconducting media based on electrodes supported on perfluorinated ion-exchange membranes. Electroanalysis 1997, 9, 433–443. [Google Scholar] [CrossRef]
- Galdikas, A.; Mironas, A.; Setkus, A. Copper-doping level effect on sensitivity and selectivity of tin oxide thin-film gas sensor. Sens. Actuator B Chem. 1995, 26, 29–32. [Google Scholar] [CrossRef]
- Albert, K.J.; Lewis, N.S.; Schauer, C.L.; Sotzing, G.A.; Stitzel, S.E.; Vaid, T.P.; Walt, D.R. Cross-reactive chemical sensor arrays. Chem. Rev. 2000, 100, 2595–2626. [Google Scholar] [CrossRef]
- Nicolas, J.; Romain, A.C. Establishing the limit of detection and the resolution limits of odorous sources in the environment for an array of metal oxide gas sensors. Sens. Actuator B Chem. 2004, 99, 384–392. [Google Scholar] [CrossRef]
- Munoz, R.; Sivret, E.C.; Parcsi, G.; Lebrero, R.; Wang, X.; Suffet, I.H.; Stuetz, R.M. Monitoring techniques for odour abatement assessment. Water Res. 2010, 44, 5129–5149. [Google Scholar] [CrossRef] [PubMed]
- Park, D.-H.; Heo, J.-M.; Jeong, W.; Yoo, Y.H.; Park, B.J.; Kim, J.-M. Smartphone-based voc sensor using colorimetric polydiacetylenes. ACS Appl. Mater. Interfaces 2018, 10, 5014–5021. [Google Scholar] [CrossRef] [PubMed]
- Baron, R.; Saffell, J. Amperometric gas sensors as a low cost emerging technology platform for air quality monitoring applications: A review. ACS Sens. 2017, 2, 1553–1566. [Google Scholar] [CrossRef]
- Borowik, P.; Adamowicz, L.; Tarakowski, R.; Siwek, K.; Grzywacz, T. On data collection time by an electronic nose. Int. J. Electr. Comput. Eng. 2021, 11, 4767–4773. [Google Scholar] [CrossRef]
- Szulczyński, B.; Gębicki, J. Currently commercially available chemical sensors employed for detection of volatile organic compounds in outdoor and indoor air. Environments 2017, 4, 21. [Google Scholar] [CrossRef] [Green Version]
- Szulczyński, B.; Wasilewski, T.; Wojciech, W.W.; Majchrzak, T.; Dymerski, T.; Namieśnik, J.; Gębicki, J. Different ways to apply a measurement instrument of e-nose type to evaluate ambient air quality with respect to odour nuisance in a vicinity of municipal processing plants. Sensors 2017, 17, 2671. [Google Scholar] [CrossRef] [Green Version]
- Sanchez, J.M.; Sacks, R.D. Performance characteristics of a new prototype for a portable GC using ambient air as carrier gas for on-site analysis. J. Sep. Sci. 2007, 30, 1052–1060. [Google Scholar] [CrossRef]
- Wahl, J.H.; Riechers, D.M.; Vucelick, M.E.; Wright, D.W. Evaluation of a Rapid-Scanning Quadrupole Mass Spectrometer in an Apolar x Ionic-Liquid Comprehensive Two-Dimensional Gas Chromatography System. J. Sep. Sci. 2003, 26, 1083–1090. [Google Scholar] [CrossRef]
- Smith, P.A.; Sng, M.T.; Eckenrode, B.A.; Leow, S.Y. Towards Smaller and Faster Gas Chromatography-Mass Spectrometry Systems for Field Chemical Detection. J. Chromatogr. A 2005, 1067, 285–294. [Google Scholar] [CrossRef]
- Agah, M.; Potkay, J.A.; Lambertus, G.; Sacks, R.; Wise, K.D. A High-Performance Temperature-Programmed Gas Chromatography Column. J. Microelectromech. Syst. 2005, 14, 1039–1050. [Google Scholar] [CrossRef]
- Whiting, J.J.; Sacks, R.D. Evaluation of split/splitless operation and rapid heating of a multi-bed sorption trap used for gas chromatography analysis of large-volume air samples. J. Sep. Sci. 2006, 29, 218–227. [Google Scholar] [CrossRef] [PubMed]
- Tian, W.C.; Chan, H.K.L.; Lu, C.J.; Pang, S.W.; Zellers, E.T. Multiple-stage microfabricated preconcentrator-focuser for micro gas chromatography system. J. Microelectromech. Syst. 2005, 14, 498–507. [Google Scholar] [CrossRef]
- Martin, S.J.; Frye, G.C.; Senturia, S.D. Dynamics and response of polymer-coated surface acoustic wave devices: Effect of viscoelastic properties and film resonance. Anal. Chem. 1994, 66, 2201–2219. [Google Scholar] [CrossRef]
- Park, J.; Groves, W.A.; Zellers, E.T. Vapor recognition with small arrays of polymer-coated microsensors. A comprehensive analysis. Anal. Chem. 1999, 71, 3877–3886. [Google Scholar] [CrossRef] [PubMed]
- Hierlemann, A.; Ricco, A.J.; Bodenhfer, K.; Dorninik, A.; Gpel, W. Conferring selectivity to chemical sensors via polymer side-chain selection: Thermodynamics of vapor sorption by a set of polysiloxanes on thickness-shear mode resonators. Anal. Chem. 2000, 72, 3696–3708. [Google Scholar] [CrossRef]
- Cai, Q.Y.; Park, J.; Heldsinger, D.; Hsieh, M.D.; Zellers, E.T. Vapor recognition with an integrated array of polymer-coated flexural plate wave sensors. Sens. Actuators B 2000, 62, 121–130. [Google Scholar] [CrossRef]
- Hierlemann, A.; Zellers, E.T.; Ricco, A.J. Use of Linear Solvation Energy Relationships for Modeling Responses from Polymer-Coated Acoustic-Wave Vapor Sensors. Anal. Chem. 2001, 73, 3458–3466. [Google Scholar] [CrossRef]
- Pasini, P.; Powar, N.; Gutierrez-Osuna, R.; Daurnet, S.; Roda, A. Use of a gas-sensor array for detecting volatile organic compounds (VOC) in chemically induced cells. Anal. Bioanal. Chem. 2004, 378, 76–83. [Google Scholar] [CrossRef]
- Eiceman, G.A.; Gardea-Torresdey, J.; Overton, E.; Carney, K.; Dorman, F. Gas Chromatography. Anal. Chem. 2004, 76, 3387–3394. [Google Scholar] [CrossRef]
- Lambertus, G.; Elstro, A.; Sensening, K.; Potkay, J.; Agah, M.; Scheuering, S.; Wise, K.; Dorman, F.; Sacks, R. Design, fabrication and evaluation of microfabricated columns for gas chromatography. Anal. Chem. 2004, 76, 2629–2637. [Google Scholar] [CrossRef] [PubMed]
- Spinelli, L.; Gerboles, M.; Kok, G.; Persijn, S.; Sauerwald, T. Review of portable and low-cost sensors for the ambient air monitoring of benzene and other volatile organic compounds. Sensors 2017, 17, 1520. [Google Scholar] [CrossRef] [Green Version]
- Werner, A.S.; Tsai, B.P.; Baer, T. Photoionization study of the ionisation potentials and fragmentation paths of the chlorinated methanes and carbon tetrabromide. J. Chem. Phys. 1974, 60, 3650–3657. [Google Scholar] [CrossRef]
- Stetter, J.R.; Penrose, W.R. Understanding chemical sensors and chemical sensor arrays (electronic noses): Past, present, and future. Sens. Update 2002, 10, 189–229. [Google Scholar] [CrossRef]
- Wang, H.; Xie, W.; Chen, M.; Liu, B.; Guo, Y. Determination of hazardous volatile organic compounds in the hoffmann list by ion-molecule reaction mass spectrometry. Rapid Commun. Mass Spectrom. 2012, 26, 1841–1848. [Google Scholar] [CrossRef]
- Wilson, A.D. Review of electronic-nose technologies and algorithms to detect hazardous chemicals in the environment. Procedia Technol. 2012, 1, 453–463. [Google Scholar] [CrossRef] [Green Version]
- RAE Systems by Honeywell Staff. The PID Handbook: Theory and Applications of Direct-Reading Photoionization Detectors; RAE Systems by Honeywell: San Jose, CA, USA, 2014. [Google Scholar]
- Kang, Y.; Pyo, S.; Jeong, H.-I.; Lee, K.; Baek, D.-H.; Kim, J. impact ionization induced by accelerated photoelectrons for wide-range and highly sensitive detection of volatile organic compounds at room temperature. ACS Appl. Mater. Interfaces 2019, 11, 20491–20499. [Google Scholar] [CrossRef]
- Jin, H.; Yang, J.; Farooq, A. Determination of absolute photoionisation cross-sections of some aromatic hydrocarbons. Rapid Commun. Mass Spectrom. 2020, 34, e8899. [Google Scholar] [CrossRef]
- Kumar, R.V.; Iwahara, H. Solid electrolytes. In Handbook on the Physics and Chemistry of Rare Earths; Elsevier: Amsterdam, The Netherlands, 2000; Volume 28, pp. 131–185. ISBN 0168-1273. [Google Scholar]
- Jacquinot, P.; Hodgson, A.W.E.; Hauser, P.C.; Müller, B.; Wehrli, B. Amperometric detection of gaseous ethanol and acetaldehyde at low concentrations on an Au–Nafion electrode. Analyst 1999, 124, 871–876. [Google Scholar] [CrossRef]
- Kumar, R.V.; Fray, D.J. Development of solid-state hydrogen sensors. Sens. Actuators 1988, 15, 185–191. [Google Scholar] [CrossRef]
- Williams, D.E. Semiconducting oxides as gas-sensitive resistors. Sens. Actuators B 1999, 57, 1–16. [Google Scholar] [CrossRef]
- Franke, M.E.; Koplin, T.J.; Simon, U. Metal and metal oxide nanoparticles in chemiresistors: Does the nanoscale matters? Small 2006, 1, 36–50. [Google Scholar] [CrossRef] [PubMed]
- Kanan, S.; El-Kadri, O.M.; Abu-Yousef, I.A.; Kanan, M.C. Semiconducting metal oxide-based sensors for selective gas pollutant detection. Sensors 2009, 9, 8158–8196. [Google Scholar] [CrossRef] [PubMed] [Green Version]
- Dey, A. Semiconductor metal oxide gas sensors: A review. Mater. Sci. Eng. B 2018, 229, 206–217. [Google Scholar] [CrossRef]
- Zhang, J.; Qin, Z.; Zeng, D.; Xie, C. Metal-oxide-semiconductor based gas sensors: Screening, preparation, and integration. Phys. Chem. Chem. Phys. 2017, 19, 6313. [Google Scholar] [CrossRef]
- Arshak, K.; Moore, E.; Lyons, G.M.; Harris, J.; Clifford, S. A review of gas sensors employed in electronic nose applications. Sens. Rev. 2004, 24, 181–198. [Google Scholar] [CrossRef] [Green Version]
- Ma, H.; Ding, E.; Wang, W. Power reduction with enhanced sensitivity for pellistor methane sensor by improved thermal insulation packaging. Sens. Actuators B Chem. 2013, 187, 221–226. [Google Scholar] [CrossRef]
- Chromaserwis. Available online: https://www.chromservis.eu/g/gas-principles?lang=PL (accessed on 21 October 2021).
- Dorman, F.L.; Overton, E.B.; Whiting, J.J.; Cochran, J.W.; Gardea-Torresdey, J. Gas chromatography. Anal. Chem. 2008, 80, 4487–4497. [Google Scholar] [CrossRef]
- Wang, J.; Wang, H.; Duan, C.; Guan, Y. Micro-flame ionisation detector with a novel structure for portable gas chromatograph. Talanta 2010, 82, 1022–1026. [Google Scholar] [CrossRef]
- Inficon Photovac MicroFID II Portable Flame Ionization Detector Data Sheet, ‘Information on the General and Technical Specifications of the Product’. 2014. Available online: http://www.raeco.com/products/gasmonitoring/inficon-dataFID/inficon-datafid-landfill-ds-dibf125a1-a-2014.pdf (accessed on 13 June 2022).
- Leary, P.E.; Kammrath, B.W.; Reffner, J.A. Field-portable gas chromatography–mass spectrometry. In Encyclopedia of Analytical Chem; John Wiley & Sons, Ltd.: Hoboken, NJ, USA, 2018. [Google Scholar] [CrossRef]
- Ethiopia, G. Evaluation of a micro gas chromatographic technique for environmental analyses of CO2 and C1–C6 alkanes. J. Chromatogr. A 1997, 775, 243–249. [Google Scholar] [CrossRef]
- Ciobanu, I.; Chiriac, A. Membrane and trap system for continuous monitoring of volatile organic compounds using a portable gas chromatography with thermal conductivity detector. J. Sep. Sci. 2002, 25, 447–452. [Google Scholar]
- Dziuban, J.A.; Szczygielska, M.; Malachowski, M. Portable gas chromatograph with integrated components. Sens. Actuators A Phys. 2004, 115, 318–330. [Google Scholar] [CrossRef]
- Grall, A.J.; Sacks, R.D. Column performance and stability for high-speed vacuum-outlet gc of volatile organic compounds using atmospheric pressure air as carrier gas. Anal. Chem. 1999, 71, 5199–5205. [Google Scholar] [CrossRef] [PubMed]
- Smith, H.; Zellers, E.T.; Sacks, R. High-speed, vacuum-outlet GC using atmospheric pressure air as carrier gas. Anal. Chem. 1999, 71, 1610–1616. [Google Scholar] [CrossRef]
- Regmi, B.P.; Agah, M. micro gas chromatography: An overview of critical components and their integration. Anal. Chem. 2018, 90, 13133–13150. [Google Scholar] [CrossRef] [Green Version]
- Lee, J.; Zhou, M.; Zhu, H.; Nidetz, R.; Kurabayashi, K.; Fan, X. In situ calibration of micro-photoionisation detectors in a multi-dimensional micro-gas chromatography system. Analyst 2016, 141, 4100–4107. [Google Scholar] [CrossRef]
- Staples, E.J.; Viswanathan, S. Detection of contrabands in cargo containers using a high-speed gas chromatograph with surface acoustic wave sensor. Ind. Eng. Chem. Res. 2008, 47, 21. [Google Scholar] [CrossRef]
- Antunes, M.V.; Linden, R. Determination of methyl ethyl ketone in urine samples by headspace solid-phase microextraction (SPME) sampling associated to gas chromatography with flame-ionisation detector (GC-FID). Quim. Nova 2008, 31, 2165–2168. [Google Scholar] [CrossRef] [Green Version]
- Kim, J.; Bae, B.; Hammonds, J.; Kang, T.; Shannon, M.A. Development of a micro-flame ionisation detector using a diffusion flame. Sens. Actuators B Chem. 2012, 168, 111–117. [Google Scholar] [CrossRef]
- Gong, S.; Wang, Y.; Wang, H.; Zhang, X.; Liu, G. High-pressure pyrolysis of isoprenoid hydrocarbon p-menthane in a tandem micro-reactor with online GC–MS/FID. J. Anal. Appl. Pyrolysis 2018, 135, 122–132. [Google Scholar] [CrossRef]
- Tilstone, W.J.; Savage, K.A.; Clark, L.A. Encyclopedia of Forensic Science: An Encyclopedia of History, Methods and Techniques; ABC-CLIO, Inc.: Santa Barbara, CA, USA, 2006. [Google Scholar]
- Fogerson, R.; Schoendorfer, D.; Fay, J.; Spiehler, V. Qualitative detection of opiates in sweat by EIA and GC-MS. J. Anal. Toxicol. 1997, 21, 451–458. [Google Scholar] [CrossRef] [PubMed] [Green Version]
- Schecter, A.J.; Sheu, S.U.; Birnbaum, L.S.; DeVito, M.J.; Denison, M.S.; Päpke, O. A comparison and discussion of two differing methods of measuring dioxin-like compounds: Gas chromatography-mass spectrometry and the calux bioassay–implications for health studies. Organohalogen Compd. 1999, 40, 247–250. [Google Scholar]
- McNair, H.M.; Miller, J. Basic Gas Chromatography, 2nd ed.; John Wiley & Sons, Inc.: Hoboken, NJ, USA, 2009. [Google Scholar]
- Smith, P.A. Portable gas chromatography. In Analytical Separation Science; Anderson, J., Berthod, A., Pino, V., Stalcup, A., Eds.; Wiley-VCH Verlag GmbH & Co. KGaA: Weinheim, Germany, 2015. [Google Scholar]
- Soo, J.-C.; Lee, E.G.; LeBouf, R.F.; Kashon, M.L.; Chisholm, W.; Harper, M. Evaluation of a portable gas chromatograph with photoionization detector under variations of VOC concentration, temperature, and relative humidity. J. Occup. Environ. Hyg. 2018, 15, 351. [Google Scholar] [CrossRef] [PubMed]
- Chen, J.L.; Han, B.Q.; Liu, T.H.; Wang, H.R.; Wang, J.H. Separation characteristics of an integrated temperature-controlled micro gas chromatography chip. J. Instrum. 2021, 16, 15. [Google Scholar] [CrossRef]
- Zampetti, E.; Papa, P.; Avossa, J.; Bearzotti, A.; Balducci, C.; Tranfo, G.; Macagnano, A. Low-cost benzene toluene xylene measurement gas system based on the mini chromatographic cartridge. Sensors 2021, 21, 125. [Google Scholar] [CrossRef]
- Miresmailli, S.; Bradbury, R.; Isman, M.B. Qualitative assessment of an ultra-fast portable gas chromatograph (zNoseTM) for analysing volatile organic chemicals and essential oils in laboratory and greenhouses. Arthropod-Plant Interact. 2010, 4, 175–180. [Google Scholar] [CrossRef]
- Schwartzberg, E.G.; Kunert, G.; Stephan, C.; David, A.; Rose, U.S.; Gershenzon, J.; Boland, W.; Weisser, W.W. Real-time analysis of alarm pheromone emission by the pea aphid (acyrthosiphon pisum) under predation. J. Chem. Ecol. 2008, 34, 76–81. [Google Scholar] [CrossRef] [Green Version]
- Li, J.; Li, Z.; Deng, X.; Song, C.; Raghavan, V.; Xie, Y. A flavor uniformity evaluation and improvement of Chinese spirit by electronic nose. Food Sci. Nutr. 2020, 8, 1509–1521. [Google Scholar] [CrossRef] [Green Version]
- Meciarova, L.; Vilcekova, S.; Balintova, M. Measurement of VOCs with a portable GC/SAW detector. Chem. Eng. Trans. 2014, 40, 283–288. [Google Scholar] [CrossRef]
- Crume, C. History of Inficon HAPSITE: Maintenance Management, Support, and Repair, KD Analytical. 2009. Available online: http://www.kdanalytical.com/instruments/inficon-hapsitehistory.aspx (accessed on 13 June 2022).
- Ramgir, N.S. Electronic nose based on nanomaterials: Issues, challenges, and prospects. ISRN Nanomater. 2013, 21, 941581. [Google Scholar] [CrossRef] [Green Version]
- Hu, W.; Wan, L.; Jian, Y.; Ren, C.; Jin, K.; Su, X.; Bai, X.; Haick, H.; Yao, M.; Wu, W. Electronic noses: From advanced materials to sensors aided with data processing. Adv. Mater. Technol. 2019, 4, 1800488. [Google Scholar] [CrossRef] [Green Version]
- Bax, C.; Sironi, S.; Capelli, L. How can odors be measured? An overview of methods and their applications. Atmosphere 2020, 11, 92. [Google Scholar] [CrossRef] [Green Version]
- Grzelka, A.; Sówka, I.; Miller, U. Methods for assessing the odor emissions from livestock farming facilities. J. Ecol. Eng. 2018, 19, 56–64. [Google Scholar] [CrossRef] [Green Version]
- Wiśniewska, M. Methods of assessing odour emissions from biogas plants processing municipal waste. J. Ecol. Eng. 2020, 21, 140–147. [Google Scholar] [CrossRef]
- Cheng, L.; Meng, Q.-H.; Lilienthal, A.L.; Qi, P.-F. Development of compact electronic noses: A review. Meas. Sci. Technol. 2021, 32, 062002. [Google Scholar] [CrossRef]
- Aleixandre, M.; Santos, J.; Sayago, I.; Cabellos, J.; Arroyo, T.; Horrillo, M. A wireless and portable electronic nose to differentiate musts of different ripeness degree and grape varieties. Sensors 2015, 15, 8429–8443. [Google Scholar] [CrossRef] [Green Version]
- Herrero, J.L.; Lozano, J.; Santos, J.P.; Fernandez, J.A.; Marcelo, J.I.S. A Web-based approach for classifying environmental pollutants using portable e-nose devices. IEEE Intell. Syst. 2006, 31, 108–112. [Google Scholar] [CrossRef]
- Zhu, H.; Zhou, M.; Lee, I.; Nidetz, R.; Kurabayashi, K.; Fan, X. Low-power miniaturized helium dielectric barrier discharge photoionization detectors for highly sensitive vapor detection. Anal Chem. 2016, 88, 8780–8786. [Google Scholar] [CrossRef]
- Aleixandre, M.; Gerboles, M. Review of small commercial sensors for indicative monitoring of ambient gas. Chem. Eng. Trans. 2012, 30, 169–174. [Google Scholar]
- Haag, W.R.; Wrenn, C. The PID Handbook-Theory and Applications of Direct-Reading Photoionization Detectors (PIDs), 3rd ed.; RAE Systems Inc.: San Jose, CA, USA, 2013. [Google Scholar]
- Jian, R.-S.; Sung, L.-Y.; Lu, C.-J. Measuring real-time concentration trends of individual VOC in an elementary school using a sub-ppb detection μGC and a single GC–MS analysis. Chemosphere 2014, 99, 261–266. [Google Scholar] [CrossRef]
- Draeger. Available online: https://www.draeger.com/Products/Content/x-pid-9000-9500-pi-9105883-pl-pl.pdf (accessed on 28 October 2021).
- Nasreddine, R.; Person, V.; Serra, C.A.; Le Calvé, S. Development of a novel portable miniaturized GC for near real-time low level detection of BTEX. Sensors Actuators B Chem. 2016, 224, 159–169. [Google Scholar] [CrossRef]
- Nölscher, A.C.; Sinha, V.; Bockisch, S.; Klüpfel, T.; Williams, J. Total OH reactivity measurements using a new fast Gas Chromatographic Photo-Ionization Detector (GC-PID). Atmos. Meas. Tech. 2012, 5, 2981–2992. [Google Scholar] [CrossRef] [Green Version]
- Pang, X.; Nan, H.; Zhong, J.; Ye, D.; Shaw, M.D.; Lewis, A.C. Low-cost photoionization sensors as detectors in GC × GC systems designed for ambient VOC measurements. Sci. Total Environ. 2019, 664, 771–779. [Google Scholar] [CrossRef] [PubMed]


| Sensor Type | Operation Principle | Quantification | Advantages | Limitations | References |
|---|---|---|---|---|---|
| PID | Sensor operation is based on the ionisation phenomenon; photons of high energy, usually in the UV range, are used; ionisation of molecules occurs after excitation of molecules by UV light; the photon energy is typically 10.6 eV | 0–20,000 ppm depending on the manufacturer | Low level of quantification, as low as one ppb | Lack of possibility to detect compounds with high ionisation energy (e.g., acetylene—11.40 eV, chloroform—11.37 eV, chloromethane—11.26 eV; usually lacks selectivity—ionisation of all compounds with energy lower or equal to the lamp energy | [80,81,82,83,84,85,86] |
| EC | An electrochemical reaction results from the transfer of charge from the electrode to the electrolyte. The electrolyte may be in a solid, gel, liquid, or gaseous state. Electrochemical cells are equipped with two, three, or four electrodes depending on the manufacturer. The gas to be measured diffuses into the measuring electrode via the diaphragm sensor. According to Nernst’s law for electrochemical reactions, the transfer of electrons induces a current whose measure is proportional to the gas concentration. | 0–100 ppm depending on the manufacturer | Low purchase cost, energy-saving, compact; response time is approx. 120 s dependent on the temperature | Not much selectivity; lower limit of quantification typically at 0.1 or 2 ppm. | [87,88,89] |
| MOS | The principle of the sensor is based on the receptor and transducer function. The function of the receptor is based on the recognition of a given gas at the gas–solid interface by an electron change on the surface of the metal oxides. The role of the transducer is to transfer the surface phenomenon to a change in electrical resistance in the sensor. There are two main types of semiconducting metalic oxides: n, the primary carrier is an electron, and p, in which the leading carrier is a hole. | 0–5000 ppm depending on the manufacturer | Small size, low purchase cost, low energy consumption, good sensitivity. | Low selectivity. | [90,91,92,93,94] |
| NDIR | The principle of operation is based on the absorption of infrared radiation waves (IR) of a specific length by individual gases. If there is a particular gas in the radiation area, some of the radiation is absorbed. The sensor consists of a source of IR radiation and a detector that measures its intensity. The decrease in intensity of the IR radiation corresponds to the concentration of the gas. | 0–100% | Possibility to work in conditions without access to oxygen. | Low selectivity; rapid temperature changes may cause erroneous measurement results. The presence of corrosive gases can damage the sensor. | [73,95] |
| PELLISTOR | The PELLISTOR consists of two spirals of thin platinum wire embedded in aluminium beads and connected to a Wheatstone bridge. One of the beads is impregnated with a unique catalyst to promote the oxidation of combustible gases, while the other is modified to inhibit oxidation. Platinum spirals are passed through an electric current and heated to a temperature that oxidises the combustible gases on the catalyst. The temperature rise is a measure of the concentration of flammable substances. | 0–100% LEL (lower explosion limit) depending on the manufacturer | Low cost of purchase; fast response time; stability | Sensor activity requires 10% oxygen content in the tested gases | [78,96,97] |
Publisher’s Note: MDPI stays neutral with regard to jurisdictional claims in published maps and institutional affiliations. |
© 2022 by the authors. Licensee MDPI, Basel, Switzerland. This article is an open access article distributed under the terms and conditions of the Creative Commons Attribution (CC BY) license (https://creativecommons.org/licenses/by/4.0/).
Share and Cite
Wiśniewska, M.; Szyłak-Szydłowski, M. The Application of In Situ Methods to Monitor VOC Concentrations in Urban Areas—A Bibliometric Analysis and Measuring Solution Review. Sustainability 2022, 14, 8815. https://doi.org/10.3390/su14148815
Wiśniewska M, Szyłak-Szydłowski M. The Application of In Situ Methods to Monitor VOC Concentrations in Urban Areas—A Bibliometric Analysis and Measuring Solution Review. Sustainability. 2022; 14(14):8815. https://doi.org/10.3390/su14148815
Chicago/Turabian StyleWiśniewska, Marta, and Mirosław Szyłak-Szydłowski. 2022. "The Application of In Situ Methods to Monitor VOC Concentrations in Urban Areas—A Bibliometric Analysis and Measuring Solution Review" Sustainability 14, no. 14: 8815. https://doi.org/10.3390/su14148815
APA StyleWiśniewska, M., & Szyłak-Szydłowski, M. (2022). The Application of In Situ Methods to Monitor VOC Concentrations in Urban Areas—A Bibliometric Analysis and Measuring Solution Review. Sustainability, 14(14), 8815. https://doi.org/10.3390/su14148815