Article

Multi-Scenario Simulation of Ecosystem Service Values in the Guanzhong Plain Urban Agglomeration, China

School of Public Administration, Xi’an University of Architecture and Technology, Xi’an 710055, China
*
Author to whom correspondence should be addressed.
Sustainability 2022, 14(14), 8812; https://doi.org/10.3390/su14148812
Submission received: 17 May 2022 / Revised: 12 July 2022 / Accepted: 17 July 2022 / Published: 19 July 2022

Abstract

:
Rapid urbanization and human activities enhanced threats to the degradation of various ecosystem services in modern urban agglomerations. This study explored the response of ecosystem service values (ESVs) to land use changes and the trade-offs among various ESVs in urban agglomerations under different future development scenarios. The patch-general land use simulation (PLUS) model and ESV calculation method were used to simulate the ESVs of Guanzhong Plain Urban Agglomeration under the Business As Usual scenario (BAU), Ecological Conservation scenario (EC), and Economic Development scenario (ED) in 2030. Global and local Moran’s I were used to detect the spatial distribution pattern, and correlation analysis was used to measure trade-offs among ecosystem services. The results showed that: (1) The simulated result of land use in Guanzhong Plain Urban Agglomeration showed high accuracy compared to the actual observed result of the same period, with a Kappa coefficient of 0.912. From 2000 to 2030, land use changes were significant, with the rapid decrease in farmland and an increase in construction land. The area of woodland increased significantly under the EC scenario, and the area of construction land increased rapidly under the ED scenario. (2) The decline of total ESV was CNY 218 million from 2000 to 2020, and ESVs remained the downward trend in the BAU and ED scenarios compared to 2020, decreasing by CNY 156 million and CNY 4731 million, respectively. An increasing trend of ESV showed under the EC scenario, with a growth of CNY 849 million. (3) Significant spatial autocorrelation showed in Guanzhong Plain Urban Agglomeration, as the Global Moran’s I were all positive and the p-values were zero. The ESV grids mainly showed “High-High” clusters in the mountainous areas and “Low-Low” clusters in plain areas. Except for food production, a majority of ecosystem services exhibited positive synergistic relationships. In future planning and development, policymakers should focus on the coordinated development of the urbanization process and ecological preservation to build an ecological safety pattern.

1. Introduction

Ecosystem services are the direct or indirect contributions of ecosystems to human well-being, linking natural ecosystems to society and the economy through ecosystem functions [1]. Land, combining various ecosystems, natural and human factors, is a geographical entity [2]. Urbanization closely links regional land use type changes to changes in the ability to provide ecosystem services [3]. Urban agglomerations are important power sources and growth poles in China’s urbanization process [4]. An urban agglomeration is of great significance for regional integration; coordinated development of large, medium, and small cities; and high-quality regional development [5]. Urban agglomerations have become the strategic core of China’s national economic development and the main component of new urbanization. In recent years, there has been a gradual increase in the number of ecological studies with the perspective of urban agglomerations. Scholars have studied different urban agglomerations from the perspectives of quantification of ecosystem services, synergistic relationships, accounting for ecosystem service values (ESVs), and comprehensive evaluations [6,7,8,9].
The Guanzhong Plain Urban Agglomeration is a national urban agglomeration in northwest China, with an important position in transportation, tourism, and industrial production. In recent years, with the increase in the urbanization rate, ecosystems in the region are facing degradation risk along with the phenomenon of groundwater and haze pollution [10]. Ecosystem issues have gradually become hot topics in this study area. Yang analyzed the spatio-temporal variations of ecological footprints and ESV from 2005 to 2017 in the Guanzhong Plain Urban Agglomeration, and found that the area’s consumption demand of natural resources was greater than the natural capital output [11]. Dong used the coupling coordination degree method to evaluate the relations between urbanization degree and ecological environment in the urban agglomeration, and further detected influencing factors of spatial divergence [12]. Peng estimated the future land use of Guanzhong Plain Urban Agglomeration in 2030 using the FLUS model, and simulated the supply and demand of ecosystem services [13]. His research was based on expert experience, which in part influenced judgments about overall ecosystem service budgets. Chen proposed an ecological pattern of the urban agglomeration by combining various ecological indicators and found ecological sources and corridors using the MCR method [5]. Current studies are fundamental for enriching the development patterns of ecosystem services in the Guanzhong Plain Urban Agglomeration. However, future ecological environment patterns had been a largely underexplored domain, especially under high-accuracy simulations.
Whether to pursue the ecosystem service value as ecological use or to pursue GDP as construction land is a point of conflict in land use planning. During the future development of urban agglomerations, different land use demands and development patterns induce changes in various ecosystem services. How to predict the future ecological degradation areas and develop land use planning scientifically has become the focus of research. In the context of natural resource value accounting by the Chinese government, by setting up three different development scenarios for the Guanzhong Plain Urban Agglomeration, it is possible to accurately predict future land use under different development patterns; thus, future urban development boundaries can be determined, and optimal management strategies for sustainable urban development and ecological security can be made. This paper attempts to construct three scenarios to simulate the trend, lower, and upper limits of future ESV changes and to assist in identifying changes in overall ecosystem services in the urban agglomeration.
In view of this, the specific research objectives of this paper are as follows: (1) to simulate the land use patterns of different scenarios in the Guanzhong Plain Urban Agglomeration in 2030, (2) to calculate the ESV changes from 2000 to 2020 and the differences in ESVs for the three scenarios, and (3) to analyze the spatial-temporal distributions and trends of ESVs and their trade-offs. This study provides significant support for securing land use planning under the ecological red line, a reference for effective allocation of land resources, and promotion of natural resource management under ecological protection.

2. Theoretical Background

2.1. Ecological Response to Land Use Changes

As human activities continue to intensify, rapid economic and social development has put increasing pressure on global natural resources and the ecological environment [14]. Human activities have altered the landscape patterns within their sphere of activity, affecting environmental diversity and further altering the geological and biological diversity of the region [15]. Various land use types are demonstrations of geodiversity [16]. The protection of geology is fundamental to the protection of the ecological environment [17]. In the process of rapid urbanization, urban sprawl continues to harm the ecological environment due to urbanization and industrialization, especially in China [18]. Since the reform and opening-up, China’s land use pattern has changed dramatically, manifested by changes in the spatial distribution of ecological land and land degradation [19]. Urbanization encompasses multiple forms of transformation, with land use shifting from agricultural to construction land, economic models shifting from primary to secondary and tertiary industries, and residents’ behavior patterns changing dramatically [20]. Correspondingly, land use conversion caused structure and function changes in the original ecosystems, concerning sustainable urban development [21]. Land use is the main form of response to the ecosystem service value [22,23,24,25]. Changes in land use types affect the structure, processes, and functions of ecosystems, which in turn affect the ecosystem service value [26]. Quantifying and analyzing changes in ecosystem service values (ESVs) is an important tool to raise ecological protection awareness [27,28]. Studying ESV response to land use/cover change (LUCC) has become a very popular research topic [29,30,31,32].

2.2. Land Use Simulation

Current land use simulation studies are mainly empirical studies, using GIS research tools combined with scientific theoretical methods to explore the characteristics of land use change and the driving factors [33]. Scholars obtained long-time-series land use data through remote sensing interpretation. Natural and socio-economic driving factors were spatialized by GIS software, and policy factors that cannot be quantified can be used as constraints for land use type conversion. By using different models, land use change rules were established using different driving mechanisms, and simulation results were generated [34]. The simulation results were compared with the actual land use status, and the accuracy was generally calibrated using Kappa coefficients or FoM coefficients. Further, multiple development scenarios were set up to predict land use under different development patterns.
Scholars implemented simulations of land use under different scenarios by adjusting the transfer cost matrices, neighborhood weights, and total future land use projections in the modeling [35,36]. In the different scenario settings of the simulation, scholars differed in the naming of future land use patterns, but their research designs were similar. The most common scenario settings were mainly three types, namely, the Business As Usual scenario (BAU), Ecological Conservation scenario (EC), and Economic Development scenario (ED) [35,37,38]. In some studies, Farmland Protection (FP) scenario was also a more common setting, while some scholars consider the conservation of farmland in the ED scenario [29,39]. Some researchers combined multiple scenarios with the UN’s SDG development goals or the IPCC’s climate development goals [40,41]. The common features of the multi-scenario simulations were that one scenario represented a non-interventionist development trend, one scenario focused on ecological protection, and one or more scenarios focused on economic development and its synergies [42,43]. Generally, the neighborhood weights of woodland, grassland, and water increased in the EC scenario and the scale of land use increased, while the neighborhood weight of construction land was generally the highest value in the ED scenario. Such scenario settings combined with changes in total land use can distinguish land use variations under multiple scenarios.
In the methodology choice of future land use simulation, most scholars adopted the CA-Markov model, CLUE-S model, FLUS model, etc., for the simulation [44,45,46]. The patch-general land use simulation (PLUS) model proposed by Liang et al. can better explore the causal factors of various types of land use changes and better simulate the changes at the patch level of multiple types of land use than other models. The PLUS model obtains the transition rules by analyzing the growing patches of each changed land use. A random forest classification algorithm is used to explore the relationships between the growth in each land use type and the multiple driving factors [47,48]. The model has been applied in the latest land use simulation studies [47,49,50,51].

2.3. Quantification of Ecosystem Service Values

Studies accounting for ecosystem service values can be broadly divided into two categories: methodologies based on unit service function values, or methodologies based on the unit area value equivalent factor [52]. The unit service function value approach, in which the total value is obtained based on the amount of ecosystem service function and the unit price of the functional volume, models the ecosystem service function of a small area by establishing a production equation between a single service function and local ecological variables [53]. The method has more input parameters, the calculation process is more complicated, and the evaluation method and parameter criteria for each service value are difficult to unify [54]. The unit area value equivalent factor approach is more intuitive and easy to use, requires fewer data, and is particularly suitable for the valuation of ecosystem services at regional and global scales [55]. The method combines land use types with different kinds of ecosystem services and generates a scale to assign values to each ecosystem service. In this way, the ESV of an area can be measured.
Costanza et al. first proposed an approach for accounting the ecosystem service value using the unit area value equivalent factor approach in 1997 [1]. Natural resources were viewed as a form of capital, and their capital stock contains flows of materials, energy, and information for ecosystem services. The value of each ecosystem service was estimated, assuming that the ecosystem service supply and demand curve is a vertical line. Xie et al. used the ecosystem service value table per unit area derived from the expert scoring method to account for the value of each ecosystem on the Tibetan Plateau [56]. Based on the method and the practical situation of the study area, scholars have studied the spatial and temporal changes in the ecosystem service values in different study areas, including different countries, provinces, cities, watersheds, and various ecological zones [57,58,59,60,61]. Most studies have been conducted on the response of past–present land use change to ecosystem service values, but studies on future land use and ESV changes are still to be further investigated [62,63].

3. Materials and Methods
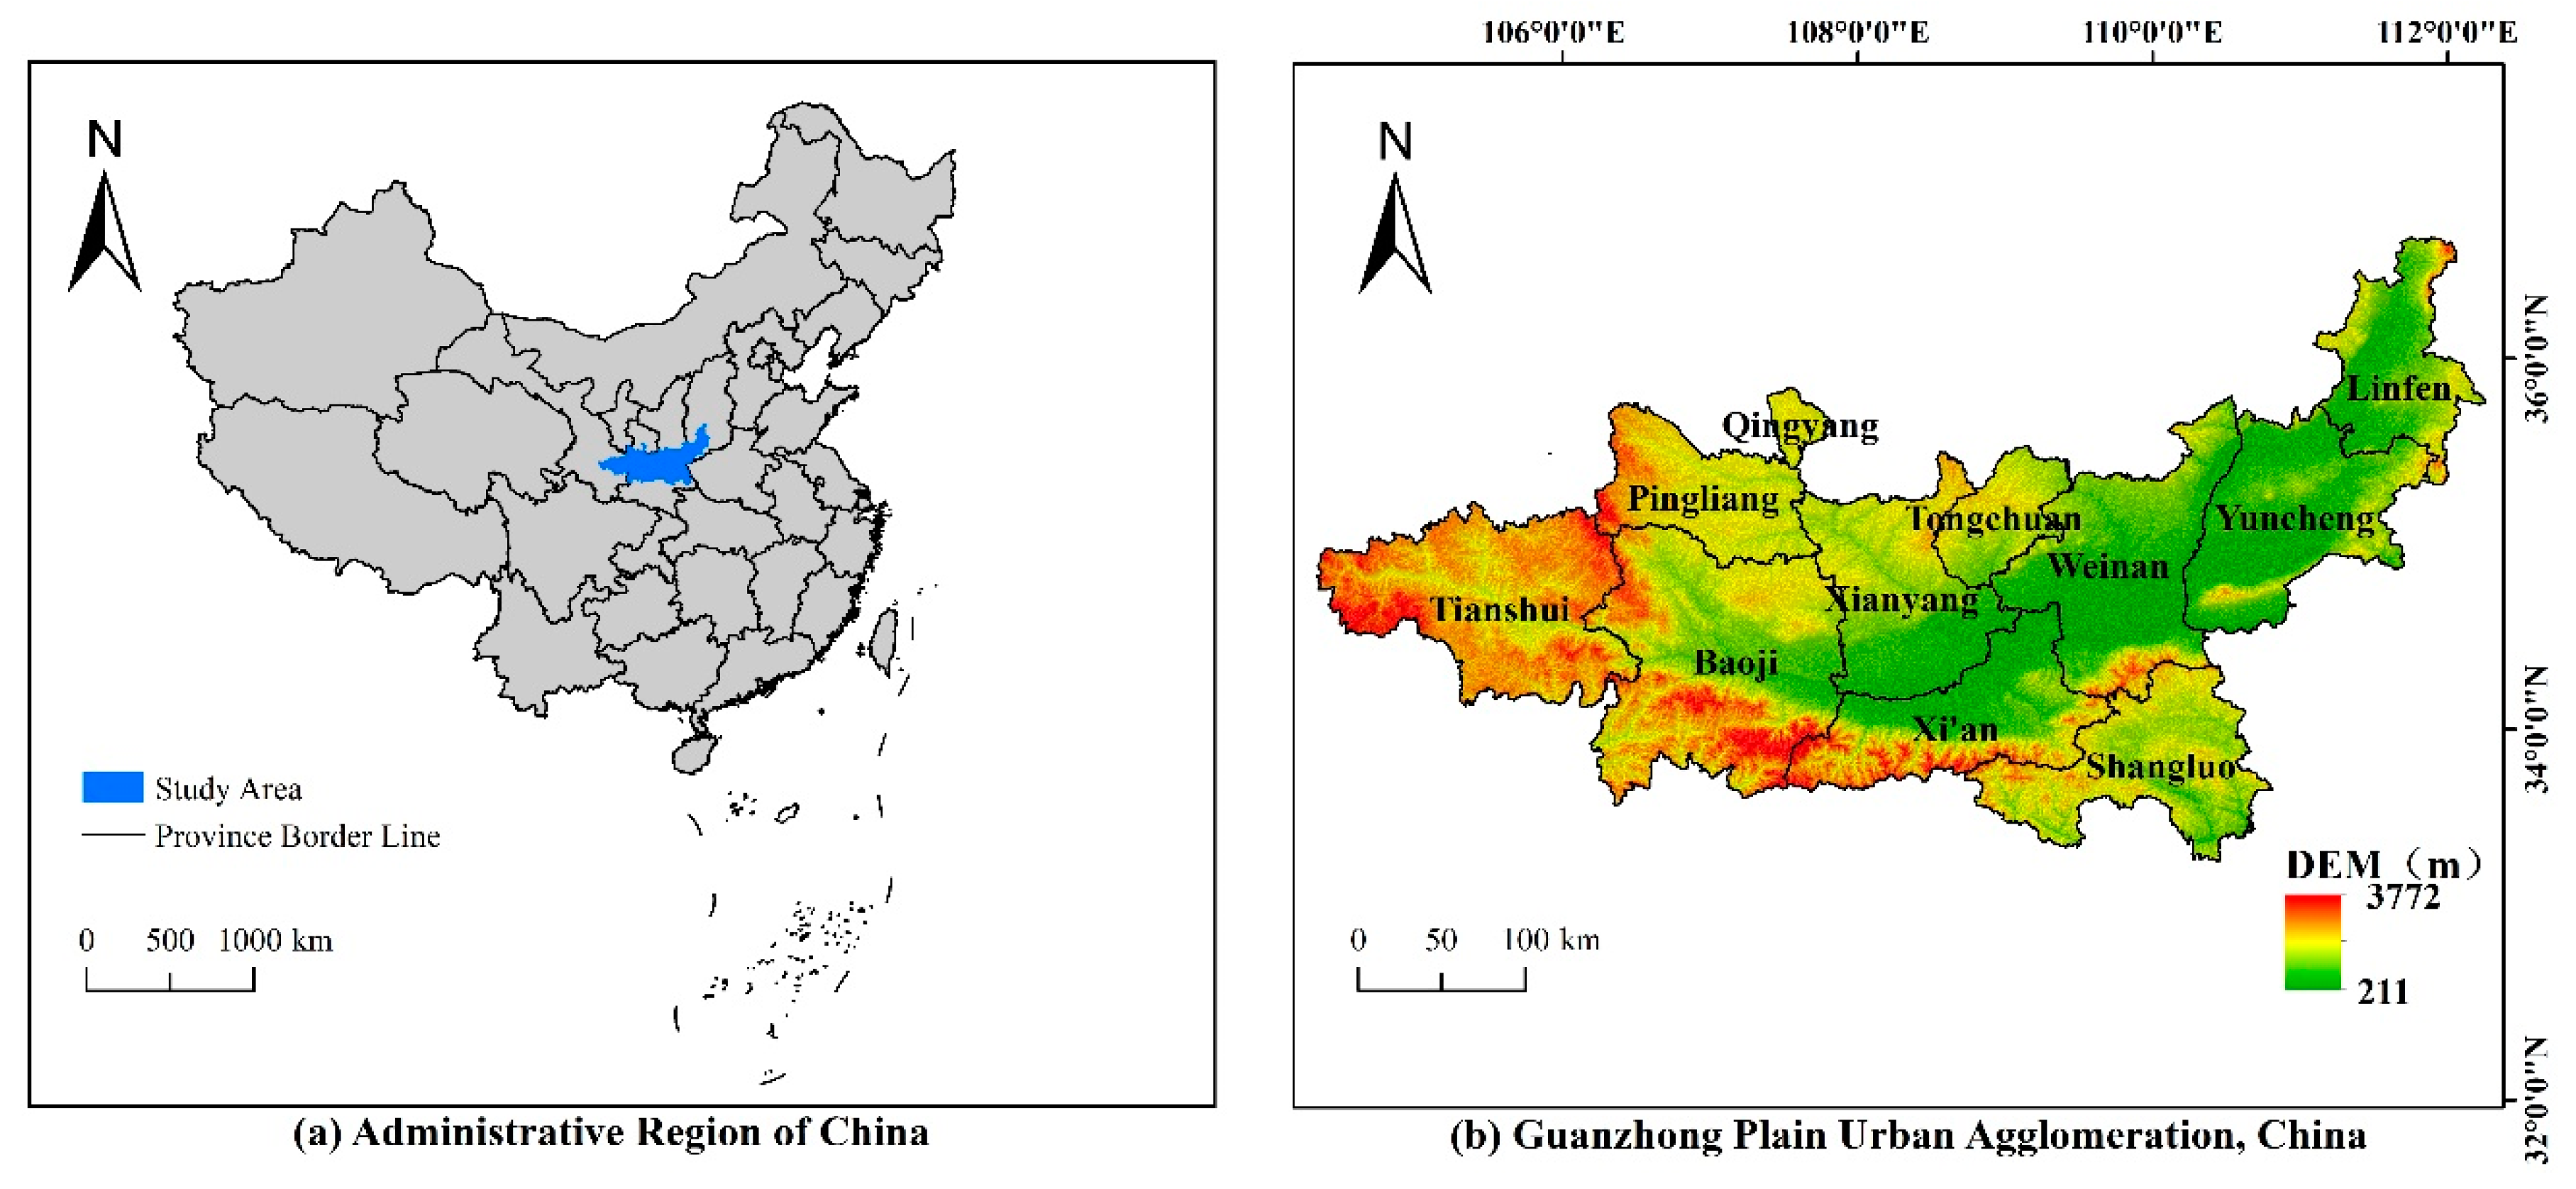
3.1. Study Area

The Guanzhong Plain Urban Agglomeration (104°34′—112°34′ E, 33°34′—36°56′ N) is located in the inland area of northwest China, in the core area of the Wei River Basin, the first major tributary of the Yellow River, and the Fen River Basin, and the second major tributary of the Yellow River. The urban agglomeration covers an area of 107,000 km2 and belongs to the warm temperate continental monsoon climate zone, with a resident population of 36,906,200 in 2020, and the regional GDP is CNY 1.91 trillion. The Guanzhong Plain Urban Agglomeration is an important fulcrum of the Asia–Europe Continental Bridge, and also the second-largest urban agglomeration in western China, connecting the China–Mongolia–Russia International Economic Cooperation Corridor in the north and the Chengdu-Chongqing Urban Agglomeration in the south [13]. The cities include Xi’an, Baoji, Xianyang, Tongchuan, Weinan, Shangluo City in Shaanxi Province; Yuncheng City (except Pinglu County and Quanqu County), and Linfen City (Yaodu District, Houma City, Xianfen County, Huozhou City, Quwo County, and Yicheng County) in Shanxi Province; Tianshui City (Hongdong County, Fushan County), Pingliang City (Kongdong District, Huating County, Jingchuan County, Chongxin County, and Lingtai County), and Qingyang City (Xifeng District) in Gansu Province. The study area is shown in Figure 1.

3.2. Data Sources

The land use data for 2000, 2010, and 2020 used in the paper were obtained from the Chinese Academy of Sciences, with a spatial resolution of 30 m. The data are based on the Landsat series of satellite images, generated through human–computer interaction and manual visual interpretation, with a comprehensive evaluation accuracy of more than 93% (https://www.resdc.cn/, accessed on 15 April 2022). The 30 m resolution elevation data were acquired from ASTER GDEM V2 datasets in the Geospatial Data Cloud (http://www.gscloud.cn/, accessed on 15 April 2022). Furthermore, details of the used datasets are shown in Table 1. In the PLUS model, all the driving factors were resampled to a spatial resolution of 30 m and reprojected to the coordinate system of WGS_1984_UTM_zone_49N (Figure 2). Multi-year grain production and planted area in Shaanxi, Shanxi, and Gansu provinces were obtained from the statistical yearbooks of each province, and grain prices were obtained from the National Compilation of Costs and Benefits of Agricultural Products.

3.3. Methodology Flow

Integrating land use with ESV accounting, the methodology flow of this study can be divided into three parts: (1) Analysis of land use change characteristics from 2000 to 2020 in the Guanzhong Plain Urban Agglomeration. The change characteristics of each type of land use were obtained by overlapping analyses and constructing land use transfer matrices. (2) Establishment of multi-scenario simulations of land use in 2030 using PLUS model. The total land use, land transfer rules, and neighborhood weights under the BAU scenario, ED scenario, and EC scenario were set, and we obtained the high-accuracy simulation results under the three scenarios by the PLUS model. (3) Calculation of ESVs, spatial and temporal variations and their synergistic relationships. Based on the constructed regional ecosystem service value scale and the land use data of each year, we accounted for the ESV of each land type and each ecosystem service. Further, we used the Global and Local Moran’s I for the spatial distribution characteristics and calculated the changes of correlation coefficients among each ecosystem service.

3.4. Future Land Use Simulation

3.4.1. PLUS Model

The PLUS model is a future land use change simulation model that integrates a land expansion strategy analysis module and a metacellular automata model based on multi-class random patch seeds [64]. The rule mining method of the land expansion analysis strategy (LEAS) module extracts the part of each type of land use expansion between two periods of land use change and uses the random forest algorithm to mine the factors of each type of land use expansion and driving factors one by one to obtain the development probability of each type of land use, the driving factors’ contribution to each type of land use in that time period, and the contribution of the drivers to the expansion of each type of land use in that time period. The PLUS model is better than the CLUE-S and CA-Markov models in terms of explaining the factors influencing land use change and the accuracy of the simulation results [47].

3.4.2. Multi-Scenario Simulation Settings

After referring to existing studies, consulting with relevant experts, and repeated adjustments, the probability of land use transfer under each scenario was set [50,65,66,67].
(1)
BAU scenario
The development pattern of land use in the Guanzhong Plain Urban Agglomeration from 2020 to 2030 was assumed to remain unchanged, i.e., the Markov chain model results from 2010 to 2020 were used to estimate the 2030 simulation results generated by the CA based on multi-type random patch seeds (CARS) module.
(2)
ED scenario
The land use in the economic development scenario is mainly referred to as the development plan of the Guanzhong Plain Urban Agglomeration (a guidance document issued by the Chinese government in 2018) and the overall land use plan of each city. “The 14th Five-Year Plan and the outline of the 2035 Vision” of China (official released in 2021) proposed to optimize the spatial layout of new urbanization and vigorously promote the construction of new urbanization with the county as the carrier to ensure food security, the supply of important agricultural products in the process of urban-rural integration, and development. Farmland is an important economic land type, so in the transfer condition matrix, it is set to not transfer to other land types except construction land, and construction land will not transfer to other land types. In the ED scenario in 2030, the transferring probability of farmland, woodland, grassland, and other land to construction land was set to increase by 50%, and the transferring probability of construction land to other land types except farmland was set to reduce by 50%.
(3)
EC scenario
The development plan of Guanzhong Plain Urban Agglomeration emphasizes ecological environmental protection as the task and prerequisite for the construction of the urban agglomeration, optimizing the ecological security pattern, and strengthening ecological protection and restoration. In the settings of land transfer rules, the transfer out of woodland and water was strictly restricted, and construction land was set to be transferable to woodland and grassland due to ecological remediation. In this study, the transferring probability of woodland and grassland to construction land was set to reduce by 50%, and the transferring probability of farmland, grassland, construction land, and other land to woodland was set to increase by 50%. The woodland and water areas were used as a restricted area, and the transfer of this type of land is prohibited. In the simulation of the EC scenario, ecological protection zones and development restriction zones will not be involved in land transfer. A buffer zone with 100 m around water systems was generated to limit the participation of land use transfer in the area [37]. The restricted zone of Guanzhong Plain Urban Agglomeration is shown in Figure 3.

3.5. Valuation of Ecosystem Services

The calculation of total ESV in Guanzhong Plain Urban Agglomeration was referred to Equation (1). The ESV per unit area of terrestrial ecosystem table proposed by Xie et al. set the food production function of farmland to 1, which presents the economic value of natural food production per unit area of farmland per year on average nationwide. The main food crops in the Guanzhong Plain Urban Agglomeration are wheat and corn. The value of different ecosystem services in the Guanzhong Plain Urban Agglomeration was corrected according to the value of one standard equivalent equal to 1/7 of the average grain yield market value in the region [56]. A provincial coefficient was used in the weighted average calculation between different provinces regarding Xie’s study [68]. We also referred to Li’s study to assign values to each coefficient of construction land [69]. The value of ecosystem services in Guanzhong Plain Urban Agglomeration was finally found to be CNY 1057.68/hm2/a, as shown in Table 2. The exchange rates of CNY to USD and EUR are 6.698:1 and 7.058:1, respectively (obtained on 17 June 2022), same below.
ESV = f = 1 m i = 1 n ( C f   ×   E fi )  
where ESV is the total ecosystem service value (yuan) of the Guanzhong Plain Urban Agglomeration, Cf is the area of the fth land type, Efi is the service function value of the jth land use type, m is the number of land use types, and n is the number of ecosystem service categories.

3.6. Spatial Autocorrelation Analysis

Spatial auto-correlation is an important indicator to test the correlated significance of the attribute value of an ecological index with the attribute value of its adjacent space [70]. The Global Moran’s I index reflects the correlation of attribute values of adjacent spatial units [71]. The absolute value of Moran’s I is close to 1, indicating a stronger spatial auto-correlation. The Global Moran’s I can be calculated as follows:
Global   Moran s   I = N i ij w ij x i   x ¯ x j   x ¯ i ij w ij i x i   x ¯ 2
where wij, xi, xj, μ, and N indicate the normalized weights, value in the ith pixel, value in the jth pixel, mean value of the study area, and the total number of pixels, respectively. The Moran’s I index is approximately +1 for places with complete correlation, while it is approximately −1 for places that are completely non-correlated.
Local Moran’s I (LISA) index can effectively reflect the correlation between the ecological environment quality of each grid unit in the study area [29]. The calculation formula is as follows:
Local   Moran s   I = x i   x ¯ ij w ij x j   x ¯ i x i   x ¯ 2
where the calculation parameters are the same as the Moran’s I index. LISA cluster map has five types of local spatial aggregation, namely High-High (H-H), Low-Low (L-L), Low-High (L-H), High-Low (H-L), and Not Significant.

4. Results

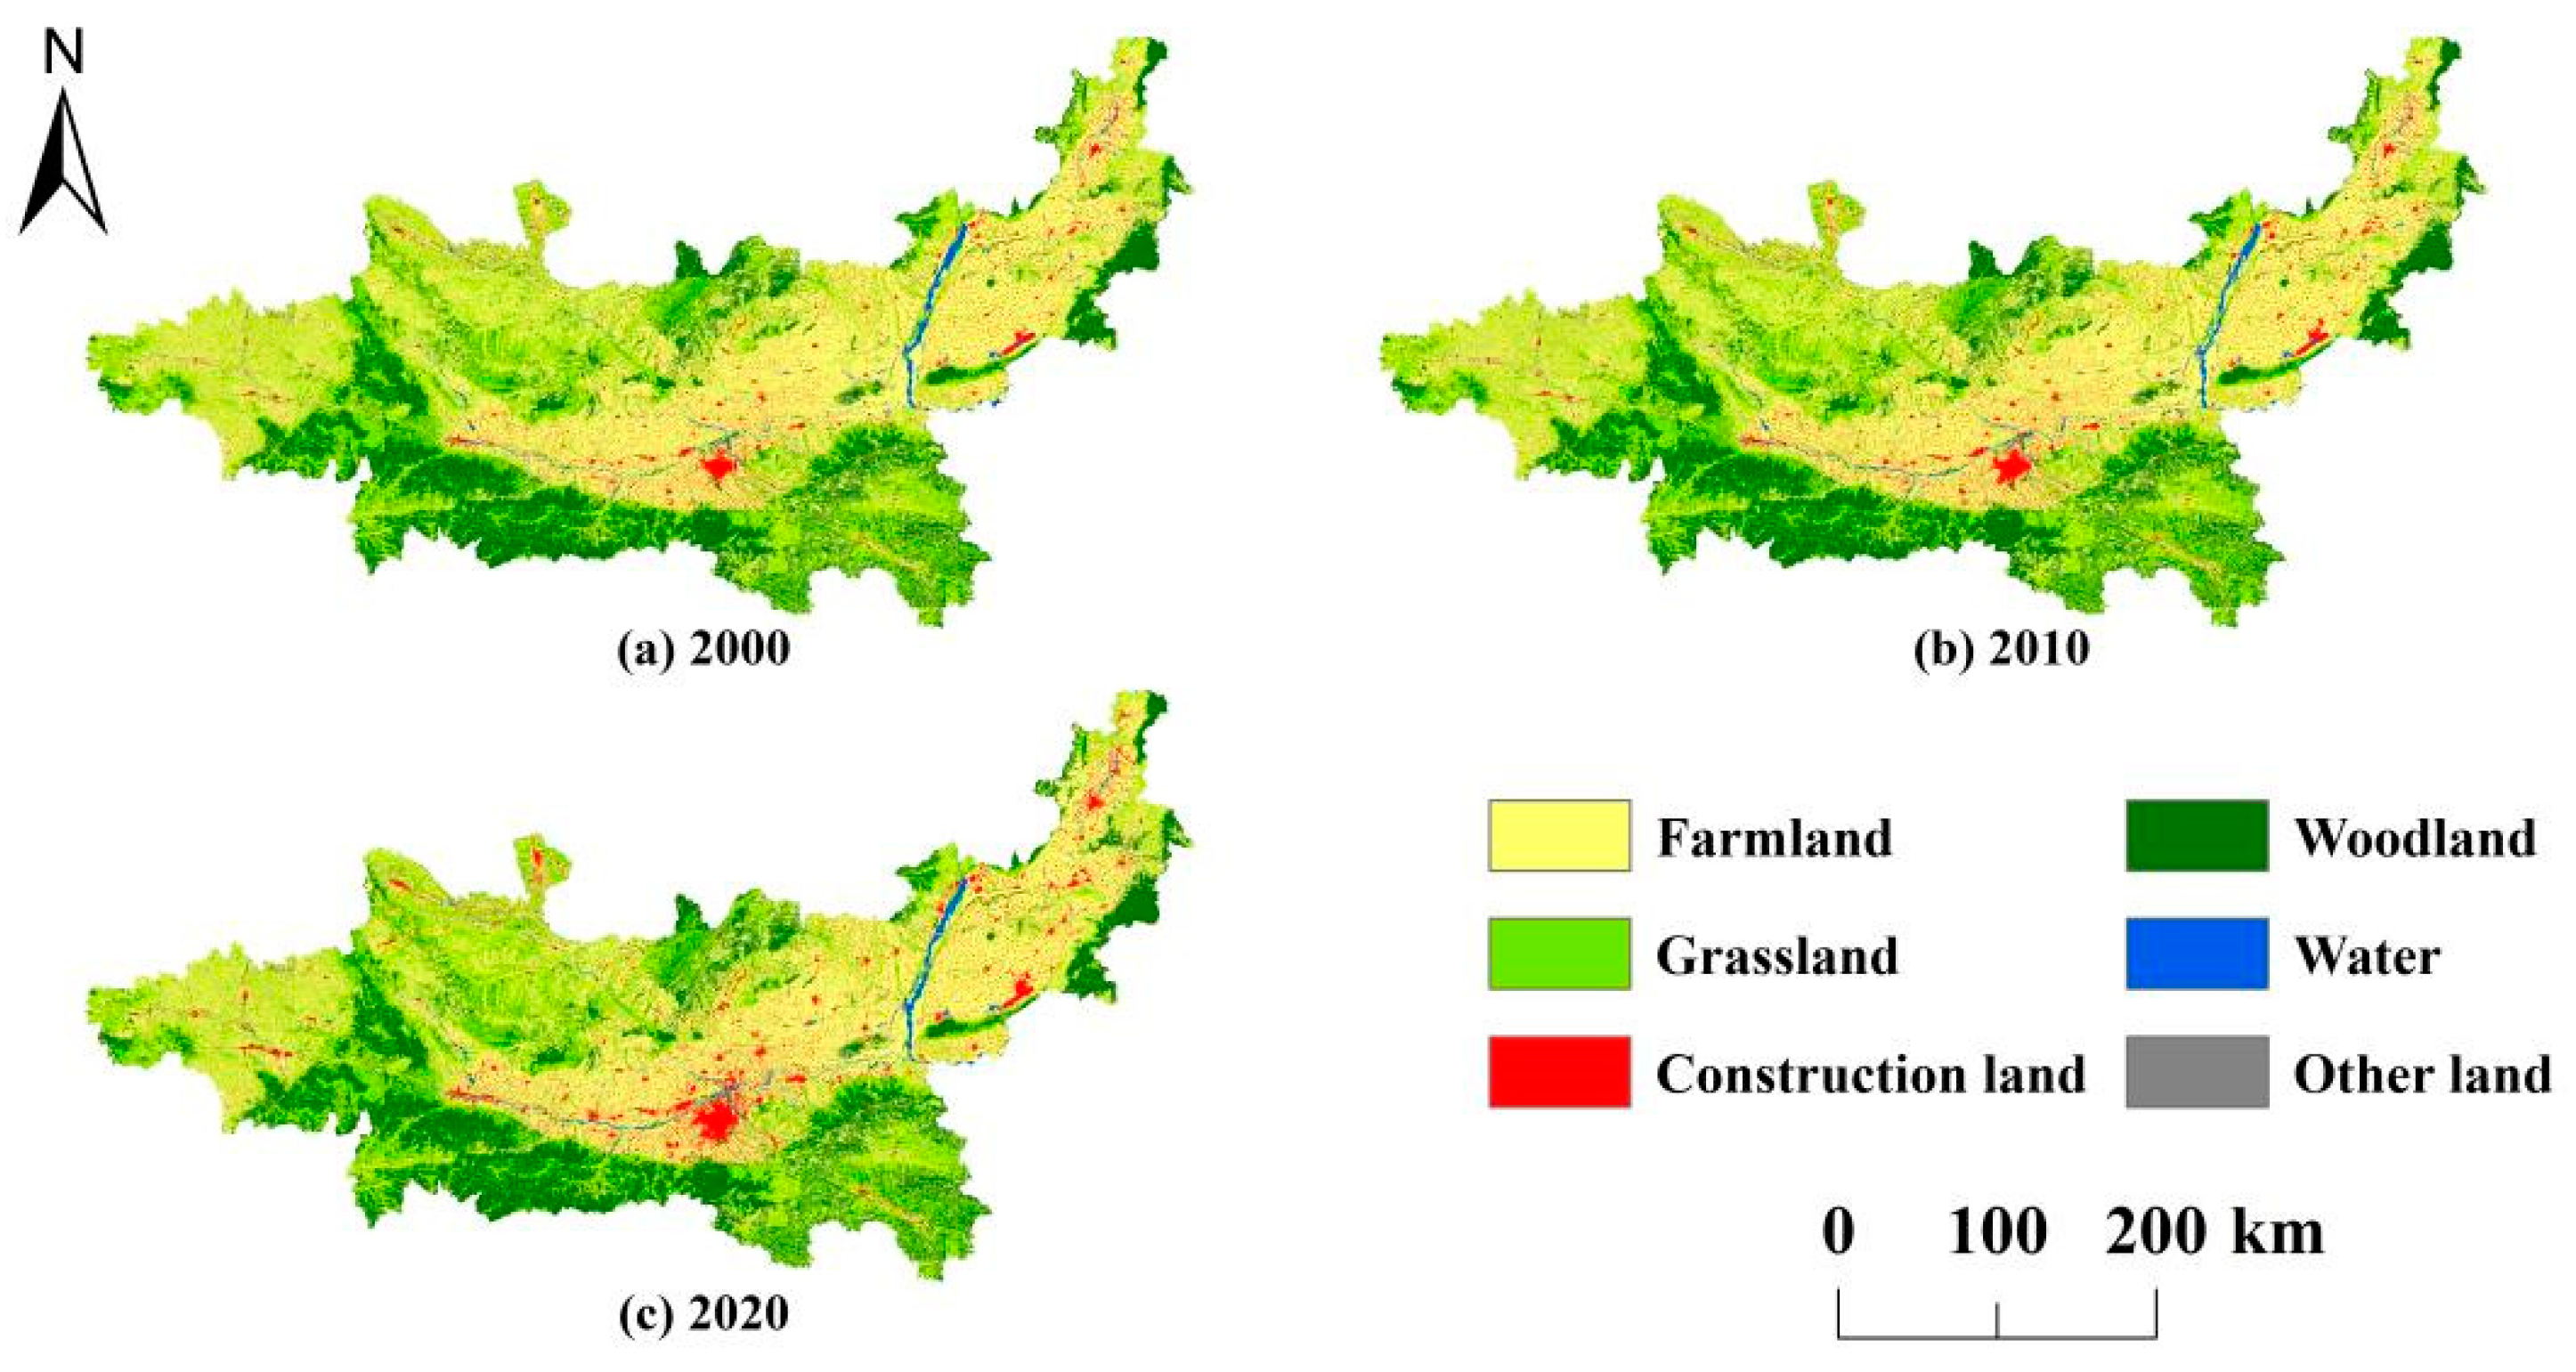
4.1. Land Use Change Characteristics

Figure 4 shows the land use types of the Guanzhong Plain Urban Agglomeration from 2000 to 2020. According to the land reclassification results, the land types of Guanzhong Plain Urban Agglomeration are mainly farmland, woodland, and grassland, which together account for 95% of the total area. Farmland accounts for about 45% of the total area of the region, woodland accounts for about 22% of the total area, and grassland accounts for about 27%. Between 2000 and 2020, the area of farmland and other land decreased, and the area of woodland, grassland, water, and construction land increased (Figure 5). The land use type transfer matrix is shown in Table 3. The total area of farmland was 49,593.83 km2 in 2000, dropped to 48,655.17 km2 in 2010, and reduced to 46,877.72 km2 in 2020. The decreasing rate of farmland was about 0.27% per year. The most dramatic expansion of the land types is the construction land, rising from 4400.11 km2 in 2000 to 6173.44km2 in 2020, with an increase of 1773.33 km2 in total. The total increasing rate of construction land reached 40.30%, almost 2.02% per year. The area of woodland, grassland, and water increased slightly, with a growth of 271.41 km2, 628.05 km2, and 44.04 km2, respectively.

4.2. Multi-Scenario Land Use Simulation

Referring to existing studies and considering the current situation of the study area, the authors selected 16 natural and social factors such as elevation, slope, GDP, population, average annual precipitation, average annual temperature, distance to railroads, distance to roads (city main road, highway, state road, provincial road, county road), distance to rivers, distance to built-up areas, distance to urban and rural settlements, and nighttime light brightness as the driving factors of land use change in the study area [50,66,72]. Their driving forces were identified using the LEAS module, the number of random forest decision trees was set to 50, the sampling rate was 0.01, and the number of features in the training RF was 16 to obtain the suitability images for the six land use types. The contribution of each driving factor is shown in Figure 6.
Compared with the actual situation in 2020, the Kappa coefficient of the simulation results was 0.912, greater than 0.8, meeting the simulation accuracy requirements. The three scenarios’ conversion cost matrix and neighborhood weight matrix are presented in Table 4 and Table 5, respectively. The land use images of the Guanzhong Plain Urban Agglomeration in 2030 under three scenarios were obtained by combining the development zones and restricted zones (Figure 7, Table 6). In the BAU scenario, the area of farmland in 2030 was 4533.58 km2, which decreased by 1544.14 km2 compared to 2020, which was the largest area transferred out. The area of woodland and grassland increased slightly by 67.37 km2 and 296.81 km2, respectively. The area of water rose to 1333.23 km2, with an increase of 37.33 km2, and the area of other land slightly increased from 159.82 km2 to 169.62 km2. Construction land was the largest transferred-in land type, compared to 2020, with a total growth of 1146.96 km2.
Under the ED scenario, compared to 2020, the area of woodland, grassland, water, and other land decreased. Conversely, farmland and construction land area increased. Construction land, with the largest increase, increased by 1947.85 km2, followed by 172.69 km2 in farmland. Under this scenario, the urban agglomeration’s construction land area expanded rapidly, with Xi’an as the primary core, and Baoji and Yuncheng as the secondary cores, developing rapidly along the Wei and Fen rivers. In this scenario, the high speed of farmland conversion was slowed down and the balance of farmland occupation was taken into account to ensure the important economic productivity.
In the EC scenario, the trends for each land type remained consistent with the BAU scenario. Farmland was still the main source of construction land, 1644.55 km2 less than in 2020. The area of woodland, grassland, water, construction land, and unused land all increased to some extent. The area of ecological land types expanded significantly, as the area of woodland and grassland increased by 1.63% and 9.77%, respectively. The enhancement of the water area was rather reduced compared to the BAU scenario, which may be due to the transfer limitation of the buffer zone around the water systems. Compared with the BAU scenario, the growth rate of construction land was not significantly reduced, and the total area only decreased by 63.22 km2.

4.3. Spatial and Temporal Variation of Ecosystem Service Values

4.3.1. Total ESVs and Variations of Each Ecosystem Service

Based on the land use situation of 2000, 2010, 2020, and three scenarios in 2030, we calculated the total ESVs and ESV of each classification in the Guanzhong Plain urban agglomeration (Table 7 and Table 8). From 2000 to 2020, the overall ESV continuously reduced. In 2000, the total ESV was CNY 113.14 billion, and the number continuously dropped to CNY 110.68 billion in 2020. The changing rate from 2000 to 2010, 2010 to 2020, and 2000 to 2020 was −0.48%, −1.70%, and −2.18%, respectively. For different land types, the ESV of woodland, grassland, water, and other land enhanced, while farmland and construction land decreased. The most degradation was the construction land ESV change from 2000 to 2020, which was 40.31% lower than in 2000. The trend of ESV reduction in farmland continued to increase, with a total decline rate of −3.30% between 2000 and 2020, the largest reduction except for construction land. The total increase of water ESV was the highest in the last 20 years, with an increased rate of 3.52%. Among the different scenarios’ simulations, ESVs showed different trends in comparison to 2020. In the BAU and ED scenario, the total ESVs decreased by CNY 156 million and CNY 4731 million, respectively, while in the EC scenario, the total ESV increased by CNY 849 million. The growth of construction land area was the main reason for the fluctuation of ESV under each scenario.
In the intercomparison of different ecosystem services, the ESVs of food production, climate regulation, waste treatment, water flow regulation, and soil fertility maintenance showed downward trends, while the ESVs of raw material, gas regulation, biodiversity protection, and recreation and culture increased from 2000 to 2020. The value of soil fertility maintenance was the highest of the nine ecosystem services, and the value of recreation and culture remained the lowest. In the BAU scenario, the ESV of raw material increased slightly, and the other eight ecosystem services all showed declining trends. In the ED scenario, the trends were generally consistent, with all ESVs showing decreasing trends. The EC scenario showed improvement in the situation of various ecosystem services. Raw material, gas regulation, climate regulation, soil fertility maintenance, biodiversity protection, and recreation and culture functions all increased to some extent, indicating the improvement of the ecological environment in the Guanzhong Plain Urban Agglomeration in this scenario.

4.3.2. Spatial Distribution and Trade-Offs of Different ESVs in Different Scenarios

To compare the local variation and spatial correlation, a 5 km × 5 km grid was generated by ArcGIS 10.8 to calculate the local ESVs. The spatial and temporal ESV variations of Guanzhong Plain Urban Agglomeration are shown in Figure 8. The high ESV grids were mainly distributed in the southeast, east, and north, and the low ESV grids were mainly distributed in the middle and northeast. The areas with ESVs below CNY 0 and 10 million were mainly urban built-up areas, and a significant expansion of areas with low ESV values can be observed in the three scenarios.
The Global Moran’s I was calculated by ArcGIS software, and the index showed an increasing trend year by year during 2000–2020 (Table 9). The Moran’s I was 0.6979 in 2000, 0.7049 in 2010, and 0.7057 in 2020. In the three scenarios, the highest Moran’s I was 0.7122 in the EC scenario, and the lowest was 0.5755 in the ED scenario. All p-values were zero, indicating that the ESVs of the Guanzhong Plain Urban Agglomeration showed a high degree of spatial autocorrelation. The total ESV value of the Guanzhong Plain Urban Agglomeration showed an obvious “two-pole” pattern, i.e., it was mainly manifested as “High-High” agglomeration and “Low-Low” agglomeration (Figure 9). The “High-High” clusters were mainly concentrated in the Qinling Mountains in the south and in the hilly and ravine areas of the Loess Plateau in the north, while the “Low-Low” clusters were mainly located in the plains and other areas where human activities were frequent.
Further, we calculated correlation coefficients for the ESVs in each secondary class in 2000, 2010, 2020, and three scenarios in 2030 to examine the trade-offs among the ecosystem services. The Pearson coefficient was calculated by SPSS 21 and visualized by MATLAB 2019a (Figure 10). Significant positive correlations showed in some ESV types. Except for FP and WT, all six ecosystem services showed positive synergistic relationships. In the ecosystem service of FP, synergistic features remained consistent across the six periods, with negative correlations with RM, GR, CR, WFR, SFM, BP, and RC. This may be due to the fact that the largest proportion of land type in the Guanzhong Plain Urban Agglomeration was farmland and the reduction in the area of farmland caused a weakening of the food production function. The correlation of the waste treatment function followed the same pattern of changes as the food production function. From 2000 to 2020, the negative correlation between FP and other services showed a gradual reduction. In the three scenarios in 2030, excellent synergistic relationships remained among the various ecosystem services, and in the EC scenario, the observation of the most significant synergies was detected.

5. Discussion

5.1. Feasibility of PLUS Model Application

The accuracy validation of simulation results is the main way to measure the land simulation model [73]. The simulated result of land use in Guanzhong Plain Urban Agglomeration was compared with the actual land use in 2020. The Kappa coefficient of the predicted image was 0.912 compared with the actual land use image. As the results of Landis’ research, the Kappa statistic larger than 0.8 was recognized as almost perfect [74]. This indicates that the PLUS model has great advantages in terms of land use simulation accuracy [75]. Wang et al. tested the FLUS model and the PLUS model with land use simulations in western Beijing and found that the accuracy of the PLUS model was higher [65]. Guo et al. compared and analyzed the simulation results of the RNN-CA, the ANN-CA, and the PLUS models, and the PLUS model continued to perform the best [76]. To further verify the results of the PLUS model, we calculated the simulation accuracy for each of the six land use types. The simulation accuracies were 0.941, 0.975, 0.948, 0.862, 0.780, and 0.816 for farmland, woodland, grassland, water, construction land, and other land, respectively. The overall accuracy was 0.940, indicating that the prediction accuracy of the PLUS model is excellent and can be used as a method for future land use simulation.

5.2. Land Use Change Patterns and ESV Trade-Offs

The land use changes in the Guanzhong Plain Urban Agglomeration were the result of a combination of various factors. In general, the trend of land use changes showed that the area of farmland continued to decrease and the area of woodland, grassland, water, construction land, and other land increased. This feature was consistent with findings from similar study areas [66,77,78]. From 2000 to 2020, farmland was the most transferred out land type. The net transferred out area of farmland shifted mainly to construction land and grassland. On the one hand, the policy of returning farmland to woodland and grassland was being gradually implemented, and, on the other hand, the rapid development of the economy and society significantly increased the demand for urban construction land, and a large amount of farmland on the outskirts of cities had been occupied [79]. Under the three scenarios for 2030, land use characteristics continued to be characterized by a rapid turn-out of farmland. The most significant increase in woodland was observed in the EC scenario, while the expansion of construction land reached its greatest level in the ED scenario.
Multiple scenarios of future land use changes would trigger changes in the value of various ecosystem services, which in turn would affect their trade-off relationships [80]. ESV degradation areas are mainly distributed around urban built-up areas, which were the typical characteristics of land use type changes. In the high-altitude region, ESVs under BAU and EC scenarios, on the other hand, showed an increasing trend due to the effect of ecological remediation works. In the BAU scenario and the EC scenario, the ESV differences revealed by the grids were not significant, while the ESV changes in the ED scenario were more significant. It is noteworthy that the ESV in the southwestern mountains exhibited a rapid decline under the ED scenario if the transfer out of woodland and grassland was not constrained. With the expansion of urban and rural construction land, the “two-pole” pattern of ESV distribution in the Guanzhong Plain Urban Agglomeration had become more obvious.
Trade-offs between ecosystem services remain the focus of such studies [81]. Scholars calculated the correlation coefficients between ecosystem services, ecosystem service values in the region, or the spatial distribution patterns based on the characteristics of the study area [82,83]. However, the correlation coefficients between the various types of ESVs showed different characteristics due to the different study scopes (municipal, county, and grid) [29,84,85]. Since the land use change patterns in rapidly urbanizing regions are alike, the correlation pattern of ESVs we found was similar to that of Zhang et al. [86]. The synergistic relationships of the nine types of ecosystem services did not change significantly under the three simulated scenarios. This indicated that the trend of the Guanzhong Plain Urban Agglomeration is characterized by the development of coupled urbanization and ecological protection.

5.3. Policy Implications

By comparing the future land use simulation results of the Guanzhong Plain Urban Agglomeration under the three scenarios, we found that the expansion of urban construction land was rapid. The changes of ecological land such as woodland, grassland, and water varied under different development scenarios, which also caused the great differences of ESVs. Based on our findings, we have made policy suggestions for governments:
Scientifically delineate primary functional zones based on research results. China’s current territorial spatial planning zoning is at the district and county levels. Each district and county is set as a key development zone, a major agricultural production zone, or an ecological function zone. In contrast, different districts and counties’ natural and social conditions vary greatly and cannot be divided simply by living, production, or ecological space. Some major agricultural production zones are more suitable for new land for construction, while some key development zones contain important ecological source sites. The existing land use control requirements and policy convergence rules are also unclear, making it more challenging to match the spatial governance requirements of different scales. The prediction results of this study can refine future land use planning to the community level and help to allocate land development targets more scientifically. By aggregating the future land demand of each region through bottom-up statistics and preparing a new land use plan, we can ensure a reasonable allocation while meeting the land use laws.
Establish a long-term mechanism for balancing the ESVs from the perspective of urban agglomerations. The effectiveness of the current ecological project implementation is unstable and lacks systematic evaluation. Most projects have focused on the efficacy of single ecological projects, and the evaluation indexes are limited to the expected objectives of the original projects, such as the area of afforestation, the area of soil erosion control, or the number of dam systems projects, etc. Only a few plans have focused on the indicators of ecosystem service functions. The results of our research can provide new ideas for land use planning to plan the area of various land use types based on future ESV changes as a constraint to ensure the overall ESV of urban agglomerations is not degraded. The general land use target of the urban agglomeration is planned within limits using the ESV under the EC scenario as the upper limit and the ESV under the ED scenario as the lower limit.
Further consolidate the effectiveness of ecological restoration projects. There are numerous ecological restoration projects in government departments at this stage, but the project effects are still lacking. Economic forests are generally operated inefficiently and roughly: some plantation forests have a single structure, low ecological stability, and service functions; and some areas are close to the upper limit of regional water carrying capacity for vegetation restoration. The existing ecological funds come from a single source, still dominated by state input, lacking long-term stable input mechanisms and investment channels. Ecological conservation and restoration expenditures are still far below ESV losses. Since ecological optimization has powerful positive externalities, cities should negotiate the establishment of an ecological fund dedicated to ecological remediation. In inner-city space layouts, municipal engineering should increase the number of urban parks, green areas, green belts, artificial water systems, and lakes. In the ravine, the river bank, the slope area, and the idle vacant land, departments should grow green plants. Take traditional villages as units, greening and beautifying beside villages, houses, roadsides, and watersides, forming a combination of ecological restoration of points, lines, and surfaces. Within the mountains, natural restoration is the primary measure, supplemented by artificial restoration, to maximize the recovery of damaged land and destroyed vegetation to a zonal ecological landscape. Technical measures include hanging net guest soil spraying, fish scale pit planting (planting trough), planting bag, vine plant climbing, seedling replanting, etc.

5.4. Establishment of Smart and Sustainable Cities

Sustainability issues have received much attention from the United Nations Millennium Development Goals (MDGs) to the 2030 Sustainable Development Goals (SDGs) [87,88]. The realization of SDGs depends on harmonizing social, ecological, and natural resource elements. China was one of the fastest-growing countries in the SDGs’ global score ranking, with a score that increased from 59.1 in 2016 to 73.89 in 2020 and a corresponding rise in ranking from 76th to 48th. Despite China’s massive progress under the SDGs, rapidly growing population and resource pressures have strongly impacted ecosystem services in the context of rapid urbanization [89].
“Sustainable Cities and Communities” (SDG 11) is central to the achievement of all seventeen UN SDGs. Sustainable cities are based on the idea of sustainable development as a contemporary paradigm for building the ideal city of the future [90]. The concept was officially conceptualized by UN-Habitat at its second conference in 1996 as cities that are sustainable in three dimensions: environmental, social, and economic; that use resources at a sustainable level; and that are highly resilient to risk. As technology evolves, the understanding of sustainable cities is gradually gaining momentum. Subjects of compactness, sustainable transport, density, mixed land uses, habitat diversity, and greening were considered in the establishment of sustainable cities [91]. With the development of modern information technology, smart cities have gradually begun to attract attention [92]. However, since the concept of smart cities was proposed, due to the different starting points and focus, the connotation of smart cities has not yet formed a unified understanding [93]. Bibri synthesized the related research on smart and sustainable cities and proposed the research dimensions, technologies, and ideas for the future development of smart and sustainable cities [94]. Since then, studies on smart and sustainable cities have gradually emerged.
Our study attempts to propose a vision of smart and sustainable cities from the perspective of ecological security based on the current research results. It offers construction ideas from the ecological environment level to provide a paradigm for the high-quality development of the Guanzhong Plain Urban Agglomeration. The purpose of smart sustainable urban ecosystem management is to build a cyclic system that harmonizes human activities with natural development, to form and maintain a healthy ecosystem, to facilitate the exchange of material and information flows, to build landscapes with regional characteristics, and to enhance the quality of development with spatial control. The government should establish an ecological detection network. The network is based on remote sensing and drone images, combined with 5G transmission technology and AI recognition technology. Based on big data, the network enables real-time monitoring of changes in land cover, natural disasters such as wildfires and floods, and concentrations of PM2.5, PM10, and other information to be passed on to the relevant authorities. Ecological and environmental departments can make predictions on the current status and future trends of ecological quality based on existing high-precision data, making the protection of ecosystem services more scientific. At the same time, the government can incorporate more refined ecological and environment-related indicators into the vision, such as targets for total energy consumption, carbon emissions, forest accumulation, and green space per capita [95]. Each city in the Guanzhong Plain Urban Agglomeration should play a role in constructing smart and sustainable cities based on its characteristics and local conditions.

5.5. Limitations and Future Perspectives

The present study may have the following shortcomings. (1) This study cannot exhaust all future land use patterns and can only use three scenario representations. In the scenario settings of this paper, three scenarios were set up, namely the BAU scenario, ED scenario, and EC scenario. For example, we did not consider the Farmland Protection (FP) scenario in the scenario settings because the spatial distribution of permanently protected farmland is confidential government data that are not available. In this study, the protection of farmland was mainly reflected in the restriction of farmland to land types other than construction land in the ED scenario. (2) The selection of land use driving forces was based on data availability and accessibility, and therefore the driving factors of land use change could not be exhaustive. (3) The PLUS model can only simulate the future land use based on the changing pattern of existing land use types, and future policy factors were not considered. Policy factors are the main contributors to land use change in China. Policy uncertainty presents a variety of possibilities for future land use patterns.
This study provides methodological and data support for predicting the future ESVs in rapid urbanization regions. In our future studies on land use simulation and ESVs, we will improve the accuracy of regional ecosystem service value scales, collect natural and socio-economic data with higher accuracy, and conduct studies on larger-scale ecosystems based on land use simulation methods, focusing on the driving forces of land use transfers on the ecological environment.

6. Conclusions

Cities are spaces with a high concentration of population, resources, wealth, and human socio-economic activities. Due to the highly intensive nature of cities, ecological environment destruction, disordered development of resources, high population density, traffic congestion, declining quality of life, and other problems have become obstacles to the development of cities. Taking the Guanzhong Plain Urban Agglomeration as the study area, this paper analyzed scenario-based land use predictions and ESV responses. Through its spatial and temporal variation characteristics and synergistic patterns, we provided policy suggestions and data support for the coordinated and sustainable development of urban agglomerations.
The Guanzhong Plain Urban Agglomeration is a highly representative inland urban agglomeration among Chinese urban agglomerations. Its urbanization characteristics have promising implications for urban development in central and western China. The first feature is that farmland is the primary source of land transfer. In recent years, the national spatial planning has restricted the transfer-out of woodland, grassland, and water, and the policy of returning farmland to woodland and grassland has been gradually implemented. In addition to permanently protected farmland, a large amount of farmland has been converted to construction land. The massive withdrawal of farmland can trigger a dramatic degradation of ESVs. Such characteristics were also seen in other similar rapidly urbanizing regions. A regional ecosystem that wants to remain stable should follow the occupancy balance of ESV or at least ensure that no drastic changes occur.
The second feature is that in the single-core urban agglomeration, new construction land is mainly distributed around the main urban areas of the core city. In the simulation results of the three scenarios in 2030, the Guanzhong Plain Urban Agglomeration with Xi’an city as the core all exhibit a substantial expansion of the single-core. Due to policy-oriented factors and location conditions, this region is more prone to the urbanization process and accordingly triggers ecological degradation. Building multi-core urban agglomerations has become the key to solving this problem. In the process of new urbanization, on the one hand, the gravitational effect of core cities should be fully utilized to accelerate economic growth; on the other hand, the urban development boundary should be strictly observed in spatial planning and land use indexes should be reasonably allocated.
The third feature is that the spatial distribution pattern of ESVs shows significant spatial heterogeneity. Land use type differences are the most crucial cause of regional ESV changes and thus exhibit distinct spatial characteristics. The woodland is mainly distributed in the mountains with high altitudes and steep terrain, and most of them are located within the ecological protection red line, so the intensity of human exploitation is small. Grassland and farmland are mainly located in flat areas at lower elevations and are vulnerable to human activities. The plain area of the Guanzhong Plain Urban Agglomeration is dominated by farmland, grassland, and construction land, and shows L-L aggregation. The Qinling Mountains in the southern part and the Loess Hills in the northern region are concentrated areas of high ESVs, which shows H-H aggregation in the LISA results. Urban ecological security patterns are not static, which calls for governments to focus on synergistic relationships among ecosystem services. Constraint on the area of construction land and vigorous afforestation can effectively enhance the positive synergistic effect. Maintaining ESV supply and improving the quality of ecosystem services requires ongoing policy attention.

Author Contributions

Conceptualization, S.Y. and H.S.; methodology, S.Y. and H.S.; software, H.S.; validation, S.Y. and H.S.; formal analysis, S.Y. and H.S.; investigation, S.Y. and H.S.; resources, S.Y.; data curation, H.S.; writing—review and editing, S.Y. and H.S.; visualization, H.S.; supervision, S.Y. All authors have read and agreed to the published version of the manuscript.

Funding

This research was funded by the Annual Project of the Social Science Foundation of Shaanxi Province (2020D015), the Key Scientific Research Program of Shaanxi Provincial Education Department (20JT040), and the Soft Science Research Program Project of Xi’an (21RKYJ0053).

Institutional Review Board Statement

Not applicable.

Informed Consent Statement

Not applicable.

Data Availability Statement

Not applicable.

Conflicts of Interest

The authors declare no conflict of interest.

References

  1. Costanza, R.; d’Arge, R.; de Groot, R.; Farber, S.; Grasso, M.; Hannon, B.; Limburg, K.; Naeem, S.; Oneill, R.V.; Paruelo, J.; et al. The value of the world’s ecosystem services and natural capital. Nature 1997, 387, 253–260. [Google Scholar] [CrossRef]
  2. Xie, H.L.; Zhang, Y.W.; Choi, Y.; Li, F.Q. A Scientometrics Review on Land Ecosystem Service Research. Sustainability 2020, 12, 2959. [Google Scholar] [CrossRef] [Green Version]
  3. Cai, W.B.; Jiang, W.; Du, H.Y.; Chen, R.S.; Cai, Y.L. Assessing Ecosystem Services Supply-Demand (Mis)Matches for Differential City Management in the Yangtze River Delta Urban Agglomeration. Int. J. Environ. Res. Public Health 2021, 18, 8130. [Google Scholar] [CrossRef]
  4. Fang, C. Chinas Urban Agglomeration and Metropolitan Area Construction under the New Development Pattern. Econ. Geogr. 2021, 41, 1–7. [Google Scholar]
  5. Chen, J.; Wang, S.S.; Zou, Y.T. Construction of an ecological security pattern based on ecosystem sensitivity and the importance of ecological services: A case study of the Guanzhong Plain urban agglomeration, China. Ecol. Indic. 2022, 136, 108688. [Google Scholar] [CrossRef]
  6. Lan, X.; Tang, H.P.; Liang, H.G. A theoretical framework for researching cultural ecosystem service flows in urban agglomerations. Ecosyst. Serv. 2017, 28, 95–104. [Google Scholar] [CrossRef]
  7. Shao, M.; Wu, L.F.; Li, F.Z.; Lin, C.S. Spatiotemporal Dynamics of Ecosystem Services and the Driving Factors in Urban Agglomerations: Evidence from 12 National Urban Agglomerations in China. Front. Ecol. Evol. 2022, 10, 804969. [Google Scholar] [CrossRef]
  8. Ouyang, X.; Tang, L.S.; Wei, X.; Li, Y.H. Spatial interaction between urbanization and ecosystem services in Chinese urban agglomerations. Land Use Pol. 2021, 109, 105587. [Google Scholar] [CrossRef]
  9. Li, S.N.; He, Y.Y.; Xu, H.L.; Zhu, C.M.; Dong, B.Y.; Lin, Y.; Si, B.; Deng, J.S.; Wang, K. Impacts of Urban Expansion Forms on Ecosystem Services in Urban Agglomerations: A Case Study of Shanghai-Hangzhou Bay Urban Agglomeration. Remote Sens. 2021, 13, 1908. [Google Scholar] [CrossRef]
  10. Guo, B.; Wang, X.X.; Pei, L.; Su, Y.; Zhang, D.M.; Wang, Y. Identifying the spatiotemporal dynamic of PM2.5 concentrations at multiple scales using geographically and temporally weighted regression model across China during 2015–2018. Sci. Total Environ. 2021, 751, 141765. [Google Scholar] [CrossRef]
  11. Yang, Y.; Yang, H.; Cheng, Y. Why is it crucial to evaluate the fairness of natural capital consumption in urban agglomerations in terms of ecosystem services and economic contribution? Sust. Cities Soc. 2021, 65, 102644. [Google Scholar] [CrossRef]
  12. Dong, L.Y.; Shang, J.; Ali, R.; Rehman, R.U. The Coupling Coordinated Relationship Between New-type Urbanization, Eco-Environment and its Driving Mechanism: A Case of Guanzhong, China. Front. Environ. Sci. 2021, 9, 638891. [Google Scholar] [CrossRef]
  13. Peng, L.X.; Zhang, L.W.; Li, X.P.; Wang, Z.Z.; Wang, H.; Jiao, L. Spatial expansion effects on urban ecosystem services supply-demand mismatching in Guanzhong Plain Urban Agglomeration of China. J. Geogr. Sci. 2022, 32, 806–828. [Google Scholar] [CrossRef]
  14. Foley, J.A.; De Fries, R.; Asner, G.P.; Barford, C.; Bonan, G.; Carpenter, S.R.; Chapin, F.S.; Coe, M.T.; Daily, G.C.; Gibbs, H.K.; et al. Global consequences of land use. Science 2005, 309, 570–574. [Google Scholar] [CrossRef] [PubMed] [Green Version]
  15. Lugeri, F.R.; Farabollini, P. Discovering the Landscape by Cycling: A Geo-Touristic Experience through Italian Badlands. Geosciences 2018, 8, 291. [Google Scholar] [CrossRef] [Green Version]
  16. Ruban, D.A. Quantification of geodiversity and its loss. Proc. Geol. Assoc. 2010, 121, 326–333. [Google Scholar] [CrossRef]
  17. Brilha, J. Geoconservation and protected areas. Environ. Conserv. 2002, 29, 273–276. [Google Scholar] [CrossRef] [Green Version]
  18. Monkkonen, P.; Comandon, A.; Escamilla, J.A.M.; Guerra, E. Urban sprawl and the growing geographic scale of segregation in Mexico, 1990–2010. Habitat Int. 2018, 73, 89–95. [Google Scholar] [CrossRef] [Green Version]
  19. Kong, X.S.; Fu, M.X.; Zhao, X.; Wang, J.; Jiang, P. Ecological effects of land-use change on two sides of the Hu Huanyong Line in China. Land Use Pol. 2022, 113, 105895. [Google Scholar] [CrossRef]
  20. Zhou, D.Y.; Tian, Y.Y.; Jiang, G.H. Spatio-temporal investigation of the interactive relationship between urbanization and ecosystem services: Case study of the Jingjinji urban agglomeration, China. Ecol. Indic. 2018, 95, 152–164. [Google Scholar] [CrossRef]
  21. Cai, A.L.; Wang, J.; MacLachlan, I.; Zhu, L.K. Modeling the trade-offs between urban development and ecological process based on landscape multi-functionality and regional ecological networks. J. Environ. Plan. Manag. 2020, 63, 2357–2379. [Google Scholar] [CrossRef]
  22. Song, W.; Deng, X.Z. Land-use/land-cover change and ecosystem service provision in China. Sci. Total Environ. 2017, 576, 705–719. [Google Scholar] [CrossRef] [PubMed]
  23. Hao, F.H.; Lai, X.H.; Ouyang, W.; Xu, Y.M.; Wei, X.F.; Song, K.Y. Effects of Land Use Changes on the Ecosystem Service Values of a Reclamation Farm in Northeast China. Environ. Manag. 2012, 50, 888–899. [Google Scholar] [CrossRef] [PubMed]
  24. Lambin, E.F.; Turner, B.L.; Geist, H.J.; Agbola, S.B.; Angelsen, A.; Bruce, J.W.; Coomes, O.T.; Dirzo, R.; Fischer, G.; Folke, C.; et al. The causes of land-use and land-cover change: Moving beyond the myths. Glob. Environ. Chang.-Hum. Policy Dimens. 2001, 11, 261–269. [Google Scholar] [CrossRef]
  25. Li, X.M.; Wang, Y.; Song, Y. Unraveling land system vulnerability to rapid urbanization: An indicator-based vulnerability assessment for Wuhan, China. Environ. Res. 2022, 211, 112981. [Google Scholar] [CrossRef]
  26. Jing, L.; Zhiyuan, R. Variations in Ecosystem Service Value in Response to Land use Changes in the Loess Plateau in Northern Shaanxi Province, China. Int. J. Environ. Res. 2011, 5, 109–118. [Google Scholar]
  27. Kindu, M.; Schneider, T.; Teketay, D.; Knoke, T. Changes of ecosystem service values in response to land use/land cover dynamics in Munessa-Shashemene landscape of the Ethiopian highlands. Sci. Total Environ. 2016, 547, 137–147. [Google Scholar] [CrossRef]
  28. Liu, S.A.; Costanza, R.; Troy, A.; D’Aagostino, J.; Mates, W. Valuing New Jersey’s Ecosystem Services and Natural Capital: A Spatially Explicit Benefit Transfer Approach. Environ. Manag. 2010, 45, 1271–1285. [Google Scholar] [CrossRef]
  29. Ji, Z.X.; Wei, H.J.; Xue, D.; Liu, M.X.; Cai, E.X.; Chen, W.Q.; Feng, X.W.; Li, J.W.; Lu, J.; Guo, Y.L. Trade-Off and Projecting Effects of Land Use Change on Ecosystem Services under Different Policies Scenarios: A Case Study in Central China. Int. J. Environ. Res. Public Health 2021, 18, 3552. [Google Scholar] [CrossRef]
  30. Long, H.L.; Liu, Y.Q.; Hou, X.G.; Li, T.T.; Li, Y.R. Effects of land use transitions due to rapid urbanization on ecosystem services: Implications for urban planning in the new developing area of China. Habitat Int. 2014, 44, 536–544. [Google Scholar] [CrossRef]
  31. Wu, K.Y.; Ye, X.Y.; Qi, Z.F.; Zhang, H. Impacts of land use/land cover change and socioeconomic development on regional ecosystem services: The case of fast-growing Hangzhou metropolitan area, China. Cities 2013, 31, 276–284. [Google Scholar] [CrossRef]
  32. Cui, Y.; Lan, H.F.; Zhang, X.S.; He, Y. Confirmatory Analysis of the Effect of Socioeconomic Factors on Ecosystem Service Value Variation Based on the Structural Equation Model-A Case Study in Sichuan Province. Land 2022, 11, 483. [Google Scholar] [CrossRef]
  33. Aburas, M.M.; Ahamad, M.S.S.; Omar, N.Q. Spatio-temporal simulation and prediction of land-use change using conventional and machine learning models: A review. Environ. Monit. Assess. 2019, 191, 1–28. [Google Scholar] [CrossRef] [PubMed]
  34. Qiao, Z.; Jiang, Y.Y.; He, T.; Lu, Y.S.; Xv, X.L.; Yang, J. Land use change simulation: Progress, challenges, and prospects. Acta Ecol. Sin. 2022, 42, 1–12. [Google Scholar] [CrossRef]
  35. Fu, Q.; Hou, Y.; Wang, B.; Bi, X.; Li, B.; Zhang, X.S. Scenario analysis of ecosystem service changes and interactions in a mountain-oasis-desert system: A case study in Altay Prefecture, China. Sci. Rep. 2018, 8, 1–13. [Google Scholar] [CrossRef]
  36. Zhao, B.; Li, S.; Liu, Z. Multi-Scenario Simulation and Prediction of Regional Habitat Quality Based on a System Dynamic and Patch-Generating Land-Use Simulation Coupling Model: A Case Study of Jilin Province. Sustainability 2022, 14, 5303. [Google Scholar] [CrossRef]
  37. Shi, M.J.; Wu, H.Q.; Fan, X.; Jia, H.T.; Dong, T.; He, P.X.; Baqa, M.F.; Jiang, P.G. Trade-Offs and Synergies of Multiple Ecosystem Services for Different Land Use Scenarios in the Yili River Valley, China. Sustainability 2021, 13, 1577. [Google Scholar] [CrossRef]
  38. Domingo, D.; Palka, G.; Hersperger, A.M. Effect of Zoning Plans on Urban Land-Use Change: A Multi-Scenario Simulation for Supporting Sustainable Urban Growth. Sust. Cities Soc. 2021, 69, 102833. [Google Scholar] [CrossRef]
  39. Gao, X.; Wang, J.; Li, C.X.; Shen, W.N.; Song, Z.Y.; Nie, C.J.; Zhang, X.R. Land use change simulation and spatial analysis of ecosystem service value in Shijiazhuang under multi-scenarios. Environ. Sci. Pollut. Res. 2021, 28, 31043–31058. [Google Scholar] [CrossRef]
  40. Pan, Z.Z.; He, J.H.; Liu, D.F.; Wang, J.W. Predicting the joint effects of future climate and land use change on ecosystem health in the Middle Reaches of the Yangtze River Economic Belt, China. Appl. Geogr. 2020, 124, 102293. [Google Scholar] [CrossRef]
  41. Peng, K.F.; Jiang, W.G.; Ling, Z.Y.; Hou, P.; Deng, Y.W. Evaluating the potential impacts of land use changes on ecosystem service value under multiple scenarios in support of SDG reporting: A case study of the Wuhan urban agglomeration. J. Clean Prod. 2021, 307, 127321. [Google Scholar] [CrossRef]
  42. Chen, Y.H.; Wang, J.; Xiong, N.N.; Sun, L.; Xu, J.Q. Impacts of Land Use Changes on Net Primary Productivity in Urban Agglomerations under Multi-Scenarios Simulation. Remote Sens. 2022, 14, 1755. [Google Scholar] [CrossRef]
  43. Sun, Q.; Qi, W.; Yu, X.Y. Impacts of land use change on ecosystem services in the intensive agricultural area of North China based on Multi-scenario analysis. Alex. Eng. J. 2021, 60, 1703–1716. [Google Scholar] [CrossRef]
  44. Mitsova, D.; Shuster, W.; Wang, X.H. A cellular automata model of land cover change to integrate urban growth with open space conservation. Landsc. Urban Plan. 2011, 99, 141–153. [Google Scholar] [CrossRef]
  45. Verburg, P.H.; Soepboer, W.; Veldkamp, A.; Limpiada, R.; Espaldon, V.; Mastura, S.S.A. Modeling the spatial dynamics of regional land use: The CLUE-S model. Environ. Manag. 2002, 30, 391–405. [Google Scholar] [CrossRef] [PubMed]
  46. Liu, X.P.; Liang, X.; Li, X.; Xu, X.C.; Ou, J.P.; Chen, Y.M.; Li, S.Y.; Wang, S.J.; Pei, F.S. A future land use simulation model (FLUS) for simulating multiple land use scenarios by coupling human and natural effects. Landsc. Urban Plan. 2017, 168, 94–116. [Google Scholar] [CrossRef]
  47. Liang, X.; Guan, Q.F.; Clarke, K.C.; Liu, S.S.; Wang, B.Y.; Yao, Y. Understanding the drivers of sustainable land expansion using a patch-generating land use simulation (PLUS) model: A case study in Wuhan, China. Comput. Environ. Urban Syst. 2021, 85, 101569. [Google Scholar] [CrossRef]
  48. Zhang, S.; Yang, P.; Xia, J.; Wang, W.; Cai, W.; Chen, N.; Hu, S.; Luo, X.; Li, J.; Zhan, C. Land use/land cover prediction and analysis of the middle reaches of the Yangtze River under different scenarios. Sci. Total Environ. 2022, 833, 155238. [Google Scholar] [CrossRef]
  49. Li, C.D.; Yang, M.Y.; Li, Z.B.; Wang, B.Q. How Will Rwandan Land Use/Land Cover Change under High Population Pressure and Changing Climate? Appl. Sci. 2021, 11, 5376. [Google Scholar] [CrossRef]
  50. Li, C.; Wu, Y.M.; Gao, B.P.; Zheng, K.J.; Wu, Y.; Li, C. Multi-scenario simulation of ecosystem service value for optimization of land use in the Sichuan-Yunnan ecological barrier, China. Ecol. Indic. 2021, 132, 108328. [Google Scholar] [CrossRef]
  51. Hu, Y.Y.; He, Y.; Li, Y.L. Urban Spatial Development Based on Multisource Data Analysis: A Case Study of Xianyang City’s Integration into Xi’an International Metropolis. Sustainability 2022, 14, 4090. [Google Scholar] [CrossRef]
  52. Xie, G.D.; Zhang, C.X.; Zhang, L.M.; Chen, W.H.; Li, S.M. Improvement of the Evaluation Method for Ecosystem Service Value Based on Per Unit Area. J. Nat. Resour. 2015, 8, 1243–1254. [Google Scholar]
  53. Robertson, G.P.; Swinton, S.M. Reconciling agricultural productivity and environmental integrity: A grand challenge for agriculture. Front. Ecol. Environ. 2005, 3, 38–46. [Google Scholar] [CrossRef]
  54. Zhang, B.A.; Li, W.H.; Xie, G.D. Ecosystem services research in China: Progress and perspective. Ecol. Econ. 2010, 69, 1389–1395. [Google Scholar] [CrossRef]
  55. Costanza, R.; de Groot, R.; Sutton, P.; van der Ploeg, S.; Anderson, S.J.; Kubiszewski, I.; Farber, S.; Turner, R.K. Changes in the global value of ecosystem services. Glob. Environ. Chang.-Hum. Policy Dimens. 2014, 26, 152–158. [Google Scholar] [CrossRef]
  56. Xie, G.D.; Lu, C.X.; Leng, Y.F.; Zheng, D.U.; Li, S.C. Ecological assets valuation of the Tibetan Plateau. J. Nat. Resour. 2003, 18, 189–196. [Google Scholar]
  57. Akhtar, M.; Zhao, Y.Y.; Gao, G.L.; Gulzar, Q.; Hussain, A. Assessment of spatiotemporal variations of ecosystem service values and hotspots in a dryland: A case-study in Pakistan. Land Degrad. Dev. 2022, 33, 1383–1397. [Google Scholar] [CrossRef]
  58. Liu, Z.Y.; Gan, X.Y.; Dai, W.N.; Huang, Y. Construction of an Ecological Security Pattern and the Evaluation of Corridor Priority Based on ESV and the “Importance-Connectivity” Index: A Case Study of Sichuan Province, China. Sustainability 2022, 14, 3985. [Google Scholar] [CrossRef]
  59. Yang, N.; Mo, W.B.; Li, M.H.; Zhang, X.; Chen, M.; Li, F.; Gao, W.C. A Study on the Spatio-Temporal Land-Use Changes and Ecological Response of the Dongting Lake Catchment. ISPRS Int. J. Geo-Inf. 2021, 10, 716. [Google Scholar] [CrossRef]
  60. Ling, H.B.; Yan, J.J.; Xu, H.L.; Guo, B.; Zhang, Q.Q. Estimates of shifts in ecosystem service values due to changes in key factors in the Manas River basin, northwest China. Sci. Total Environ. 2019, 659, 177–187. [Google Scholar] [CrossRef]
  61. Peng, H.J.; Hua, L.; Zhang, X.S.; Yuan, X.Y.; Li, J.H. Evaluation of ESV Change under Urban Expansion Based on Ecological Sensitivity: A Case Study of Three Gorges Reservoir Area in China. Sustainability 2021, 13, 8490. [Google Scholar] [CrossRef]
  62. Zhang, X.Y.; Zhang, X.; Li, D.H.; Lu, L.; Yu, H. Multi-Scenario Simulation of the Impact of Urban Land Use Change on Ecosystem Service Value in Shenzhen. Acta Ecol. Sin. 2022, 42, 2086–2097. [Google Scholar]
  63. Jing, Y.D.; Chang, Y.Q.; Cheng, X.Y.; Wang, D. Land-use changes and ecosystem services under different scenarios in Nansi Lake Basin, China. Environ. Monit. Assess. 2021, 193, 14. [Google Scholar] [CrossRef] [PubMed]
  64. Zhang, S.H.; Zhong, Q.L.; Cheng, D.L.; Xu, C.B.; Chang, Y.N.; Lin, Y.Y.; Li, B.Y. Landscape ecological risk projection based on the PLUS model under the localized shared socioeconomic pathways in the Fujian Delta region. Ecol. Indic. 2022, 136, 108642. [Google Scholar] [CrossRef]
  65. Wang, J.; Zhang, J.P.; Xiong, N.N.; Liang, B.Y.; Wang, Z.; Cressey, E.L. Spatial and Temporal Variation, Simulation and Prediction of Land Use in Ecological Conservation Area of Western Beijing. Remote Sens. 2022, 14, 1452. [Google Scholar] [CrossRef]
  66. Yang, C.; Wei, T.X.; Li, Y.R. Simulation and Spatio-Temporal Variation Characteristics of LULC in the Context of Urbanization Construction and Ecological Restoration in the Yellow River Basin. Sustainability 2022, 14, 789. [Google Scholar] [CrossRef]
  67. Zhang, C.C.; Wang, P.; Xiong, P.S.; Li, C.H.; Quan, B. Spatial Pattern Simulation of Land Use Based on FLUS Model under Ecological Protection: A Case Study of Hengyang City. Sustainability 2021, 13, 10458. [Google Scholar] [CrossRef]
  68. Xie, G.D.; Xiao, Y.; Zhen, L.; Lu, C. Study on ecosystem services value of food production in China. Chin. J. Eco-Agric. 2005, 13, 10–13. [Google Scholar]
  69. Li, X.; Zhu, Y.; Zhao, L.; Tian, J.; Li, J. Ecosystem services value change in Qinglong County from dynamically adjusted value coefficients. Chin. J. Eco-Agric. 2015, 23, 373–381. [Google Scholar]
  70. Li, L.M.; Tang, H.N.; Lei, J.R.; Song, X.Q. Spatial autocorrelation in land use type and ecosystem service value in Hainan Tropical Rain Forest National Park. Ecol. Indic. 2022, 137, 108727. [Google Scholar] [CrossRef]
  71. Martin, D. An assessment of surface and zonal models of population. Int. J. Geogr. Inf. Syst. 1996, 10, 973–989. [Google Scholar] [CrossRef]
  72. Li, C.; Gao, B.; Wu, Y.; Zheng, K.; Wu, Y. Dynamic Simulation of Landscape Ecological Risk in Mountain Towns Based on Plus Model. J. Zhejiang AF Univer. 2022, 39, 84–94. [Google Scholar] [CrossRef] [PubMed]
  73. Li, J.Y.; Gong, J.; Guldmann, J.M.; Yang, J.X.; Zhang, Z. Simulation of Land-Use Spatiotemporal Changes under Ecological Quality Constraints: The Case of the Wuhan Urban Agglomeration Area, China, over 2020-2030. Int. J. Environ. Res. Public Health 2022, 19, 6095. [Google Scholar] [CrossRef] [PubMed]
  74. Landis, J.R.; Koch, G.G. Measurement of Observer Agreement for Categorical Data. Biometrics 1977, 33, 159–174. [Google Scholar] [CrossRef] [Green Version]
  75. Xu, L.F.; Liu, X.; Tong, D.; Liu, Z.X.; Yin, L.R.; Zheng, W.F. Forecasting Urban Land Use Change Based on Cellular Automata and the PLUS Model. Land 2022, 11, 652. [Google Scholar] [CrossRef]
  76. Guo, R.; Wu, T.; Wu, X.C.; Luigi, S.; Wang, Y.Q. Simulation of Urban Land Expansion Under Ecological Constraints in Harbin-Changchun Urban Agglomeration, China. Chin. Geogr. Sci. 2022, 32, 438–455. [Google Scholar] [CrossRef]
  77. Li, C.X.; Wu, J.Y. Land Use Transformation and Eco-Environmental Effects Based on Production-Living-Ecological Spatial Synergy: Evidence from Shaanxi Province, China. Environ. Sci. Pollut. Res. 2022, 29, 41492–41504. [Google Scholar] [CrossRef]
  78. Sun, S.; Zhang, X. Analysis on the Spatiotemporal Evolution of Land Use Transformation and Its Ecological Environment Effect in Shaanxi Province. Res. Soil Water Cons. 2021, 28, 356. [Google Scholar]
  79. Zhang, Y.; Li, Y. Ecosystem Service Value(Esv)and Spatial-Temporal Difference of Urban Agglomeration in Guanzhong Plain from 1995 to 2015. J. Zhejiang Univ. Sci. Edit. 2020, 47, 615. [Google Scholar]
  80. Wu, C.Y.; Chen, B.W.; Huang, X.J.; Wei, Y.H.D. Effect of land-use change and optimization on the ecosystem service values of Jiangsu province, China. Ecol. Indic. 2020, 117, 14. [Google Scholar] [CrossRef]
  81. Kubiszewski, I.; Muthee, K.; Rasheed, A.R.; Costanza, R.; Suzuki, M.; Noel, S.; Schauer, M. The costs of increasing precision for ecosystem services valuation studies. Ecol. Indic. 2022, 135, 108551. [Google Scholar] [CrossRef]
  82. Ma, X.F.; Zhu, J.T.; Zhang, H.B.; Yan, W.; Zhao, C.Y. Trade-offs and synergies in ecosystem service values of inland lake wetlands in Central Asia under land use/cover change: A case study on Ebinur Lake, China. Glob. Ecol. Conserv. 2020, 24, e01253. [Google Scholar] [CrossRef]
  83. Cui, X.; Liu, C.; Shan, L.; Lin, J.; Zhang, J.; Jiang, Y.; Zhang, G. Spatial-Temporal Responses of Ecosystem Services to Land Use Transformation Driven by Rapid Urbanization: A Case Study of Hubei Province, China. Int. J. Environ. Res. Public Health 2021, 19, 178. [Google Scholar] [CrossRef] [PubMed]
  84. Zheng, D.F.; Wan, J.Y.; Bai, L.N.; lv, L.T. Multi-Scale Analysis of Ecosystem Service Trade-Offs/Synergies in Yanshan-Taihang Mountains Area. J. Ecol. Rural Environ. 2022, 38, 409–417. [Google Scholar]
  85. Yang, Q.; Xu, G.; Li, A.; Liu, Y.; Hu, C. Evaluation and Trade-Off of Ecosystem Services in the Qingyijiang River Basin. Acta Ecol. Sin. 2021, 41, 9315–9327. [Google Scholar]
  86. Zhang, J.; Qu, M.; Wang, C.; Zhao, J.; Cao, Y. Quantifying landscape pattern and ecosystem service value changes: A case study at the county level in the Chinese Loess Plateau. Glob. Ecol. Conserv. 2020, 23, e01110. [Google Scholar] [CrossRef]
  87. Le Blanc, D. Towards Integration at Last? The Sustainable Development Goals as a Network of Targets. Sustain. Dev. 2015, 23, 176–187. [Google Scholar] [CrossRef]
  88. Eisenmenger, N.; Pichler, M.; Krenmayr, N.; Noll, D.; Plank, B.; Schalmann, E.; Wandl, M.T.; Gingrich, S. The Sustainable Development Goals prioritize economic growth over sustainable resource use: A critical reflection on the SDGs from a socio-ecological perspective. Sustain. Sci. 2020, 15, 1101–1110. [Google Scholar] [CrossRef]
  89. Han, R.; Feng, C.C.E.; Xu, N.Y.; Guo, L. Spatial heterogeneous relationship between ecosystem services and human disturbances: A case study in Chuandong, China. Sci. Total Environ. 2020, 721, 137818. [Google Scholar] [CrossRef]
  90. Holden, M.; Roseland, M.; Ferguson, K.; Perl, A. Seeking urban sustainability on the world stage. Habitat Int. 2008, 32, 305–317. [Google Scholar] [CrossRef]
  91. Jabareen, Y.R. Sustainable urban forms-Their typologies, models, and concepts. J. Plan. Educ. Res. 2006, 26, 38–52. [Google Scholar] [CrossRef]
  92. Caragliu, A.; Del Bo, C.; Nijkamp, P. Smart Cities in Europe. J. Urban Technol. 2011, 18, 65–82. [Google Scholar] [CrossRef]
  93. Mora, L.; Bolici, R.; Deakin, M. The First Two Decades of Smart-City Research: A Bibliometric Analysis. J. Urban Technol. 2017, 24, 3–27. [Google Scholar] [CrossRef]
  94. Bibri, S.E.; Krogstie, J. Smart sustainable cities of the future: An extensive interdisciplinary literature review. Sust. Cities Soc. 2017, 31, 183–212. [Google Scholar] [CrossRef]
  95. Huang, C.; Sun, Z.; Jiang, H.; Wang, J.; Wang, P.; Tao, J.; Liu, H.; Liu, N. Big Earth Data Supports Sustainable Cities and Communities: Progress and Challenges. Bull. Chin. Acad. Sci. 2021, 36, 914–922. [Google Scholar]
Figure 1. Location map of Guanzhong Plain Urban Agglomeration, China.
Sustainability 14 08812 g001
Figure 2. Driving factors of land use simulation in Guanzhong Plain Urban Agglomeration. (a) Digital elevation model (DEM), (b) slope, (c) GDP, (d) population density, (e) temperature, (f) precipitation, (g) nighttime light, (h) distance to urban and rural settlements, (i) distance to river, (j) distance to city main road, (k) distance to built-up area, (l) distance to county road, (m) distance to railway, (n) distance to provincial road, (o) distance to state road and (p) distance to highway.
Sustainability 14 08812 g002
Figure 3. Restricted and developable area of Guanzhong Plain Urban Agglomeration.
Sustainability 14 08812 g003
Figure 4. Land use types in Guanzhong Plain Urban Agglomeration in 2000, 2010, and 2020.
Sustainability 14 08812 g004
Figure 5. Land use area in Guanzhong Plain Urban Agglomeration in 2000, 2010, and 2020.
Sustainability 14 08812 g005
Figure 6. Development potentials of six land use types.
Sustainability 14 08812 g006
Figure 7. Land use simulation results under three scenarios.
Sustainability 14 08812 g007
Figure 8. Spatial and temporal ESV variations of Guanzhong Plain Urban Agglomeration.
Sustainability 14 08812 g008
Figure 9. LISA map of three scenarios in Guanzhong Plain Urban Agglomeration.
Sustainability 14 08812 g009
Figure 10. Correlation analysis of ESVs between each ecosystem service in Guanzhong Plain Urban Agglomeration (where FP, RM, GR, CR, WT, WFR, SFM, BP, and RC indicate the food production, raw material, gas regulation, climate regulation, waste treatment, water flow regulation, soil fertility maintenance, biodiversity protection, and recreation and culture, respectively).
Sustainability 14 08812 g010
Table 1. Source of Datasets.
Data TypeData SourceWebsiteSpatial Resolution
SlopeCalculated with DEM from ArcGIS/30 m
GDP gridRESDhttps://www.resdc.cn/, accessed on 15 April 20221000 m
Annual average precipitation
Annual average temperature
RailwayAPI interface of AMaphttps://lbs.amap.com/, accessed on 15 April 2022Vector
State road
Highway
Provincial road
City main road
County road
Urban and rural settlementNCSGIhttps://www.webmap.cn/, accessed on 15 April 2022Vector
Built-up area
River
Population
density
WorldPophttp://www.worldpop.org, accessed on 15 April 2022100 m
NPP-VIIRS nighttime light imageEarth Observation Grouphttps://eogdata.mines.edu/products/vnl, accessed on 15 April 2022500 m
Table 2. ESV per unit area for different LULC types in the Guanzhong Plain Urban Agglomeration (CNY/hm2).
Primary ClassificationSecondary ClassificationFarmlandWoodlandGrasslandWaterConstruction LandOther Land
Provisioning servicesFood production1057.68105.77317.30105.7710.5810.58
Raw material105.772749.9752.8810.580.000.00
Regulating servicesGas regulation528.843701.88846.140.000.000.00
Climate regulation941.342855.74951.91486.530.000.00
Waste treatment1734.601385.561385.5619,228.62−2601.8910.58
Water flow regulation634.613384.58846.1421,555.52−7943.1831.73
Supporting servicesSoil fertility maintenance1544.214124.952062.4810.5821.1521.15
Biodiversity protection750.953448.041152.872633.62359.61359.61
Cultural servicesRecreation and culture10.581353.8342.314590.3310.5810.58
Table 3. Transfer matrices of land use type during 2000–2020 (km2).
PeriodLand Use TypesFarmlandWoodlandGrasslandWaterConstruction LandOther LandTransfer Out
2000~2010Farmland48,256.30187.27615.12109.07459.146.491377.09
Woodland51.0522,921.0569.726.4017.481.56146.22
Grassland256.46129.3228,361.0620.4621.081.56428.88
Water108.157.7818.861113.462.581.47138.84
Construction land13.511.173.680.554383.120.0418.95
Other land8.294.1710.660.040.62136.6723.79
Transfer In437.46329.72718.04136.52500.9111.13-
2010~2020Farmland45,482.36260.651305.63122.511508.6313.463210.89
Woodland144.1122,738.86315.518.3334.067.89509.89
Grassland889.81325.1427,748.1526.0473.4115.361329.75
Water67.103.7531.071117.2728.492.09132.50
Construction land326.028.5915.256.194527.640.33356.38
Other land2.880.790.0015.983.84120.7623.49
Transfer In1429.91598.921667.46179.051648.4339.14-
Table 4. Conversion cost matrix for simulating different land use scenarios.
Different ScenariosFarmlandWoodlandGrasslandWaterConstruction LandOther Land
BAU scenarioFarmland111111
Woodland111111
Grassland111111
Water111111
Construction land000010
Other land111111
ED scenarioFarmland100010
Woodland111111
Grassland111111
Water111111
Construction land000010
Other land111111
EC scenarioFarmland111111
Woodland010000
Grassland011100
Water011100
Construction land011110
Other land111111
Table 5. Neighborhood weight for simulating different land use scenarios.
Different ScenariosFarmlandWoodlandGrasslandWaterConstruction LandOther Land
BAU scenario0.70.50.20.50.90.1
ED scenario0.70.50.20.510.1
EC scenario0.510.20.50.80.1
Table 6. Simulated areas of three scenarios in Guanzhong Plain Urban Agglomeration (km2).
ScenariosFarmlandWoodlandGrasslandWaterConstruction LandOther Land
BAU scenario45,333.5823,381.5229,670.141333.237320.40169.62
ED scenario47,050.4122,849.7827,898.481156.538121.29132.01
EC scenario45,233.1723,694.2132,243.731311.027257.18169.18
Table 7. ESVs of different land use types in Guanzhong Plain Urban Agglomeration from 2000 to 2030.
ESV/
CNY 100 million
Year/ScenarioFarmlandWoodlandGrasslandWaterConstruction LandOther LandTotal
Changing rate/%2000362.46532.53220.1260.87−44.630.071131.42
2010355.60536.77222.3360.75−49.520.061125.99
2020342.61538.80224.9363.01−62.620.071106.80
2030 BAU331.32540.35227.2064.82−74.250.081089.52
2030 ED343.87528.07213.6456.23−82.380.061059.49
2030 EC330.59547.58246.9163.74−73.610.081115.29
2000–2010−1.890.801.00−0.20−10.96−14.29−0.48
2010–2020−3.650.381.173.72−26.4516.67−1.70
2000–2020−5.481.182.193.52−40.310.00−2.18
2020-BAU−3.300.291.012.87−18.5714.29−1.56
2020-ED1.26−10.73−11.29−6.78−19.76−0.01−47.31
2020-EC−12.028.7821.980.73−10.990.018.49
Table 8. ESVs of different ecosystem services in Guanzhong Plain Urban Agglomeration from 2000 to 2030 (CNY 100 million).
Ecosystem Service Type200020102020BAUVariationEDVariationECVariation
Food production64.1963.3261.5760.06−1.5161.24−0.3360.80−0.77
Raw material70.1570.5770.6470.680.0469.30−1.3471.661.02
Gas regulation135.85136.28135.95135.63−0.32133.08−2.87138.922.97
Climate regulation140.46140.37139.30138.34−0.96136.66−2.64141.582.28
Waste treatment170.41168.13163.17158.73−4.44153.04−10.13162.30−0.87
Water flow regulation125.82122.21112.41103.61−8.8091.23−21.18106.80−5.61
Soil fertility maintenance231.03230.94229.29227.82−1.47224.64−4.65234.264.97
Biodiversity protection154.77155.19155.14155.07−0.07152.30−2.84158.963.82
Recreation and culture38.7338.9839.3239.590.2738.01−1.3140.020.70
Table 9. Global Moran’s I statistics.
YearMoran’s IZ-scorep-Value
20000.697983.96320.0000
20100.704984.80100.0000
20200.705784.88830.0000
2030BAU0.708785.25700.0000
2030ED0.575569.23420.0000
2030EC0.712285.67170.0000
Publisher’s Note: MDPI stays neutral with regard to jurisdictional claims in published maps and institutional affiliations.

